 Caibiao Wei1†
 Qiumei Lin
 Min Fang
- 1Department of Clinical Laboratory, Guangxi Medical University Cancer Hospital, Nanning, Guangxi, China
- 2Department of Breast, Guangxi Zhuang Autonomous Region Maternal and Child Health Care Hospital, Nanning, China
- 3Guangxi Clinical Research Center for Anesthesiology, Guangxi Medical University Cancer Hospital, Nanning, Guangxi, China
Background: Breast cancer (BC) is the most common and prominent deadly disease among women. Predicting BC survival mainly relies on TNM staging, molecular profiling and imaging, hampered by subjectivity and expenses. This study aimed to establish an economical and reliable model using the most common preoperative routine blood tests (RT) data for survival and surveillance strategy management.
Methods: We examined 2863 BC patients, dividing them into training and validation cohorts (7:3). We collected demographic features, pathomics characteristics and preoperative 24-item RT data. BC risk factors were identified through Cox regression, and a predictive nomogram was established. Its performance was assessed using C-index, area under curves (AUC), calibration curve and decision curve analysis. Kaplan-Meier curves stratified patients into different risk groups. We further compared the STAR model (utilizing HE and RT methodologies) with alternative nomograms grounded in molecular profiling (employing second-generation short-read sequencing methodologies) and imaging (utilizing PET-CT methodologies).
Results: The STAR nomogram, incorporating subtype, TNM stage, age and preoperative RT data (LYM, LYM%, EOSO%, RDW-SD, P-LCR), achieved a C-index of 0.828 in the training cohort and impressive AUCs (0.847, 0.823 and 0.780) for 3-, 5- and 7-year OS rates, outperforming other nomograms. The validation cohort showed similar impressive results. The nomogram calculates a patient’s total score by assigning values to each risk factor, higher scores indicating a poor prognosis. STAR promises potential cost savings by enabling less intensive surveillance in around 90% of BC patients. Compared to nomograms based on molecular profiling and imaging, STAR presents a more cost-effective, with potential savings of approximately $700-800 per breast cancer patient.
Conclusion: Combining appropriate RT parameters, STAR nomogram could help in the detection of patient anemia, coagulation function, inflammation and immune status. Practical implementation of the STAR nomogram in a clinical setting is feasible, and its potential clinical impact lies in its ability to provide an early, economical and reliable tool for survival prediction and surveillance strategy management. However, our model still has limitations and requires external data validation. In subsequent studies, we plan to mitigate the potential impact on model robustness by further updating and adjusting the data and model.
1 Introduction
Breast cancer (BC) stands as the most common malignancy in women, and its incidence continues to rise at an alarming rate (1, 2). This escalating trend highlights the urgent need for improved strategies in both prevention and treatment. A significant challenge in addressing BC lies in its inherent heterogeneity, where patients with the same stage and treatment can exhibit markedly different outcomes (3). Tumor staging, hormone receptor status, HER2 expression, molecular subtypes, and genomic alterations are all potential contributors to the heterogeneity of breast cancer (4). Given this prognostic heterogeneity, it is crucial to enhance prognostic stratification and treatment outcome prediction in order to develop individualized treatment regimens. Precisely determining the prognosis at the time of diagnosis is essential to avoid overtreatment of nonaggressive cases and undertreatment of aggressive forms of the disease (5).
Prognostic models for BC patients have yielded significant achievements, encompassing key factors like pathological features, molecular profiling, and imaging characteristics (6–10). However, these models are not without their limitations. For example, molecular profiling based on gene expression profiles may be influenced by systemic factors such as chronic or transient inflammatory diseases or other non-cancerous diseases (11). The interpretation of imaging models introduces subjectivity due to variations in experience, professional knowledge, and personal bias among physicians. Consequently, different healthcare professionals may yield diverse diagnostic results when analyzing the same set of images (12, 13). Furthermore, the utilization of advanced imaging techniques such as PET-PET/CT and whole-body MRI comes with a substantial cost and potential radiation risks, leading to adverse effects on intensive follow-up programs and causing psychological distress (14). Although these models successfully predict the outcome of patients, the acquisition of these features is invasive and expensive, so these tools are difficult to promote. As a result, the widespread adoption and applicability of these models in routine clinical practice have been hindered. To address these gaps in current breast cancer prognostic models, it is imperative to explore affordable and reliable prognostic factors to improve the precision and feasibility of these models.
The routine blood test (RT) is a straightforward, quick, and the most common examination performed on nearly all cancer patients upon admission; it gives vital information regarding human metabolism, inflammation, and internal environmental factors (15, 16). In addition to the function of assisting in the diagnosis of disease, RT examination is also the most commonly used indicator to observe the treatment effect, medication or withdrawal, continued or stopped treatment, disease recurrence or recovery (17–19). There is new evidence that RT parameters may provide prognostic information for cancer patients. Some hematological markers, such as inflammatory index and red blood cell distribution width, have obvious advantages in predicting prognosis (20–22). Inflammation plays a crucial regulatory role in the development of breast cancer (23), and hematological biomarkers can provide valuable clues about pathophysiological changes (24, 25). Research has shown that a higher lymphocyte proportion is positively correlated with a favorable prognosis (26), whereas a lower percentage of eosinophils (27), higher red blood cell distribution width (28), and higher platelet large cell ratio (29) are associated with a poorer prognosis. Therefore, an in-depth examination of the association between preoperative RT indicators and the prognosis of BC patients offers a good reference for physicians, which has considerable clinical value and practical possibilities.
To address these gaps in current breast cancer prognostic models, our research focuses on exploring the relationship between preoperative blood routine indicators and prognosis in breast cancer patients, and on developing and validating the STAR nomogram as an accurate method for predicting the prognosis of breast cancer patients. Our research, to the best of our knowledge, represents the first systematic effort to develop and rigorously validate a nomogram based on comprehensive preoperative RT indicators for accurately predicting BC patient prognosis. Consequently, a comprehensive investigation into the association between preoperative RT indicators and the prognosis of BC patients was conducted. We simultaneously collected data on 24 pre-treatment RT indicators from a substantial cohort of nearly 3,000 BC-diagnosed patients. Compared to traditional predictive models, the STAR line chart utilizes non-invasive and cost-effective blood tests, providing a simpler and more practical forecasting tool.
2 Materials and methods
2.1 Patients
During the period spanning from July 2013 to December 2021, we meticulously gathered data from a total of 4018 cases of BC patients diagnosed at the tumor hospital of Guangxi Medical University. Our study included 2,863 BC patients who met the inclusion criteria and were selected from this large cohort. However, 1155 cases did not fulfill the specified criteria and were subsequently excluded from the analysis.
The inclusion criteria were: (I) Patients that were confirmed by pathological examination diagnosed with malignant breast cancer; (II) complete clinical and routine blood test information was available for all patients; (III) patients consented to post-operative follow-up visits. The exclusion criteria were: (I) Patients with non-primary breast cancer: We have excluded patients with non-primary breast cancer to maintain the specificity of our study. The prognosis of primary breast cancer may differ from other breast cancer types. Therefore, we focused on patients with primary breast cancer to minimize potential prognostic heterogeneity. (II) Patients with ductal carcinoma in situ (DCIS): DCIS is a precancerous lesion that typically has a favorable prognosis in the early stages. Our prognostic evaluation focuses primarily on breast cancer types with potential for malignancy. (III) Patients with concurrent primary tumors: We excluded patients with additional primary tumors to ensure our study solely encompasses the prognostic evaluation of breast cancer, avoiding interference from other tumor types. (IV) Patients who received any preoperative anti-tumor therapy: We excluded patients who received any preoperative anti-tumor therapy to minimize the influence of treatment on outcomes. Anti-tumor therapy may alter the levels of hematological and inflammatory biomarkers and independently impact prognosis. (V) Patients with acute or chronic inflammatory diseases: We excluded patients with acute or chronic inflammatory diseases to avoid the impact of Blood routine test results, allowing a more accurate assessment of the association between breast cancer prognosis and these markers. (VI) Patients lost to follow-up: We excluded patients lost to follow-up to ensure sufficient data for tracking prognosis outcomes. Loss to follow-up may lead to incomplete data and biased results, which could affect the reliability analysis of the association between Blood routine test results and breast cancer prognosis.
2.2 Ethics approval and consent to participate
Our study was approved by Guangxi Medical University Cancer Hospital Ethical Review Committee (Approve No.LW2023084) and conducted following the ethical principles outlined in the Helsinki Declaration of 1964 and its subsequent amendments or other ethical standards with equivalent requirements. To ensure patient confidentiality, the identities of the individuals included in this study were anonymized using computer-generated ID numbers. On admission, all patients provided written consent for their anonymized medical data to be analyzed and published for research purposes.
2.3 Data collection and classification
Data collection was by two independent investigators, CBW and YHL, with validation by a third investigator, MF. From the patients’ medical records, the demographic characteristics, clinical characteristics, and results of preoperative RT were extracted. The study collected data on various factors, including age, histologic type, grade, subtype, TNM stage, and results of routine laboratory blood test items. The RT data encompassed the following parameters: white blood cell (WBC), red blood cell (RBC), hemoglobin (HGB), platelet (PLT), lymphocyte (LYM), percentage of lymphocyte (LYM%), monocyte (MONO), percentage of monocyte (MONO%), neutrophils (NEU), percentage of neutrophils (NEU%), eosinophils (EOSO), percentage of Eosinophils (EOSO%), basophil (BASO), percentage of basophil (BASO%), hematocrit (HCT), mean corpuscular volume (MCV), mean corpuscular hemoglobin (MCH), mean corpuscular hemoglobin concentration (MCHC), red blood cell distribution width - standard deviation (RDW-SD), red blood cell distribution width - coefficient of variation (RDW-CV), mean platelet volume (MPV), platelet crit (PCT), platelet distribution width (PDW) and platelet-large cell ratio (P-LCR). The TNM staging system used in the study was based on the American Joint Committee on Cancer (AJCC) Version 8 Cancer Staging System (30). The tumor grade classification followed the guidelines of the National Comprehensive Cancer Network (NCCN) 2022 guideline clinical staging system. Utilizing receiver operating characteristic (ROC) curves, the optimal cut-off values for each numerical index were determined.
2.4 Follow-up
Patients in the study were subject to follow-up procedures conducted either via phone or through an outpatient surveillance system. These follow-ups aimed to gather information about the patient’s current condition or, in cases where the patient had already passed away, to obtain the date of death. The primary endpoint of the study was overall survival (OS), which was defined as the duration from the initial diagnosis to the occurrence of death. For patients who survived to the conclusion of the investigation, the date of their final follow-up was regarded as the study’s endpoint. In contrast, the date of mortality was considered the study endpoint for patients who had passed away prior to the conclusion of the study. The most recent follow-up took place in December 2022. To address potential biases or challenges encountered during follow-up, we utilize Complete Case Analysis (CCA) (31).
2.5 Cost-effectiveness analysis
Two authors (CBW and YHL) conducted independent searches in the PubMed and Web of Science databases utilizing the following search terms: (Breast Neoplasm OR Breast Tumor OR Breast Cancer) AND (Nomogram) AND (Prognosis). The literature was systematically reviewed to identify representing BC survival prediction models based on molecular profiling or imaging features. Literature inclusion criteria were established as follows: (I)studies not limiting any breast cancer subtype; (II) investigations exploring the association between BC survival and molecular profiling or imaging features; (III) studies representing BC survival prediction models based on molecular profiling or imaging features; (IV) availability of both a training cohort and a validation cohort with a C-index value; and (V) inclusion of a Chinese cohort. Abstracts and full-texts underwent independent screening by CBW and YHL, with any disagreements resolved through consensus with a third author (MF). Ultimately, the studies by Silei Sui et al. and Xiaojun Xu et al. were selected to represent nomograms based on molecular profiling and imaging features, respectively (32, 33). In our cost analysis, we considered the direct unit costs associated with various nomograms in China. The expenses linked to TNM staging were determined using a hematoxylin-eosin (HE) methodology, while the costs associated with molecular profiling were gathered through second-generation short-read sequencing. In contrast, the expenses related to image profiling were acquired through PET-CT. The comprehensive costs for the STAR nomogram encompassed both HE and routine blood tests. The resource unit costs were extrapolated from the Medical Security Bureau of Guangxi Zhuang Autonomous Region website and underwent rigorous validation by the pathology department, clinical laboratory department, and the imaging center department. The unit costs for each test were obtained from the Department of Clinical Laboratory and the Department of Pathology at Guangxi Medical University Cancer Hospital in 2023, in Chinese Yuan (CNY) (1 CNY=0.14 USD).
2.6 Statistical analysis
The patients in the study were randomly assigned to two groups: a training group consisting of 2007 patients and a validation group consisting of 856 patients (ratio: 7:3). The development of the nomogram was conducted using the training cohort, while the validation cohort was utilized to assess the model’s generalizability (Figure 1).
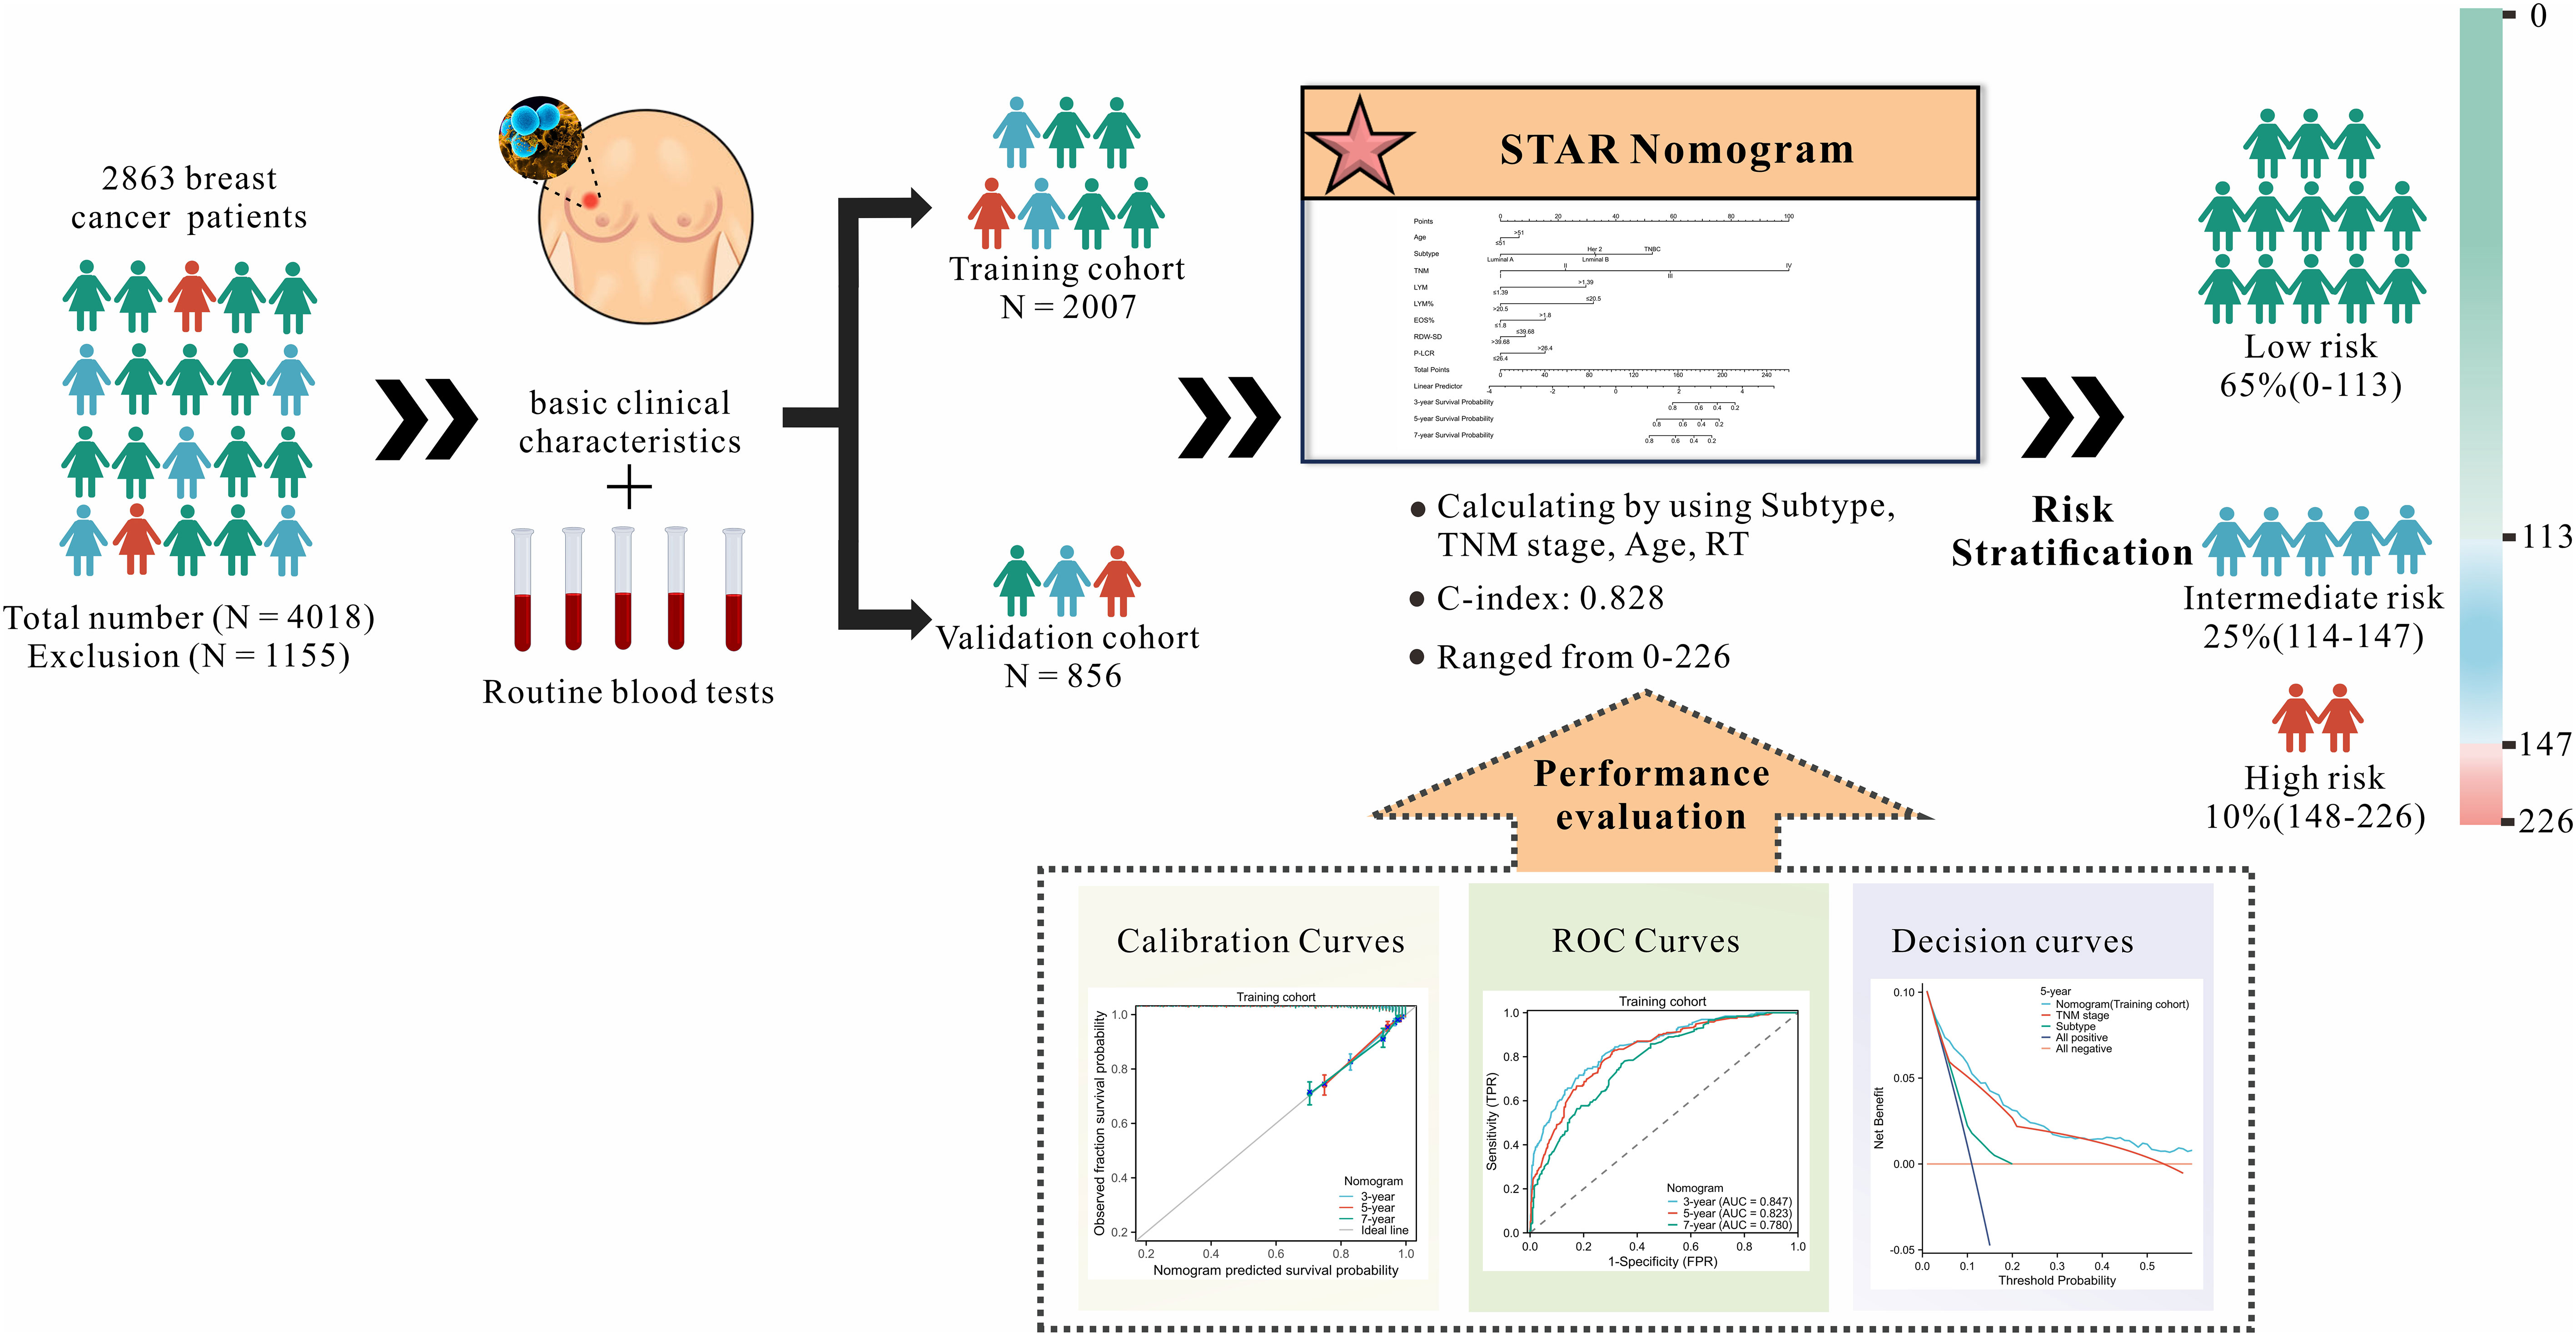
Figure 1 Research flowchart.
Statistical analyses were performed using IBM SPSS Statistical software version 23.0 and R version 4.1.3. Firstly, we performed univariate analysis on age, histologic type, grade, subtype, TNM stage, and results of 24 routine laboratory blood test items. Subsequently, significant variables (p<0.05) identified in the univariate analysis were subjected to multivariate Cox regression analysis. Significant variables with p<0.05 in the multifactorial analysis will be defined as factors with independent prognostic significance. And then using R’s rms package, a prognostic nomogram model was created using the multivariate model’s relevant factors to improve prediction. The BC patients were categorized into low, intermediate, and high-risk groups using the X-tile software. Using the Kaplan-Meier method of survival analysis, survival curves were plotted and compared using the log-rank test. The 3-, 5-, and 7-year OS nomogram was calibrated by comparing predicted survival with observed survival. Evaluate the model using calibration curves. C-index (34) and the time-dependent area under the ROC curves (AUCs) were employed to evaluate the predictive accuracy and discriminatory ability of the nomogram. When the C-index or AUC value approaches 1, it indicates excellent performance of the model. The TNM staging system was compared to the decision curve. Comparing the performance of different models at different thresholds on the same decision curve allows for a visual comparison of their performance differences. This aids in selecting the most appropriate model for decision support. All statistical tests were two-sided, and p<0.05 was considered statistically significant.
3 Results
3.1 Patient characteristics
We gathered data from a total of 4018 cases of BC patients. Specific exclusions(n=1155) are as follows: (I) Non-primary BC patients (n=108); (II) Ductal carcinoma in situ (DCIS) (n=89); (III) Primary tumor combined with other primary tumors (n=74); (IV) The patient had received any anti-tumor therapy preoperatively (n=307); (V) Inflammatory diseases, such as hematological, autoimmune or chronic/acute inflammation (132); (VI) Lost to follow-up (n=445). For the missing values generated during the construction and validation processes, we excluded them from the analysis. Only complete cases were included in our analysis. Finally, 2863 BC patients were selected for our study. 2007 patients from the training cohort and 856 patients from the validation cohort were included in the analyses. Table 1 summarizes the demographic and clinical characteristics of patients. No differences were found between the training and validation cohorts in terms of age, Grade, Subtype, TNM stage, WBC, HGB, PLT, MONO, NEU, NEU%, LYM%, MONO%, EOSO%, EOSO, BASO%, BASO, HCT, MCV, MCH, MCHC, RDW-SD, RDW-CV, MPV, PDW, P-LCR. However, parameters including Histologic type, RBC, LYM and PCT were significantly different between the two cohorts (p = 0.000-0.015).
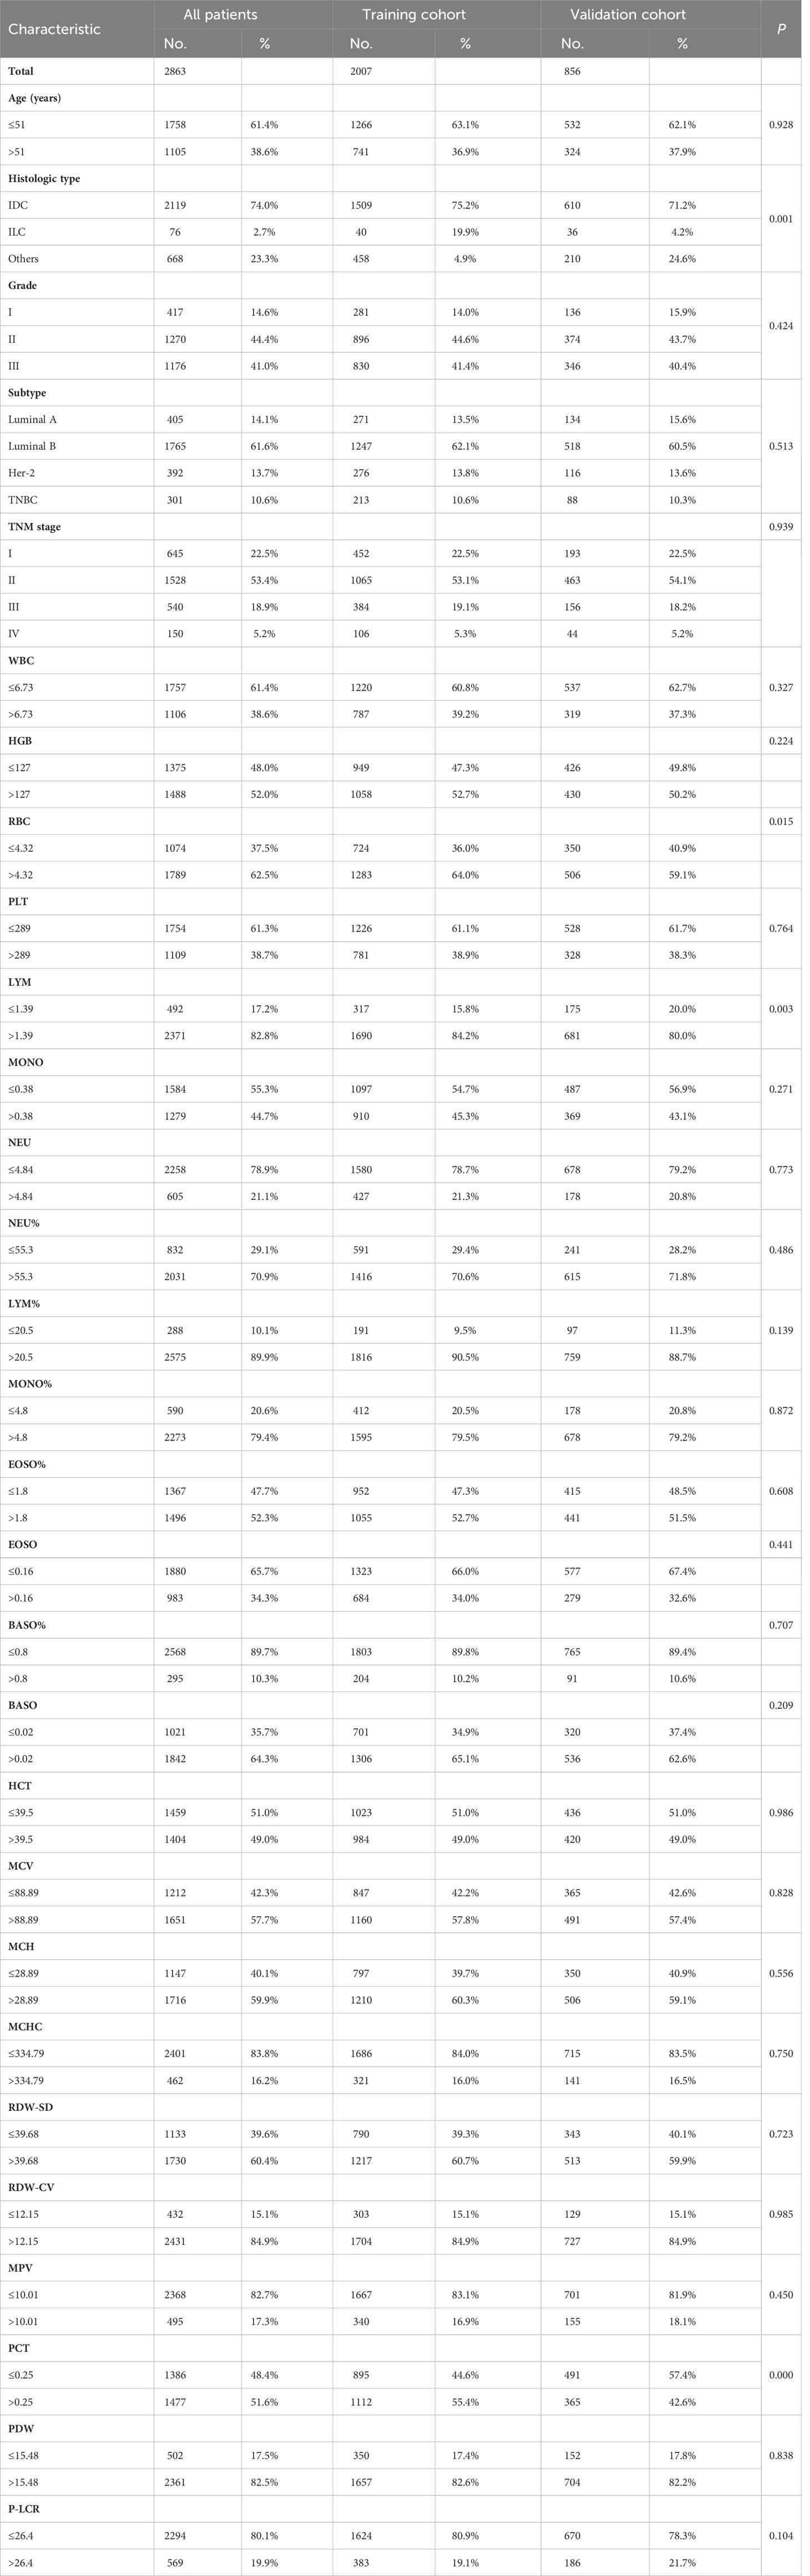
Table 1 Baseline characteristics of the training and validation cohorts.
3.2 Univariate analysis and multivariate analysis
According to the statistical significance threshold of p<0.05, Age (p =0.005), Grade (p = 0.009), Subtype (p < 0.001), TNM stage (p < 0.001), and RT indicators, including WBC (p < 0.001), HGB (p = 0.005), PLT (p = 0.001), LYM (p = 0.032), MONO (p < 0.001), NEU (p < 0.001), NEU% (p = 0.011), LYM % (p < 0.001), MONO% (p = 0.042), EOSO% (p = 0.048), EOSO (p = 0.017), HCT (p = 0.006), MCV (p = 0.019), MCH (p = 0.007), MCHC (p = 0.012), RDW-SD (p = 0.010), PCT (p = 0.006), PDW (p = 0.027), P-LCR (p = 0.04) were associated with OS in BC patients, as determined by univariate analysis. According to the statistical significance threshold of p<0.05, the following factors remained independently prognostic in multivariate analysis for OS with Cox regression: age (p = 0.013, HR = 1.45; 95% CI: 1.08-1.95), Subtype (p < 0.001), TNM stage (p < 0.001), RT indicators LYM (p = 0.001, HR = 2.41; 95% CI: 1.41-4.12), LYM% (p = 0.004, HR = 0.46; 95%CI:0.27-0.79), EOSO% (p = 0.023, HR = 1.61; 95% CI: 1.61-2.42), RDW-SD (p = 0.042, HR = 0.73; 95% CI: 0.53-0.99), and P-LCR (p = 0.001, HR = 1.85; 95% CI: 1.30-2.63). Table 2 shows the comprehensive findings of the univariate and multivariate studies.
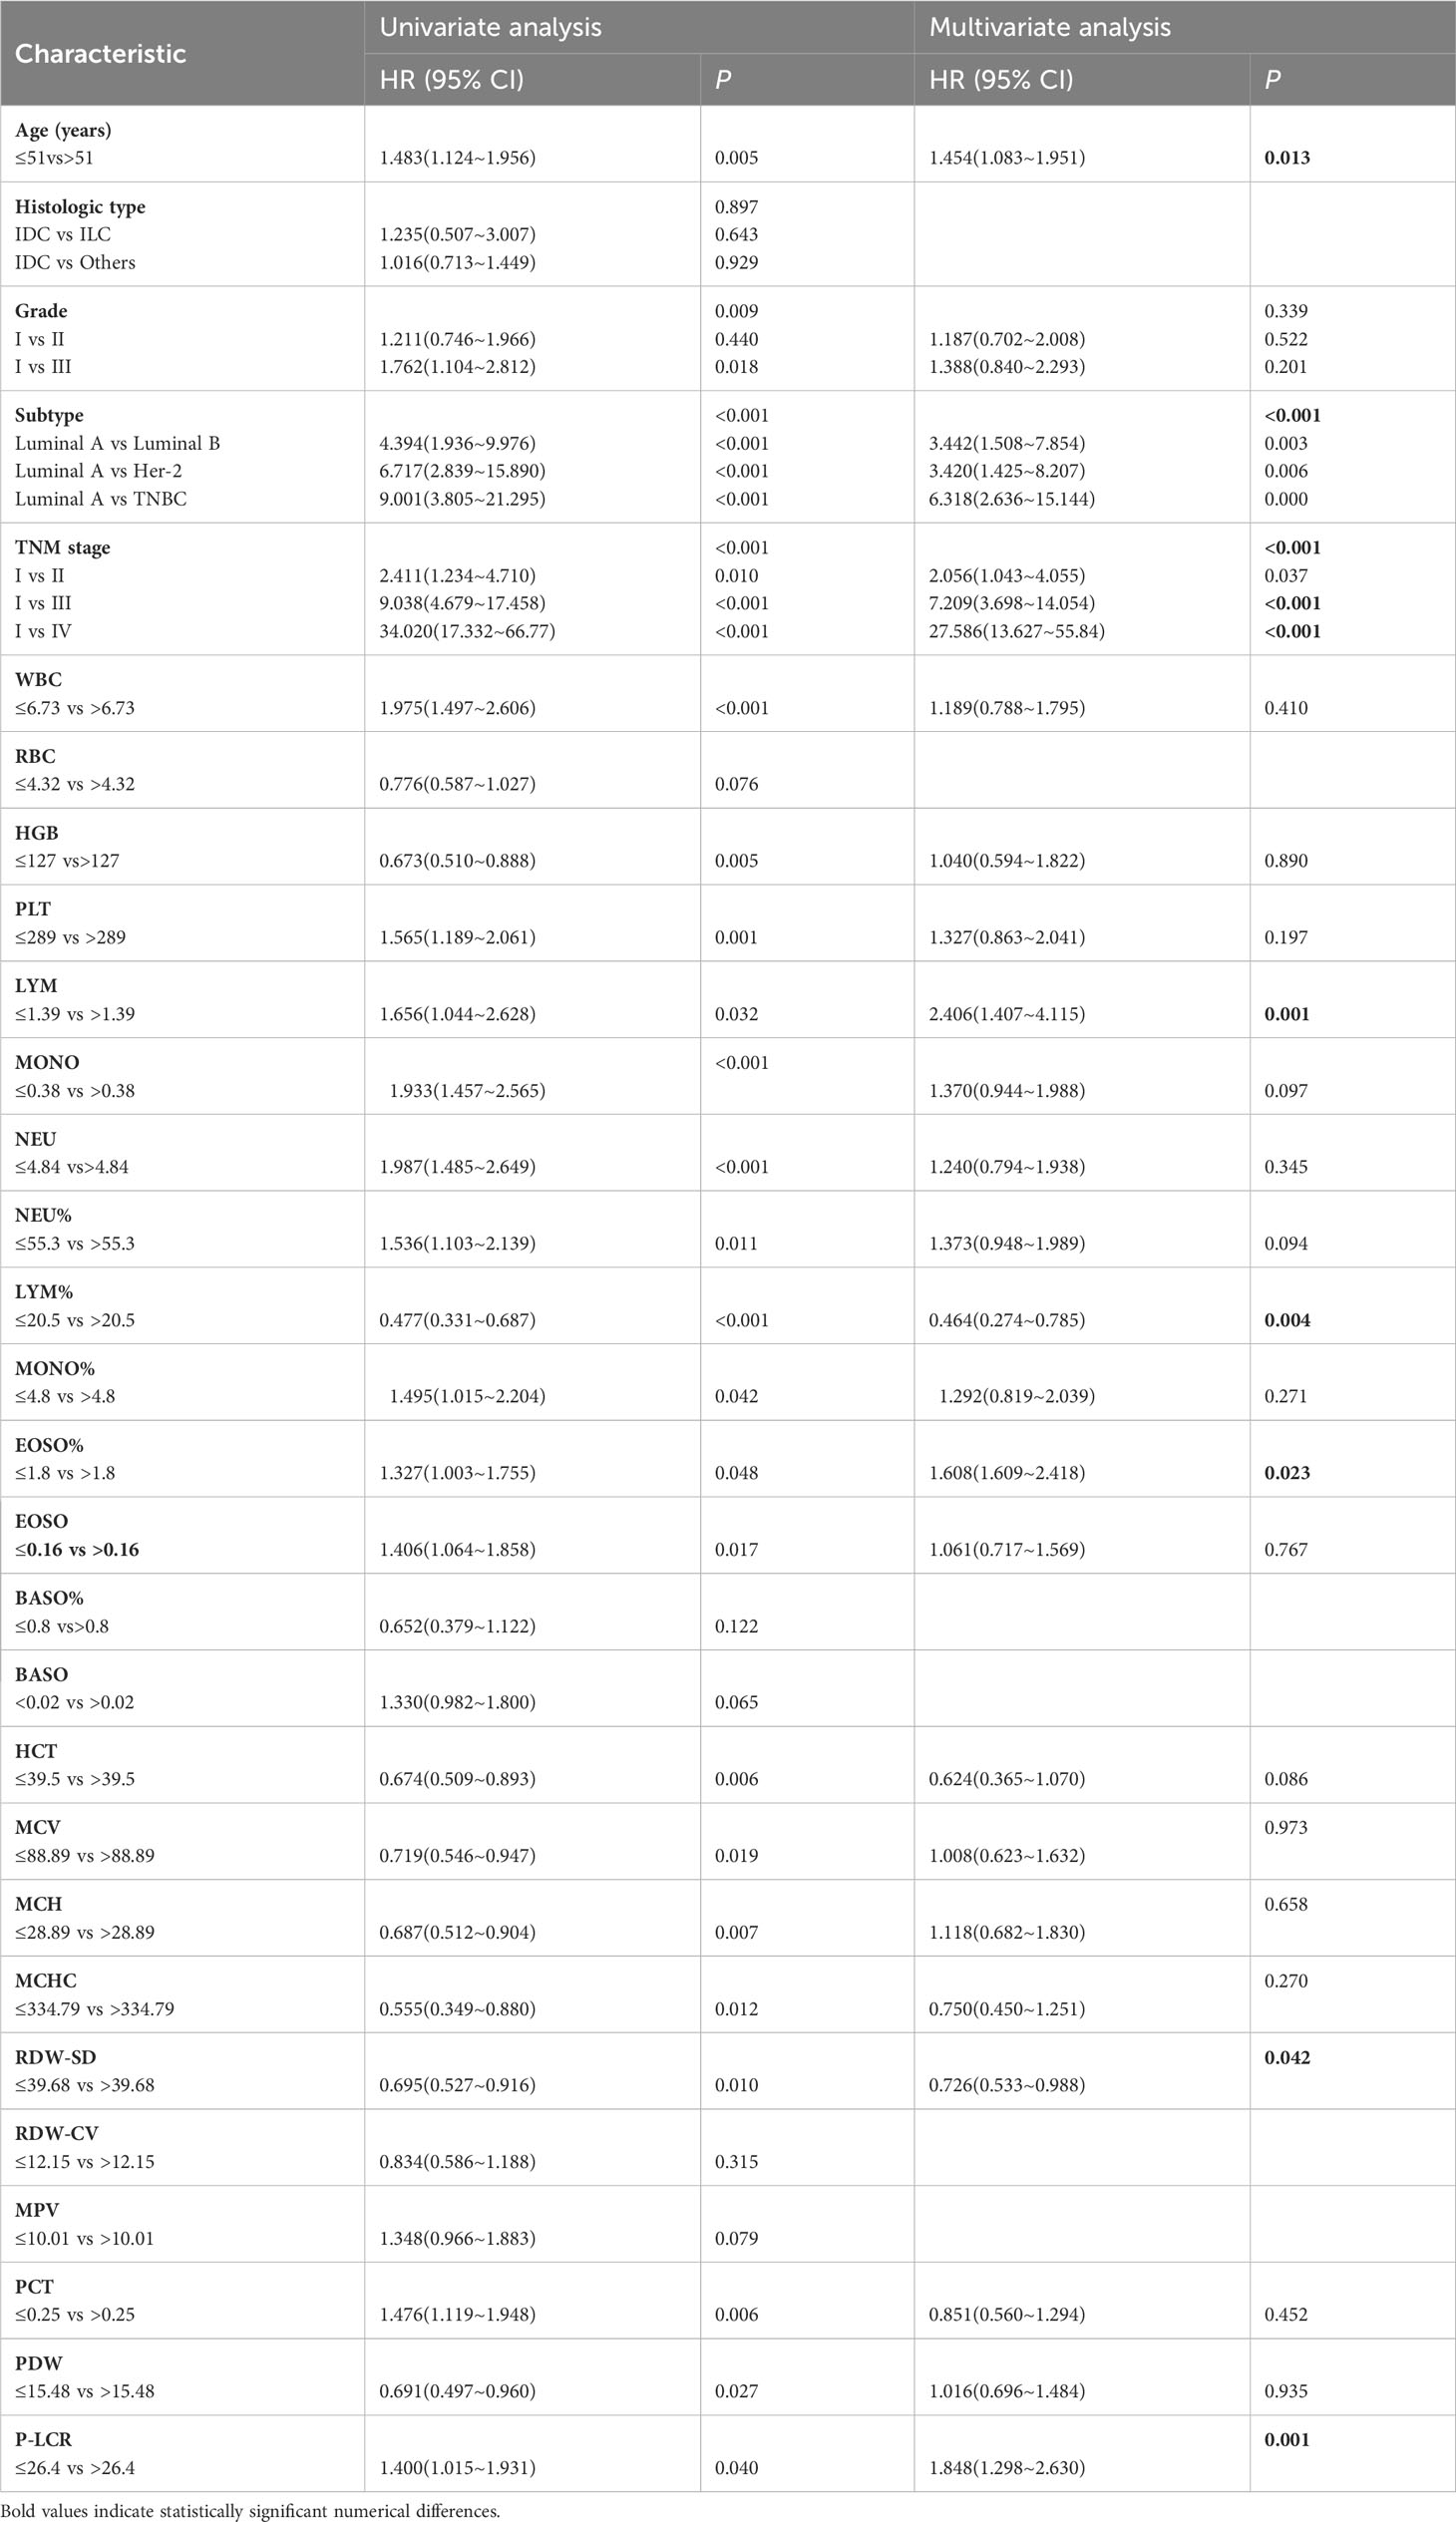
Table 2 Univariate and Multivariable Analysis for overall survival of the training cohort.
3.3 Construction and validation of the nomogram
A nomogram for OS prediction, known as the Subtype–TNM stages–Age-RT indicators (STAR) was constructed based on independent prognostic factors in multivariate analysis (Figure 2).
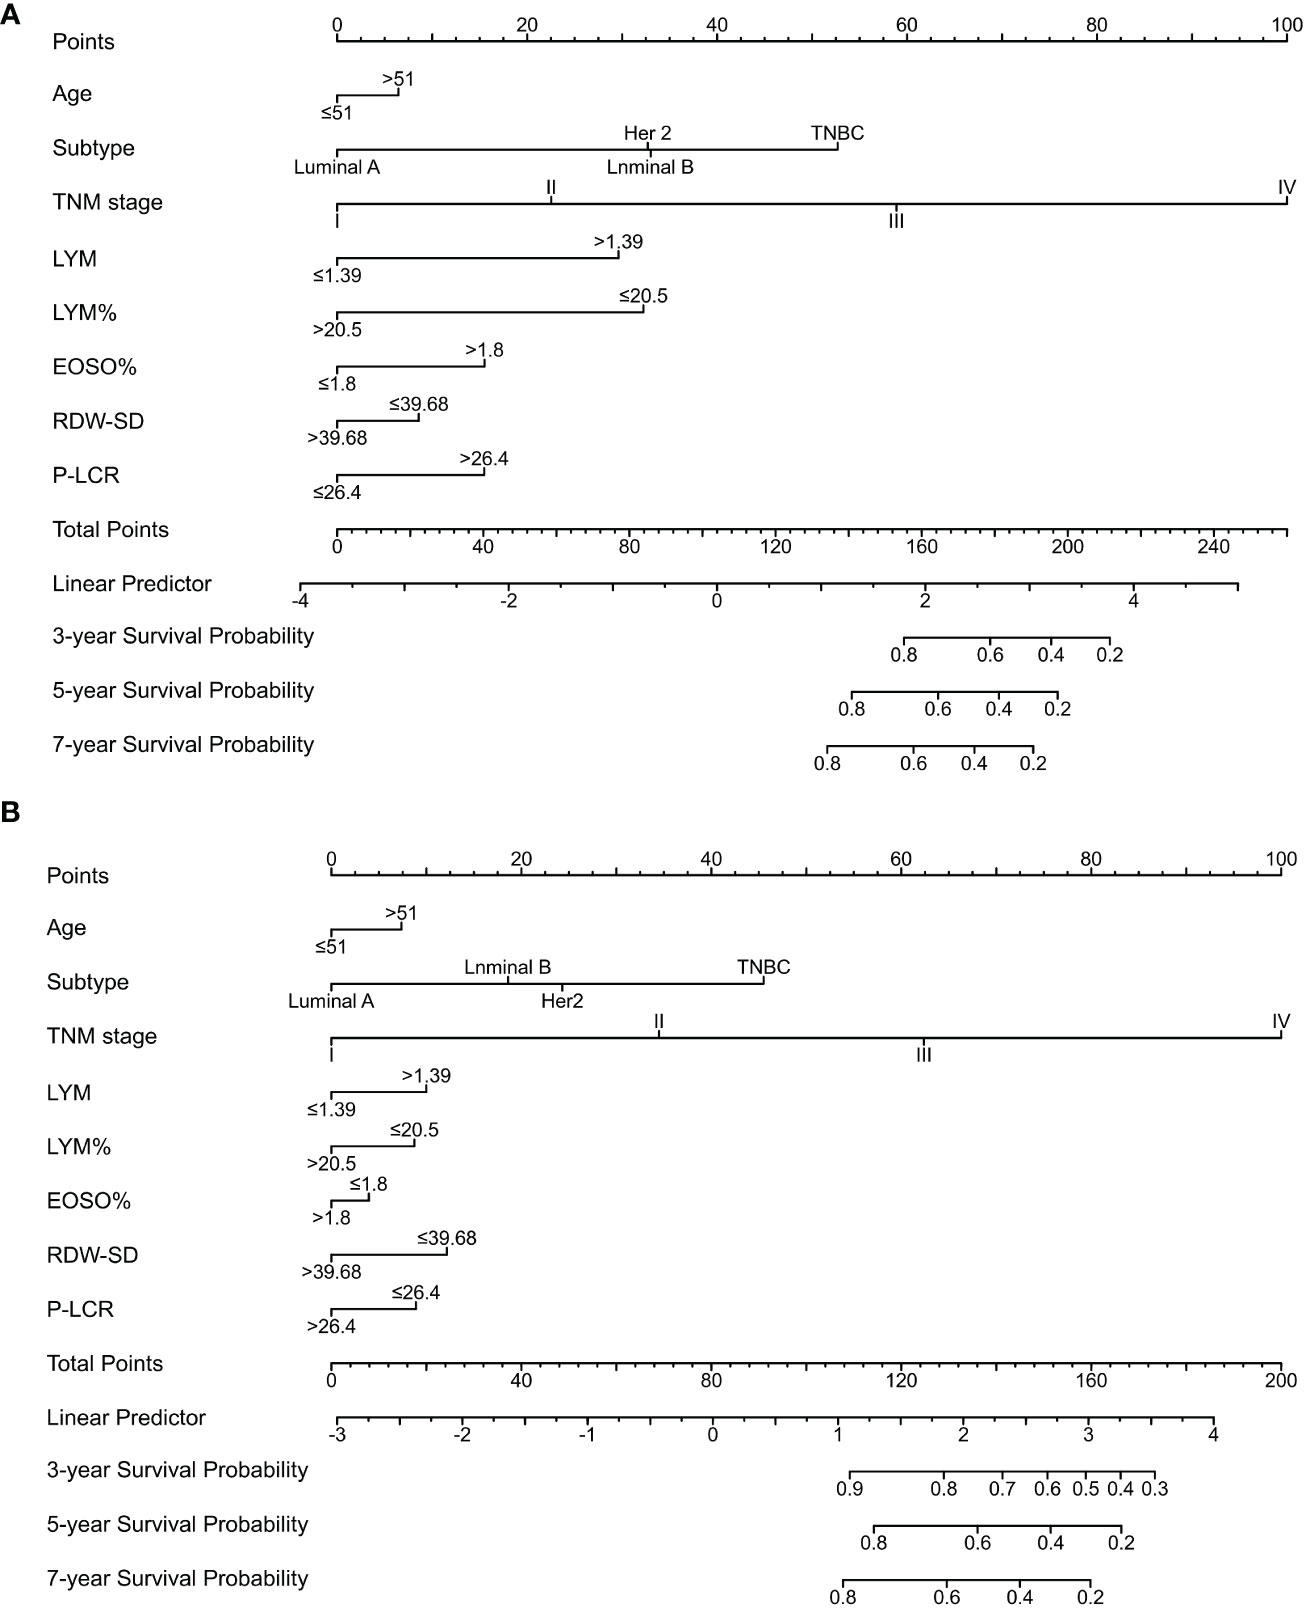
Figure 2 Nomogram model predicting 3-, 5- and 7- year OS in BC patients. The nomogram was used summing the points identified on the points scale for each variable. The total points projected on the bottom scales indicate the probability of 3-, 5- and 7-year survival. (A) The nomogram of training cohort; (B) The nomogram of validation cohort; LYM, lymphocyte; LYM%, percentage of lymphocyte; EOSO, Eosinophils; RDW-SD, Red blood cell distribution width - standard deviation; P-LCR, platelet-large cell ratio.
The STAR prognostic nomogram model demonstrated strong accuracy in predicting the OS rate of BC patients, as indicated by a high C-index of 0.828 (95% CI, 0.813-0.843). The calibration plot, depicted in Figure 3A, showcased the model’s capability in accurately predicting 3-year, 5-year, and 7-year OS. In the training cohort, the AUCs of our nomogram for predicting 3-year, 5-year, and 7-year survival rates were 0.847, 0.823, and 0.780, respectively (Figure 3C).
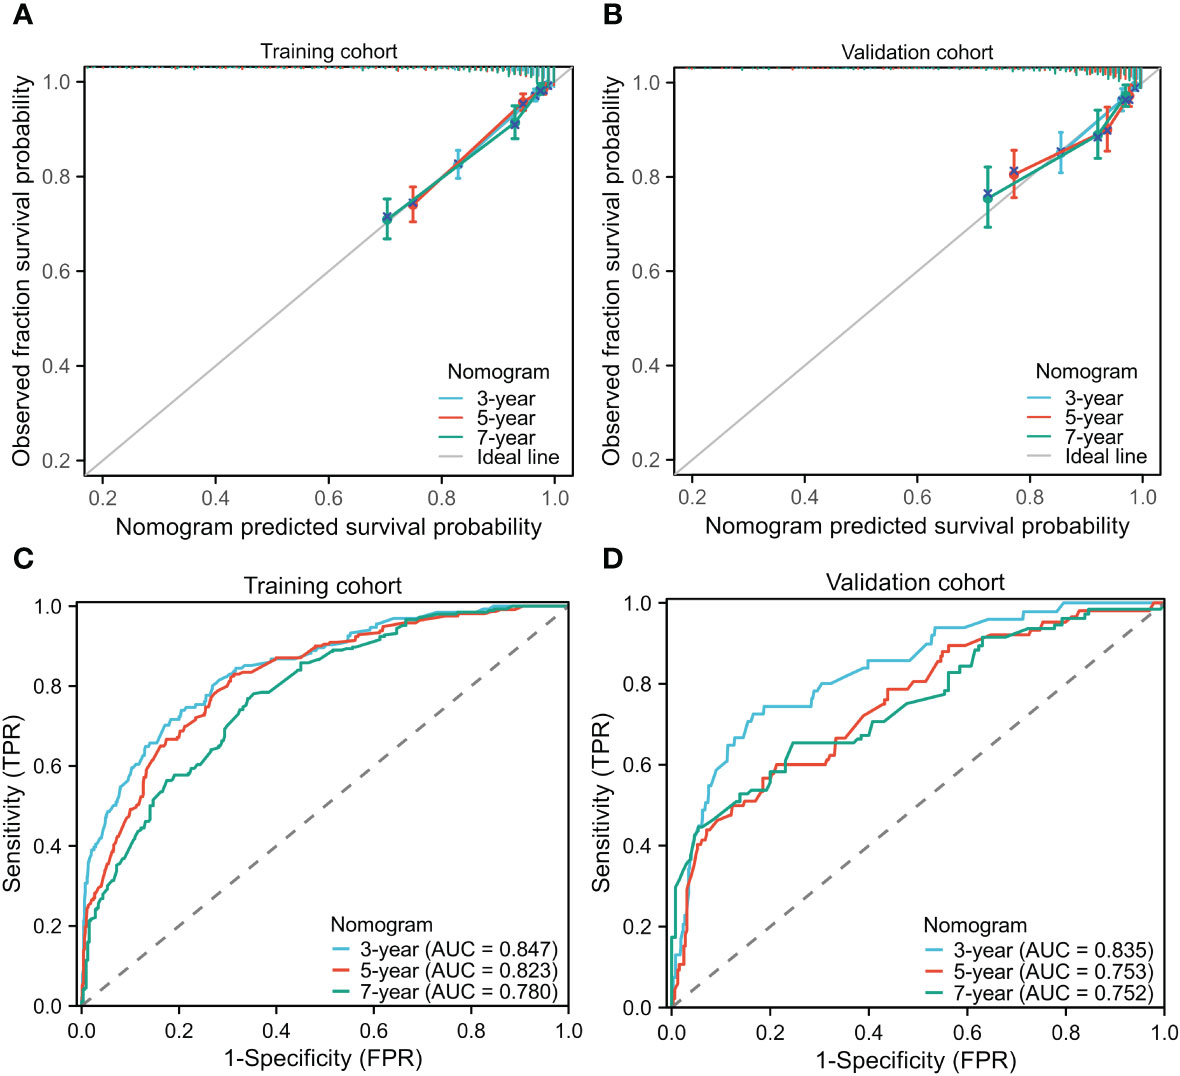
Figure 3 Calibration curves for predicting the 3-,5-,7-year OS in the training (A) and validation cohorts (B). Receiver operating characteristic curves for predicting the 3-,5-,7-year OS in the training (C) and validation cohorts (D). OS, Overall survival; AUCs, Area under curves.
In the validation cohorts, the C-index of the nomogram for predicting OS was 0.799 (95% CI, 0.773-0.825), demonstrating its strong predictive ability. The calibration curve (Figure 3B) displayed a favorable alignment between the 3-year, 5-year, and 7-year survival probabilities predicted by the nomogram and the actual observations. Additionally, the AUCs of our nomogram for predicting 3-year, 5-year, and 7-year survival rates in the validation group were 0.835, 0.753, and 0.752, respectively (Figure 3D). In both the training and validation cohorts, the nomogram model demonstrates reliable predictive accuracy and the discriminatory ability for estimating the OS of BC patients.
3.4 Risk stratification of OS
In the training and validation cohorts, patients were categorized into low-risk, intermediate-risk, and high-risk groups for OS based on the X-tile (35) program’s cut-off values for the total points. In the training cohort, the patients were respectively divided into three risk groups, i.e. low-risk group (total points 0-113) accounting for 65.47%, intermediate risk group (total points 114-147) accounting for 24.51%, and high-risk group (total points 148-226) accounting for 10.01%, of which OS rates were significantly different. The OS rates for the three risk groups were 94.16%, 73.89%, and 48.01% (p <0.001, Figure 4A), respectively. Similarly, significant differences in OS were observed in the validation cohort, with OS rates of 93.45% for the low-risk group, 79.54% for the intermediate-risk group, and 51.46% for the high-risk group (p < 0.001, Figure 4B). Patients in the low-risk group have a better prognosis and may require fewer treatment interventions and monitoring measures. Conversely, patients in the high-risk group may require more intensive interventions and close monitoring. This information is useful for physicians in developing personalized treatment plans and subsequent management strategies for patients. This STAR nomogram has great potential in individual prognosis prediction and enables approximately 90% of BC patients to undergo less intensive surveillance leading to a reduction in the health burden.
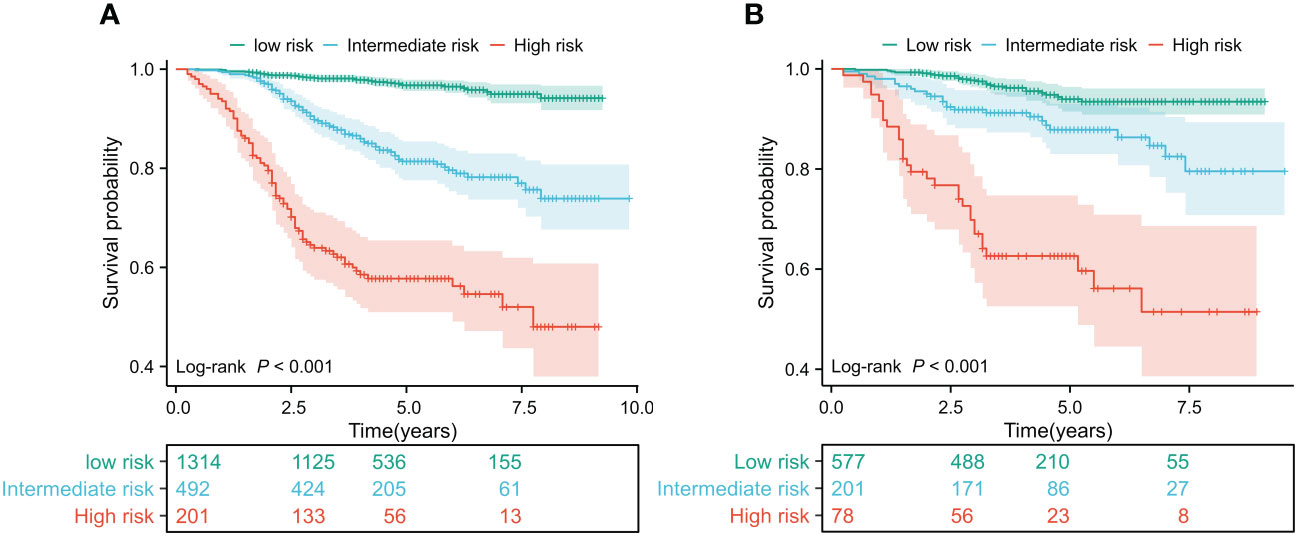
Figure 4 Kaplan Meier curves of predictors based on nomogram models in the training (A) and validation cohorts (B).
3.5 Comparison among the STAR nomogram, TNM staging system and nomograms based on molecular profiling and imaging features
We compared the STAR nomogram with the TNM staging system and nomograms based on molecular profiling and imaging features. Through a meticulous examination of the PubMed and Web of Science databases, utilizing the specified search terms mentioned above, we initially identified 1,013 pieces of literature. Upon screening abstracts and full-texts, we found that 292 of the literature pieces were limited to specific breast cancer subtypes, 329 investigations lacked the association between BC survival and molecular profiling or imaging features, and 36 studies lacked both a training cohort and a validation cohort with a C-index value. Additionally, 168 literature pieces were unrelated to breast cancer. Out of these, 146 literature pieces were related to bioinformatics research, and 40 literature pieces were not research articles. Ultimately, the studies by Silei Sui et al. and Xiaojun Xu et al. were meticulously chosen to represent nomograms based on molecular profiling and imaging features, respectively. In the training cohort, the STAR nomogram exhibited a C-index of 0.828 (95% CI, 0.813-0.843), signifying its superior predictive accuracy in contrast to the TNM staging system (C-index 0.766, 95% CI, 0.749-0.784) and the molecular profiling and imaging features system (C-index 0.665, 95% CI, 0.653-0.677) (Table 3). Similarly, in the validation cohort, the STAR nomogram outperformed other prediction models. It achieved a C-index of 0.847, whereas the C-index values for TNM staging, molecular profiling, and imaging features systems were 0.756, 0.691, and 0.758, respectively. These findings reinforce the superior predictive capability of the STAR nomogram over traditional TNM staging, molecular profiling, and imaging features systems in the validation cohort.
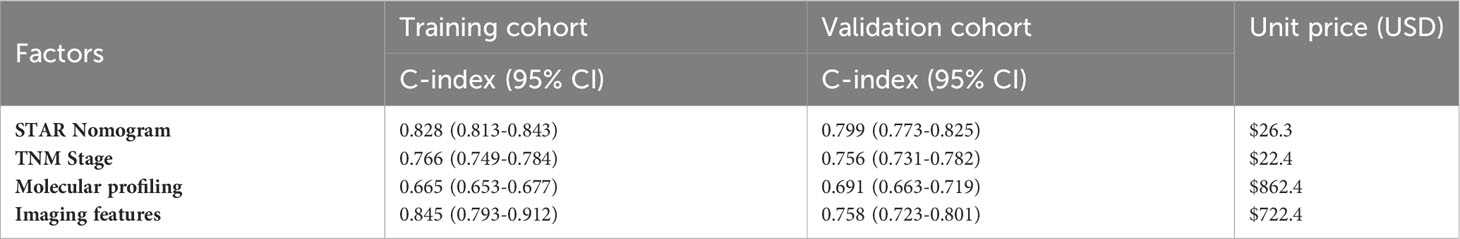
Table 3 The C-index values of different prediction models.
Furthermore, Table 3 presents a comparative analysis of the relative costs per BC patient associated with each prediction strategy. The current standard of care, TNM staging, had an expected cost of $22.4. In contrast, the STAR nomogram demonstrated superior cost-effectiveness, with a cost of $26.3, significantly lower than molecular profiling ($862.4) and Imaging features ($722.4). We believe that the STAR nomogram stands out as a more cost-effective option among these prediction models, given its excellent prognostic performance.
In both the training cohort (Figure 5A) and the validation cohort (Figure 5B), the decision curve analysis (The threshold probability:0-0.6) revealed that the nomogram provided greater clinical benefit across a wider range of threshold probabilities for predicting OS. These findings indicate that the STAR nomogram model outperformed the TNM staging system in terms of clinical utility and net benefit in predicting OS. The decision curve analysis further supports the superiority of the STAR nomogram model as a valuable tool for risk prediction and clinical decision-making in BC patients.
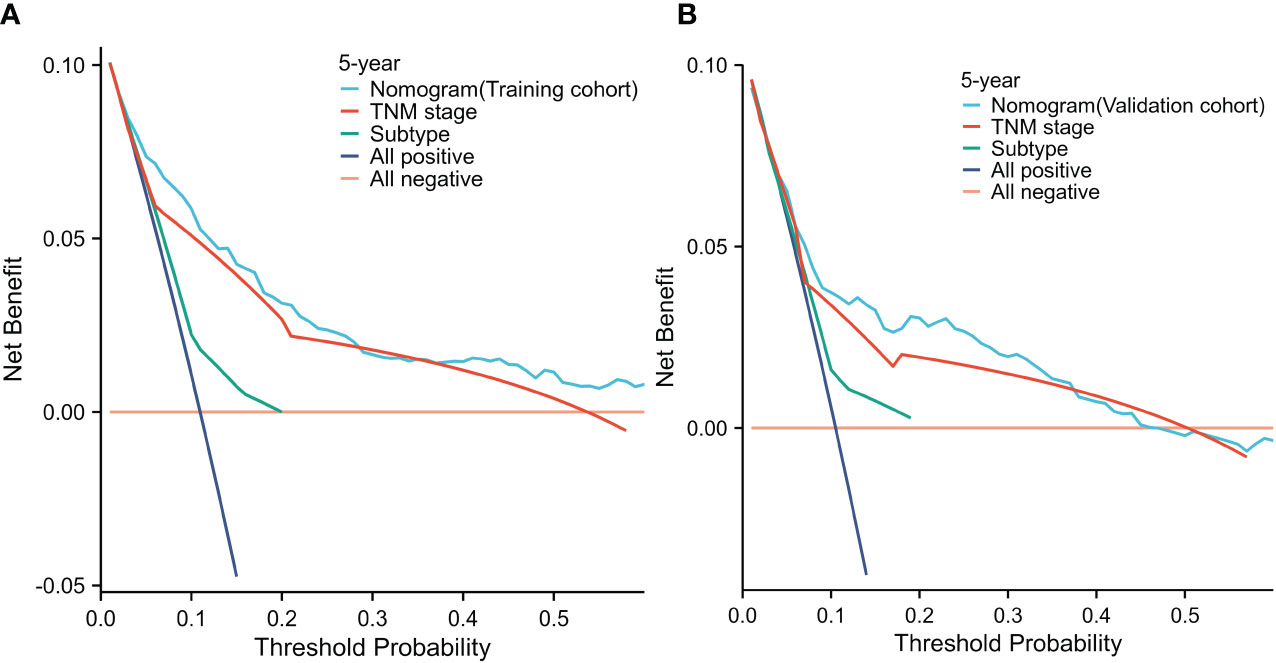
Figure 5 Decision curve analysis for 5-year survival predictions in the training (A) and validation cohorts (B).
4 Discussion
In this study, we embarked on a systematic evaluation of the prognostic significance of routine blood test (RT) parameters in predicting the outcomes of breast cancer patients. To our knowledge, this marks the pioneering effort to comprehensively assess the prognostic value of RT parameters in BC. Furthermore, through the integration of fundamental clinical characteristics with RT parameters, we successfully developed a predictive nomogram model, termed the STAR nomogram. This model serves as an effective tool for forecasting overall survival in BC patients, providing invaluable prognostic insights. Remarkably, in comparison to the conventional TNM staging, molecular profiling and imaging feature systems, the STAR nomogram exhibits exceptional predictive performance.
Univariate and multivariate Cox regression analysis of RT parameters in this study showed that lymphocyte count, lymphocyte ratio, percentage of eosinophils, red blood cell distribution width, and platelet large cell ratio had independent prognostic values. Because of its advantages of easy access and low price, RT parameters play an increasingly important role in the prediction of cancer (36, 37). Consistent with this study, many studies have also shown that the number of peripheral blood lymphocytes has good prognostic value. Anosheh Afghahi et al. found that low lymphocyte count (LC) was closely related to poor OS of BC (38). The retrospective analysis of Sung Min Ko et al. showed that patients with high LC had better disease-free survival (DFS) than patients with low LC (26). Lymphocytes are a kind of inflammatory cells, which play an important role in the development of breast cancer (39, 40). Peripheral lymphocytes can migrate to the tumor site and infiltrate the tumor microenvironment (41, 42). CD8+ cytotoxic T lymphocytes increase antitumor immunity, however, exhausted CD8+ T lymphocytes and regulatory T cells suppress antitumor immunity (43, 44). Therefore, further research is needed on the mechanism of peripheral lymphocytes affecting tumors. Eosinophils are the primitive cells of the innate immune system, which have a powerful ability to influence local immunity and tissue remodeling during homeostasis and disease (45, 46). In our study, eosinophils were an independent prognostic factor of BC, which was also confirmed by the study of Concetta Elisa Onesti et al. (27). There is controversy about the tumor effect of eosinophils, which have direct or indirect anti-tumor activity, but sometimes also promote the development of tumors (47–49). Therefore, the exact mechanism by which eosinophils play a role in BC needs further study. Red blood cell distribution width reflects the degree of heterogeneity of red blood cell volume (50). As a laboratory hematological parameter, it can also be used as an independent prognostic marker to predict the survival of cancer patients (51–54). There are few studies on P-LCR in cancer (55). Platelets serve a crucial role in cancer progression and inflammation, according to new evidence (56, 57). At present, no study has explored the prognostic value of platelet large cell ratio in BC. Our study shows for the first time that the platelet large cell ratio is an independent prognostic factor for BC. Platelet large cell ratio (P-LCR), is defined as the proportion of platelets larger than 12 fL (58). The large platelet ratio is mainly used to show the morphology of platelets and is a good monitoring tool for platelet activity. Large platelets are more likely to bind more fibrinogen on their surface and have higher protein phosphorylation levels after thrombin stimulation (59). Tumor cells are capable of inducing a real platelet aggregation, largely mediated by fibrinogen binding to integrin αIIbβ3 and reinforced by fibrin formation (60). The extent of platelet activation influences several effector factors, such as Vascular Endothelial Growth Factor (VEGF), Platelet-derived growth factor (PDGF), and transforming growth factor-β (TGF-β), which influence vascular maturation in the tumor microenvironment and mediate cancer cell invasion (61), which are associated with the survival rate of BC patients. However, the mechanism of platelet number and size changes in BC is unclear and needs further study.
Our STAR nomogram model represents a significant improvement in the accuracy of prognostic predictions for BC patients. Compared with the existing staging system, the model has higher prediction accuracy and discrimination ability. With the development of medicine and informatics, nomograms can generate the personal digital probability of clinical events, which meets our demand for biological and clinical integrated models, leading to the ubiquitous appearance of nomograms on the internet and in medical journals (62–64). Several other predictive models have been established for BC patients. For instance, Yufen Zheng et al. established a prediction model based on preoperative fibrinogen albumin ratio and platelet lymphocyte ratio (FAR-PLR score) to predict the prognosis of BC patients (65). Fei Lin et al. constructed a nomogram based on the nutritional risk index (NRI) and clinical characteristics (66). There are also nomograms based on imaging histology (67), transcriptomics data (68), etc. that can also make a good prediction for BC patients. Our STAR model achieved a C-index of 0.828 (95% CI, 0.813-0.843), surpassing the average C-index of 0.74 (69) and other similar nomograms (the C-index for the nomograms based on FAR-PLR score and the nutritional risk index were 0.652 and 0.793, respectively). Notably, the acquisition of RT parameters is non-invasive, cost-effective, and easily obtainable. Importantly, it is highly adaptable and can be widely applied, even in primary healthcare settings. Moreover, the STAR nomogram offers the fastest potential turnaround time, ranging from just 0.5 to 6 hours, as opposed to the molecular profiling and imaging features system, which can take up to 10 days to yield results. The prediction model based on RT parameters presented in this study not only enhances the economic benefits for patients but also aids clinicians in making informed treatment decisions. Additionally, it contributes to the advancement of personalized medicine. By integrating multiple predictive factors, the STAR nomogram can estimate a patient’s survival probability. Using the Nomogram, the total score for each patient can be calculated based on assigned scores for each risk variable, with higher scores being associated with an adverse prognosis. These predictive results provide patients and clinicians with a more specific and objective understanding of treatment efficacy and prognosis. Patients can gain insight into their own risks and potential treatment outcomes, enabling them to make more informed decisions. Meanwhile, clinicians can better engage in individualized follow-up and subsequent treatment planning.
Although our nomogram provided clinicians with a useful tool for selecting and planning treatment strategies for patients with BC, our study has several limitations. First, there could be potential selection bias inherent in any retrospective study, as patient data were collected from medical records. This could have influenced the representativeness of our study population and the generalizability of our findings. Second, our study solely examined BC patients’ OS prognostic values and did not assess our nomogram’s DFS prediction ability. DFS can help assess the efficacy of treatment in controlling tumor recurrence and progression (70). It was a more effective clinical implementation of the nomogram when OS and DFS were included. In subsequent studies, we will continue to collect DFS data and assess the model’s ability to predict DFS. Third, the nomogram predictions lack of external validation cohorts, and we will collect more external data in the follow-up study to verify this model. In subsequent studies, we plan to collaborate with other institutions or international partners to share data or collect additional samples. This will increase the sample size and enhance the reliability and statistical power of validation. We also intend to perform multicenter data validation, cross-validation, and internal validation to repeatedly optimize and update the model, reducing potential influences on model robustness while improving its reliability and generalizability.
5 Conclusion
Overall, our study confirms that RT parameters can be used as a promising prognostic factor for BC patients. The STAR nomogram which is facilitates accurate, cheap, reliable and simple-to-use prediction for predicting OS of BC patients. It is entirely objective, being based on 4 of the most common clinical parameters. Thus, this STAR nomogram will be a useful tool for clinicians’ decision-making and individual patient consultation. In future work, whether active intervention guided by prognostic laboratory markers will improve the prognosis assessment of patients needs further investigation.
Data availability statement
The datasets generated and/or analyzed during the current study are not publicly available due to that the data also forms part of other ongoing studies but are available from the corresponding author on reasonable request.
Ethics statement
The studies involving humans were approved by Guangxi Medical University Cancer Hospital Ethical Review Committee. The studies were conducted in accordance with the local legislation and institutional requirements. The participants provided their written informed consent to participate in this study.
Author contributions
CW: Writing – review & editing. YL: Writing – original draft, Data curation, Formal analysis. DM: Writing – original draft, Data curation, Formal analysis, Software. QL: Writing – original draft, Validation. ZL: Data curation, Writing – original draft. ML: Data curation, Writing – original draft. YQ: Data curation, Investigation, Methodology, Software, Writing – original draft. MF: Writing – review & editing, Conceptualization, Funding acquisition.
Funding
The author(s) declare financial support was received for the research, authorship, and/or publication of this article. This work was supported by grants from National Science Foundation of Guangxi (2022GXNSFAA035510), National Science Foundation of China (8236080196, 81760530) and Postdoctoral Science Foundation of China (2021M693803).
Acknowledgments
The authors gratefully acknowledge each editor and reviewer for their efforts on this study.
Conflict of interest
The authors declare that the research was conducted in the absence of any commercial or financial relationships that could be construed as a potential conflict of interest.
Publisher’s note
All claims expressed in this article are solely those of the authors and do not necessarily represent those of their affiliated organizations, or those of the publisher, the editors and the reviewers. Any product that may be evaluated in this article, or claim that may be made by its manufacturer, is not guaranteed or endorsed by the publisher.
Abbreviations
BC, breast cancer; RT, routine blood tests; C-index, concordance index; AUCs, area under curves; WBC, white blood cell; RBC, red blood cell; HGB, hemoglobin; PLT, platelet; LYM, lymphocyte; MONO, monocyte; NEU, Neutrophils; EOSO, Eosinophils; BASO, basophil; HCT, hematocrit; MCV, mean corpuscular volume; MCH, mean corpuscular hemoglobin; MCHC, mean corpuscular hemoglobin concentration; RDW-SD, red blood cell distribution width - standard deviation; RDW-CV, red blood cell distribution width - coefficient of variation; MPV, Mean platelet volume; PCT, platelet crit; PDW, platelet distribution width; P-LCR, platelet-large cell ratio.
References
1. Sung H, Ferlay J, Siegel RL, Laversanne M, Soerjomataram I, Jemal A, et al. Global cancer statistics 2020: globocan estimates of incidence and mortality worldwide for 36 cancers in 185 countries. CA: Cancer J For Clin. (2021) 71:209–49. doi: 10.3322/caac.21660
2. Siegel RL, Miller KD, Wagle NS, Jemal A. Cancer statistics, 2023. CA: Cancer J For Clin. (2023) 73:17–48. doi: 10.3322/caac.21763
3. Zardavas D, Irrthum A, Swanton C, Piccart M. Clinical management of breast cancer heterogeneity. Nat Rev Clin Oncol. (2015) 12:381–94. doi: 10.1038/nrclinonc.2015.73
4. Liang Y, Zhang H, Song X, Yang Q. Metastatic heterogeneity of breast cancer: molecular mechanism and potential therapeutic targets. Semin Cancer Biol. (2020) 60:14–27. doi: 10.1016/j.semcancer.2019.08.012
5. Rodrigues-Ferreira S, Nahmias C. Predictive biomarkers for personalized medicine in breast cancer. Cancer Lett. (2022) 545:215828. doi: 10.1016/j.canlet.2022.215828
6. Yao Y, Lv Y, Tong L, Liang Y, Xi S, Ji B, et al. Icsda: A multi-modal deep learning model to predict breast cancer recurrence and metastasis risk by integrating pathological, clinical and gene expression data. Briefings In Bioinf. (2022) 23:bbac448. doi: 10.1093/bib/bbac448
7. Sheng D-L, Shen X-G, Shi Z-T, Chang C, Li J-W. Survival outcome assessment for triple-negative breast cancer: A nomogram analysis based on integrated clinicopathological, sonographic, and mammographic characteristics. Eur Radiol. (2022) 32:6575–87. doi: 10.1007/s00330-022-08910-4
8. Fan Y, Wang Y, He L, Imani S, Wen Q. Clinical features of patients with her2-positive breast cancer and development of a nomogram for predicting survival. ESMO Open. (2021) 6:100232. doi: 10.1016/j.esmoop.2021.100232
9. Shimizu H, Nakayama KI. A 23 gene-based molecular prognostic score precisely predicts overall survival of breast cancer patients. EBioMedicine. (2019) 46:150–9. doi: 10.1016/j.ebiom.2019.07.046
10. Wang Y, Ali MA, Vallon-Christersson J, Humphreys K, Hartman J, Rantalainen M. Transcriptional intra-tumour heterogeneity predicted by deep learning in routine breast histopathology slides provides independent prognostic information. Eur J Cancer. (2023) 191:112953. doi: 10.1016/j.ejca.2023.112953
11. Čelešnik H, Potočnik U. Blood-based mrna tests as emerging diagnostic tools for personalised medicine in breast cancer. Cancers. (2023) 15:1087. doi: 10.3390/cancers15041087
12. Palazzetti V, Guidi F, Ottaviani L, Valeri G, Baldassarre S, Giuseppetti GM. Analysis of mammographic diagnostic errors in breast clinic. Radiol Med. (2016) 121:828–33. doi: 10.1007/s11547-016-0655-0
13. Berg WA, Blume JD, Cormack JB, Mendelson EB, Lehrer D, Böhm-Vélez M, et al. Combined screening with ultrasound and mammography vs mammography alone in women at elevated risk of breast cancer. JAMA. (2008) 299:2151–63. doi: 10.1001/jama.299.18.2151
14. De Rose F, Meduri B, De Santis MC, Ferro A, Marino L, Colciago RR, et al. Rethinking breast cancer follow-up based on individual risk and recurrence management. Cancer Treat Rev. (2022) 109:102434. doi: 10.1016/j.ctrv.2022.102434
15. Mao J-R, Lan K-Q, Liu S-L, Liu C, Xie S-Y, Li S-C, et al. Can the prognosis of individual patients with nasopharyngeal carcinoma be predicted using a routine blood test at admission? Radiother Oncol. (2023) 179:109445. doi: 10.1016/j.radonc.2022.109445
16. Siau K. Routine blood tests are a basic screening tool for serious pathology. BMJ. (2017) 357:j2675. doi: 10.1136/bmj.j2675
17. Kotepui M, PhunPhuech B, Phiwklam N, Uthaisar K. Differentiating between dengue fever and malaria using hematological parameters in endemic areas of Thailand. Infect Dis Poverty. (2017) 6:27. doi: 10.1186/s40249-017-0238-x
18. Hopkins AM, Rowland A, Kichenadasse G, Wiese MD, Gurney H, McKinnon RA, et al. Predicting response and toxicity to immune checkpoint inhibitors using routinely available blood and clinical markers. Br J Cancer. (2017) 117:913–20. doi: 10.1038/bjc.2017.274
19. Petrone G, Gaulin C, Derkach A, Kishtagari A, Robson ME, Parameswaran R, et al. Routine clinical parameters and laboratory testing predict therapy-related myeloid neoplasms after treatment for breast cancer. Haematologica. (2023) 108:161–70. doi: 10.3324/haematol.2021.280437
20. Wang L, Dong T, Xin B, Xu C, Guo M, Zhang H, et al. Integrative nomogram of ct imaging, clinical, and hematological features for survival prediction of patients with locally advanced non-small cell lung cancer. Eur Radiol. (2019) 29:2958–67. doi: 10.1007/s00330-018-5949-2
21. Gandini S, Ferrucci PF, Botteri E, Tosti G, Barberis M, Pala L, et al. Prognostic significance of hematological profiles in melanoma patients. Int J Cancer. (2016) 139:1618–25. doi: 10.1002/ijc.30215
22. Wang F, Liang J, Yang F, Liu F, Han S, Xing N. Preoperative red cell distribution width is associated with postoperative lymphovascular invasion in prostate cancer patients treated with radical prostatectomy: A retrospective study. Front Endocrinol (Lausanne). (2022) 13:1020655. doi: 10.3389/fendo.2022.1020655
23. Diakos CI, Charles KA, McMillan DC, Clarke SJ. Cancer-related inflammation and treatment effectiveness. Lancet Oncol. (2014) 15:e493–503. doi: 10.1016/S1470-2045(14)70263-3
24. Huang B, Wu F-C, Wang W-D, Shao B-Q, Wang X-M, Lin Y-M, et al. The prognosis of breast cancer patients with bone metastasis could be potentially estimated based on blood routine test and biochemical examination at admission. Ann Med. (2023) 55:2231342. doi: 10.1080/07853890.2023.2231342
25. Laytragoon Lewin N, Oliva D, Nilsson M, Andersson B-Å, Löfgren S, Lewin F. Survival time among young and old breast cancer patients in relation to circulating blood-based biomarkers, acute radiation skin reactions, and tumour recurrence. Oncology. (2021) 99:740–6. doi: 10.1159/000518184
26. Ko SM, Lee J, Bae SJ, Baik SJ, Ji J, Kim D, et al. Body mass index and absolute lymphocyte count predict disease-free survival in korean breast cancer patients. Br J Cancer. (2021) 125:119–25. doi: 10.1038/s41416-021-01391-0
27. Onesti CE, Josse C, Boulet D, Thiry J, Beaumecker B, Bours V, et al. Blood Eosinophilic Relative Count Is Prognostic for Breast Cancer and Associated with the Presence of Tumor at Diagnosis and at Time of Relapse. Oncoimmunology. (2020) 9:1761176. doi: 10.1080/2162402X.2020.1761176
28. Yao D, Wang Z, Cai H, Li Y, Li B. Relationship between red cell distribution width and prognosis in patients with breast cancer after operation: A retrospective cohort study. Biosci Rep. (2019) 39:BSR20190740. doi: 10.1042/BSR20190740
29. Takeuchi H, Abe M, Takumi Y, Hashimoto T, Kobayashi R, Osoegawa A, et al. The prognostic impact of the platelet distribution width-to-platelet count ratio in patients with breast cancer. PloS One. (2017) 12:e0189166. doi: 10.1371/journal.pone.0189166
30. Giuliano AE, Edge SB, Hortobagyi GN. Eighth edition of the ajcc cancer staging manual: breast cancer. Ann Surg Oncol. (2018) 25:1783–5. doi: 10.1245/s10434-018-6486-6
31. Choi J, Dekkers OM, le Cessie S. A comparison of different methods to handle missing data in the context of propensity score analysis. Eur J Epidemiol. (2019) 34:23–36. doi: 10.1007/s10654-018-0447-z
32. Sui S, An X, Xu C, Li Z, Hua Y, Huang G, et al. An immune cell infiltration-based immune score model predicts prognosis and chemotherapy effects in breast cancer. Theranostics. (2020) 10:11938–49. doi: 10.7150/thno.49451
33. Xu X, Sun X, Ma L, Zhang H, Ji W, Xia X, et al. 18f-fdg pet/ct radiomics signature and clinical parameters predict progression-free survival in breast cancer patients: A preliminary study. Front In Oncol. (2023) 13:1149791. doi: 10.3389/fonc.2023.1149791
34. Harrell FE, Califf RM, Pryor DB, Lee KL, Rosati RA. Evaluating the yield of medical tests. JAMA. (1982) 247:2543–6. doi: 10.1001/jama.1982.03320430047030
35. Camp RL, Dolled-Filhart M, Rimm DL. X-tile: A new bio-informatics tool for biomarker assessment and outcome-based cut-point optimization. Clin Cancer Res. (2004) 10:7252–9. doi: 10.1158/1078-0432.CCR-04-0713
36. Koh CH, Bhoo-Pathy N, Ng KL, Jabir RS, Tan GH, See MH, et al. Utility of pre-treatment neutrophil-lymphocyte ratio and platelet-lymphocyte ratio as prognostic factors in breast cancer. Br J Cancer. (2015) 113:150–8. doi: 10.1038/bjc.2015.183
37. Soyano AE, Dholaria B, Marin-Acevedo JA, Diehl N, Hodge D, Luo Y, et al. Peripheral blood biomarkers correlate with outcomes in advanced non-small cell lung cancer patients treated with anti-pd-1 antibodies. J Immunother Cancer. (2018) 6:129. doi: 10.1186/s40425-018-0447-2
38. Zhao J, Huang W, Wu Y, Luo Y, Wu B, Cheng J, et al. Prognostic role of pretreatment blood lymphocyte count in patients with solid tumors: A systematic review and meta-analysis. Cancer Cell Int. (2020) 20:15. doi: 10.1186/s12935-020-1094-5
39. Hanahan D, Weinberg RA. Hallmarks of cancer: the next generation. Cell. (2011) 144:646–74. doi: 10.1016/j.cell.2011.02.013
40. Lim B, Woodward WA, Wang X, Reuben JM, Ueno NT. Inflammatory breast cancer biology: the tumour microenvironment is key. Nat Rev Cancer. (2018) 18:485–99. doi: 10.1038/s41568-018-0010-y
41. Schreiber RD, Old LJ, Smyth MJ. Cancer immunoediting: integrating immunity's roles in cancer suppression and promotion. Science. (2011) 331:1565–70. doi: 10.1126/science.1203486
42. Slaney CY, Kershaw MH, Darcy PK. Trafficking of T cells into tumors. Cancer Res. (2014) 74:7168–74. doi: 10.1158/0008-5472.CAN-14-2458
43. Bos R, Sherman LA. Cd4+ T-cell help in the tumor milieu is required for recruitment and cytolytic function of cd8+ T lymphocytes. Cancer Res. (2010) 70:8368–77. doi: 10.1158/0008-5472.CAN-10-1322
44. Mahmoud S, Lee A, Ellis I, Green A. Cd8(+) T lymphocytes infiltrating breast cancer: A promising new prognostic marker? Oncoimmunology. (2012) 1:364–5. doi: 10.4161/onci.18614
45. Grisaru-Tal S, Itan M, Klion AD, Munitz A. A new dawn for eosinophils in the tumour microenvironment. Nat Rev Cancer. (2020) 20:594–607. doi: 10.1038/s41568-020-0283-9
46. Jørgensen N, Lænkholm A-V, Sækmose SG, Hansen LB, Hviid TVF. Peripheral blood immune markers in breast cancer: differences in regulatory T cell abundance are related to clinical parameters. Clin Immunol. (2021) 232:108847. doi: 10.1016/j.clim.2021.108847
47. Artham S, Chang C-Y, McDonnell DP. Eosinophilia in cancer and its regulation by sex hormones. Trends Endocrinol Metab. (2023) 34:5–20. doi: 10.1016/j.tem.2022.11.002
48. Lucarini V, Ziccheddu G, Macchia I, La Sorsa V, Peschiaroli F, Buccione C, et al. Il-33 restricts tumor growth and inhibits pulmonary metastasis in melanoma-bearing mice through eosinophils. Oncoimmunology. (2017) 6:e1317420. doi: 10.1080/2162402X.2017.1317420
49. Hude I, Sasse S, Bröckelmann PJ, von Tresckow B, Momotow J, Engert A, et al. Leucocyte and eosinophil counts predict progression-free survival in relapsed or refractory classical hodgkin lymphoma patients treated with pd1 inhibition. Br J Haematol. (2018) 181:837–40. doi: 10.1111/bjh.14705
50. Salvagno GL, Sanchis-Gomar F, Picanza A, Lippi G. Red blood cell distribution width: A simple parameter with multiple clinical applications. Crit Rev Clin Lab Sci. (2015) 52:86–105. doi: 10.3109/10408363.2014.992064
51. Kust D, Lucijanic M, Urch K, Samija I, Celap I, Kruljac I, et al. Clinical and prognostic significance of anisocytosis measured as a red cell distribution width in patients with colorectal cancer. QJM. (2017) 110:361–7. doi: 10.1093/qjmed/hcw223
52. Petrella F, Casiraghi M, Radice D, Prisciandaro E, Rizzo S, Spaggiari L. Prognostic value of red blood cell distribution width in resected pn1 lung adenocarcinoma. Cancers. (2020) 12:3677. doi: 10.3390/cancers12123677
53. Song B, Shi P, Xiao J, Song Y, Zeng M, Cao Y, et al. Utility of red cell distribution width as a diagnostic and prognostic marker in non-small cell lung cancer. Sci Rep. (2020) 10:15717. doi: 10.1038/s41598-020-72585-4
54. Chen H, Zhong Q, Zhou Y, Qin Y, Yang J, Liu P, et al. Enhancement of the international prognostic index with B2-microglobulin, platelet count and red blood cell distribution width: A new prognostic model for diffuse large B-cell lymphoma in the rituximab era. BMC Cancer. (2022) 22:583. doi: 10.1186/s12885-022-09693-z
55. Halawi M. Prognostic value of evaluating platelet role, count and indices in laboratory diagnosis of different types of solid Malignancies. Pak J Biol Sci. (2022) 25:100–5. doi: 10.3923/pjbs.2022.100.105
56. Xu XR, Zhang D, Oswald BE, Carrim N, Wang X, Hou Y, et al. Platelets are versatile cells: new discoveries in hemostasis, thrombosis, immune responses, tumor metastasis and beyond. Crit Rev Clin Lab Sci. (2016) 53:409–30. doi: 10.1080/10408363.2016.1200008
57. Schlesinger M. Role of platelets and platelet receptors in cancer metastasis. J Hematol Oncol. (2018) 11:125. doi: 10.1186/s13045-018-0669-2
58. Kaito K, Otsubo H, Usui N, Yoshida M, Tanno J, Kurihara E, et al. Platelet size deviation width, platelet large cell ratio, and mean platelet volume have sufficient sensitivity and specificity in the diagnosis of immune thrombocytopenia. Br J Haematol. (2005) 128:698–702. doi: 10.1111/j.1365-2141.2004.05357.x
59. Handtke S, Thiele T. Large and small platelets-(When) do they differ? J Thromb Haemost. (2020) 18:1256–67. doi: 10.1111/jth.14788
60. Zarà M, Canobbio I, Visconte C, Canino J, Torti M, Guidetti GF. Molecular mechanisms of platelet activation and aggregation induced by breast cancer cells. Cell Signal. (2018) 48:45–53. doi: 10.1016/j.cellsig.2018.04.008
61. Pujol-Moix N, Vázquez-Santiago M, Morera A, Ziyatdinov A, Remacha A, Nomdedeu JF, et al. Genetic determinants of platelet large-cell ratio, immature platelet fraction, and other platelet-related phenotypes. Thromb Res. (2015) 136:361–6. doi: 10.1016/j.thromres.2015.06.016
62. Balachandran VP, Gonen M, Smith JJ, DeMatteo RP. Nomograms in oncology: more than meets the eye. Lancet Oncol. (2015) 16:e173–e80. doi: 10.1016/S1470-2045(14)71116-7
63. Semenkovich TR, Yan Y, Subramanian M, Meyers BF, Kozower BD, Nava R, et al. A clinical nomogram for predicting node-positive disease in esophageal cancer. Ann Surg. (2021) 273:e214–e21. doi: 10.1097/SLA.0000000000003450
64. Raghav K, Hwang H, Jácome AA, Bhang E, Willett A, Huey RW, et al. Development and validation of a novel nomogram for individualized prediction of survival in cancer of unknown primary. Clin Cancer Res. (2021) 27:3414–21. doi: 10.1158/1078-0432.CCR-20-4117
65. Zheng Y, Wu C, Yan H, Chen S. Prognostic value of combined preoperative fibrinogen-albumin ratio and platelet-lymphocyte ratio score in patients with breast cancer: A prognostic nomogram study. Clin Chim Acta. (2020) 506:110–21. doi: 10.1016/j.cca.2020.03.011
66. Lin F, Xia W, Chen M, Jiang T, Guo J, Ouyang Y, et al. A prognostic model based on nutritional risk index in operative breast cancer. Nutrients. (2022) 14:3783. doi: 10.3390/nu14183783
67. Wang X, Xie T, Luo J, Zhou Z, Yu X, Guo X. Radiomics predicts the prognosis of patients with locally advanced breast cancer by reflecting the heterogeneity of tumor cells and the tumor microenvironment. Breast Cancer Res. (2022) 24:20. doi: 10.1186/s13058-022-01516-0
68. Li Z, Zhang H, Wang X, Wang Q, Xue J, Shi Y, et al. Identification of cuproptosis-related subtypes, characterization of tumor microenvironment infiltration, and development of a prognosis model in breast cancer. Front In Immunol. (2022) 13:996836. doi: 10.3389/fimmu.2022.996836
69. Hueting TA, van Maaren MC, Hendriks MP, Koffijberg H, Siesling S. The majority of 922 prediction models supporting breast cancer decision-making are at high risk of bias. J Clin Epidemiol. (2022) 152:238–47. doi: 10.1016/j.jclinepi.2022.10.016
Keywords: breast cancer, prognosis, nomogram, survival, routine blood tests, C-index
Citation: Wei C, Liang Y, Mo D, Lin Q, Liu Z, Li M, Qin Y and Fang M (2024) Cost-effective prognostic evaluation of breast cancer: using a STAR nomogram model based on routine blood tests. Front. Endocrinol. 15:1324617. doi: 10.3389/fendo.2024.1324617
Received: 19 October 2023; Accepted: 26 February 2024;
Published: 11 March 2024.
Edited by:
Hossam Taha Mohamed, October University for Modern Sciences and Arts, EgyptReviewed by:
Yasmin Abdel-Latif, National Research Centre, EgyptReham Barghash, October University for Modern Sciences and Arts, Egypt
Copyright © 2024 Wei, Liang, Mo, Lin, Liu, Li, Qin and Fang. This is an open-access article distributed under the terms of the Creative Commons Attribution License (CC BY). The use, distribution or reproduction in other forums is permitted, provided the original author(s) and the copyright owner(s) are credited and that the original publication in this journal is cited, in accordance with accepted academic practice. No use, distribution or reproduction is permitted which does not comply with these terms.
*Correspondence: Min Fang, fangmin@sr.gxmu.edu.cn; Yuling Qin, 202120734@sr.gxmu.edu.cn
†These authors have contributed equally to this work and share first authorship