 Huien Zhou1†
 Xinmin Guo
- 1Department of Ultrasound, Guangzhou Red Cross Hospital (Guangzhou Red Cross Hospital of Jinan University), GuangZhou, China
- 2Department of Ultrasound, Tianhe District Maternal and Child Hospital of Guangzhou, GuangZhou, China
Background: To explore the predictive value of placental features in early pregnancy for gestational diabetes mellitus (GDM) using deep and radiomics-based machine learning (ML) applied to ultrasound imaging (USI), and to develop a nomogram in conjunction with clinical features.
Methods: This retrospective multicenter study included 415 pregnant women at 11-13 weeks of gestation from two institutions: the discovery group from center 1 (n=305, control group n=166, GDM group n=139), and the independent validation cohort (n=110, control group n=57, GDM group n=53) from center 2. The 2D USI underwent pre-processed involving normalization and resampling. Subsequently, the study performed screening of radiomics features with Person correlation and mutual information methods. An RBF-SVM model based on radiomics features was constructed using the five-fold cross-validation method. Resnet-50 as the backbone network was employed to learn the region of interest and constructed a deep convolutional neural network (DLCNN) from scratch learning. Clinical variables were screened using one-way logistic regression, with P<0.05 being the threshold for statistical significance, and included in the construction of the clinical model. Nomogram was built based on ML model, DLCNN and clinical models. The performance of nomogram was assessed by calibration curves, area under the receiver operating characteristic curve (AUC) and decision curve analysis (DCA).
Results: The AUCs for the ML model in the discovery cohort and independent validation cohort were 0.91 (0.88-0.94) and 0.86 (0.79-0.93), respectively. And 0.65 (0.59-0.71), 0.69 (0.59-0.79) for the DLCNN, 0.66 (0.59-0.72), 0.66 (0.55-0.76) for the clinical model, respectively. The nomogram exhibited the highest performance with AUCs of 0.93 (0.90-0.95) and 0.88 (0.81-0.94) The receiver operating characteristic curve (ROC) proved the superiority of the nomogram of clinical utility, and calibration curve showed the goodness of fit of the model. The DCA curve indicated that the nomogram outperformed other models in terms of net patient benefit.
Conclusions: The study emphasized the intrinsic relationship between early pregnancy placental USI and the development of GDM. The use of nomogram holds potential for clinical applications in predicting the development of GDM.
1 Introduction
Gestational diabetes mellitus (GDM) is a condition characterized by the onset of diabetes during pregnancy The International Diabetes Federation (IDF) reports an annual increase in the global prevalence of GDM (1). GDM development may elevate the risk of metabolic diseases in both mothers and offspring (2, 3). During GDM pregnancies, thickening of the basement membrane of trophoblast cells, increased release of inflammatory cytokines by placental macrophages, and edema of the interchorionic layer of the villi result in reduced placental perfusion (4). Pregnant women at risk for GDM should undergo early screening to detect and manage the condition in a timely manner (5).However, there are no reliable boundaries to predict the development of GDM. In addition to laboratory tests, various imaging technology techniques are available to assess placental function in early pregnancy, including Uterine Artery Pulsatility Index (UtA-PI), free-breathing Magnetic Resonance Imaging (MRI), and three-dimensional placental imaging. However, the assessment of placental function in the context of placental changes in GDM has not been extensively studied (6–8).
The utilization of ultrasound in artificial intelligence (AI) holds significant potential for development. Ultrasound (US) is extensively employed for disease diagnosis owing to its high safety and efficiency. In recent years, with the widespread adoption of Picture Archiving and Communication System (PACS) systems, ultrasound images can now be digitally stored systematically, facilitating the rapid advancement of artificial intelligence (9).Deep learning and machine learning (ML) techniques enable quantitative analysis of images, extracting a wealth of information (10, 11). For instance, Ultrasound images can assess morphological features of tumors, hemodynamic parameters, and elastic properties of tissues, leading to more accurate predictions for tumor diagnosis and treatment (12).
Recently, there has been considerable focus on placental image analysis in the investigation of GDM. The placenta is a vital organ that plays a crucial role in the development and health of the fetus during pregnancy. GDM disrupts placental functioning, adversely affecting the health of both the fetus and the mother. Analyzing placental texture for early prediction of GDM risk carries significant research background and significance (13–16).Placental texture analysis is a non-invasive method that quantifies the structural characteristics of the placenta by extracting textural features from placental images using computer analysis techniques (17).Furthermore, changes in placental ultrasound images can offer detailed information on placental structure, providing insights into the influence of GDM on placental morphology and tissue structure, and enhancing the understanding of GDM’s pathogenesis (16).Moreover, placental image analysis, with the advantages of non-invasiveness, good reproducibility, and no radiation exposure, can serve as a convenient, safe, and feasible means of clinical assessment. It proves to be an effective tool for monitoring the impact of GDM and forming a foundation for the development of individualized treatment and management strategies. Through early prediction, timely interventions can be taken to control blood glucose levels and reduce the incidence of adverse pregnancy outcomes and child health problems.
In conclusion, the aim of this study is to establish a robust prediction model based on early pregnancy indicators for identifying the occurrence of GDM and guiding clinical practice.
2 Materials and methods
2.1 Inclusion exclusion criteria
Women who underwent early nuchal translucency examinations from January 2021 to October 2023 during pregnancy were retrospectively analyzed. Centre I was located at Guangzhou Red Cross Hospital, and Centre II was based at Tianhe District Maternal and Child Hospital of Guangzhou. In Center 1, 305 pregnant women were enrolled, while Center 2 enrolled 110 pregnant women. Inclusion criteria were: (1) gestational age between 11 + 0 and 13 + 6 weeks; (2) fetal crown-rump length (CRL) between 45 and 84 mm; and (3) singleton pregnancy. Exclusion criteria were: (1) pre-pregnancy diabetes mellitus; (2) a combination of severe cardiovascular, renal, and autoimmune diseases; (3) poor image quality; and (4) incomplete clinical data. The study received approval from the Ethics Committee of Guangzhou Red Cross Hospital and Tianhe District Maternal and Child Hospital of Guangzhou (Figure 1) (2024-023-01).
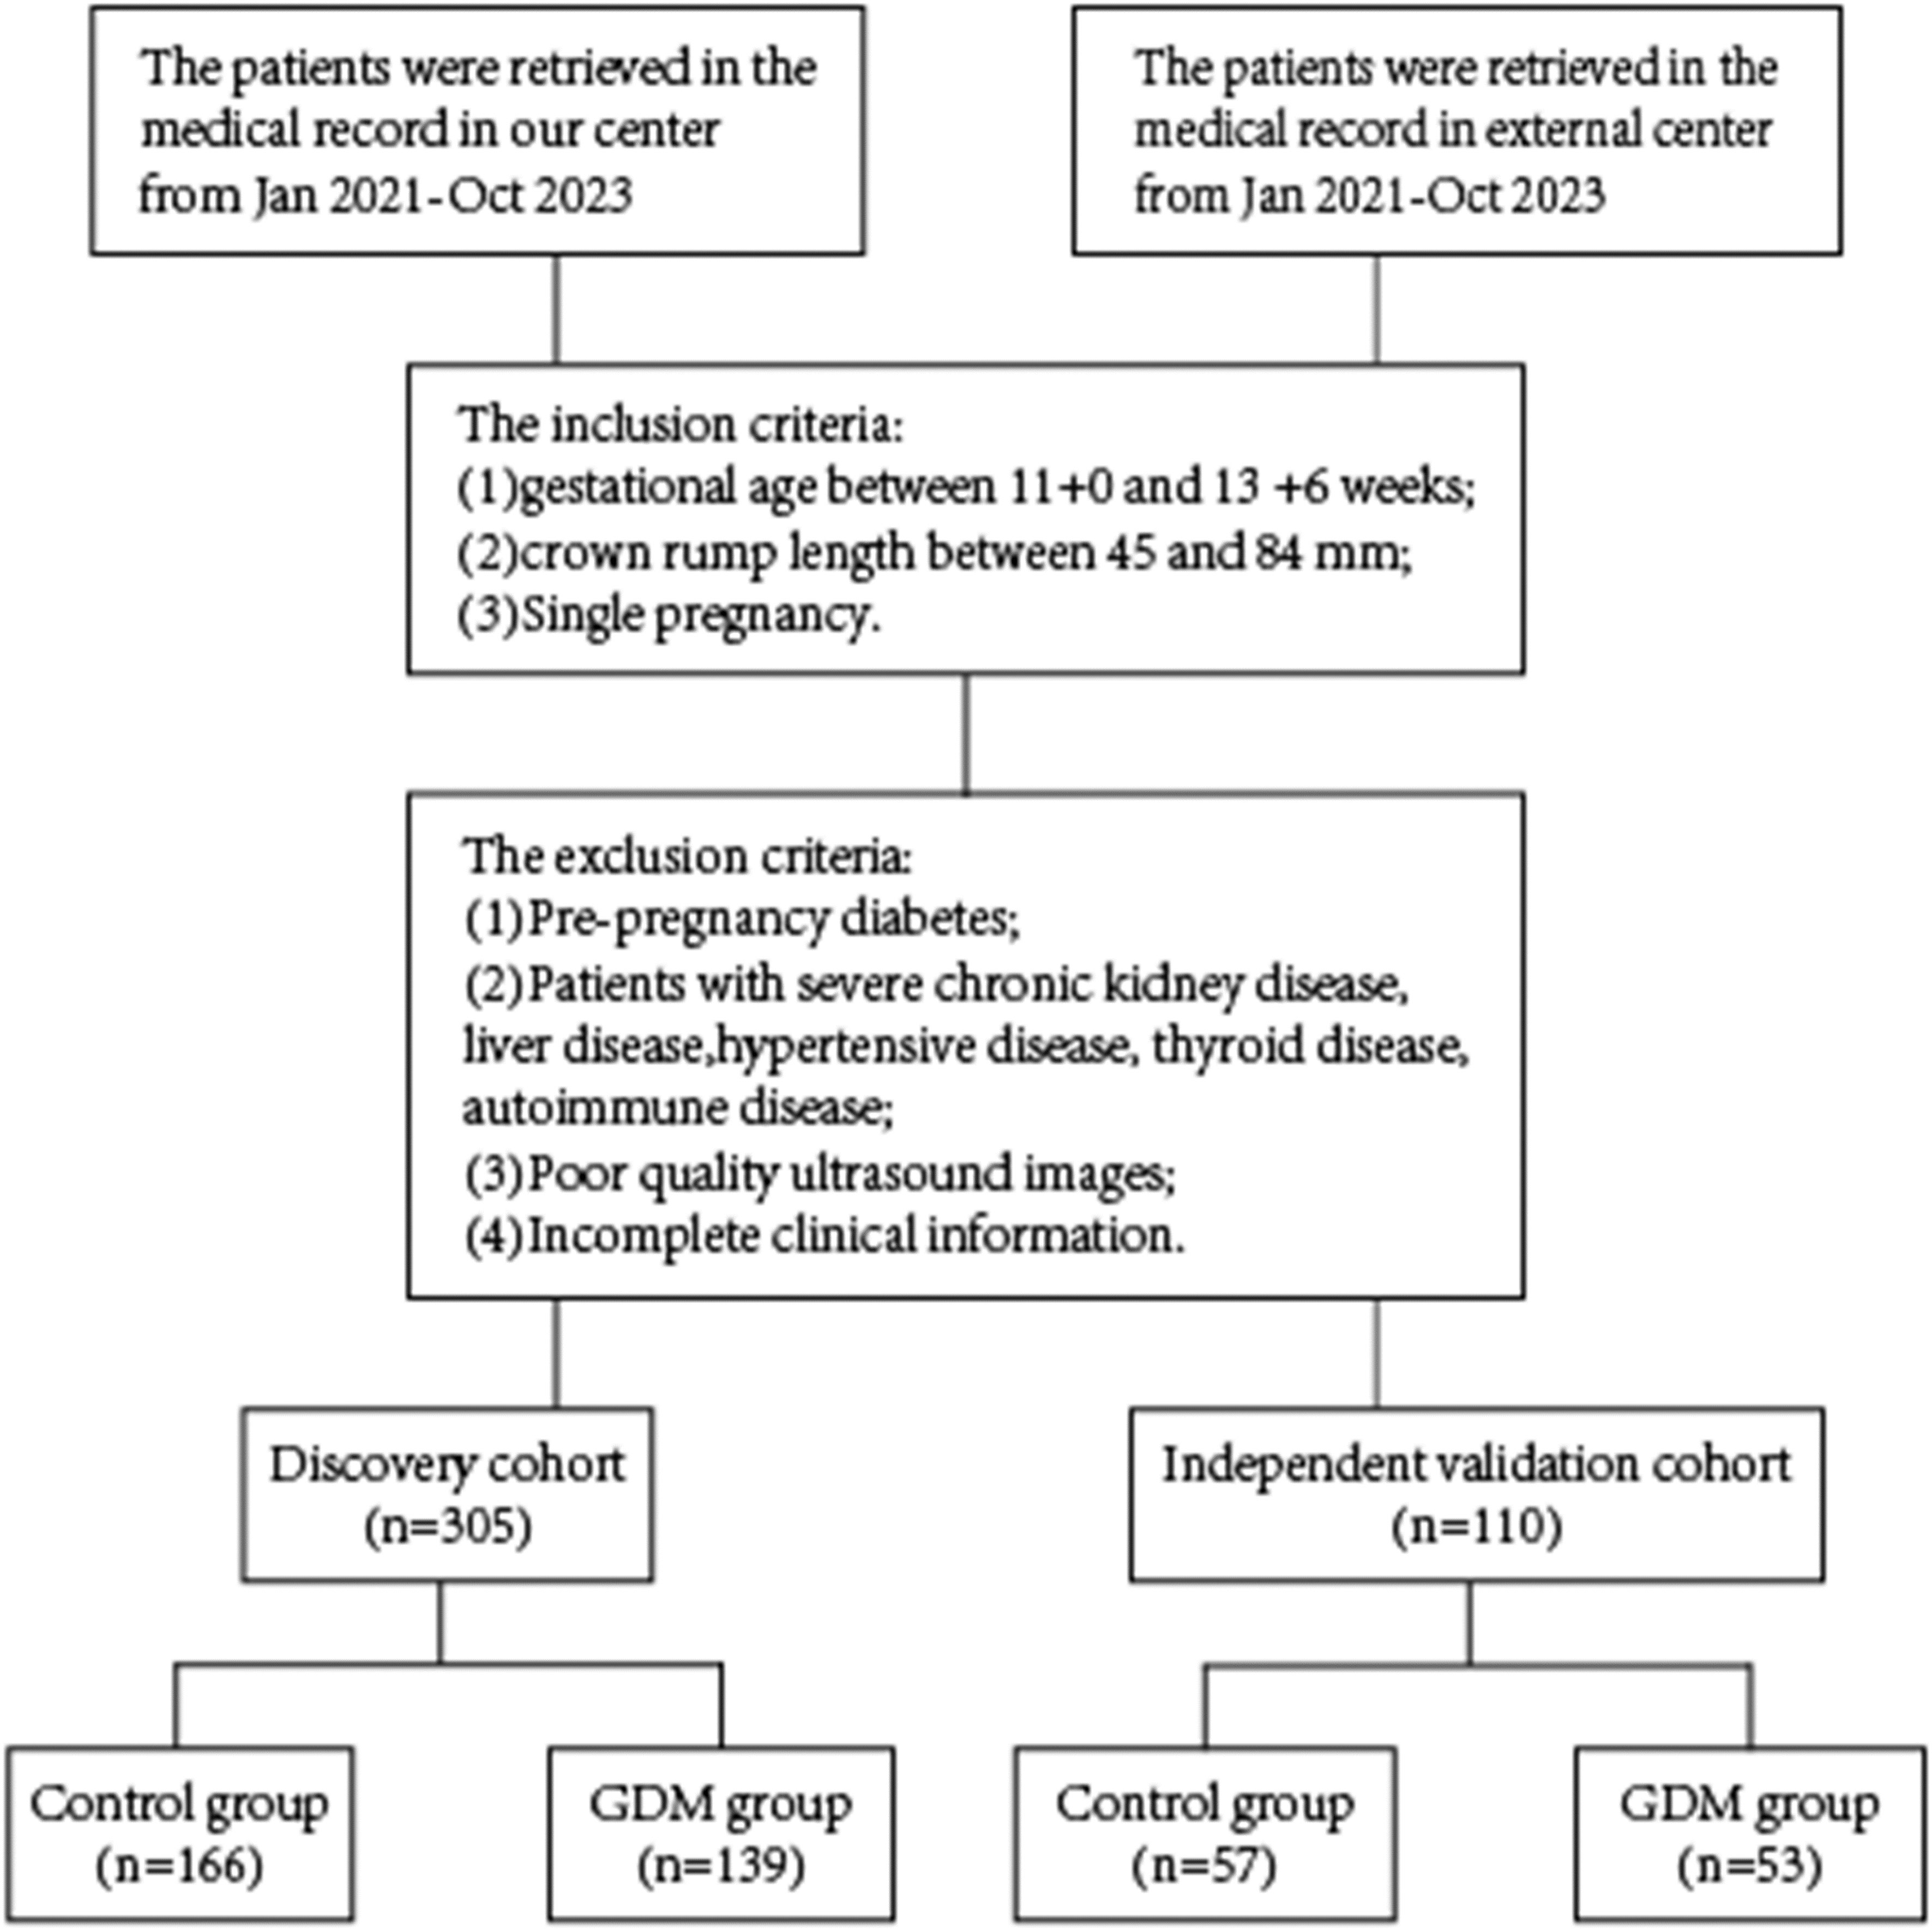
Figure 1 Flowchart for selecting the study population.
2.2 Definition
Pre-pregnancy body mass index (BMI) was obtained from clinical records and calculated by dividing pre-pregnancy weight by the square of the mother’s height. According to the adult weight standards published by the Chinese Ministry of Health, a BMI < 18.5 kg/m² was defined as underweight, 18.5 kg/m² ≤ BMI < 24 kg/m² was defined as normal weight, 24 kg/m² ≤ BMI < 28 kg/m² was defined as overweight, and a BMI ≥ 28 kg/m² was defined as obese (18).
All participants underwent oral glucose tolerance test (OGTT) screening for gestational diabetes mellitus (GDM). Diagnostic criteria were based on the August 2014 revised Chinese criteria. GDM was diagnosed when the results of the OGTT performed between 24 and 28 weeks of gestation met any one or more of the following criteria: 1) fasting blood glucose ≥ 5.1 mmol/L, 2) 1-hour blood glucose ≥ 10.0 mmol/L, and 3) 2-hour blood glucose ≥ 8.5 mmol/L (19).
2.3 Regions of interest outlining and radiomics features extraction
In Center 1, Voluson E8, Voluson E10, and HITACHI HV VISION Preirus ultrasound machines, all equipped with 2-5 MHz convex array probes, were utilized. In Center 2, the SAMSUNG WS80A ultrasound machine with a 2-5 MHz convex array probe was employed. Ultrasound scanning adhered to ISUOG practice guidelines.
Ultrasound images of the placenta were obtained during routine early pregnancy antenatal ultrasound examinations. Maximal section images of the placenta were captured, and placental thickness was measured. The images were then saved, and ultrasound images stored in the diagnostic ultrasound system were exported in Joint Photographic Experts Group (JPEG) format for subsequent analysis (20).
2.4 Ultrasound images
ROIs were outlined by a physician with 5 years of experience in gynecological ultrasound. ROIs were defined along the edges of the uterus, encompassing the placenta, myometrium, amniotic fluid, and fetal tissues. A senior physician with 10 years of experience in gynecological ultrasound completed the review. In cases of disagreement between the two physicians, resolution was achieved through negotiation. Importantly, the sonographer responsible for outlining and reviewing had no knowledge of the patient’s ultrasound report or pathological details.
Before extracting radiomics features from the ultrasound images, pre-processing steps were undertaken. This involved discretizing image pixels into 30 bandwidth ranges, resampling the image to a 1×1mm² range size, and normalizing image pixels. Various feature types were extracted, encompassing 2D shape features characterizing geometric parameters, intensity features for pixel grey levels, and grey level co-occurrence matrices (GLCM), grey level size zone matrices (GLSZM), grey level run length matrices (GLRLM), neighboring grey tone difference matrices (NGTDM) and grey level dependence matrices (GLDM) characterizing image texture. In addition to the original features, texture features processed by various filtering methods were also extracted. These included Laplacian of Gaussian (LoG), Wavelet, Square, Square root, Logarithm, Exponential, Gradient, and Local Binary Pattern 2D (LBP2D).
2.5 Feature screening and ML model construction
Feature screening was conducted on the Discovery cohort. Before screening, the radiomics were normalized to the z-score range (Equation 1). This normalization aimed to eliminate potential effects caused by differences in data magnitudes and to enhance the convergence and computation speed of the model.
Given the potential impact of high feature correlation on model generalization performance, features were initially assessed using the Pearson correlation test, and those with r > 0.9 were excluded. To evaluate interdependence, the mutual information method, a filtered feature screening approach, was employed. Features with higher mutual information provide more valuable information, reflecting both linear and non-linear relationships.
Considering the dataset’s size, the Radial Basis Function kernel Support Vector Machine (RBF-SVM) is known for its good performance with small-scale data. Therefore, it was selected as the classifier for modeling and validating the radiomics features dataset. Model parameters were tuned and assessed on the discovery cohort using a five-fold cross-validation method. Subsequently, the generalization performance of the well-trained model was evaluated using an independent validation cohort.
2.6 DLCNN construction
Before constructing the deep learning model, we algorithmically extracted the lesion region of interest to maximize the model’s ability to learn valid information in the ROIs. Resnet50 served as the backbone network, and we employed a learning-from-scratch strategy by resizing the image to 224×224 pixels and normalizing it. To mitigate overfitting, multiple data augmentation were applied, including random horizontal flip, random vertical flip, random rotation, random grayscale transformation, and transformation of image attributes (brightness, contrast, saturation, and hue).
Upon training, optimal hyperparameters were determined: Batch size of 128, Epochs of 500, Learning rate of 3e-4, Loss function of cross-entropy, Optimizer of Adaptive Moment Estimation (Adam) with β1 of 0.9, β2 of 0.999, epsilon of 1e-8, and weight decay of 0.01. L2 regularization was increased to prevent overfitting.
2.7 Clinical modelling and nomogram construction
One-way logistic regression was used to assess valuable clinical variables on the discovery cohort, P< 0.05 was considered statistically different and thus included in the logistic regression model for the construction of the clinical model.
Nomogram was constructed based on the combination of ML model of radiomics, DLCNN and clinical model. The model’s goodness of fit P >0.05 was considered that nomogram had a good degree of fit in terms of actual observations and predicted probabilities directly.
Figure 2 illustrates the process of studying image segmentation and analysis used in this study.
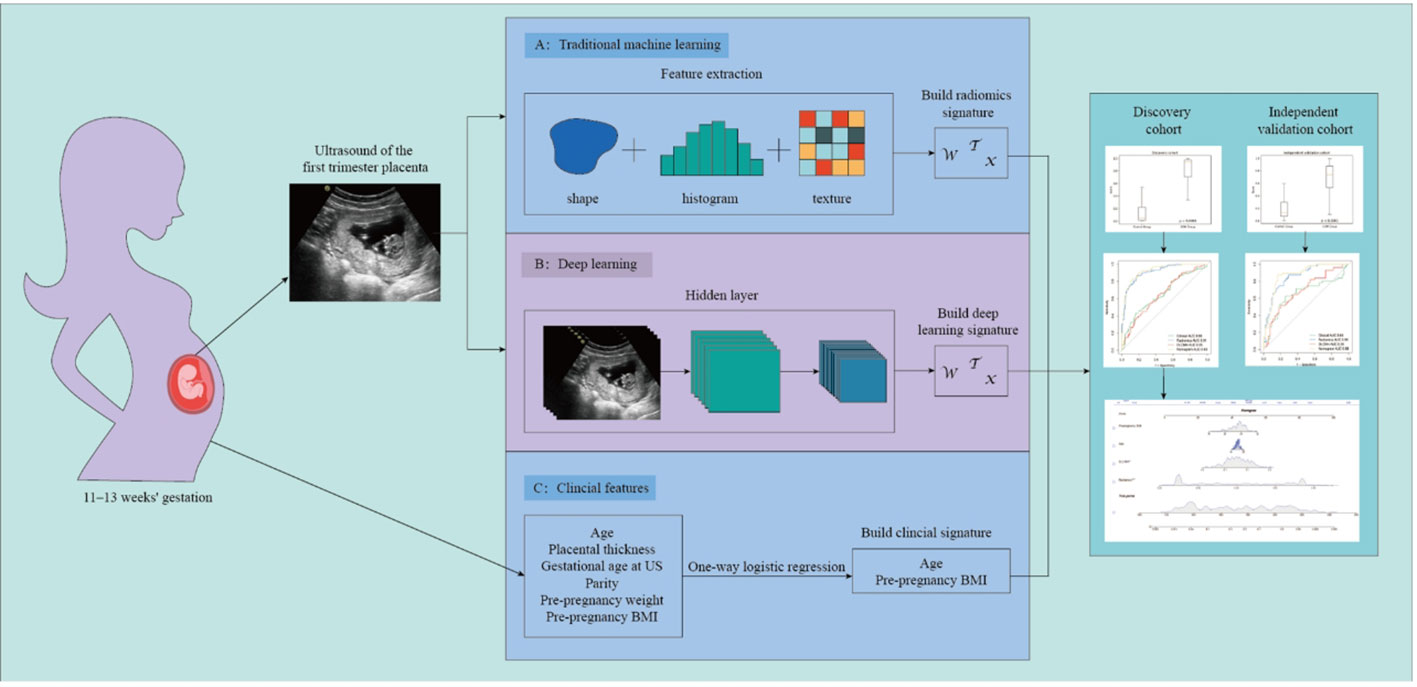
Figure 2 Workflow of this study.
2.8 Statistical analysis
Statistical analyses were conducted using R software (version 4.2.2, https://www.r-project.org/). For continuous variables, the Shapiro-Wilk test was employed for distribution tests. If the data adhered to a normal distribution, parametric tests were utilized; otherwise, non-parametric tests were applied. Categorical variables were analyzed using the chi-square test or Fisher’s exact test (if applicable). Results for categorical and continuous variables were presented as frequencies (percentages), mean ± standard deviation, or median (interquartile range), as appropriate. Effect size and sample size were calculated by statistical methods. f=0.4, a=0.05, 1-β=0.8, and the required sample size was 52 people.
The predictive performance of the model was assessed using AUC and its 95% confidence interval. Target area outlining, radiomics features extraction, feature screening, and ML model construction were carried out using the open-source toolkit OpenCV (version 4.8.1, https://opencv.org/), PyRadiomics (version 3.1.0, https://pyradiomics.readthedocs.io/), and Scikit-learn (version 1.0.2, https://scikit-learn.org/). Deep convolutional network modeling was implemented based on the PyTorch framework (version 1.13.0, https://pytorch.org/).
3 Results
3.1 Clinical baseline and clinical model construction
A total of 415 patients were enrolled, with 305 in the Discovery cohort and 110 in the Independent Validation cohort. Baseline demographic characteristics, including Age, Placental thickness in early pregnancy, NT gestational week, Parity, Pre-pregnancy weight, Pre-pregnancy BMI, and others, are presented in Table 1. No significant differences were observed between the two groups in early pregnancy placental thickness, NT test gestational week, parity, and pre-pregnancy weight (P > 0.05).
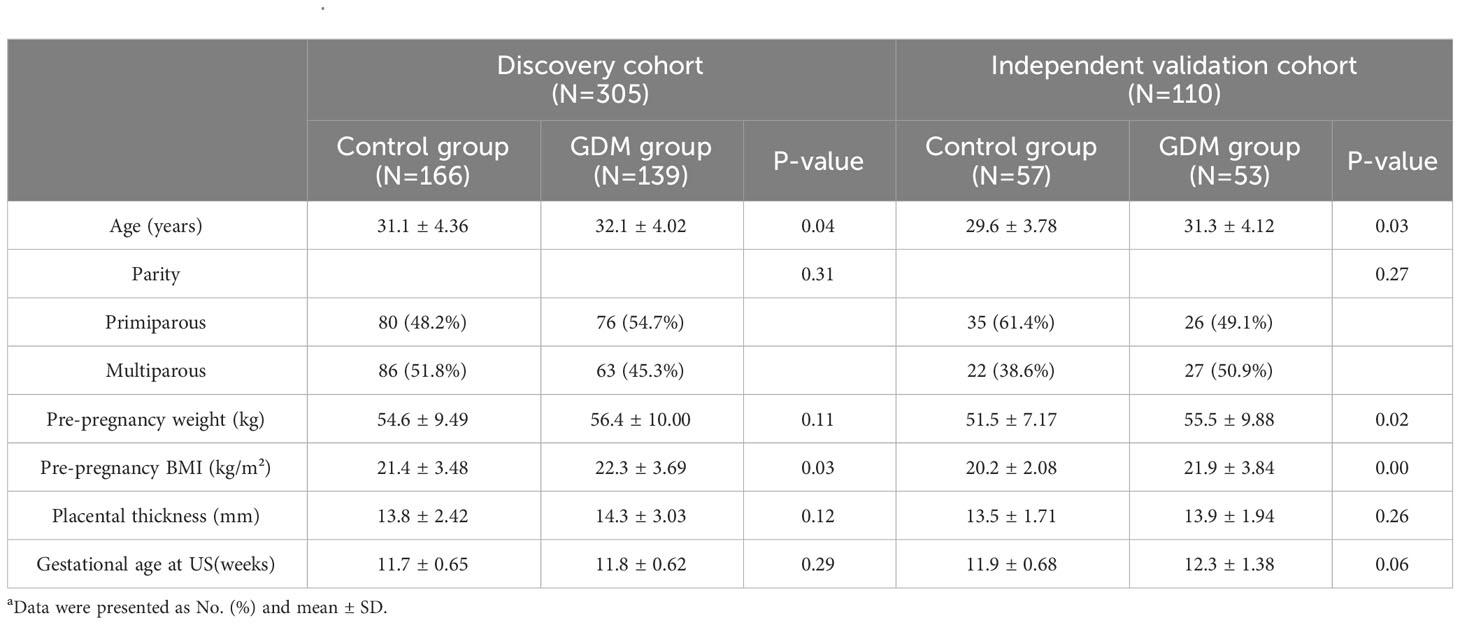
Table 1 Patient characteristicsa.
Results from one-way logistic regression analysis indicated significant differences in age and pre-pregnancy BMI between the groups (P< 0.05). The GDM group exhibited higher age and pre-pregnancy BMI, leading to their inclusion in the multifactorial logistic regression model for constructing the clinical model. The AUC, sensitivity, specificity, and accuracy of the clinical model for the Discovery cohort were 0.66 (95% CI 0.59-0.72), 0.44, 0.83, 0.65, and 0.54, respectively. In the Independent Validation cohort, these metrics were 0.66 (95% CI 0.55-0.76), 0.27, 0.93, 0.59, and 0.40, respectively.
3.2 Feature screening and model building and validation
Figure 3 illustrates the ROC curves for the Discovery cohort and Independent Validation cohort. The DCAs of the four models are shown in Figure 4, and Table 2 presents the diagnostic performance of each model.
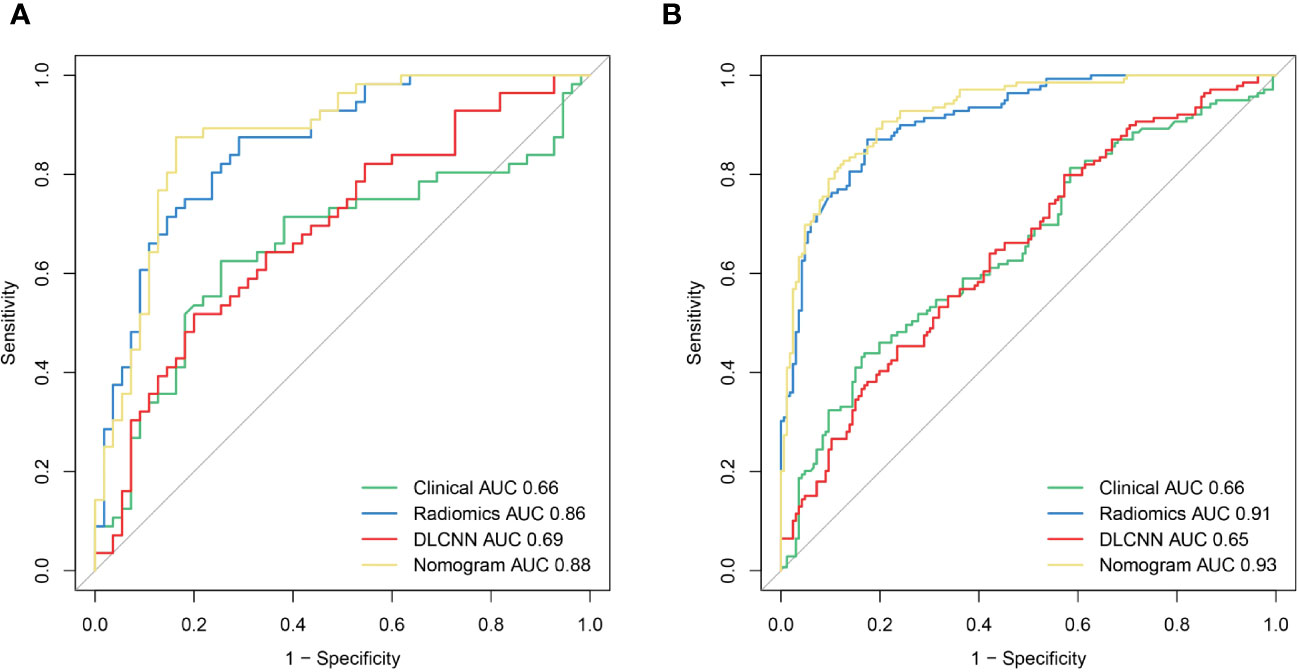
Figure 3 The ROCof the Clinical model, Radiomics model, DLCNN model, and Nomogram model in the training (A) and validation (B) cohorts, respectively.
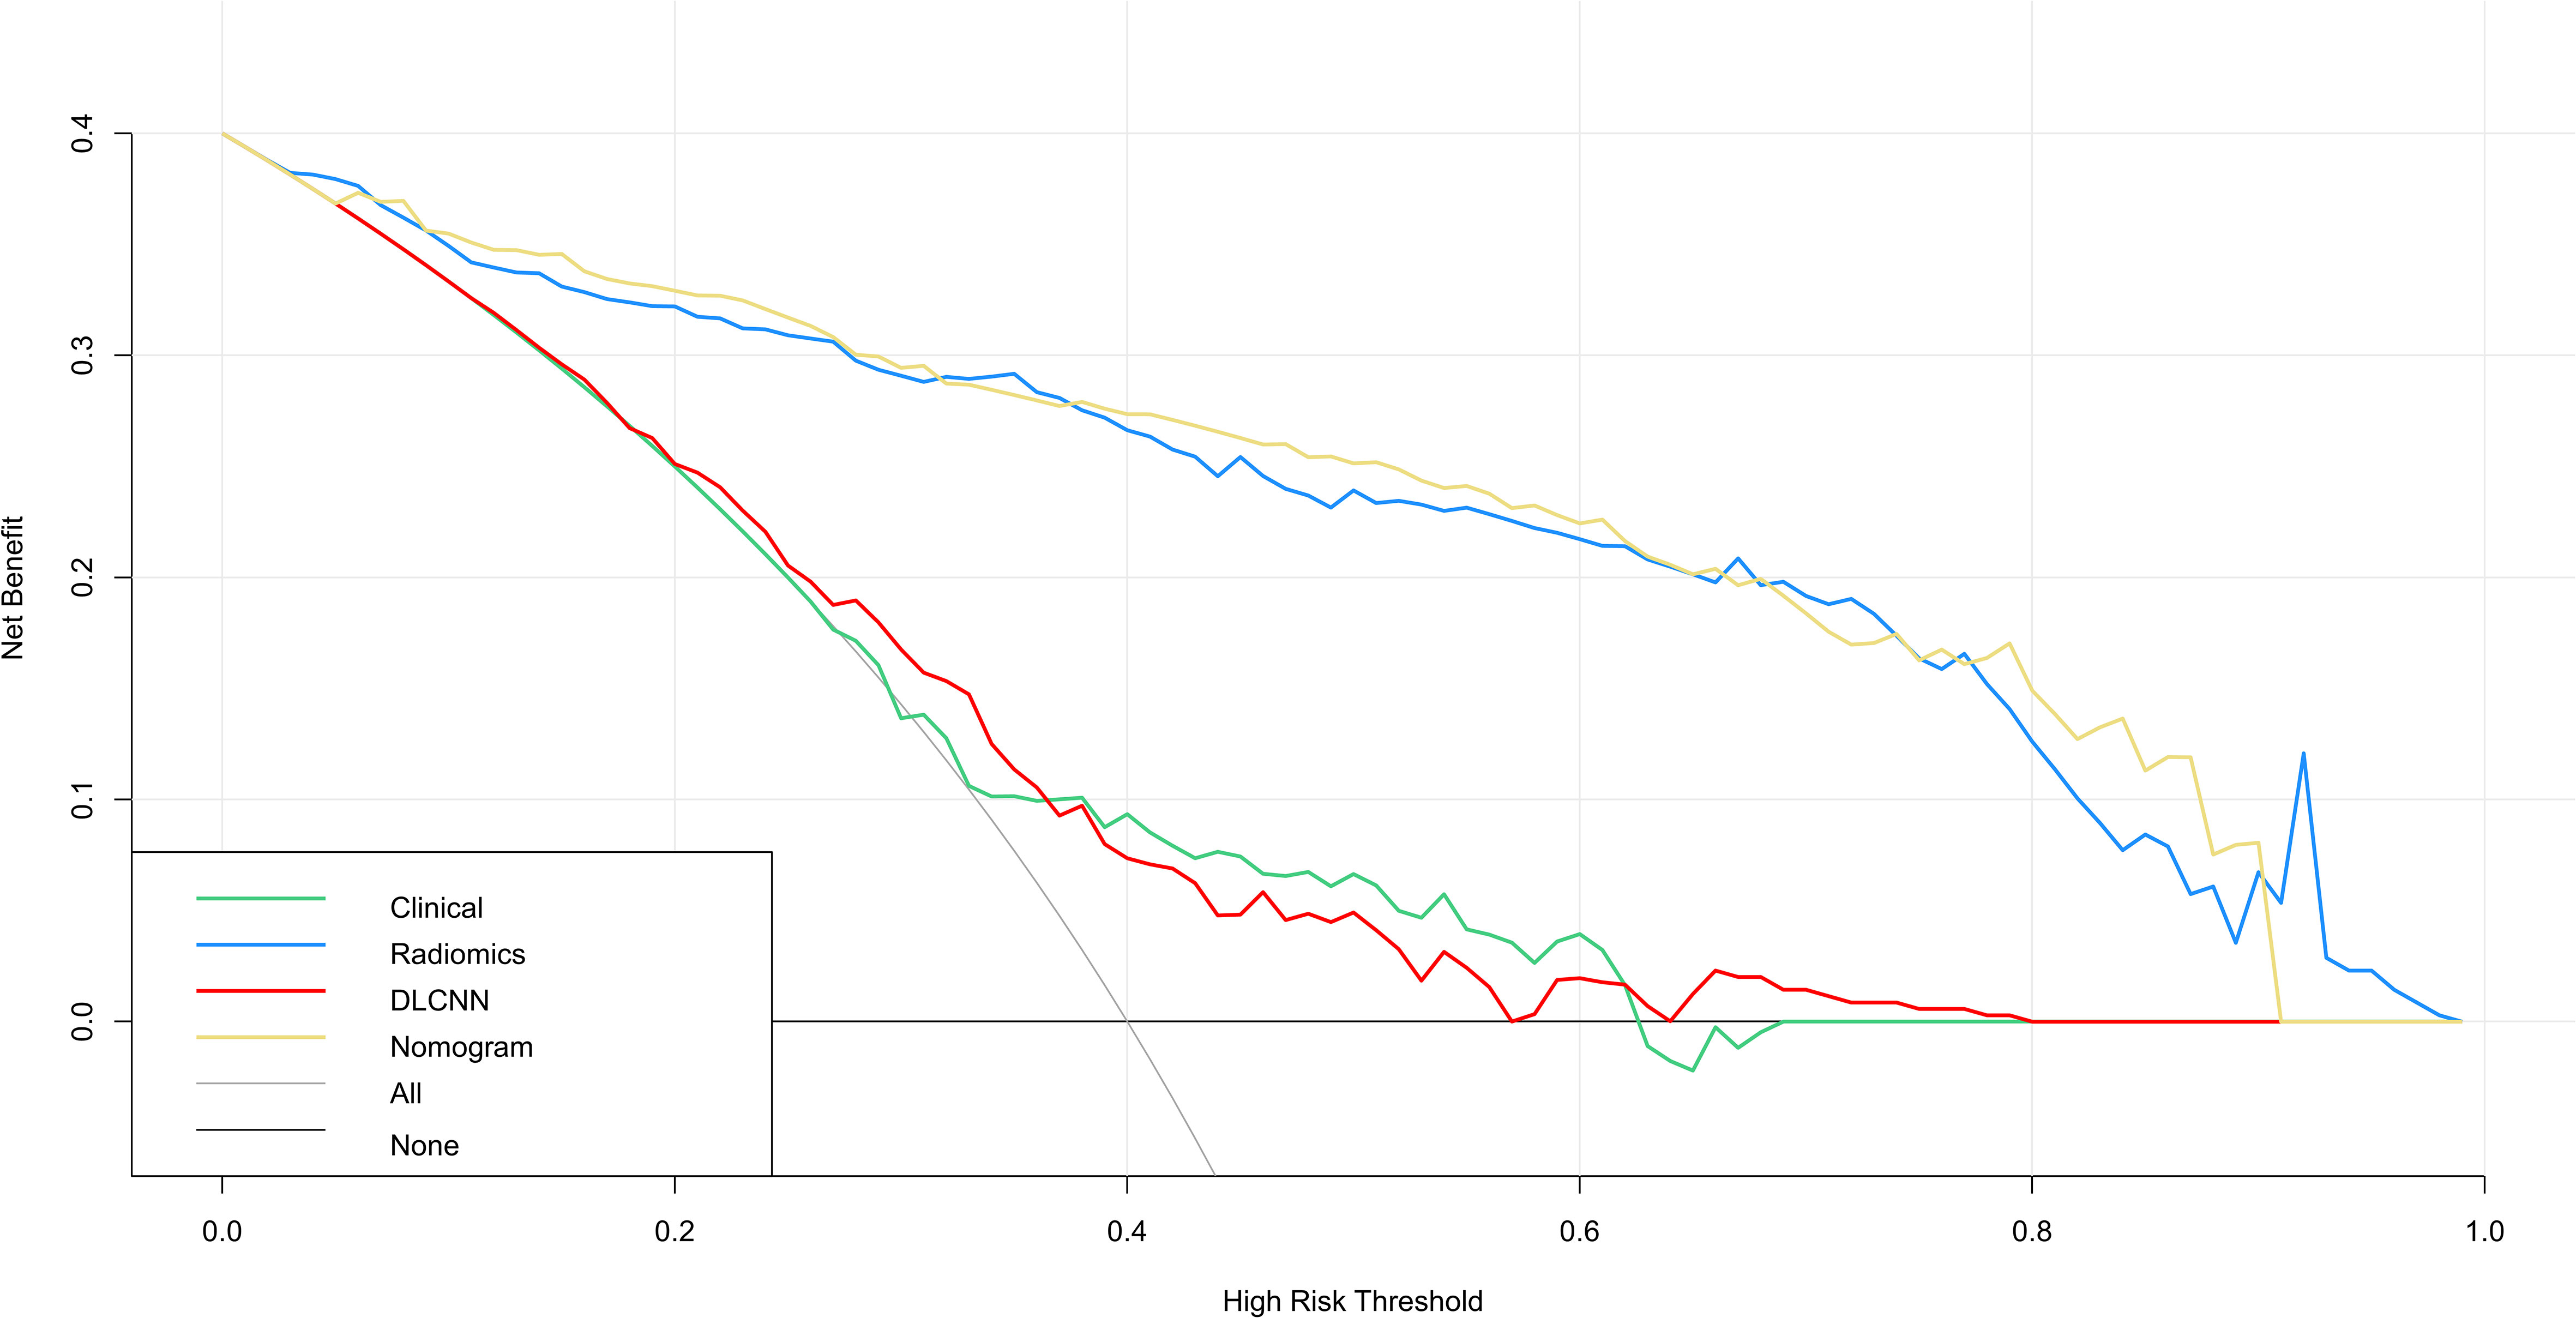
Figure 4 DCA for four models predicting GDM. The graphs show that the nomogram model has the greatest net benefit.
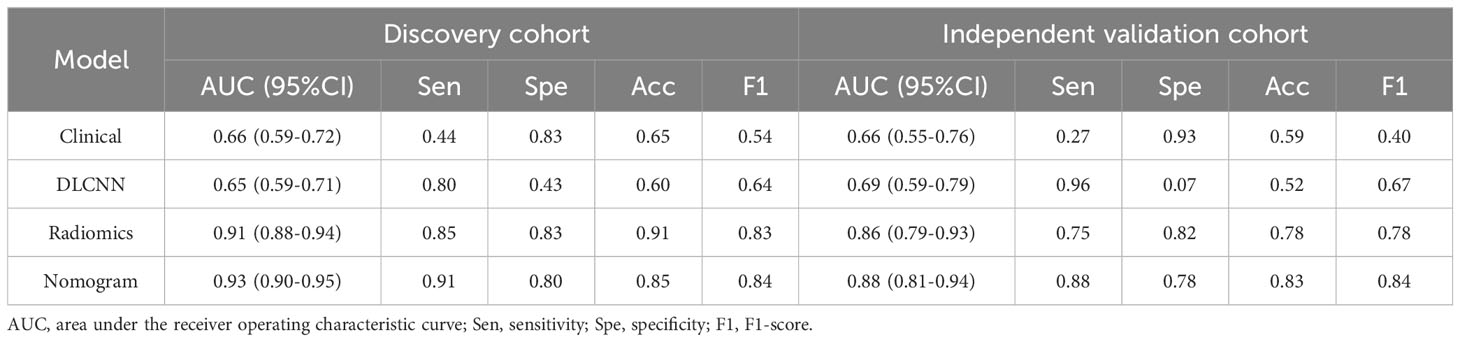
Table 2 Diagnostic performance of different models for predicting GDM in training and test cohorts.
A total of 1311 ultrasound radiomics features were extracted, categorized into 252 FirstOrderStatistics, 336 GLCM, 196 GLDM, 224 GLRLM, 224 GLSZM, 70 NGTDM, and 9 Shape-based (shape2D).
Using the person correlation coefficient and mutual information as filtered feature selection methods, 38 features with predictive value were selected to build the ML model. These included one Shape-based feature, 12 FirstOrderStatistics, 15 Glcm, 3 Gldm, 2 Glrlm, and 6 Ngtdm. Employing the RBF-SVM to construct the model, the AUC, sensitivity, specificity, and accuracy for the Discovery cohort were 0.91 (95% CI 0.88-0.94), 0.85, 0.83, 0.91, and 0.83, respectively. In the Independent Validation cohort, these metrics were 0.86 (95% CI 0.79-0.93), 0.75, 0.82, 0.78, and 0.78, respectively.
For the Resnet50 model, the AUC, sensitivity, specificity, and accuracy in the Discovery cohort were 0.65 (95% CI 0.59-0.71), 0.80, 0.43, 0.60, and 0.64, respectively. In the Independent Validation cohort, these metrics were 0.69 (95% CI 0.59-0.79), 0.96, 0.07, 0.52, and 0.67, respectively.
Additionally, we evaluated a nomogram combining ML, DLCNN, and clinical model (Figure 5A). Figure 5B and Figure 5C shows the consistency of predicted and observed probabilities between the Discovery cohort and Independent Validation cohort nomogram models. In the Discovery cohort, the nomogram exhibited the highest discrimination with AUCs of 0.951 (95% CI 0.87-1.00) and 0.893 (95% CI 0.75-0.97) for the Discovery and Independent Validation cohorts, respectively. Sensitivities were 0.91 and 0.80, specificity 0.88 and 0.78, and accuracy 0.85 and 0.83, respectively. The DCAs show that the nomogram model has the greatest net benefit.
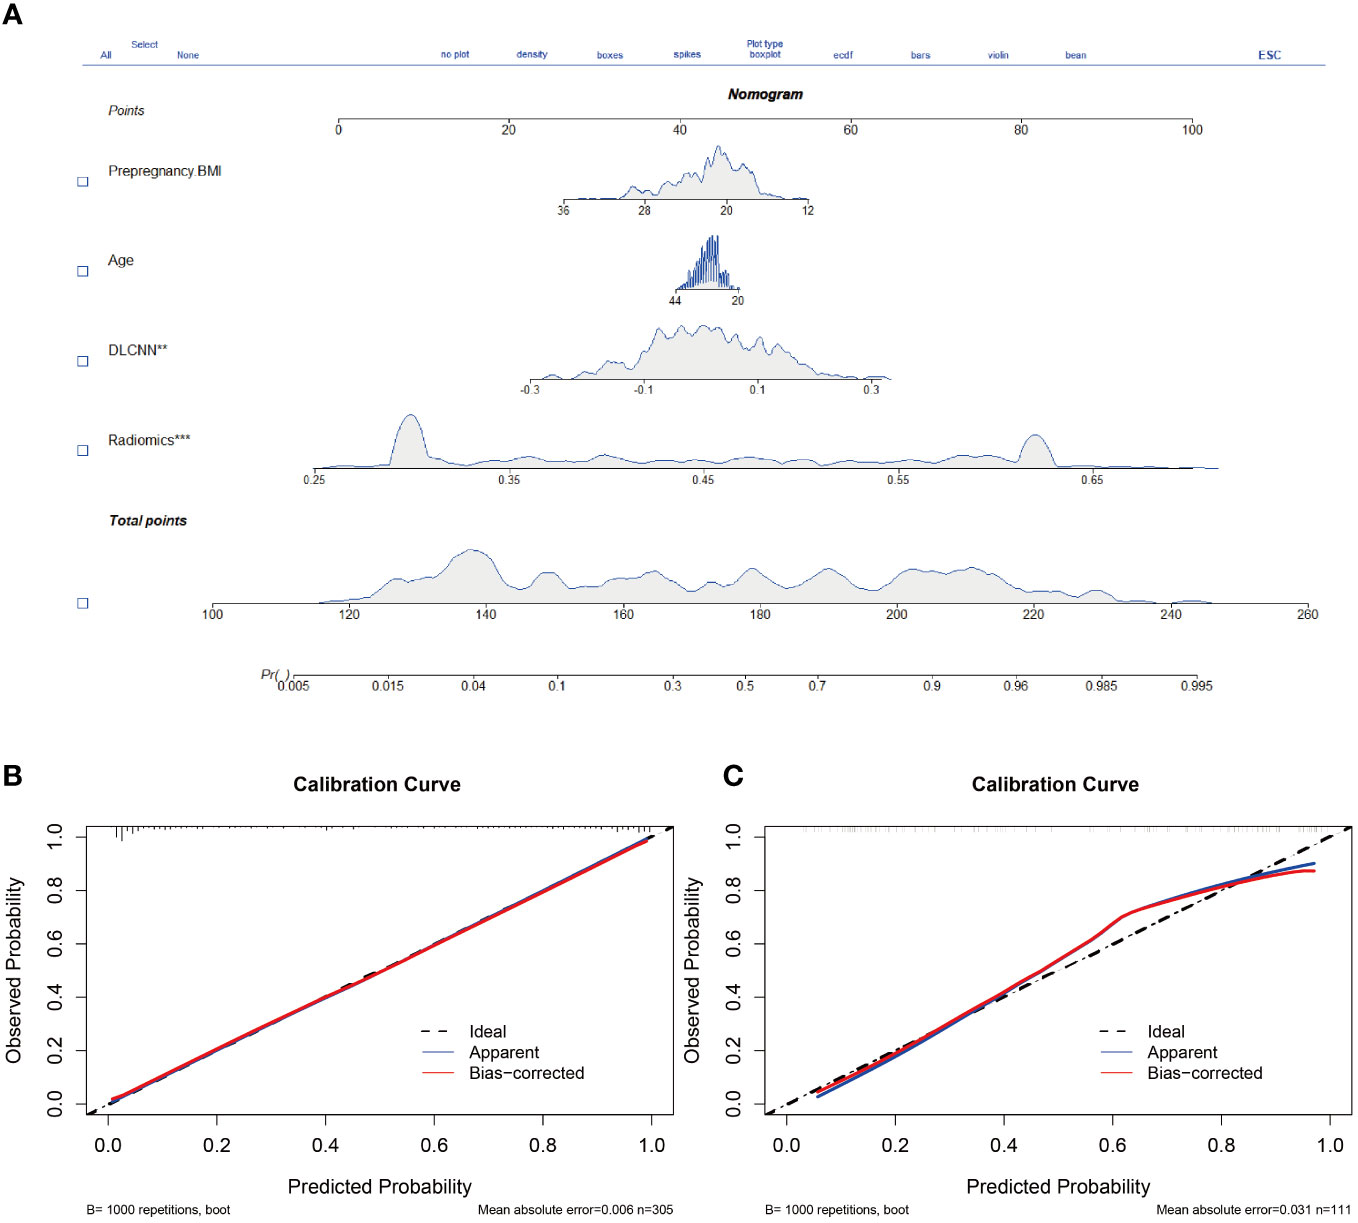
Figure 5 Nomogram and calibration curves. (A) The nomogram, combining Pre-pregnancy BMI、age、DLCNN score and Rad-score, was developed in Discovery cohort. (B, C) The nomogram calibration curves in Discovery cohort (B) and Independent validation cohort (C). Calibration curves indicate the goodness-of-fit of the model. ** means p<0.01. *** means p<0.001.
4 Discussion
The field of Artificial Intelligence is developing rapidly, and its advantages in the field of medical image recognition and processing continue to emerge and are gradually being used in all aspects of obstetrics and gynaecology (21, 22). Our study establishes a nomogram that incorporates two clinical factors, radiomics features, and DLCNN. This nomogram yielded a higher AUC than a single model, demonstrating its excellent clinical application. It can further aid in treatment decisions and improve clinical outcomes.
Advanced age during pregnancy is a widely recognized major risk factor for GDM. This study revealed that maternal age was higher in the GDM group than in the non-GDM group. Maternal age was subsequently included in the ROC analysis (23). A systematic evaluation and meta-analysis of over 120 million participants indicated a linear relationship between GDM risk and maternal age. Another study demonstrated that the risk of GDM increases with age, with a 12.5 percent rise in GDM risk for each additional year of age (24). This aligns with the findings of our study. We hypothesize that as pregnant women age, their body’s metabolic capacity decreases, leading to insufficient insulin secretion and pancreatic β-cell hypofunction (25).
Additionally, obesity is a recognized risk factor for GDM. The results of this study showed that the pre-pregnancy BMI of pregnant women with GDM was higher than that of pregnant women with normal pregnancies. Maria Mirabelli et al. found that maternal pre-pregnancy obesity was associated with almost three times the risk of GDM (26). M. R. Torloni demonstrated that the prevalence of GDM increased with BMI, and the risk of GDM was positively correlated with pre-pregnancy BMI (27). J. Ogonowski concluded that the risk of GDM increases not only in overweight but also in normal-weight women, making pre-pregnancy BMI a predictor of gestational diabetes (28). Therefore, controlling pre-pregnancy BMI and managing weight gain during pregnancy are crucial, and effective preventive interventions for weight must commence as early as possible.
Advanced age and pre-pregnancy obesity are identified as risk factors, but their accuracy in predicting GDM is unsatisfactory. In this study, we investigated the relationship between placental ultrasound images in early pregnancy and the development of GDM. We found that nomogram for predicting the development of GDM, are potentially useful for clinical applications. This finding may be related to a series of changes in placental texture characteristics in pregnant women with GDM that occur early in pregnancy. Many studies have shown that placental morphology undergoes changes in early pregnancy, including alterations in surface area and volume, as well as histological changes such as an increased volume of the interstitium and terminal villi of the villous structure, placental vascular function, and vascular lesions, the number of syncytiotrophoblast junctions, fibrillar areas, and glycogen deposition (5, 29).
Obinna et al. demonstrated that the GLCM, GLRLM, and histogram parameters were able to differentiate between normal and abnormal placental tissue by analyzing the textural features of 500 ultrasound placental images (p-value < 0.05) (15).Hongshuang Sun MD et al. developed a model to distinguish placental features in ultrasound images of GDM patients and healthy pregnant women, confirming significant changes in abnormal placental features during diabetic pregnancy (10). The results consistently showed that ML and deep learning can effectively distinguish the textural features of the placenta in early pregnancy in patients with GDM, which is an important diagnostic marker for predicting GDM.
Currently, OGTT stands as the gold standard for diagnosing GDM. Consequently, GDM is typically identified during the middle and late stages of pregnancy. Unfortunately, by this point, the risk of hyperglycemia to both the mother and fetus becomes irreversible. Gestational Diabetes Australia recommends screening for GDM in high-risk women before 24 weeks of gestation, aiming for early diagnosis and control of normoglycemia in pregnant women to minimize adverse outcomes (30). However, this recommendation lacks robust supporting evidence. Therefore, it becomes imperative to develop reliable prediction models in early pregnancy to identify high-risk pregnant women for GDM.
Between 11 and 14 weeks of gestation in GDM, three-dimensional ultrasound failed to reveal significant differences in placental volume (31). However, M. Şengül’s study, investigating real-time placental strain elastography in early pregnancy, identified the placental strain ratio as an independent risk factor for GDM development (32). It showed that gestational diabetic patients exhibited higher placental stiffness, suggesting a series of changes in the pathological histology and morphological structure of the placenta during early pregnancy (33). These alterations may lead to functional changes in the placenta, impacting the health of both the pregnant woman and the fetus (34).
Predicting GDM risk in pregnant women by identifying early pregnancy placental features through radiomics and deep learning methods could enable interventions and lifestyle changes to prevent GDM development (35). This approach also provides clinicians with sufficient time to formulate appropriate therapeutic strategies, reducing the harm associated with GDM or preventing its occurrence. However, our study has limitations. The fundamental requirement of artificial intelligence is learning from a large dataset. The small sample size in this study, may explain the low specificity, as a limited dataset fails to capture the diversity and heterogeneity present in the placenta. Additionally, exploring multimodal data to analyze placental heterogeneity and assess function more precisely is crucial. In future studies, we will further implement multi-center, large-sample clinical trials.
In conclusion, our study not only developed an effective model for differentiating placental features in ultrasound images of GDM patients and healthy pregnant women but also confirmed significant changes in abnormal placental features during early diabetic pregnancy. Obtaining information about placental function holds vital ancillary value for diagnosing and treating gestational diabetes. This advanced modeling approach opens opportunities, suggesting that future research should focus on providing models that offer both the physiological features of a normal pregnancy and aid in clinical decision-making quickly and efficiently.
Data availability statement
The raw data supporting the conclusions of this article will be made available by the authors, without undue reservation.
Ethics statement
The studies involving humans were approved by Guangzhou Red Cross Hospital Ethics Committee. The studies were conducted in accordance with the local legislation and institutional requirements. Written informed consent for participation was not required from the participants or the participants’ legal guardians/next of kin in accordance with the national legislation and institutional requirements.
Author contributions
HZ: Writing – original draft. WC: Writing – review & editing. CC: Writing – review & editing. YZ: Writing – review & editing. JC: Writing – review & editing. JL: Writing – review & editing. KH: Writing – review & editing. XG: Writing – original draft.
Funding
The author(s) declare financial support was received for the research, authorship, and/or publication of this article. This work was supported by the Guangzhou Basic Research Program Jointly Funded by Universities and Municipalities (grant numbers 202201020526).
Acknowledgments
We thank Guangzhou Red Cross Hospital of Jinan University and Tianhe District Maternal for providing the case, it makes the study perfect and statistically significant. We also thanks the patients for cooperating with the examination. We are particularly grateful to the authors of my references, who provided evidence and gave me ideas. Thanks are also due to you for your review and correction.
Conflict of interest
The authors declare that the research was conducted in the absence of any commercial or financial relationships that could be construed as a potential conflict of interest.
Publisher’s note
All claims expressed in this article are solely those of the authors and do not necessarily represent those of their affiliated organizations, or those of the publisher, the editors and the reviewers. Any product that may be evaluated in this article, or claim that may be made by its manufacturer, is not guaranteed or endorsed by the publisher.
References
1. Aschner P, Karuranga S, James S, Simmons D, Basit A, Shaw JE, et al. The International Diabetes Federation’s guide for diabetes epidemiological studies. Diabetes Res Clin Pract. (2021) 172:108630. doi: 10.1016/j.diabres.2020.108630
2. Kim C, Harrall KK, Glueck DH, Needham BL, Dabelea D. Gestational diabetes mellitus, epigenetic age and offspring metabolism. Diabetic Med. (2022) 39:e14925. doi: 10.1111/dme.14925
3. Davies M, van Houten CS, Bengtsson J, Elsenburg LK, Kragelund Nielsen K, Andersen GS, et al. Childhood adversity and the risk of gestational diabetes: A population-based cohort study of nulliparous pregnant women. Diabetic Med. (2023) 41(1):e15242. doi: 10.1111/dme.15242
4. Jarmuzek P, Wielgos M, Bomba-Opon D. Placental pathologic changes in gestational diabetes mellitus. Neuroendocrinol Lett. (2015) 36:101–5.
5. Bhattacharya S, Nagendra L, Krishnamurthy A, Lakhani OJ, Kapoor N, Kalra B, et al. Early gestational diabetes mellitus: Diagnostic strategies and clinical implications. Med Sci. (2021) 9:59. doi: 10.3390/medsci9040059
6. Altorjay Á.T., Surányi A, Nyári T, Németh G. Use of placental vascularization indices and uterine artery peak systolic velocity in early detection of pregnancies complicated by gestational diabetes, chronic or gestational hypertension, and preeclampsia at risk. Croatian Med J. (2017) 58:161. doi: 10.3325/cmj.2017.58.161
7. Han Z, Zhang Y, Li X, Chiu W-H, Yin Y, Hou H. Investigation into the predictive potential of three-dimensional ultrasonographic placental volume and vascular indices in gestational diabetes mellitus. Front Endocrinol. (2021) 12:689888. doi: 10.3389/fendo.2021.689888
8. Lee B, Janzen C, Wu H, Vangala SS, Devaskar SU, Sung K. Utility of in vivo magnetic resonance imaging is predictive of gestational diabetes mellitus during early pregnancy. J Clin Endocrinol Metab. (2023) 108:281–94. doi: 10.1210/clinem/dgac602
9. Shen Y-T, Chen L, Yue W-W, Xu H-X. Artificial intelligence in ultrasound. Eur J Radiol. (2021) 139:109717. doi: 10.1016/j.ejrad.2021.109717
10. Sun H, Jiao J, Ren Y, Guo Y, Wang Y. Model application to quantitatively evaluate placental features from ultrasound images with gestational diabetes. J Clin Ultrasound. (2022) 50:976–83. doi: 10.1002/jcu.23233
11. Wang Y, Liu F, Wu S, Sun K, Gu H, Wang X. CTA-based radiomics and area change rate predict infrarenal abdominal aortic aneurysms patients events: A multicenter study. Acad Radiol. (2024) S1076-6332(24)00017-5. doi: 10.1016/j.acra.2024.01.017
12. Zhang L, Sun K, Shi L, Qiu J, Wang X, Wang S. Ultrasound image–based deep features and radiomics for the discrimination of small fat-poor angiomyolipoma and small renal cell carcinoma. Ultrasound Med Biol. (2023) 49:560–8. doi: 10.1016/j.ultrasmedbio.2022.10.009
13. Ghorayeb SR, Bracero LA, Blitz MJ, Rahman Z, Lesser ML. Quantitative ultrasound texture analysis for differentiating preterm from term fetal lungs. J Ultrasound Med. (2017) 36:1437–43. doi: 10.7863/ultra.16.06069
14. Gupta K, Balyan K, Lamba B, Puri M, Sengupta D, Kumar M. Ultrasound placental image texture analysis using artificial intelligence to predict hypertension in pregnancy. J Maternal-Fetal Neonatal Med. (2022) 35:5587–94. doi: 10.1080/14767058.2021.1887847
15. Abonyi OE, Idigo UF, Anakwue CA-M, Agbo AJ, Ohagwu CC. Texture analysis of sonographic image of placenta in pregnancies with normal and adverse outcomes, a pilot study. Radiography. (2023) 29:14–8. doi: 10.1016/j.radi.2022.09.008
16. Arora U, Sengupta D, Kumar M, Tirupathi K, Sai MK, Hareesh A, et al. Perceiving placental ultrasound image texture evolution during pregnancy with normal and adverse outcome through machine learning prism. Placenta. (2023) 140:109–16. doi: 10.1016/j.placenta.2023.07.014
17. Chen C-Y, Su H-W, Pai S-H, Hsieh C-W, Jong T-L, Hsu C-S, et al. Evaluation of placental maturity by the sonographic textures. Arch gynecology obstetrics. (2011) 284:13–8. doi: 10.1007/s00404-010-1555-5
18. Zeng Q, Li N, Pan X-F, Chen L, Pan A. Clinical management and treatment of obesity in China. Lancet Diabetes Endocrinol. (2021) 9:393–405. doi: 10.1016/S2213-8587(21)00047-4
19. Juan J, Yang H-X, Su R-N, Kapur A. Diagnosis of gestational diabetes mellitus in China: perspective, progress and prospects. Maternal-Fetal Med. (2019) 1:31–7. doi: 10.1097/FM9.0000000000000008
20. Salomon L, Alfirevic Z, Bilardo C, Chalouhi G, Ghi T, Kagan K, et al. ISUOG practice guidelines: performance of first-trimester fetal ultrasound scan. Ultrasound obstetrics gynecology. (2013) 41:102–13. doi: 10.1002/uog.12342
21. Hu P, Gao Y, Zhang Y, Sun K. Ultrasound image-based deep learning to differentiate tubal-ovarian abscess from ovarian endometriosis cyst. Front Physiol. (2023) 14:1101810. doi: 10.3389/fphys.2023.1101810
22. Zhang K, Sun K, Zhang C, Ren K, Li C, Shen L, et al. Using deep learning to predict survival outcome in non-surgical cervical cancer patients based on pathological images. J Cancer Res Clin Oncol. (2023) 149(9):6075–83. doi: 10.1007/s00432-022-04446-8
23. Li Y, Ren X, He L, Li J, Zhang S, Chen W. Maternal age and the risk of gestational diabetes mellitus: a systematic review and meta-analysis of over 120 million participants. Diabetes Res Clin Pract. (2020) 162:108044. doi: 10.1016/j.diabres.2020.108044
24. Li F, Hu Y, Zeng J, Zheng L, Ye P, Wei D, et al. Analysis of risk factors related to gestational diabetes mellitus. Taiwanese J Obstetrics Gynecology. (2020) 59:718–22. doi: 10.1016/j.tjog.2020.07.016
25. Szoke E, Shrayyef MZ, Messing S, Woerle HJ, Van Haeften TW, Meyer C, et al. Effect of aging on glucose homeostasis: accelerated deterioration of β-cell function in individuals with impaired glucose tolerance. Diabetes Care. (2008) 31:539–43. doi: 10.2337/dc07-1443
26. Mirabelli M, Tocci V, Donnici A, Giuliano S, Sarnelli P, Salatino A, et al. Maternal preconception body mass index overtakes age as a risk factor for gestational diabetes mellitus. J Clin Med. (2023) 12:2830. doi: 10.3390/jcm12082830
27. Torloni M, Betran A, Horta B, Nakamura M, Atallah A, Moron A, et al. Prepregnancy BMI and the risk of gestational diabetes: a systematic review of the literature with meta-analysis. Obes Rev. (2009) 10:194–203. doi: 10.1111/j.1467-789X.2008.00541.x
28. Ogonowski J, Miazgowski T, Kuczyńska M, Krzyżanowska-Świniarska B, Celewicz Z. Pregravid body mass index as a predictor of gestational diabetes mellitus. Diabetic Med. (2009) 26:334–8. doi: 10.1111/j.1464-5491.2009.02695.x
29. Ehlers E, Talton OO, Schust DJ, Schulz LC. Placental structural abnormalities in gestational diabetes and when they develop: a scoping review. Placenta. (2021) 116:58–66. doi: 10.1016/j.placenta.2021.04.005
30. Nankervis A, McIntyre H, Moses R, Ross G, Callaway L, Porter C, et al. ADIPS consensus guidelines for the testing and diagnosis of gestational diabetes mellitus in Australia. Modified June. (2014) 32(22):1–8.
31. Wong C-H, Chen C-P, Sun F-J, Chen C-Y. Comparison of placental three-dimensional power Doppler indices and volume in the first and the second trimesters of pregnancy complicated by gestational diabetes mellitus. J Maternal-Fetal Neonatal Med. (2019) 32:3784–91. doi: 10.1080/14767058.2018.1472226
32. Şengül M, Selim H.Ş. Early prediction of gestational diabetes mellitus using placental S elastography and subcutaneous adipose tissue thickness. Z für Geburtshilfe und Neonatologie. (2023) 227:269–76. doi: 10.1055/a-2109-4210
33. Lai H-w, Lyv G-r, Wei Y-t, Zhou T. The diagnostic value of two-dimensional shear wave elastography in gestational diabetes mellitus. Placenta. (2020) 101:147–53. doi: 10.1016/j.placenta.2020.08.024
34. McIntyre HD, Catalano P, Zhang C, Desoye G, Mathiesen ER, Damm P. Gestational diabetes mellitus. Nat Rev Dis Primers. (2019) 5:47. doi: 10.1038/s41572-019-0098-8
Keywords: gestational diabetes mellitus, placenta, ultrasound imaging, early pregnancy, machine learning, deep learning
Citation: Zhou H, Chen W, Chen C, Zeng Y, Chen J, Lin J, He K and Guo X (2024) Predictive value of ultrasonic artificial intelligence in placental characteristics of early pregnancy for gestational diabetes mellitus. Front. Endocrinol. 15:1344666. doi: 10.3389/fendo.2024.1344666
Received: 26 November 2023; Accepted: 28 February 2024;
Published: 13 March 2024.
Edited by:
Fred Sinowatz, Ludwig Maximilian University of Munich, GermanyReviewed by:
A. Seval Ozgu-Erdinc, Ankara City Hospital, TürkiyeKui Sun, Shandong Provincial Hospital, China
Hong Han, Fudan University, China
Funeng Jiang, South China University of Technology, China
Li Junzheng, Southern Medical University, China
Copyright © 2024 Zhou, Chen, Chen, Zeng, Chen, Lin, He and Guo. This is an open-access article distributed under the terms of the Creative Commons Attribution License (CC BY). The use, distribution or reproduction in other forums is permitted, provided the original author(s) and the copyright owner(s) are credited and that the original publication in this journal is cited, in accordance with accepted academic practice. No use, distribution or reproduction is permitted which does not comply with these terms.
*Correspondence: Xinmin Guo, change90@126.com
†These authors share first authorship