 Sun Jihong1†
 Chen Xiaojie
- 1Department of cardiology, the First Affiliated Hospital of Zhengzhou University, Zhengzhou, Henan, China
- 2Department of Radiology, The People’s Hospital of Jiawang District of Xuzhou, Xuzhou, Jiangsu, China
Objective: The triglyceride-glucose (TyG) index, a reliable substitute indicator of insulin resistance (IR), is considered an independent risk factor for long-term outcomes in patients with cardiovascular disease. However, studies investigating the association between TyG and atherosclerotic cardiovascular disease (ASCVD) are limited and lack direct evidence. We aim to examine the relationship between the TyG index and ASCVD through a comprehensive cross-sectional study.
Methods: Overall, 7212 participants from the 1999–2004 National Health and Nutrition Examination Survey were included. The baseline TyG index was calculated as ln [fasting triglyceride (mg/dL) × fasting blood glucose (mg/dL)/2]. Restricted cubic spline (RCS) regression, univariate logistic regression, and multivariate logistic regression analysis were used to evaluate the association between the TyG index and ASCVD.
Results: In the overall population, a multivariate logistic regression analysis showed that the TyG level was not only positively associated with ASCVD [OR (95%CI): 1.29 (1.01,1.64), P=0.042], coronary artery disease (CAD) [OR (95%CI): 1.82(1.33,2.48), P<0.001], and stroke [OR (95%CI): 2.68(1.54,4.69), P=0.002], but also linearly correlated with all three (P-overall<0.001; P-non-linear >0.05). Although the TyG index was not associated with peripheral arterial disease (PAD) [OR (95%CI): 1.00 (0.73,1.36), P>0.900], it showed a U-shaped correlation with PAD (P-overall <0.001; P-non-linear= 0.0085), and the risk of PAD was minimized when TyG=8.67. By incorporating the TyG index into the baseline risk model, the accuracy of ASCVD prediction was improved [AUC: baseline risk model, 0.7183 vs. baseline risk model + TyG index, 0.7203, P for comparison=0.034]. The results of the subgroup analysis were consistent with those of the main analysis.
Conclusion: The TyG index was independently associated with ASCVD, CAD, and stroke, suggesting that it may serve as a valid indicator for predicting ASCVD in the entire population.
Introduction
Atherosclerotic cardiovascular disease (ASCVD) is a general term for a group of diseases caused by atherosclerosis that involve blood vessels and the heart throughout the body (1–4), including coronary artery disease (CAD), ischemic stroke, and peripheral arterial disease (PAD), which is the leading cause of death (5–8). It is well known that both triglyceride (TG) and fasting blood glucose (FBG) abnormalities are prone to ASCVD. However, FBG and TG as single indicators are limited in predicting the occurrence of ASCVD, and invasive tests, such as angiography are time-consuming and costly. If a simple and inexpensive clinical indicator can be developed for the early identification of ASCVD risk groups, it will be of great clinical value for the prevention and treatment of this disease.
Insulin resistance (IR) contributes to CAD and plays a key role in the development of type 2 diabetes and atherosclerotic disease (9–11). The hyperinsulinemic hyperglycemic clamp is considered to be the gold standard for quantifying insulin sensitivity. However, it is not commonly used in clinical practice because it is not only expensive, but also time-consuming and labor-intensive to measure. Thus, the homeostasis model assessment of insulin resistance (HOMA-IR) has been proposed as an alternative. Notably, the clinical utility of HOMA-IR is limited owing to the limitations of the insulin measurement methods and their susceptibility to confounding factors. Patients with IR tend to have disturbed glucose and lipid metabolism, which induces a series of inflammatory responses and oxidative stress (12, 13). Based on this theoretical background, the triglyceride-glucose (TyG) index calculated using TG and FBG was proposed as a convenient IR marker in 2008 (14). Similar to other IR markers, the TyG index has been shown to be associated with the risk of several chronic diseases related to diabetes, cardiovascular disease, stroke, and renal microvascular injury (15–20). However, there is limited research on the relationship between the TyG index and ASCVD, particularly due to the lack of validation in large-scale studies based on the general population. To address this knowledge gap, this study selected 7212 adults in the United States who participated in the National Health and Nutrition Examination Survey (NHANES) survey from 1999–2004 to explore the relationship between the TyG index and ASCVD by a cross-sectional study.
Materials and methods
Study population
The data for this cross-sectional study were obtained from the NHANES database, a large general population-based cross-sectional survey led by the National Center for Health Statistics (NCHS) that collected information on the health and nutrition of household populations in the United States. This national survey used a complex, multistage, stratified sampling design to identify participants, and oversampled certain populations to ensure a representative sample. This survey has been released every two years since 1999; additionally, all data were validated by the National Center for Health Statistics before being made public and available to the entire population. The NHANES survey was approved by the National Health and NCHS Research Ethics Review Board, and informed consent was obtained from all participants. The NHANES survey data for each period and detailed survey operation manuals, consent forms, and brochures are publicly available on the NHANES website (https://www.cdc.gov/nchs/nhanes).
Adult participants from the 1999–2004 NHANES database were selected to investigate the relationship between the TyG index and ASCVD risk. A total of 31,126 NHANES participants from to 1999–2004 were initially included in this study; 11,518 participants with missing TG and FBG and 12,396 participants with missing outcome indicators of CAD, stroke, or PAD were excluded, and a final total of 7,212 participants were included in this study (Figure 1).
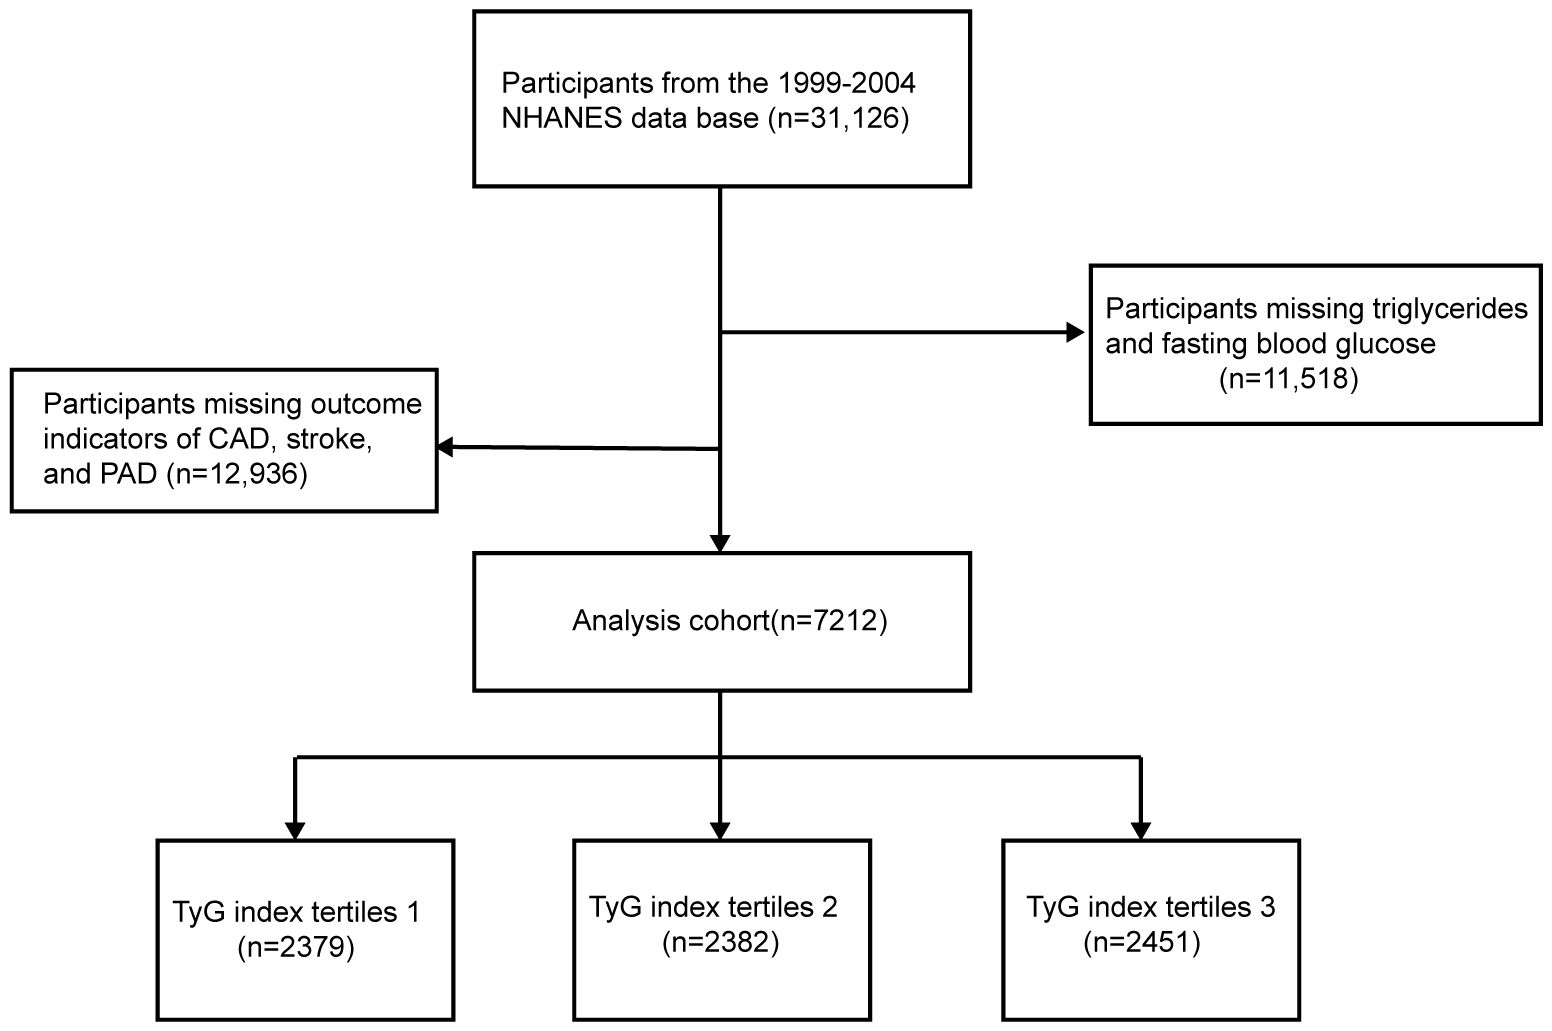
Figure 1 Flow chart for the enrollment of study population.
Exposure variable and outcomes
The baseline information of the participants, such as sex, age, ethnicity, household income, education, alcohol and smoking status, and medical history (including hypertension, diabetes, cardiovascular diseases, stroke, and prescription medication use) were obtained from the household interview questionnaire. Physical examination information, such as height, weight, and blood pressure was obtained at mobile screening centers. After resting for at least 5 min, the technician measured the blood pressure in the participant’s right arm using an automated manometer. The systolic blood pressure was measured in both arms (brachial artery) and ankles (posterior tibial artery) using an 8 MHz Doppler probe. The ankle-brachial blood pressure index (ABPI) was calculated as the ratio of the mean systolic pressure of the tibial artery to that of the brachial artery. The participants were requested to fast for more than 8 h before blood samples were drawn to determine the total cholesterol (TC), TG, FBG, high-density lipoprotein cholesterol (HDL-C), low-density lipoprotein cholesterol (LDL-C), creatinine, aspartate aminotransferase (AST), alanine aminotransferase (ALT), and glycosylated hemoglobin A1C (HbA1C) levels, a process that took place at a mobile examination center (MEC). All biological samples were sent to the nearest collaborating laboratory for testing, and all physical examinations and laboratory tests were performed in accordance with the relevant guidelines.
ASCVD was defined as CAD, stroke, or PAD in arterial disease. The diagnosis of CAD and stroke was based on the patients’ previous diagnoses or current symptoms due to data constraints from the NHANES survey. CAD was defined as a previous diagnosis of coronary heart disease, angina pectoris, or a heart attack. Stroke was defined as having been diagnosed by a doctor or professional health advisor that had a stroke. As no questionnaires specifically related to the PAD diagnosis and symptoms were available, we relied on the ABPI as a measurement to define PAD. ABPI provides an effective means of assessing the stenosis between the aorta and ankle by measuring the ratio of ankle artery pressure to the central blood pressure. It exhibits a higher sensitivity than symptomatic diagnosis and has been widely adopted (21, 22). In line with the consensus document by the American Diabetes Association, we defined ABPI<0.9 as indicative of Peripheral Arterial Disease (PAD) (23). The primary outcome was ASCVD and the secondary outcomes were CAD, stroke, and PAD. Notably, the following were used for analyses: 1) HOMA-IR = fasting blood glucose (FBG, mmol/L) × fasting insulin (μU/mL)/22.5; 2) TyG index= ln [fasting TG (mg/dL) × FBG (mg/dL)/2]. Diabetes was defined as follows: 1. Previous diagnosis of diabetes or current use of oral hypoglycemic medication/insulin; 2. Fasting blood glucose level >7 mmol/L; and 3. HbA1c>6.5%. Hypertension was defined as a history of hypertension, current antihypertensive medication use, or maximum systolic blood pressure greater than 140 mmHg/maximum diastolic blood pressure greater than 90 mmHg. Alcohol consumption was defined as a frequency of alcohol consumption >=1 drink/month in the past 12 months.
Statistical analysis
Statistical analyses were performed using R 4.3.0, and a P-value <0.05 was considered statistically significant. While performing the data analyses, we considered sample weights to correct for differential selection probabilities, compensate for possible deficiencies in the eligible population, and adjust for non-coverage and non-response. The missing covariates were supplemented using random forest-based multiple interpolation. TyG was categorized as T1, T2, or T3 based on the tertiles. Quantitative information was expressed using mean ± standard deviation (SD), and qualitative information was expressed as a percentage. Differences in the baseline information between groups with different TyG indices were explored using a variance analysis or the Kruskal–Wallis test for continuous variables and the chi-square test for categorical variables. In addition, a restricted cubic spline (RCS) curve was constructed to evaluate the linear or nonlinear relationships between the TyG index and ASCVD, CAD, stroke, and PAD. The associations between TyG levels and ASCVD, CAD, stroke, and PAD were estimated using multifactorial logistic regression models with 95% confidence intervals (CI). The confounding variables were selected based on the significant differences between the TyG index and risk factors significantly associated with ASCVD. Model 1 is unadjusted. Model 2 was adjusted for age, sex, race, education, and household poverty index (PIR) based on Model 1. Model 3 was adjusted for smoking, alcohol consumption, hypertension, diabetes, HDL-C, LDL-C, FBG, HbA1c, TG, TC, and insulin levels based on Model 2. To evaluate the improvement of the TyG index compared to HOMA-IR, FBG, and TG in traditional ASCVD prediction models, we combined the baseline risk model with each of them to create four new models, analyzed the diagnostic value using receiver operating characteristic curves (ROCs), and calculated the area under the curve to quantify the predictive effect of the four models. The Net Reclassification Improvement (NRI) and Integrated Discriminant Improvement (IDI) were also tested to explore the predictive efficacies of HOMA-IR, FBG, and TG for ASCVD. In addition, we performed sensitivity analyses for specific subgroups, such as sex, age, hypertension, diabetes, and BMI, and used P interaction tests to determine whether the confounders interacted with exposure factors.
Results
Characteristics of the population stratified by the triglyceride glucose index
The baseline characteristics of the study population are presented according to the TyG tertiles in Table 1. A total of 7212 participants were enrolled in this study, of which 3691 (51.2%) participants were male, with a mean age of 60.26 years. Notably, 1841 (25.5%) participants were eligible for the diagnosis of ASCVD, 840 (11.6%) participants had CAD, 300 (4.2%) participants had stroke, and 1054 (14.6%) participants had PAD. The ranges of TyG index for T1-T3 were <8.41, 8.41–8.93, and >8.93, respectively. Individuals with higher TyG levels included more non-Hispanic whites, more males, were older on average, and had a higher prevalence of a variety of disorders, such as hypertension, diabetes, CAD, stroke, PAD, and ASCVD. In addition, a higher TyG index was associated with higher blood indices including FBG, TG, HOMA-IR, ALT, HbA1c, LDL-C, TC, and other blood markers. Table 2 demonstrated the baseline characteristics of the population grouped according to ASCVD, and the results showed that ASCVD was more common in people who were Non-Hispanic White, older, male, less educated, poorer, smokers, alcohol drinkers, hypertensive, and diabetic. Moreover, patients with ASCVD tended to have higher blood biochemicals, such as TyG, FBG, TG, and HbA1C.
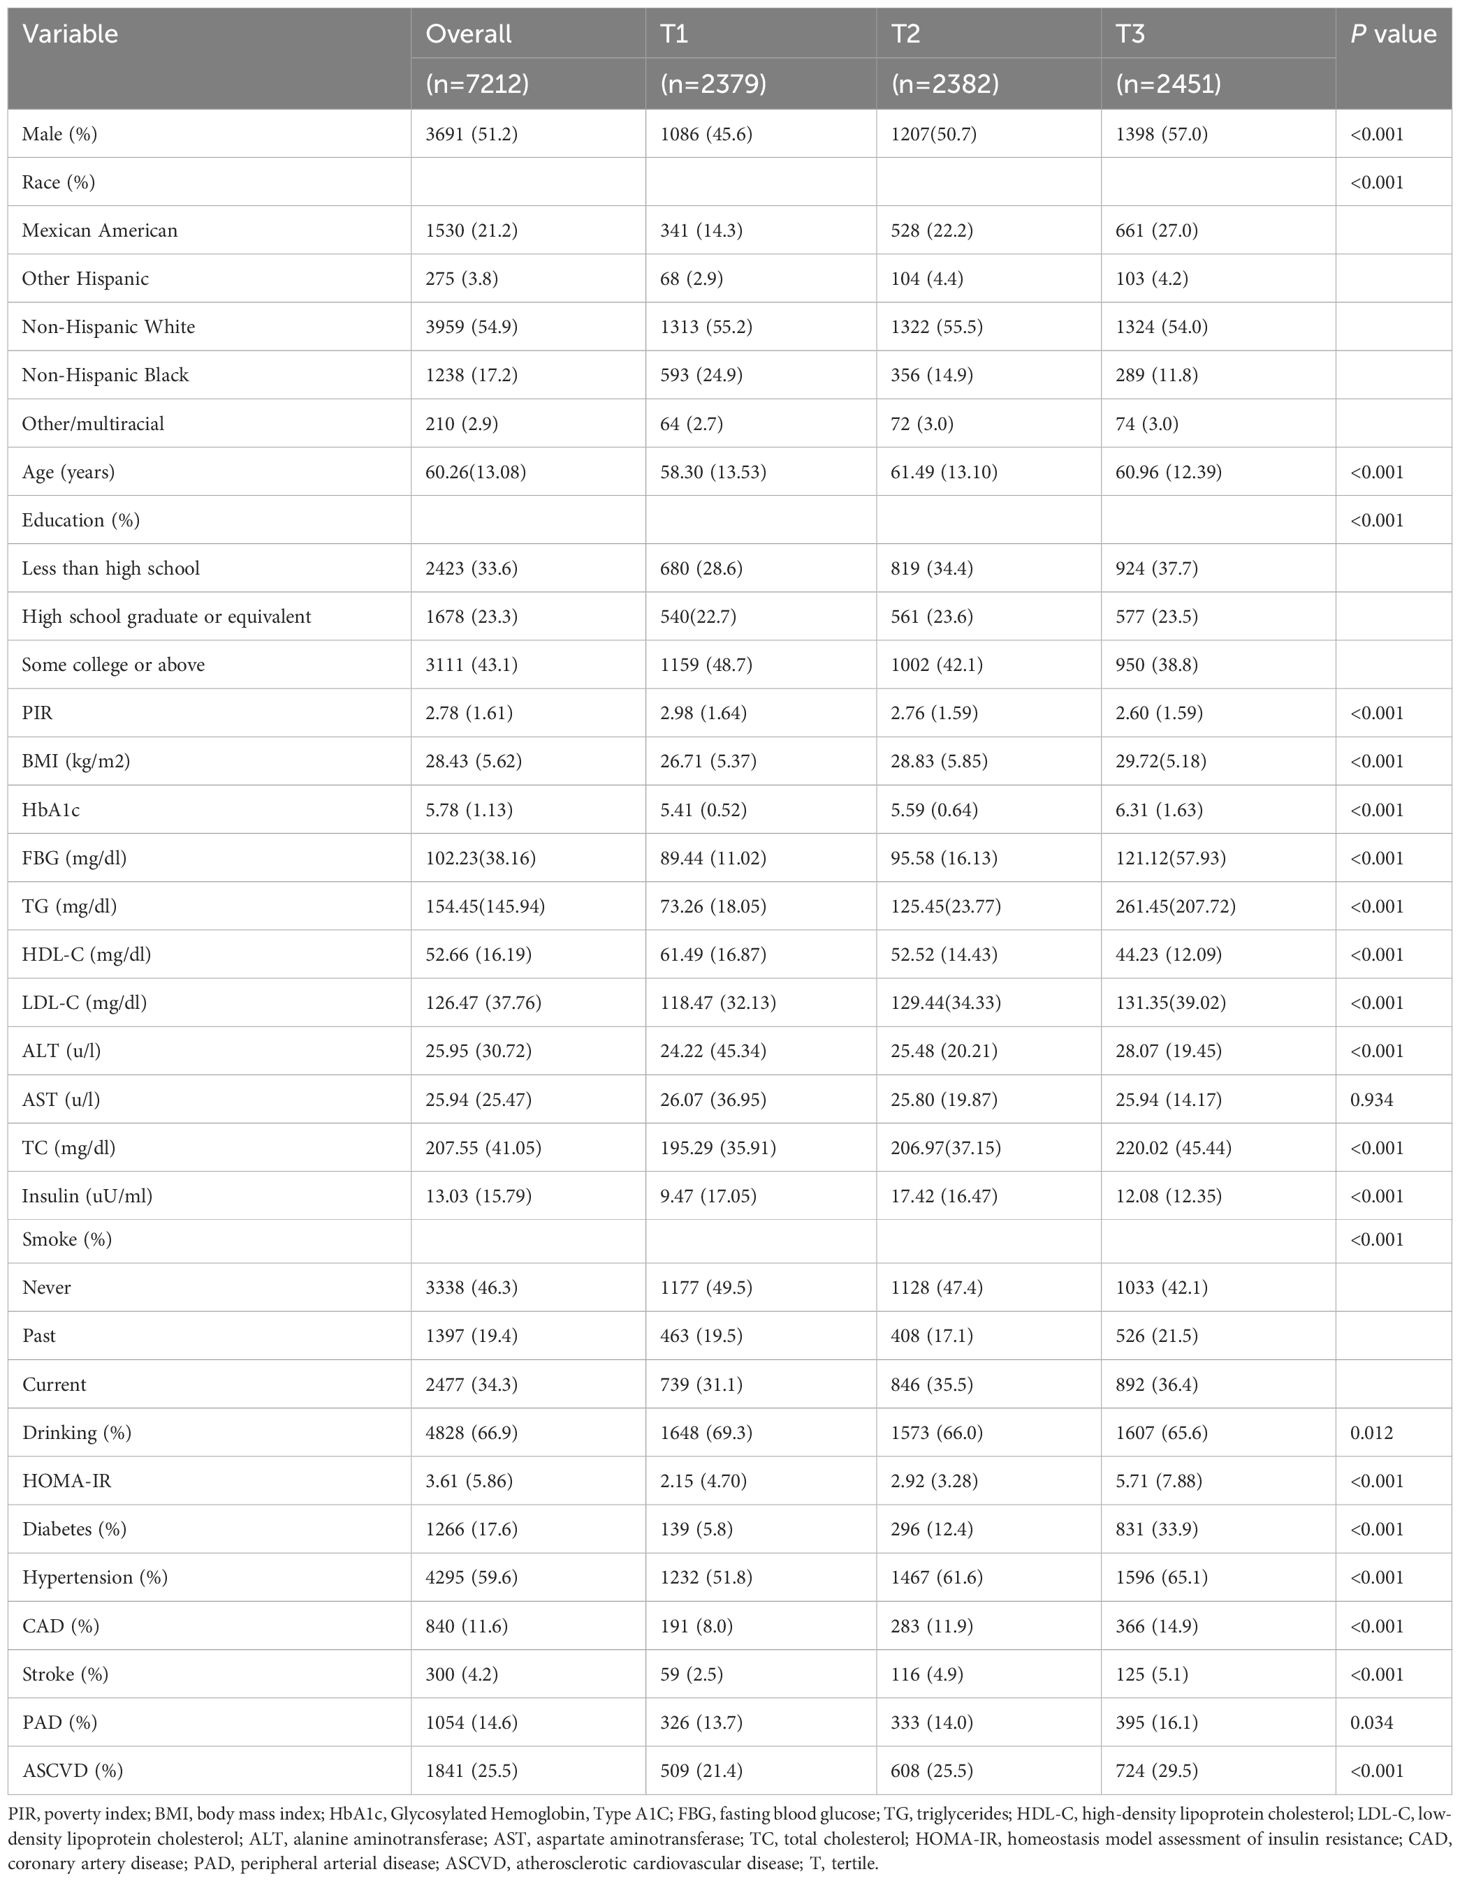
Table 1 The characteristics of participants according to TyG index.
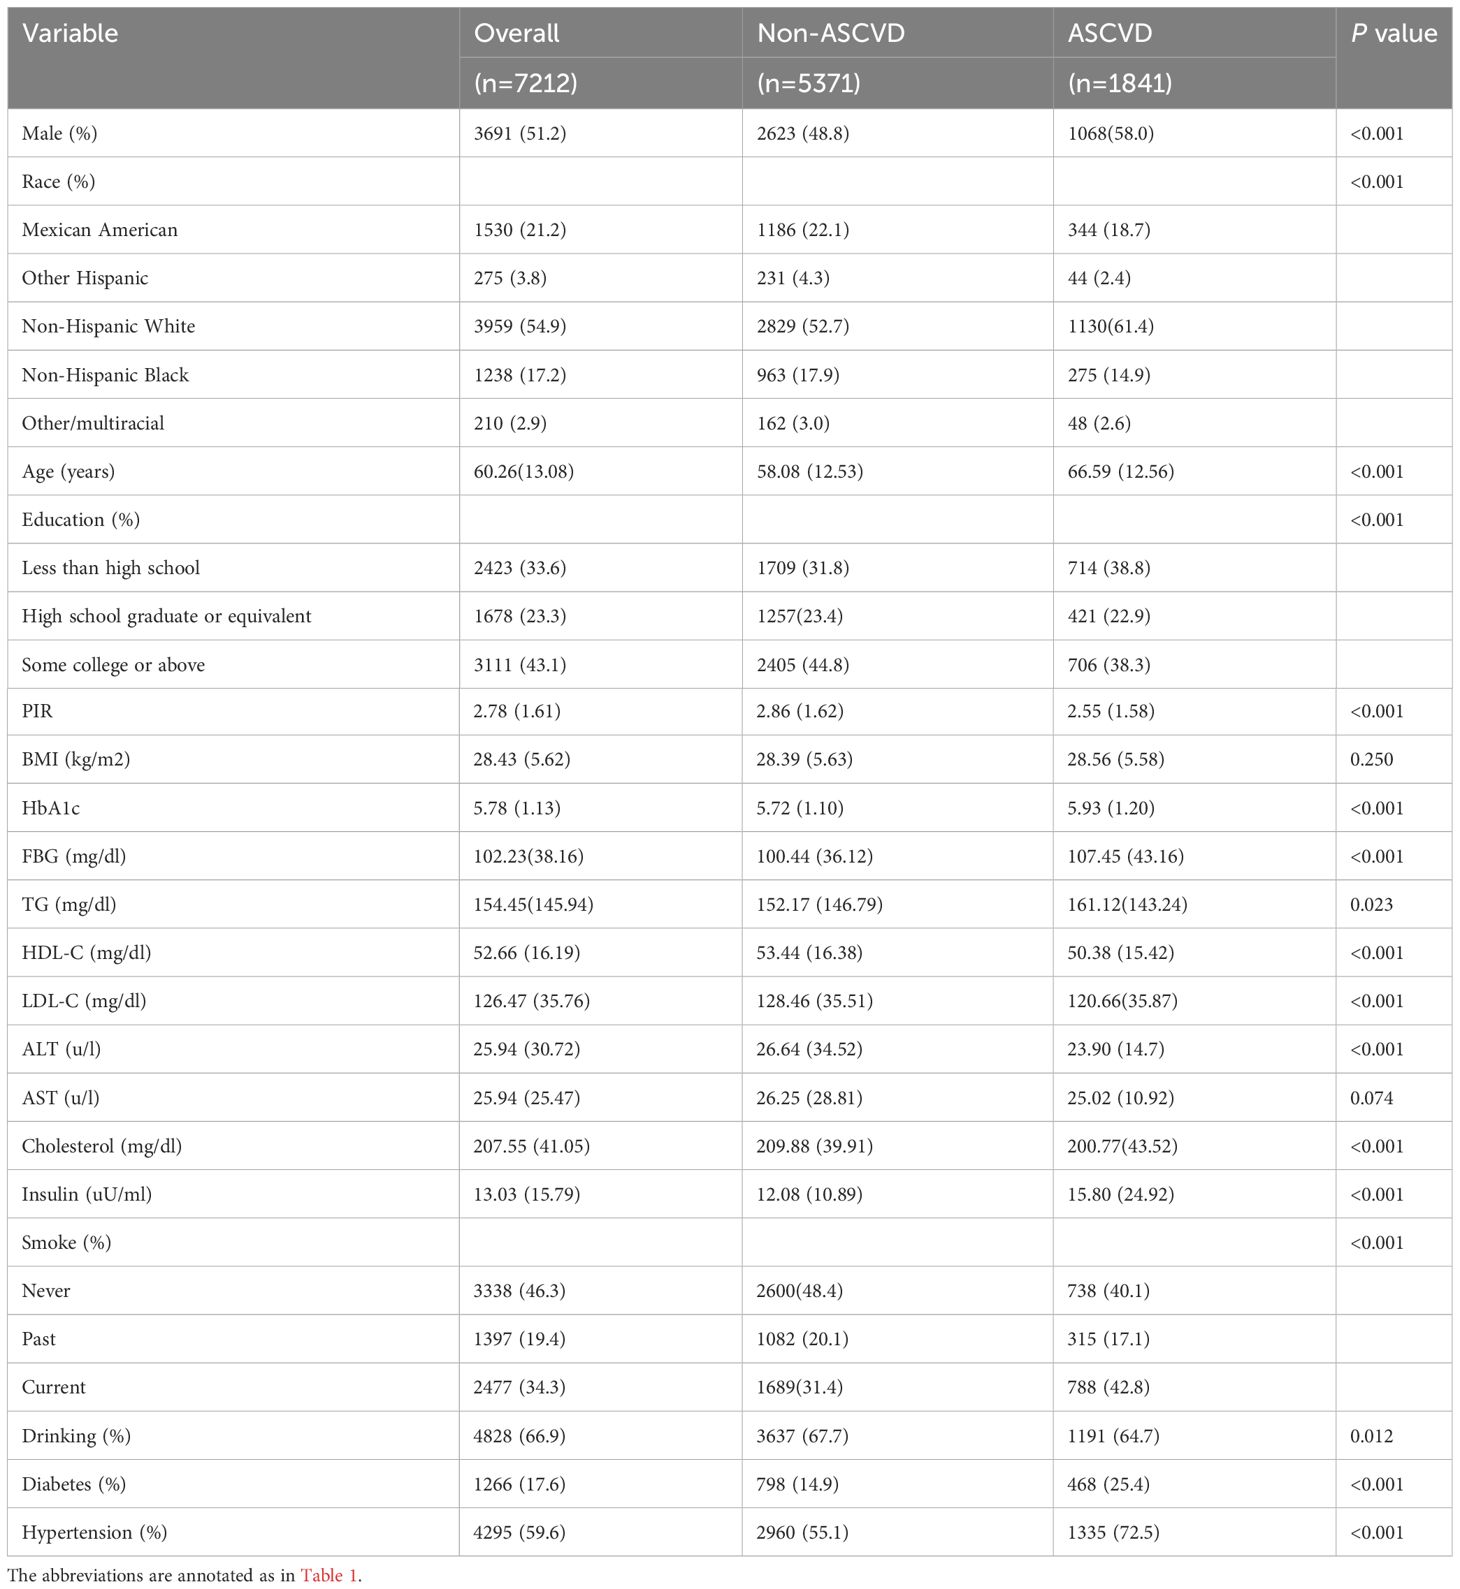
Table 2 The characteristics of participants according to ASCVD.
Trend test between TyG index and primary and secondary outcomes
RCS regression was used to explore the dose-response relationship between the TyG index and primary and secondary outcomes (Figure 2). The results showed that the TyG index was linearly correlated with ASCVD (P for nonlinearity=0.088), CAD (P for nonlinearity=0.592), and stroke (P for nonlinearity=0.442). Therefore, T1 was chosen as the reference when constructing the multivariable logistic regression models for ASCVD, CAD, and stroke. Additionally, the TyG index demonstrated a U-shaped relationship with PAD (P for nonlinearity=0.009), with the smallest odds ratio at TyG = 8.67. Therefore, T2 was selected as the reference for developing the PAD model.
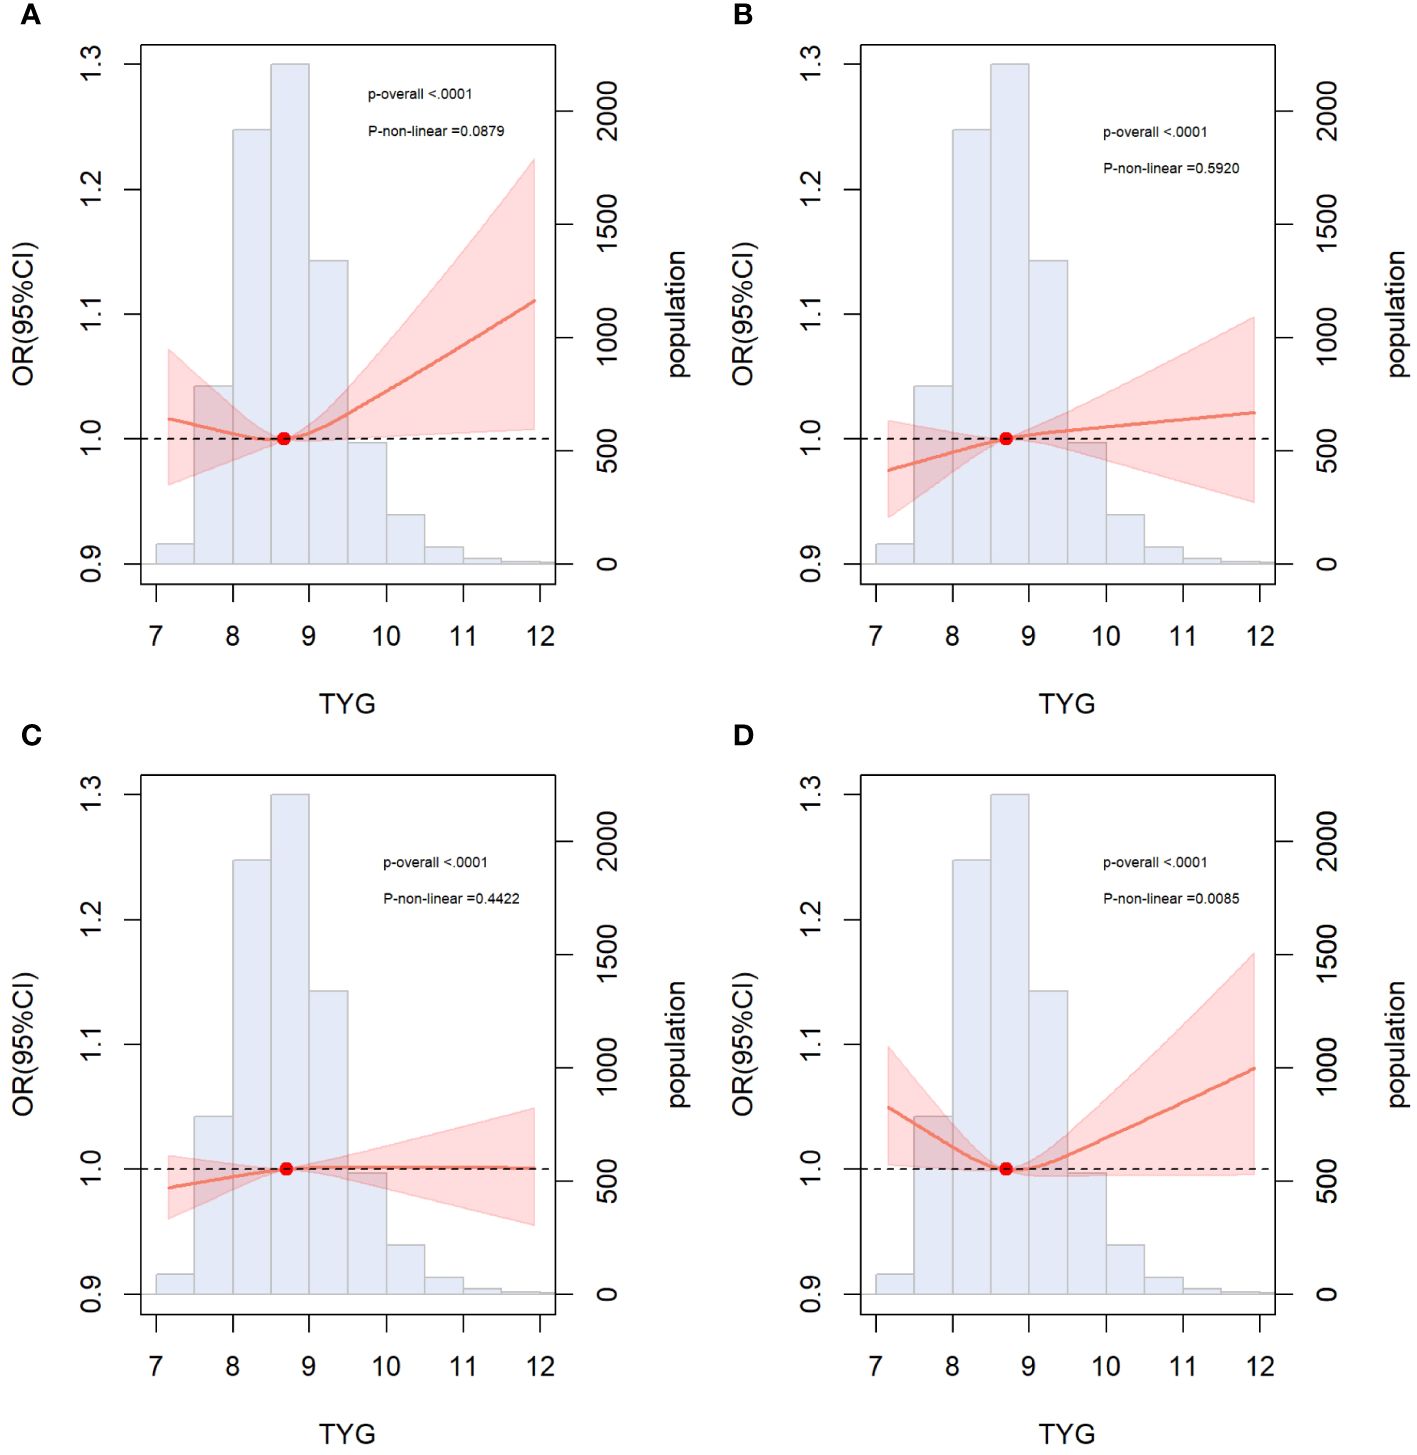
Figure 2 Restricted cubic spline curves for ASCVD, CAD, stroke and PAD by TyG index after covariate adjustment. (A) Relationship between TyG index and ASCVD; (B) Relationship between TyG index and CAD; (C) Relationship between TyG index and stroke (D) Relationship between TyG index and PAD. The threshold of statistical significance was set as P<0.05. The histograms represented the distribution of people with different TYG index. ASCVD, atherosclerotic cardiovascular disease; CAD, coronary artery disease; PAD, peripheral arterial disease.
Association of TyG index with ASCVD in overall population
The final confounders included in the model were sex; age; race; education; PIR; FBG, TG, HbA1c, AST, ALT, LDL-C, HDL-C and TC levels; creatinine; hypertension; diabetes mellitus; smoking; and alcohol consumption. The multivariate logistic regression analysis demonstrated an association between the TyG levels and the risk of ASCVD, CAD, stroke, and PAD (Table 3). Regarding the risk of ASCVD, the OR and 95% CI for the largest tertile (T3) over the smallest tertile (T1) was [1.75 (1.46,2.11); P<0.001) in the unadjusted model 1, [1.47 (1.19,1.81); P<0.001) in the partially adjusted model 2, and [1.29 (1.01, 1.64], P=0.042) in the fully adjusted model 3. Compared with T1, the risk of CAD in T3 was significantly higher in the unadjusted model 1 [OR (95%CI): 2.52(1.96, 3.25), P<0.001], partially adjusted model 2 [OR (95%CI): 2.12 (1.61, 2.79), P<0.001], and fully adjusted model 3 [OR (95%CI): 1.82(1.33, 2.48), P<0.001] The risk of stroke was significantly increased at the highest TyG level compared to the lowest TyG level in model1[OR (95%CI): 2.71(1.82, 4.03), P<0.001], model2 [OR (95%CI): 2.43(1.57, 3.75), P<0.001], and model3[OR (95%CI): 2.68(1.54, 4.69), P=0.002]. The risk of PAD with different TyG levels was not statistically significant in the all-adjusted model [OR (95%CI): 1.00 (0.73, 1.36), P>0.900] (Table 3). In addition, individuals with higher TyG levels have a greater risk of ASCVD (P for trend<0.001), CAD (P for trend<0.001), and stroke (P for trend=0.002) (Table 3).
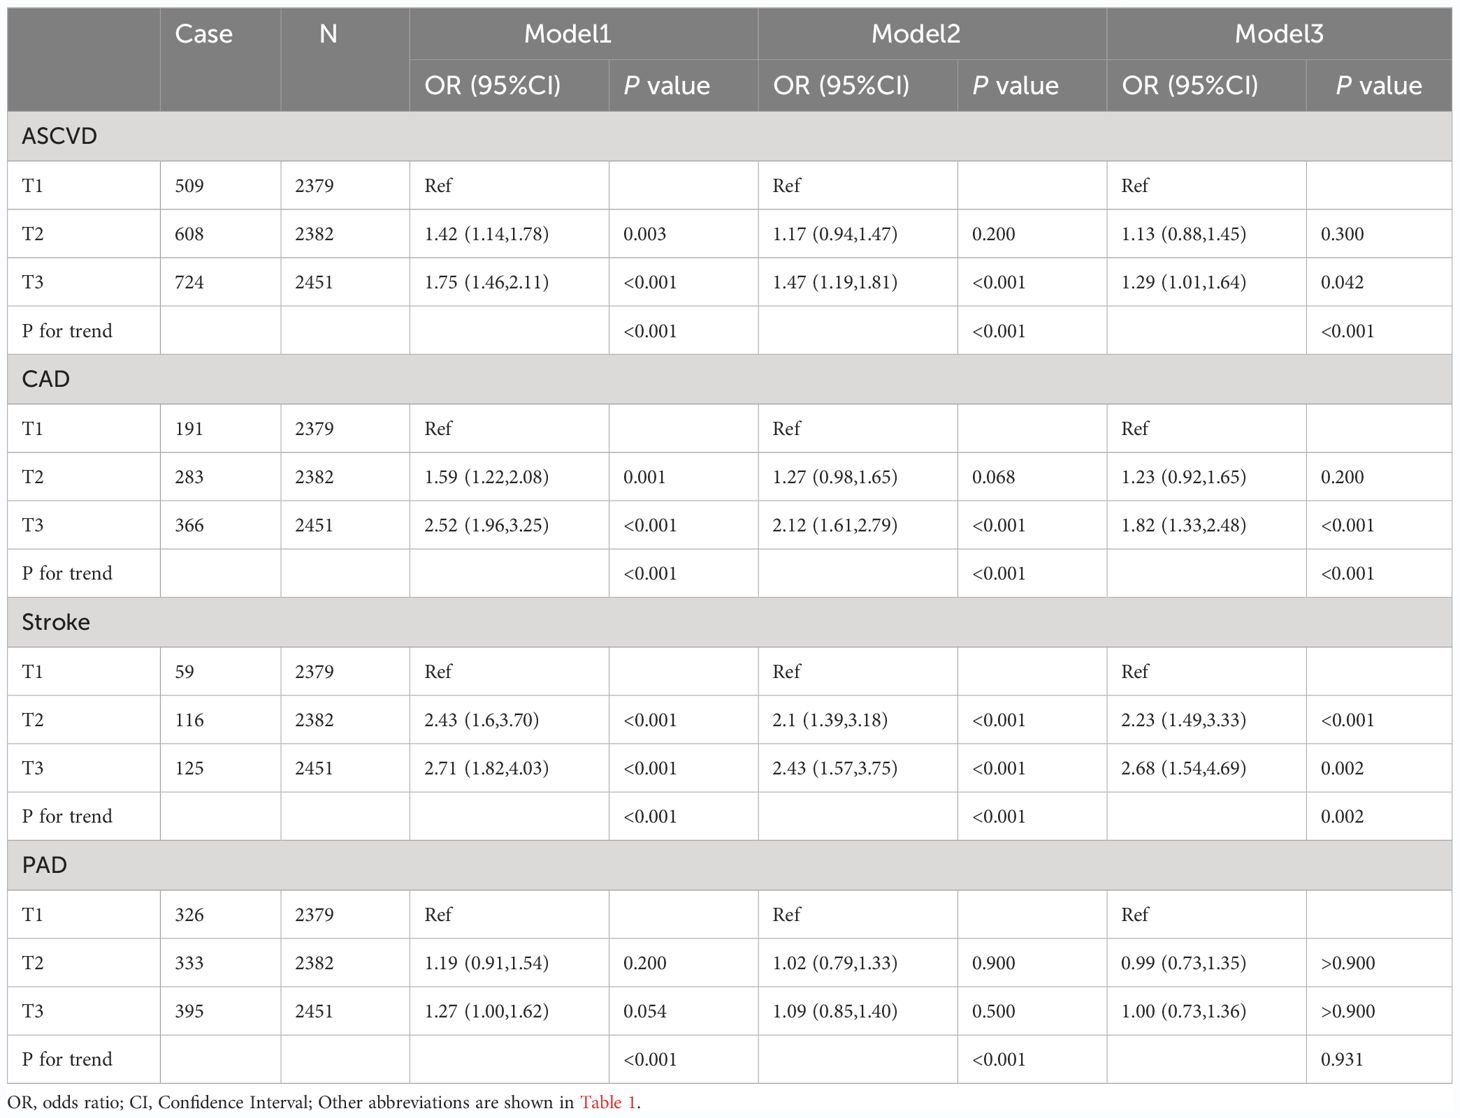
Table 3 Association of TyG index with the risk of ASCVD, Stroke, CAD, and PAD.
Incremental effect of the TyG index for predicting ASCVD
We incorporated traditional cardiovascular risk factors, such as sex, age, race, total cholesterol, LDL-C, hypertension, diabetes, smoking, and alcohol consumption, into the baseline risk model. Subsequently, we individually introduced the TyG index, HOMA-IR, FBG level, and TG level to construct four new models. The predictive performance of these models was evaluated by plotting ROC curves and calculating the AUC. Notably, our analysis revealed that only the inclusion of the TyG index [AUC: baseline risk model, 0.7183 vs. baseline risk model + TyG index, 0.7203, P=0.034] significantly improved the base model, with an NRI of 0.009 (P=0.110) and an IDI of 0.002 (P<0.001) (Table 4). However, the addition of HOMA-IR [AUC: baseline risk model, 0.7183 vs. baseline risk model + HOMA-IR index, 0.7184, P=0.747], FBG [AUC: baseline risk model, 0.7183 vs. baseline risk model + FBG, 0.7185, P=0.516], and TG [AUC: baseline risk model, 0.7183 vs. baseline risk model + TG index, 0.7196, P=0.095] did not lead to a statistically significant enhancement in model performance (Figure 3).
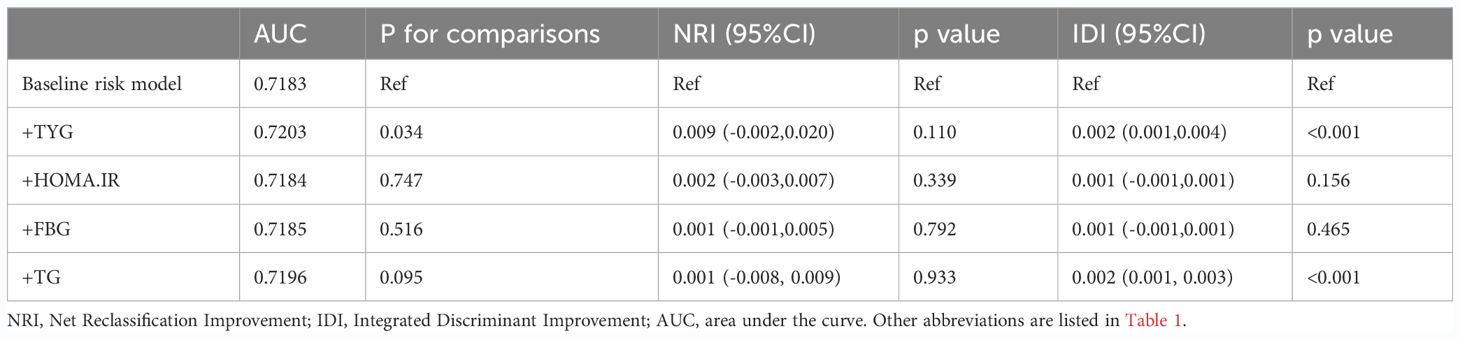
Table 4 Incremental effect of TYG, HOMA.IR, FBG and TG for predicting ASCVD.
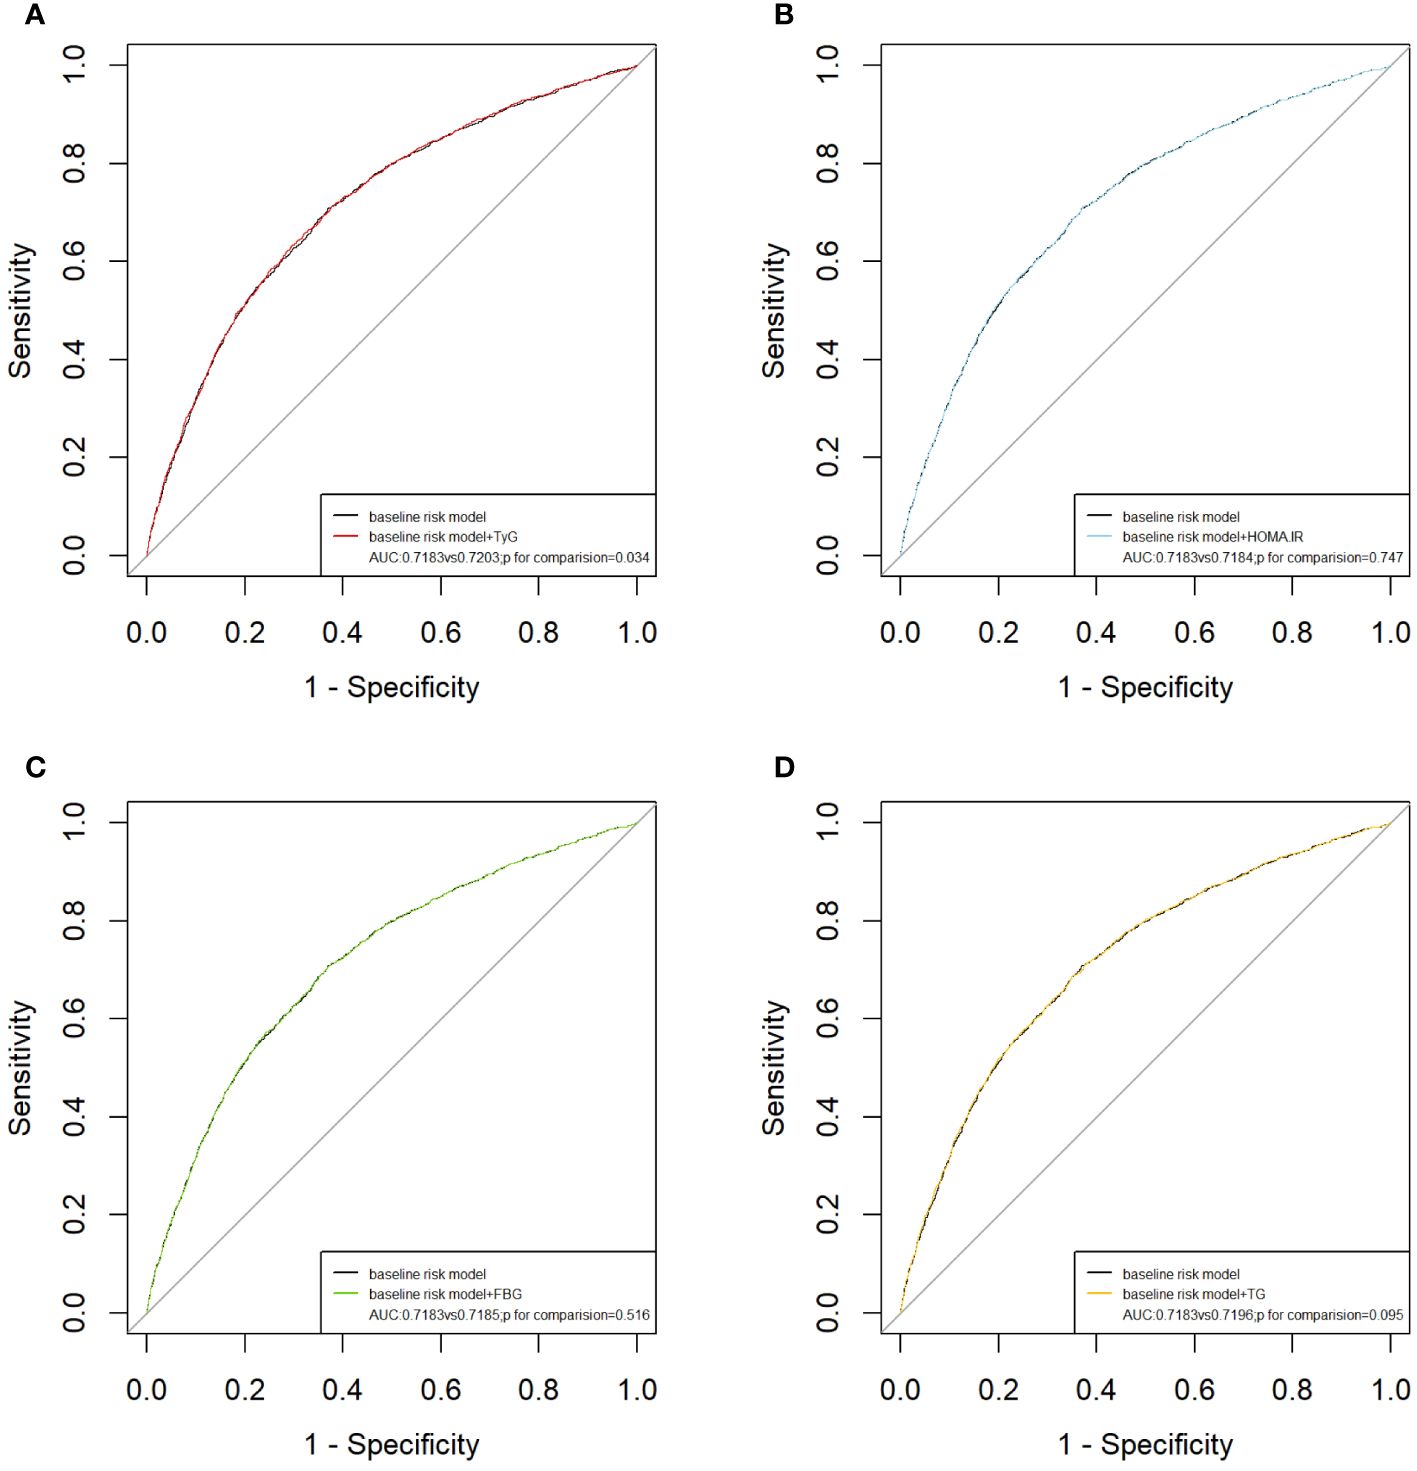
Figure 3 ROC curves for the evaluation of TyG index and other risk factors on the diagnostic performance of ASCVD. (A) Baseline risk model vs baseline risk model + TyG index groups; (B) Baseline risk model vs baseline risk model + HOMA-IR groups; (C) Baseline risk model vs baseline risk model + FBG; (D) Baseline risk model vs baseline risk model + TG. Baseline risk models included sex, age, LDL-C, ALT, AST, TC, insulin, hypertension, diabetes, smoking, alcohol consumption. AUC, area under the curve; TyG, triglyceride-glucose; TG, triglyceride; FBG, fasting blood glucose. HOMA-IR, homeostasis model assessment of insulin resistance.
Sensitive analysis of association of TyG with ASCVD
The results of the subgroup analysis stratified by sex, age, diabetes, hypertension, and BMI are shown in Figure 4. Overall, the participants in the highest TyG index tertile had significantly higher odds of developing ASCVD in subgroups. Notably, significant interactions were observed between the TyG index and sex (P for interaction <0.001) and age (P for interaction = 0.032), and no interaction was found for the other confounding variables. Furthermore, the TyG index was positively associated with the incidence of ASCVD in female individuals [OR (95% CI): 1.66(1.11,2.47) and middle-aged individuals [OR (95% CI): 1.54 (1.02, 2.34]). Building upon these findings, we further explored the relationship between the TyG index and ASCVD in subgroups stratified by sex and age using multivariate-adjusted RCS analysis. As shown in Figure 5, while a linear association trend between the TyG index and ASCVD was observed in all subgroups (P for overall <0.001, all P for nonlinear >0.05), a significant positive correlation between the TyG index and ASCVD was evident specifically in the female and middle-aged subgroups.
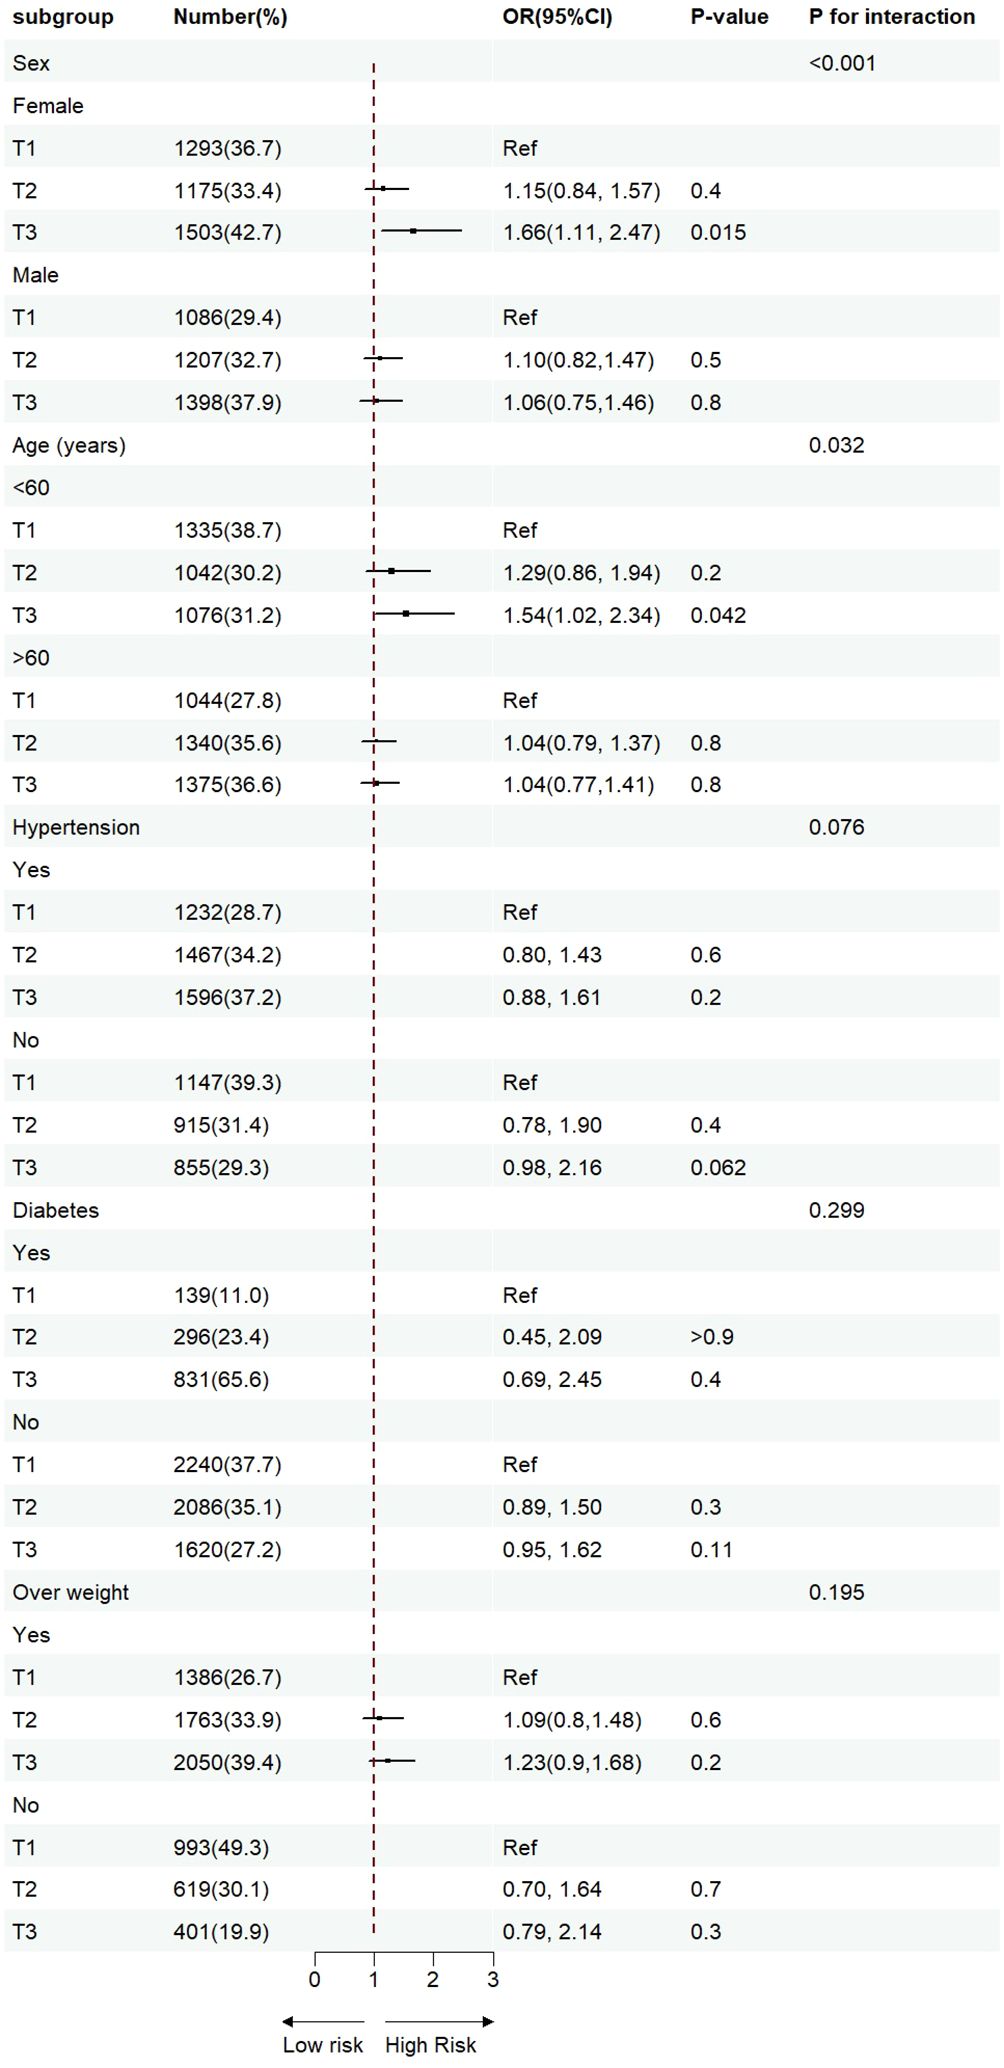
Figure 4 Sensitivity analysis for the impact of TyG index on ASCVD. The red vertical solid line represents OR= 1. The threshold of statistical significance was set as P<0.05.
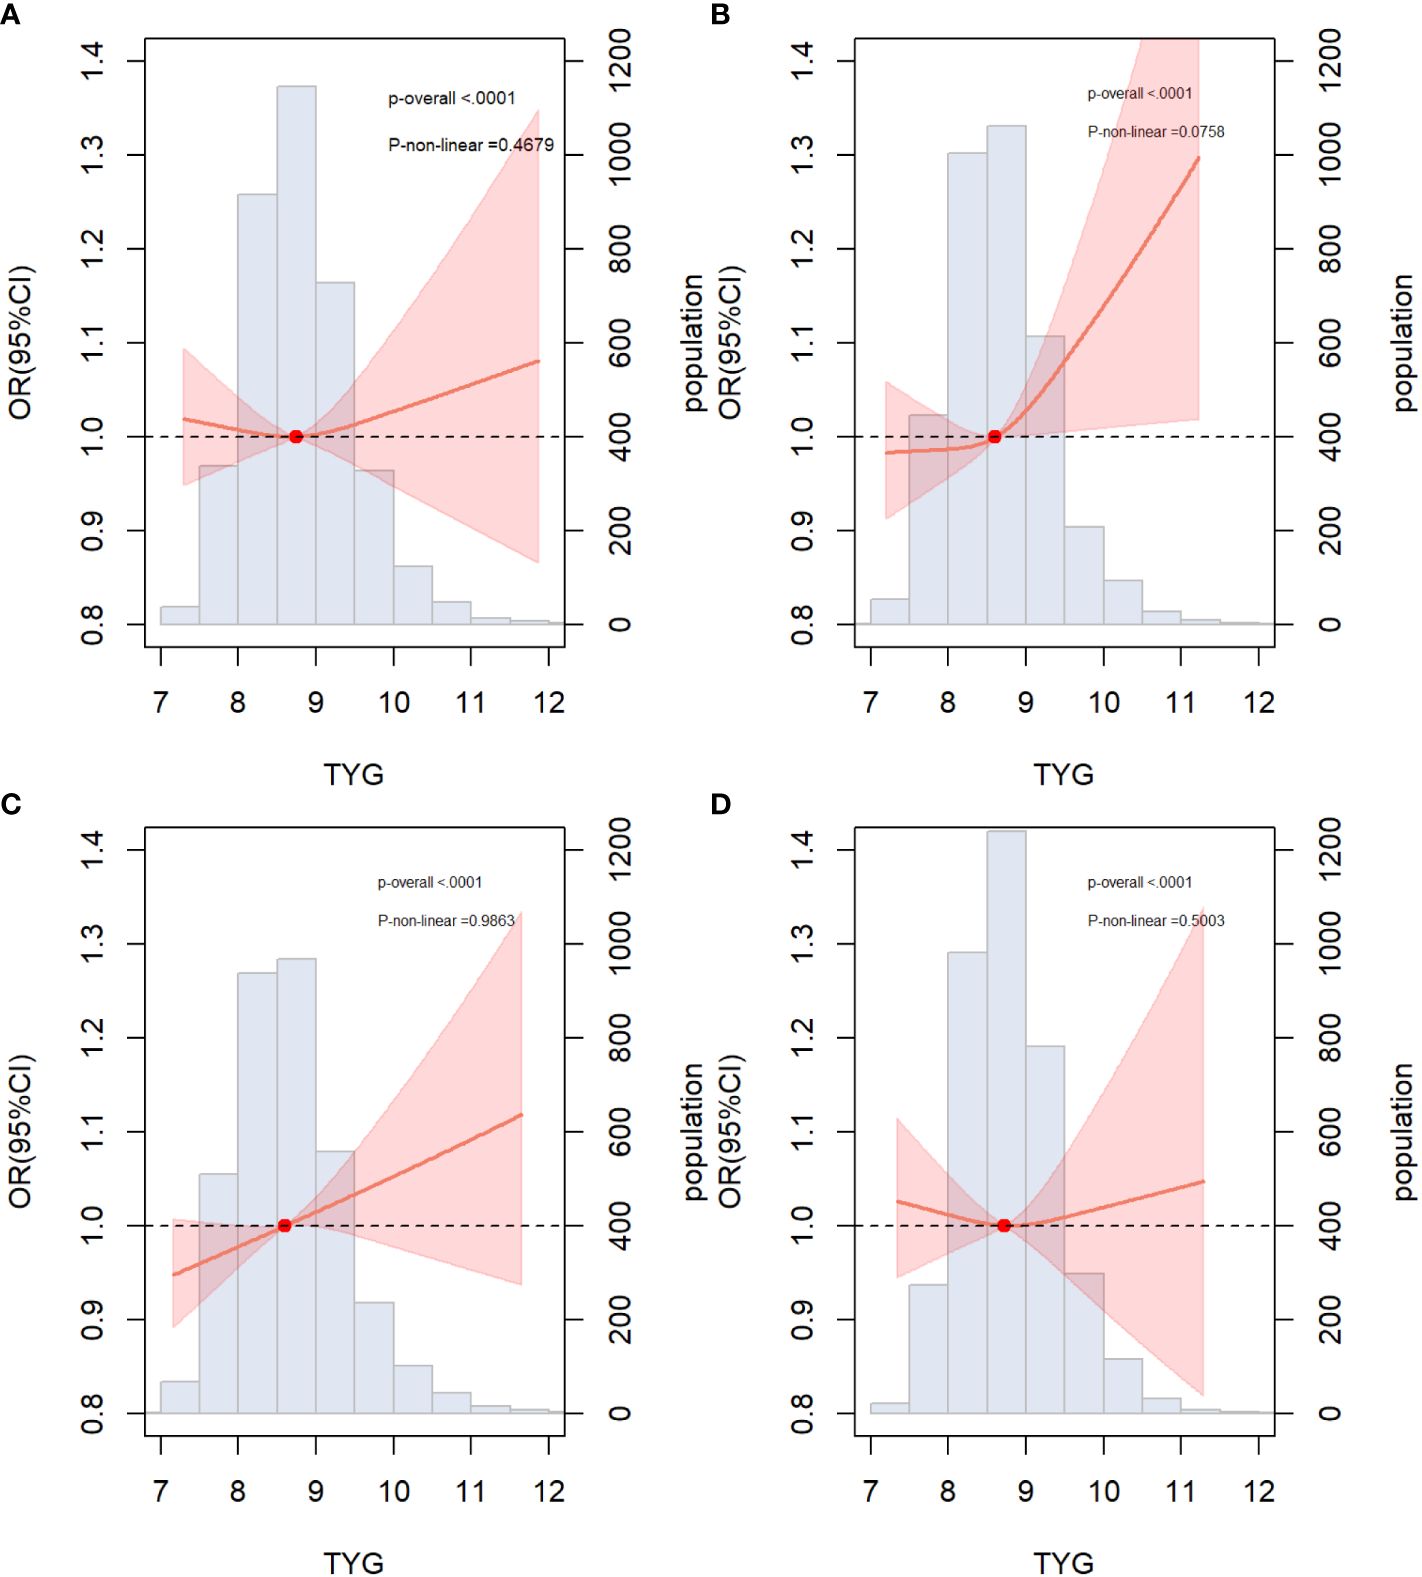
Figure 5 Associations between TYG index and ASCVD in specific subgroups (A) Male; (B) Female; (C) Non-elderly (age<60); (D) Elderly (age≥60); The threshold of statistical significance was set as P<0.05. The histograms represented the distribution of people with different TYG index levels. ASCVD, atherosclerotic cardiovascular disease.
Discussion
To the best of our knowledge, this is the first large-scale cross-sectional study to explore the relationship between TyG index and ASCVD. The results showed that The TyG index remained positively associated with the risks of ASCVD, CAD, and stroke after correcting for various confounders. The TyG index was U-shaped and associated with the risk of PAD, with the lowest risk occurring when the TyG index was 8.67. The addition of the TyG index significantly increased the predictive efficacy of the basic model compared with HOMA-IR, FBG, and TG. In summary, the TyG index can serve as a reliable tool for predicting ASCVD risk, thereby optimizing ASCVD prevalence stratification in the general population.
Numerous scholars have focused on the association between the TyG index and the risk of single diseases, such as CAD, stroke, PAD, and atherosclerosis; however little attention has been paid to ASCVD. ASCVD, as a composite outcome, is more closely associated with all-cause mortality and adverse cardiovascular event outcomes than a single disease (24–26), and the early identification and management of patients with high-risk ASCVD is of greater clinical value. Hua et al. simulated the incidence of ASCVD in participants over the next 10 years and found that the TyG index was associated with an increased risk of ASCVD (27). Previous studies have demonstrated the promising potential of the TyG index in predicting the risk of CAD (28, 29) and the prognosis of adverse cardiovascular events in patients with acute coronary syndrome (ACS) (30, 31), stable CAD (32, 33), or non-obstructive CAD (34). A high TyG index is also independently associated with stroke (35). In contrast, Wu et al. found no statistically significant differences in the risk of stroke in those with the highest TyG index compared to those with the lowest TyG index; however, there was a significant linear trend (36). In our study, the TyG index was not only positively correlated with the risk of stroke, but also showed an overall linear trend. From the available studies, it is inconclusive whether the TyG index can be used as an independent predictor of stroke; however, individuals with higher TyG levels tend to have a higher risk of stroke. Evidence of the relationship between the TyG index and PAD is limited. Gao et al. found that in 12,320 non-PAD community participants, a higher TyG index was associated with an increased risk of PAD (37). However, after adjusting for relevant risk factors, we did not find a significant correlation between the TyG index and the risk of PAD, but only observed a U-shaped trend between the TyG index and PAD risk. This difference may be due to our diagnosis of PAD being based on ABPI rather than angiography or symptomatic standards, which could lead to missed diagnoses of mild-to-moderate or early stage PAD, thereby affecting the assessment of the correlation between the TyG index and PAD risk. Second, from a statistical perspective, artificially categorizing the TyG index as a categorical variable in our study may have led to the loss of some information, reducing the sensitivity and accuracy of the analysis, and thereby affecting the discovery of a correlation between the TyG index and risk of PAD. Additionally, the TyG index can represent, to some extent, the nutritional level of participants; both malnutrition and over-nutrition could increase the risk of PAD, which may explain the U-shaped correlation between TyG and PAD (38–40).
Notably, sex and age interacted with the TyG index to predict ASCVD, and the relationship between TyG levels and ASCVD was prominent in the female and middle-aged groups, but not in the male and older groups. Previous studies have repeatedly mentioned the superiority of the TyG index in predicting cardiovascular and atherosclerosis-related diseases in the female population (41, 42), which is generally in line with the results of our study. This difference can be explained by the gender insulin hypothesis (43). Previous studies have found that individuals of female sex tend to be more insulin resistant than male individuals because of the differences in hormone levels, fat distribution, metabolism, genetic and hereditary factors and lifestyle factors (44–46). As the amount of estrogen wanes,IR is observed to increase in women after entering menopause (47), explaining why there are more women with type 2 diabetes. Besides, the interaction between TyG and age has also drawn our attention. After a 7-year follow-up of 2923 patients with cardiovascular disease, Wang et al. found that the TyG levels were a promising marker for predicting the all-cause mortality in middle-aged patients, but not in elderly patients (48). Similarly, middle-aged patients with higher levels of TyG index awere more likely to experience major adverse cardiovascular events (49). However, the exact reasons for this pattern remain to be discussed. The most likely reasons are two-fold. Firstly, younger individuals were more likely to developing IR (50), leading to elevated TyG levels in this population (51, 52). Secondly, the TyG index measurements in the elderly awere susceptible to more confounding factors, such as the presence of various diseases, concomitant poor nutritional status, and altered lipid levels. Therefore, the TyG index might not accurately reflect the IR in older adults compared to younger adults. Overall, the reasons why the female and middle-aged individuals are more prone to IR are likely multifaceted, and further research is needed for a comprehensive understanding of its mechanisms
The mechanism underlying the correlation between the TyG index and ASCVD has not yet been clearly elucidated; however, we believe that this could be explained by the IR doctrine. First, an imbalance in the glucose and lipid metabolism induced by IR leads to inflammation and oxidative stress, resulting in the development of atherosclerosis (53, 54). Second, IR plays a key role in the progression of atherosclerosis by promoting the apoptosis of macrophages, endothelial cells, and vascular smooth muscle cells. In addition, IR with hyperglycemia induces hyperglycosylation, which promotes smooth muscle cell proliferation, collagen cross-linking, and collagen deposition, and is closely associated with a substantial increase in the incidence of vascular fibrosis and stiffness. The cascade of pathological changes associated with IR ultimately leads to an increased incidence of atherosclerosis, cardiovascular diseases, and all-cause mortality.
We also found that after the addition of HOMA-IR, FBG, TG, and TyG grades to the base model, only the TyG index optimized the model, whereas HOMA-IR, FBG, and TG failed to optimize the model, indicating that the TyG index, although calculated from FBG and TG, has a higher diagnostic value, probably because it represents both lipid and glycemic factors and has a higher correlation with IR. HOMA-IR is commonly used for the indirect assessment of IR. However, its clinical utility is limited by the testing methods and costs. Compared to HOMA-IR, the TyG index not only has a higher predictive value for ASCVD, but also does not increase medical expenses, offering significant clinical applicability. However, it has to be mentioned that ASCVD is a dynamic, progressive disease and treatment should be initiated according to the patient’s specific situation, which makes the use of baseline TyG index as a prognostic marker less certain.
This study had several limitations. First, this was an observational study; therefore, it was difficult to exclude the effects of confounding factors. Second, the diagnoses of CAD and stroke are based on self-reported medical history, whereas the diagnosis of PAD is based on ABPI rather than angiography, which may miss patients in the early stages of the disease or those who have not sought medical attention. Third, the data on triglyceride and glucose levels were measured only at baseline and the effect of changes in TyG levels over time on ASCVD was not considered. Furthermore, the use of lipid- and glucose-lowering medications was not considered. Finally, due to the cross-sectional nature of this study, the research results can only indicate an association between the TyG index and high ASCVD risk, but cannot establish a causal relationship between the two. Further longitudinal studies are required to clarify the causal relationship between TyG index and ASCVD.
Conclusion
In the general population, our study demonstrated that the TyG index was positively associated with the occurrence of ASCVD and had a certain predictive value. However, ASCVD is a dynamic and progressive disease; therefore, enabling the use of the TyG index in real time to dynamically predict the risk of ASCVD is the next challenge for our team.
Data availability statement
The original contributions presented in the study are included in the article/supplementary material, further inquiries can be directed to the corresponding author/s.
Ethics statement
The studies involving humans were approved by National Health and Nutrition Examination Survey. The studies were conducted in accordance with the local legislation and institutional requirements. Written informed consent for participation in this study was provided by the participants’ legal guardians/next of kin.
Author contributions
JS: Data curation, Formal analysis, Methodology, Project administration, Writing – original draft, Writing – review & editing, Conceptualization. XC: Data curation, Formal analysis, Methodology, Project administration, Writing – original draft, Writing – review & editing, Investigation. HL: Data curation, Formal analysis, Investigation, Methodology, Project administration, Writing – original draft, Writing – review & editing. YZ: Data curation, Investigation, Writing – original draft.
Funding
The author(s) declare that no financial support was received for the research, authorship, and/or publication of this article.
Acknowledgments
We thank Rui Luo for his advice.
Conflict of interest
The authors declare that the research was conducted in the absence of any commercial or financial relationships that could be construed as a potential conflict of interest.
Publisher’s note
All claims expressed in this article are solely those of the authors and do not necessarily represent those of their affiliated organizations, or those of the publisher, the editors and the reviewers. Any product that may be evaluated in this article, or claim that may be made by its manufacturer, is not guaranteed or endorsed by the publisher.
References
1. Borén J, Williams KJ. The central role of arterial retention of cholesterol-rich apolipoprotein B-containing lipoproteins in the pathogenesis of atherosclerosis: A triumph of simplicity. Curr Opin Lipidol. (2016) 27:473–83. doi: 10.1097/MOL.0000000000000330
2. Kavousi M, Desai CS, Ayers C, Blumenthal RS, Budoff MJ, Mahabadi AA, et al. Prevalence and prognostic implications of coronary artery calcification in low-risk women: A meta-analysis. JAMA. (2016) 316:2126–34. doi: 10.1001/jama.2016.17020
3. Blaum C, Seiffert M, Goßling A, Kröger F, Bay B, Lorenz T, et al. The need for PCSK9 inhibitors and associated treatment costs according to the 2019 ESC dyslipidaemia guidelines vs. the risk-based allocation algorithm of the 2017 ESC consensus statement: A simulation study in a contemporary CAD cohort. Eur J Prev Cardiol. (2021) 28:47–56. doi: 10.1093/eurjpc/zwaa088
4. DeFilippis AP, Trainor PJ, Thanassoulis G, Brumback LC, Post WS, Tsai MY, et al. Atherothrombotic factors and atherosclerotic cardiovascular events: The multi-ethnic study of atherosclerosis. Eur Heart J. (2022) 43:971–81. doi: 10.1093/eurheartj/ehab600
5. Tsao CW, Aday AW, Almarzooq ZI, Alonso A, Beaton AZ, Bittencourt MS, et al. Correction to: Heart disease and stroke Statistics-2022 update: A report from the American Heart Association. Circulation. (2022) 145(8):e153-639. doi: 10.1161/CIR.0000000000001052
6. Curtin SC. Trends in cancer and heart disease death rates among adults aged 45–64: United States, 1999–2017. Natl Vital Stat Rep. (2019) 68:1–9.
7. Khan SS, Matsushita K, Sang Y, Ballew SH, Grams ME, Surapaneni A, et al. Development and validation of the American Heart Association predicting risk of cardiovascular disease EVENTs (PREVENT) equations. Circulation. (2023) 149(6):430–49. doi: 10.1161/CIRCULATIONAHA.123.067626
8. Colantonio LD, Hubbard D, Monda KL, Mues KE, Huang L, Dai Y, et al. Atherosclerotic risk and statin use among patients with peripheral artery disease. J Am Coll Cardiol. (2020) 76:251–64. doi: 10.1016/j.jacc.2020.05.048
9. Bornfeldt KE, Tabas I. Insulin resistance, hyperglycemia, and atherosclerosis. Cell Metab. (2011) 14:575–85. doi: 10.1016/j.cmet.2011.07.015
10. Nolan CJ, Prentki M. Insulin resistance and insulin hypersecretion in the metabolic syndrome and type 2 diabetes: Time for a conceptual framework shift. Diabetes Vasc Dis Res. (2019) 16:118–27. doi: 10.1177/1479164119827611
11. Kashyap SR, Desouza C, Aroda VR, Kim SH, Neff LM, Wu SS, et al. Glycemic and metabolic subclassification of prediabetes and risk factors for cardiovascular disease in the D2d cohort. Am J Prev Cardiol. (2023) 15:100525. doi: 10.1016/j.ajpc.2023.100525
12. Rehman K, Akash MS. Mechanisms of inflammatory responses and development of insulin resistance: How are they interlinked? J BioMed Sci. (2016) 23:87. doi: 10.1186/s12929-016-0303-y
13. Rehman K, Haider K, Jabeen K, Akash MSH. Current perspectives of oleic acid: Regulation of molecular pathways in mitochondrial and endothelial functioning against insulin resistance and diabetes. Rev Endocr Metab Disord. (2020) 21:631–43. doi: 10.1007/s11154–020-09549–6
14. Simental-Mendía LE, Rodríguez-Morán M, Guerrero-Romero F. The product of fasting glucose and triglycerides as surrogate for identifying insulin resistance in apparently healthy subjects. Metab Syndr Relat Disord. (2008) 6:299–304. doi: 10.1089/met.2008.0034
15. Jia L, Shang S, Yang Y, Zhang J, Lin X. The synergy of serum SFRP5 levels and the TyG index in predicting coronary artery disease and prognosing major adverse cardiovascular events. Lipids Health Dis. (2023) 22:194. doi: 10.1186/s12944–023-01965–2
16. Pan W, Ren Y, Yang F, Wang M, Li X, Yin D. Triglyceride glucose index is associated with obstructive coronary artery disease in hypertensive patients. Cardiovasc Diabetol. (2023) 22:9. doi: 10.1186/s12933–023-01739–1
17. Alizargar J, Bai CH, Hsieh NC, Wu SV. Use of the triglyceride-glucose index (TyG) in cardiovascular disease patients. Cardiovasc Diabetol. (2020) 19:8. doi: 10.1186/s12933–019-0982–2
18. Wang F, Wang J, Han Y, Shi X, Xu X, Hou C, et al. Triglyceride-glucose index and stroke recurrence in elderly patients with ischemic stroke. Front Endocrinol (Lausanne). (2022) 13:1005614. doi: 10.3389/fendo.2022.1005614
19. Xing Y, Liu J, Gao Y, Zhu Y, Zhang Y, Ma H. Stronger associations of TyG index with diabetes than TyG-obesity-related parameters: More pronounced in young, middle-aged, and women. Diabetes Metab Syndr Obes. (2023) 16:3795–805. doi: 10.2147/DMSO.S433493
20. Qin A, Tan J, Wang S, Dong L, Jiang Z, Yang D, et al. Triglyceride-glucose index may predict renal survival in patients with IgA nephropathy. J Clin Med. (2022) 11(17). doi: 10.3390/jcm11175176
21. Formosa C, Cassar K, Gatt A, Mizzi A, Mizzi S, Camileri KP, et al. Hidden dangers revealed by misdiagnosed peripheral arterial disease using ABPI measurement. Diabetes Res Clin Pract. (2013) 102:112–6. doi: 10.1016/j.diabres.2013.10.006
22. Al-Qaisi M, Nott DM, King DH, Kaddoura S. Ankle brachial pressure index (ABPI): An update for practitioners. Vasc Health Risk Manag. (2009) 5:833–41. doi: 10.2147/vhrm.s6759
23. American Diabetes Association. Peripheral arterial disease in people with diabetes. Diabetes Care. (2003) 26:3333–41. doi: 10.2337/diacare.26.12.3333
24. Roeters van Lennep JE, Tokgözoğlu LS, Badimon L, Dumanski SM, Gulati M, Hess CN, et al. Women, lipids, and atherosclerotic cardiovascular disease: A call to action from the European Atherosclerosis Society. Eur Heart J. (2023) 44:4157–73. doi: 10.1093/eurheartj/ehad472
25. Lee M, Choi WJ, Lee Y, Lee K, Park MW, Myong JP, et al. Association between statin therapy and mortality in patients on dialysis after atherosclerotic cardiovascular diseases. Sci Rep. (2023) 13:10940. doi: 10.1038/s41598–023-37819–1
26. Yang HS, Jeong HJ, Kim H, Lee S, Hur M. Sex-specific relationships between HDL-cholesterol levels and 10-year mortality in individuals with atherosclerotic cardiovascular disease: A nationwide cohort study of South Koreans. Metabolites. (2023) 13(12). doi: 10.3390/metabo13121175
27. Qu H, Long LZ, Chen L, Wu HT, Fu CG, Zhang SS. Triglyceride-glucose index and estimated 10-year risk of a first hard cardiovascular event. Front Cardiovasc Med. (2022) 9:994329. doi: 10.3389/fcvm.2022.994329
28. Barzegar N, Tohidi M, Hasheminia M, Azizi F, Hadaegh F. The impact of triglyceride-glucose index on incident cardiovascular events during 16 years of follow-up: Tehran Lipid and glucose Study. Cardiovasc Diabetol. (2020) 19:155. doi: 10.1186/s12933–020-01121–5
29. Liu Y, Zhu B, Zhou W, Du Y, Qi D, Wang C, et al. Triglyceride-glucose index as a marker of adverse cardiovascular prognosis in patients with coronary heart disease and hypertension. Cardiovasc Diabetol. (2023) 22:133. doi: 10.1186/s12933–023-01866–9
30. Wang L, Cong HL, Zhang JX, Hu YC, Wei A, Zhang YY, et al. Triglyceride-glucose index predicts adverse cardiovascular events in patients with diabetes and acute coronary syndrome. Cardiovasc Diabetol. (2020) 19:80. doi: 10.1186/s12933-020-01054-z
31. Wang M, Zhou L, Su W, Dang W, Li H, Chen H. Independent and joint associations between the triglyceride-glucose index and NT-proBNP with the risk of adverse cardiovascular events in patients with diabetes and acute coronary syndrome: A prospective cohort study. Cardiovasc Diabetol. (2023) 22:149. doi: 10.1186/s12933–023-01890–9
32. Jin JL, Cao YX, Wu LG, You XD, Guo YL, Wu NQ, et al. Triglyceride glucose index for predicting cardiovascular outcomes in patients with coronary artery disease. J Thorac Dis. (2018) 10:6137–46. doi: 10.21037/jtd.2018.10.79
33. Jin JL, Sun D, Cao YX, Guo YL, Wu NQ, Zhu CG, et al. Triglyceride glucose and haemoglobin glycation index for predicting outcomes in diabetes patients with new-onset, stable coronary artery disease: A nested case-control study. Ann Med. (2018) 50:576–86. doi: 10.1080/07853890.2018.1523549
34. Gao S, Ma W, Huang S, Lin X, Yu M. Impact of triglyceride-glucose index on long-term cardiovascular outcomes in patients with myocardial infarction with nonobstructive coronary arteries. Nutr Metab Cardiovasc Dis. (2021) 31:3184–92. doi: 10.1016/j.numecd.2021.07.027
35. Wang X, Feng B, Huang Z, Cai Z, Yu X, Chen Z, et al. Relationship of cumulative exposure to the triglyceride-glucose index with ischemic stroke: A 9-year prospective study in the Kailuan cohort. Cardiovasc Diabetol. (2022) 21:66. doi: 10.1186/s12933-022-01510-y
36. Wu Y, Yang Y, Zhang J, Liu S, Zhuang W. The change of triglyceride-glucose index may predict incidence of stroke in the general population over 45 years old. Cardiovasc Diabetol. (2023) 22:132. doi: 10.1186/s12933-023-01870-z
37. Gao JW, Hao QY, Gao M, Zhang K, Li XZ, Wang JF, et al. Triglyceride-glucose index in the development of peripheral artery disease: Findings from the Atherosclerosis Risk in Communities (ARIC) Study. Cardiovasc Diabetol. (2021) 20:126. doi: 10.1186/s12933–021-01319–1
38. Krishna SM. Vitamin D as A protector of arterial health: Potential role in peripheral arterial disease formation. Int J Mol Sci. (2019) 20(19). doi: 10.3390/ijms20194907
39. Lane JS, Magno CP, Lane KT, Chan T, Hoyt DB, Greenfield S. Nutrition impacts the prevalence of peripheral arterial disease in the United States. J Vasc Surg. (2008) 48:897–904. doi: 10.1016/j.jvs.2008.05.014
40. Cong G, Yan R, Sachdev U. Low serum vitamin C correlates with an increased risk of peripheral arterial disease in current smokers: Results from NHANES 2003–2004. Int J Cardiol Hypertens. (2020) 6. doi: 10.1016/j.ijchy.2020.100037
41. Lu YW, Chang CC, Chou RH, Tsai YL, Liu LK, Chen LK, et al. Gender difference in the association between TyG index and subclinical atherosclerosis: Results from the I-Lan Longitudinal Aging Study. Cardiovasc Diabetol. (2021) 20:206. doi: 10.1186/s12933–021-01391–7
42. Liu X, Abudukeremu A, Jiang Y, Cao Z, Wu M, Ma J, et al. U-shaped association between the triglyceride-glucose index and atrial fibrillation incidence in a general population without known cardiovascular disease. Cardiovasc Diabetol. (2023) 22:118. doi: 10.1186/s12933–023-01777–9
43. Wilkin TJ, Murphy MJ. The gender insulin hypothesis: Why girls are born lighter than boys, and the implications for insulin resistance. Int J Obes (Lond). (2006) 30:1056–61. doi: 10.1038/sj.ijo.0803317
44. Godfrey KM, Hales CN, Osmond C, Barker DJ. Taylor KPRelation of cord plasma concentrations of proinsulin, 32–33 split proinsulin, insulin and C-peptide to placental weight and the baby’s size and proportions at birth. Early Hum Dev. (1996) 46:129–40. doi: 10.1016/0378–3782(96)01752–5
45. Shields BM, Knight B, Shakespeare L, Babrah J, Powell RJ, Clark PM, et al. Determinants of insulin concentrations in healthy 1-week-old babies in the community: Applications of a bloodspot assay. Early Hum Dev. (2006) 82:143–8. doi: 10.1016/j.earlhumdev.2005.05.006
46. Allard P, Delvin EE, Paradis G, Hanley JA, O’Loughlin J, Lavallée C, et al. Distribution of fasting plasma insulin, free fatty acids, and glucose concentrations and of homeostasis model assessment of insulin resistance in a representative sample of Quebec children and adolescents. Clin Chem. (2003) 49:644–9. doi: 10.1373/49.4.644
47. Duncan AC, Lyall H, Roberts RN, Petrie JR, Perera MJ, Monaghan S, et al. The effect of estradiol and a combined estradiol/progestagen preparation on insulin sensitivity in healthy postmenopausal women. J Clin Endocrinol Metab. (1999) 84:2402–7. doi: 10.1210/jcem.84.7.5836
48. Wang L, Wang Y, Liu R, Xu L, Zhong W, Li L, et al. Influence of age on the association between the triglyceride-glucose index and all-cause mortality in patients with cardiovascular diseases. Lipids Health Dis. (2022) 21:135. doi: 10.1186/s12944–022-01738–3
49. Ma X, Dong L, Shao Q, Cheng Y, Lv S, Sun Y, et al. Triglyceride glucose index for predicting cardiovascular outcomes after percutaneous coronary intervention in patients with type 2 diabetes mellitus and acute coronary syndrome. Cardiovasc Diabetol. (2020) 19:31. doi: 10.1186/s12933–020-01006–7
50. Chen G, Shi L, Cai L, Lin W, Huang H, Liang J, et al. Comparison of insulin resistance and beta-cell dysfunction between the young and the elderly in normal glucose tolerance and prediabetes population: A prospective study. Horm Metab Res. (2017) 49:135–41. doi: 10.1055/s-0042–111325
51. Jiang J, Cai X, Pan Y, Du X, Zhu H, Yang X, et al. Relationship of obesity to adipose tissue insulin resistance. BMJ Open Diabetes Res Care. (2020) 8(1). doi: 10.1136/bmjdrc-2019–000741
52. Chen S, Miki T, Fukunaga A, Eguchi M, Kochi T, Nanri A, et al. Associations of serum amino acids with insulin resistance among people with and without overweight or obesity: A prospective study in Japan. Clin Nutr. (2022) 41:1827–33. doi: 10.1016/j.clnu.2022.06.039
53. Zhao N, Yu X, Zhu X, Song Y, Gao F, Yu B, et al. Diabetes mellitus to accelerated atherosclerosis: Shared cellular and molecular mechanisms in glucose and lipid metabolism. J Cardiovasc Transl Res. (2024) 17:133–52. doi: 10.1007/s12265-023-10470-x
Keywords: triglyceride-glucose index, atherosclerotic cardiovascular disease, coronary artery disease, ischemic stroke, peripheral arterial disease
Citation: Jihong S, Xiaojie C, He L and Yifan Z (2024) Association between the triglyceride glucose index and atherosclerotic cardiovascular disease in the general population: analysis of the national health and nutrition examination survey 1999–2004. Front. Endocrinol. 15:1376357. doi: 10.3389/fendo.2024.1376357
Received: 25 January 2024; Accepted: 30 April 2024;
Published: 21 May 2024.
Edited by:
Yun Kyung Cho, Asan Medical Center, Republic of KoreaReviewed by:
Lorenzo Da Dalt, University of Milan, ItalyShinjeong Song, Ewha Womans University, Republic of Korea
Copyright © 2024 Jihong, Xiaojie, He and Yifan. This is an open-access article distributed under the terms of the Creative Commons Attribution License (CC BY). The use, distribution or reproduction in other forums is permitted, provided the original author(s) and the copyright owner(s) are credited and that the original publication in this journal is cited, in accordance with accepted academic practice. No use, distribution or reproduction is permitted which does not comply with these terms.
*Correspondence: Chen Xiaojie, cxj123562024@163.com
†These authors have contributed equally to this work and share first authorship