 Yan Chen
 Chuan Lu
 Haonan Ju
 Qingzhi Zhou
 Xin Zhao
- Department of Cardiology, The Second Hospital of Dalian Medical University, Dalian, China
Background: Atherogenic Index of plasma (AIP) is closely related to metabolic abnormalities. But as of now, there is no definitive conclusion on the dose-response relationship pattern between AIP and metabolic associated fatty liver disease (MAFLD).
Objective: The objective of this study was to provide a fresh insight for understanding the intrinsic link between AIP and the prevalence of MAFLD by exploring the dose-response pattern between AIP and MAFLD.
Methods: A total of 9254 participants received the survey and 1090 participants were finally included according to the screening criteria. To evaluate the association between AIP and the prevalence of MAFLD based on weighted multivariate logistic regression. Sensitivity analysis of the association between AIP and MAFLD was performed using propensity score matching (PSM). Restrictive cubic splines (RCS) were used to identify patterns of dose-response relationships between AIP and MAFLD, and receiver operator characteristic (ROC) curves were used to evaluate the predictive ability of AIP and traditional lipid parameters for MAFLD.
Results: In this study, a total of 563 participants were found to have MAFLD. The results of weighted multivariate logistic regression analysis demonstrated that, after adjusting for sex and age, participants in the highest quartile (Q4) of AIP had a significantly increased risk of developing MAFLD compared to those in the lowest quartile (Q1) (Model 2: OR = 9.03, 95% CI 4.75–17.17). A similar trend was observed in the fully adjusted model (Model 3: OR = 3.85, 95% CI 1.55–9.52). The RCS analysis revealed a linear dose-response association between AIP and MAFLD(P for crude non-linearity = 0.087). This association remained significant after accounting for potential confounding variables(P for adjusted non-linearity = 0.663). The ROC curve results suggest that AIP performs better than traditional lipid indicators in predicting MAFLD (AUC = 0.732, 95%CI 0.705–0.758).
Conclusion: A linear dose-response relationship exists between AIP and MAFLD, suggesting that as AIP increases, so does the risk of developing MAFLD.
Introduction
In recent years, more and more attention has been paid to MAFLD characterized by hepatic steatosis and metabolic abnormalities (1, 2). According to statistics, the combined prevalence of MAFLD is 39.22% (3), especially in economically developed countries and regions. With the systematic definition of MAFLD diagnostic criteria (1), there is increasing recognition of the important role of metabolic abnormalities in such diseases. Unlike NAFLD, MAFLD is not a diagnosis of exclusion, and its definition identifies more patients with metabolic abnormalities and hepatic steatosis, thus having greater clinical applicability (1, 4, 5). Existing studies have indicated that MAFLD is superior to non-alcoholic fatty liver disease(NAFLD) in terms of identifying cardiovascular adverse events, risk of liver disease progression, and risk of all-cause mortality (4, 6, 7). This advantage might be attributed to the frequent presence of metabolic abnormalities observed among patients with MAFLD (8). With the growing prevalence of obesity and diabetes worldwide, the trend of the MAFLD pandemic may also worsen in the future (9, 10). Therefore, accurately identifying underlying MAFLD patients is crucial for improving their prognosis.
AIP is a novel lipid marker proposed by Dobiásová. It is obtained by performing logarithmic transformation on the ratios of triglyceride (TG) to high-density lipoprotein cholesterol (HDL-C) (11). AIP demonstrates an inverse relationship with lipoprotein particle size, leading to its recognition as a dependable proxy for small dense low-density lipoprotein cholesterol (sd-LDL-C) (11). Recent studies have shown that AIP outperforms traditional lipid markers in predicting the risk of cardiovascular disease (12–16). Interestingly, AIP is not only strongly associated with atherosclerosis, but also reflects the severity of insulin resistance(IR) in humans (17). Previous findings have shown that AIP is strongly associated with metabolic diseases, such as hypertension, diabetes, obesity, and atherosclerotic cardiovascular disease (15, 18–20). In view of the close association between AIP and indicators of human metabolic status (21), it is essential to investigate the potential connection between AIP and MAFLD to better find a convenient and easily accessible index for screening patients with MAFLD. Previous studies have verified the association between AIP and the prevalence of MAFLD among Chinese and Iranian individuals (22, 23). However, studies assessing the association between AIP and MAFLD prevalence among the American population remain scarce, and there is currently no research exploring the dose-response relationship between AIP and MAFLD prevalence.
Therefore, utilizing a cross-sectional analysis of NHANES (2017–2018) data, this study endeavors to illuminate the association between AIP and MAFLD prevalence among the general population in the United States. Furthermore, it explores the potential dose-response relationship patterns between AIP and MAFLD, offering a fresh perspective for assessing their association.
Methods
Study population
The NHANES, which commenced in the early 1960s and underwent a transformation in 1999, is a carefully planned study that assesses the comprehensive health and nutritional well-being of American adults and children (24). It has evolved into a continuous endeavor with a dynamic focus on diverse health and nutrition metrics to cater to evolving necessities. Each year, this survey meticulously examines a representative sample of approximately 5,000 individuals from across the nation. Data was gathered through face-to-face interviews and extensive health checks at mobile centers, employing a complex sampling method that ensured a representative cross-section of the population. Specifically, the study utilized information from the NHANES 2017–2018, encompassing 9,254 individuals. However, after rigorous screening, only 1,090 participants were deemed suitable for the analytical purposes of the research. The National Center for Health Statistics(NCHS) Research Ethics Review Committee has approved the survey and all participants have signed an informed consent form. The detailed screening process for selecting the final participants in this study is illustrated in Figure 1.
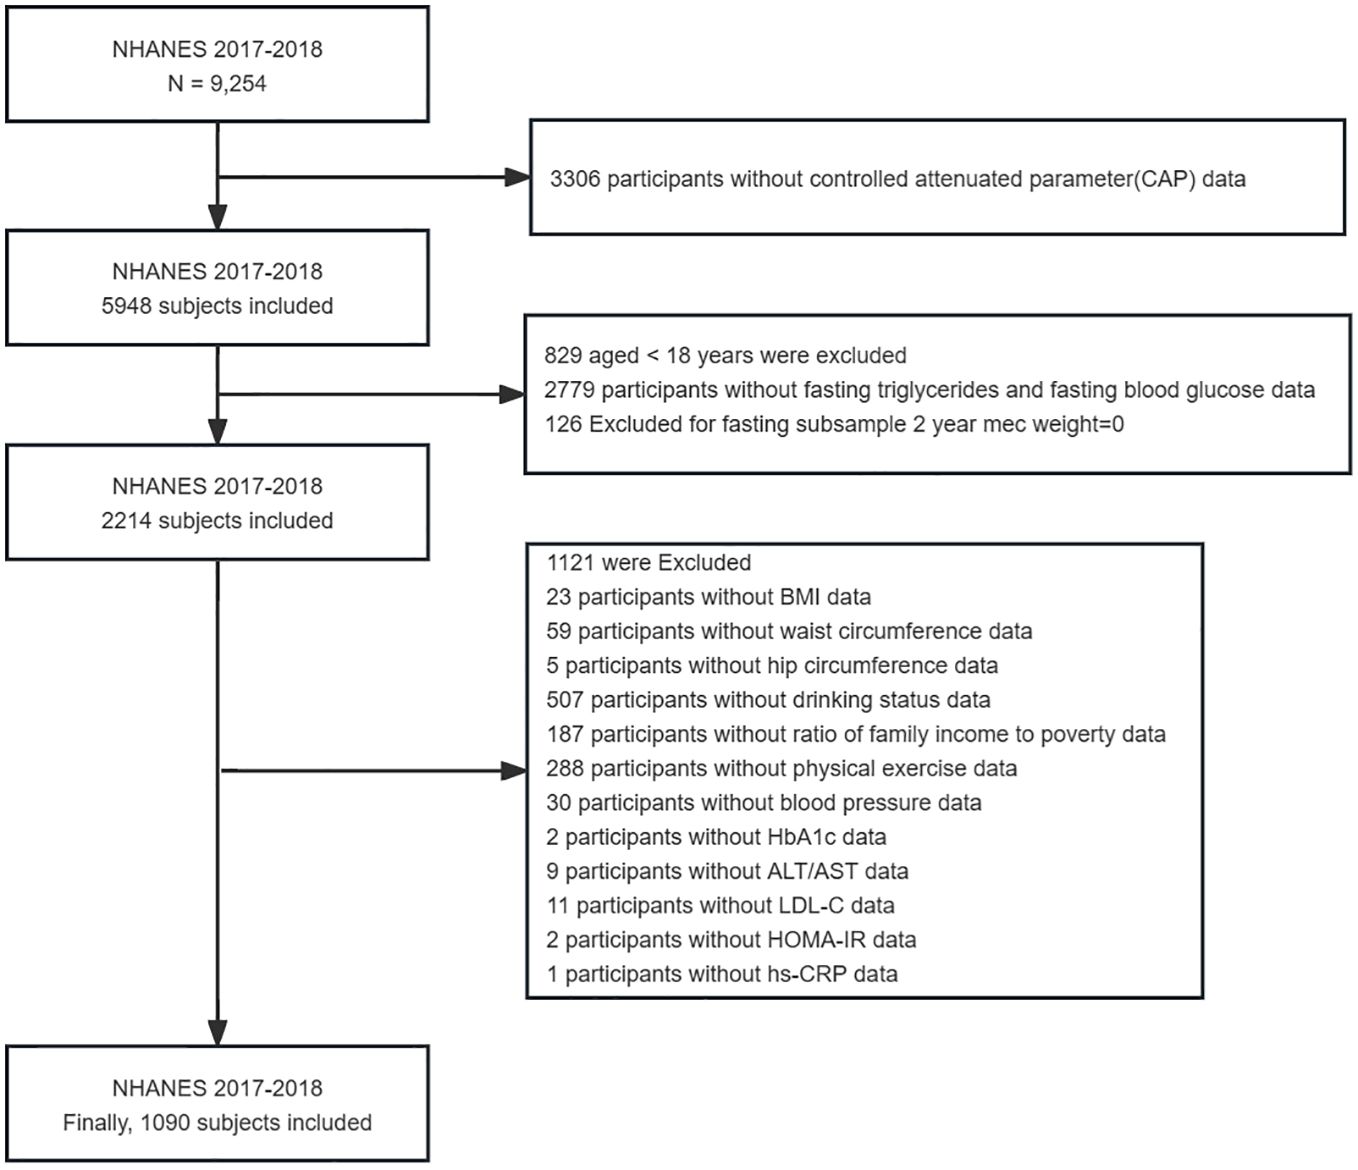
Figure 1 Flow chart of participants selection from the NHANES 2017–2018.
Covariates
Covariates used in this study mainly included sex, age, race, education levels, economic status, BMI, smoking habits, alcohol consumption, waist and hip circumference, physical activity status, as well as health conditions like hypertension, diabetes, and hyperlipidemia. Economic status is gauged using the family income-to-poverty ratio (PIR), with classifications of < 1.0, 1.0–3.0, and > 3.0. The Body Mass Index (BMI) is calculated by dividing the weight in kilograms by the squared height in meters. Subsequently, it is classified into three categories: normal (BMI less than 25 kg/m2 overweight (BMI ranging from 25 to less than 30 kg/m2 and obese (BMI of 30 kg/m2 or higher). Participants were divided into never smokers, former smokers, and current smokers based on their smoking history and current smoking status (25). Drinking status is determined based on specific criteria: heavy drinking is defined as consuming three or more drinks per day for women, four or more drinks per day for men, or engaging in binge drinking on at least five days per month. Moderate drinking is characterized by having two or more drinks per day for females, three or more drinks per day for males, or binge drinking on at least two days per month. Mild drinking is designated for those who do not meet the criteria for heavy or moderate drinking, while never drinking refers to individuals who have consumed less than twelve drinks in their lifetime (26). The data on the use of lipid-lowering drugs by participants was obtained from questionnaire survey. The lipid-lowering drugs in this study mainly included drugs that have a significant impact on TG and HDL-C, such as statins, fibrates, and ezetimibe. Physical activity status was divided into groups according to whether moderate intensity exercise was performed for 150 minutes or more in a week (27). Moderate-intensity exercise was defined as having MET values between 3 and 6, and since NHANES designed questions in the PAQ questionnaire all had MET > 3, these items were considered at least equivalent to moderate-intensity exercise. The investigators asked the participants according to the “vigorous/moderate recreational activity”, “vigorous/moderate recreational activity”, and “walk or bicycle” in the PAQ questionnaire, and if the participants answered “YES” according to the description of the question, they were further asked about the number of times they performed this exercise per week and the time of each exercise.To calculate their total weekly exercise time, simply multiply the frequency of weekly workouts by the length of each session. Finally, we summed the exercise time for all items to calculate the total time participants spent performing moderate intensity exercise for one week. Exercise time at Vigorous intensity was finally multiplied by 2 to convert to exercise time at Moderate intensity. Detailed questionnaire content is available in the NHANES website. Hypertension is diagnosed based on several factors, including a self-reported history of the condition, currently taking medication to lower blood pressure, or exhibiting an average systolic blood pressure that is 140 mmHg or above, and/or a diastolic blood pressure averaging 90 mmHg or more. The diagnostic criteria for diabetes mellitus are as follows: a self-reported physician diagnosis, fasting glucose levels of 7.0 mmol/L or above, glycosylated hemoglobin (HbA1c) levels of 6.5% or higher, and/or the current use of diabetes medications. Hyperlipidemia is determined by assessing various parameters, including LDL-C levels of 130 mg/dL or higher (equivalent to 3.37 mmol/L or above), total cholesterol levels of 200 mg/dL or higher (5.18 mmol/L or above), TG levels of 150 mg/dL or higher (1.7 mmol/L or above), and HDL-C levels below 40 mg/dL for men (less than 1.04 mmol/L) or below 50 mg/dL for women (less than 1.30 mmol/L). Additionally, the use of lipid-lowering medications is also considered in the determination of hyperlipidemia (28). The laboratory test measures include HbA1c, fasting glucose, hs-CRP, fasting TG, total cholesterol (TC), low-density lipoprotein cholesterol (LDL-C), HDL-C, ALT, AST, and HOMA-IR. HOMA-IR is determined by multiplying fasting insulin with fasting plasma glucose and then dividing the result by 22.5 (29). All routine biochemical tests were executed in strict adherence to the standards specified in the NHANES Laboratory/Medical Technologist Procedure Manual.
Calculation of AIP
AIP is derived from the ratio of fasting TG to HDL-C after undergoing logarithmic transformation, calculated as AIP = lg(TG/HDL-C) (11). The participants were categorized into four quartile groups according to their AIP values: Q1 (-1.25, -0.37), Q2 (-0.37, -0.15), Q3 (-0.15, 0.08), and Q4 (0.08, 0.85).
MAFLD diagnosis
The diagnosis of MAFLD is conducted based on the 2020 consensus of the national expert panel. In brief, participants with hepatic steatosis who also exhibit any one of the following conditions: overweight/obesity, type 2 diabetes, or metabolic dysregulation, are diagnosed with MAFLD (1).
In this study, the existence of hepatic steatosis was confirmed using imaging methods. It is worth mentioning that the NHANES (2017–2018) survey employed a new method by combining ultrasound and vibration-controlled transient elastography (VCTE) to assess liver function. Qualified NHANES health professionals performed these evaluations on suitable participants at the NHANES Mobile Examination Center (MEC), utilizing FibroScan® technology. This device measures ultrasonic attenuation, which correlates with hepatic steatosis, and documents controlled attenuation parameters (CAP). Previous studies have demonstrated the reliability of CAP in determining the presence of hepatic steatosis, with CAP values of 248 dB/m or higher indicating the presence of hepatic steatosis (30). In addition, we collected liver stiffness measurements(LSM) to assess liver fibrosis. The extent of fibrosis can be classified into three categories: F2, F3, and F4, with thresholds of 8.2, 9.7, and 13.6 kPa, respectively (31, 32).
Statistical analysis
As recommended by the NHANES guidelines (33), we considered both complex sampling designs and sampling weights in the process of analyzing NHANES data. Because we used the index in fasting state (fasting TG) in this study, we chose fasting subsample MEC Weight (2017–2018). Basic characteristics were presented as counts and percentages (%) for categorical variables and as medians (interquartile range) for continuous variables. Chi-square test was used for differences between groups for categorical variables and Kruskal-Wallis test for differences between groups for continuous variables. Weighted logistic regression was employed to evaluate the relationship between AIP and MAFLD, resulting in the establishment of three models. Model 1 did not adjust for any confounding factors, Model 2 adjusted for sex and age, and Model 3 adjusted for race, education level, PIR, BMI, smoking status, drinking status, hyperlipidemia, hypertension, diabetes, physical activities status, ALT, AST, and lipid-lowering drugs on the basis of Model 2. Sensitivity analyses were performed using further matching propensity score (PSM) to assess whether the association between AIP and MAFLD was stable and reliable. A propensity score calculated for five demographic factors: sex, age, race, educational level, and PIR in the MAFLD and no MAFLD groups, matched 1 to 1 according to the score, with a caliper set at 0.01. Weighted multivariate logistic regression was performed on the data after PSM to assess whether the association between AIP and MAFLD remained significant. The dose-response relationship between AIP and MAFLD was visualized with RCS with three knots, and the predictive accuracy of AIP was assessed using ROC curves. All statistical analyses were performed using R (version 4.2.1, R Core Team 2020, Vienna, Austria) and MedCalc (version 20.022, MedCalc Software Ltd, Ostend, Belgium), considering a P-value less than 0.05 as statistically significant.
Result
Characteristics of participants
A total of 1090 participants were included in this study, including 556 males and 534 females. Participants were divided into Q1-Q4 groups according to AIP quartiles. Compared with the lowest quartile (Q1) group, participants with higher AIP were generally male, Mexican American, current smokers, hyperlipidemia, and diabetes patients, with higher BMI, waist circumference, fasting blood glucose, HOMA-IR, hs-CRP, TC, TG, LDL-C, ALT levels, and lower HDL-C levels(all P-values < 0.05), while there were no differences in age, drinking status, PIR, and AST (all P-values > 0.05), and the baseline characteristics of the participants are detailed in Table 1.
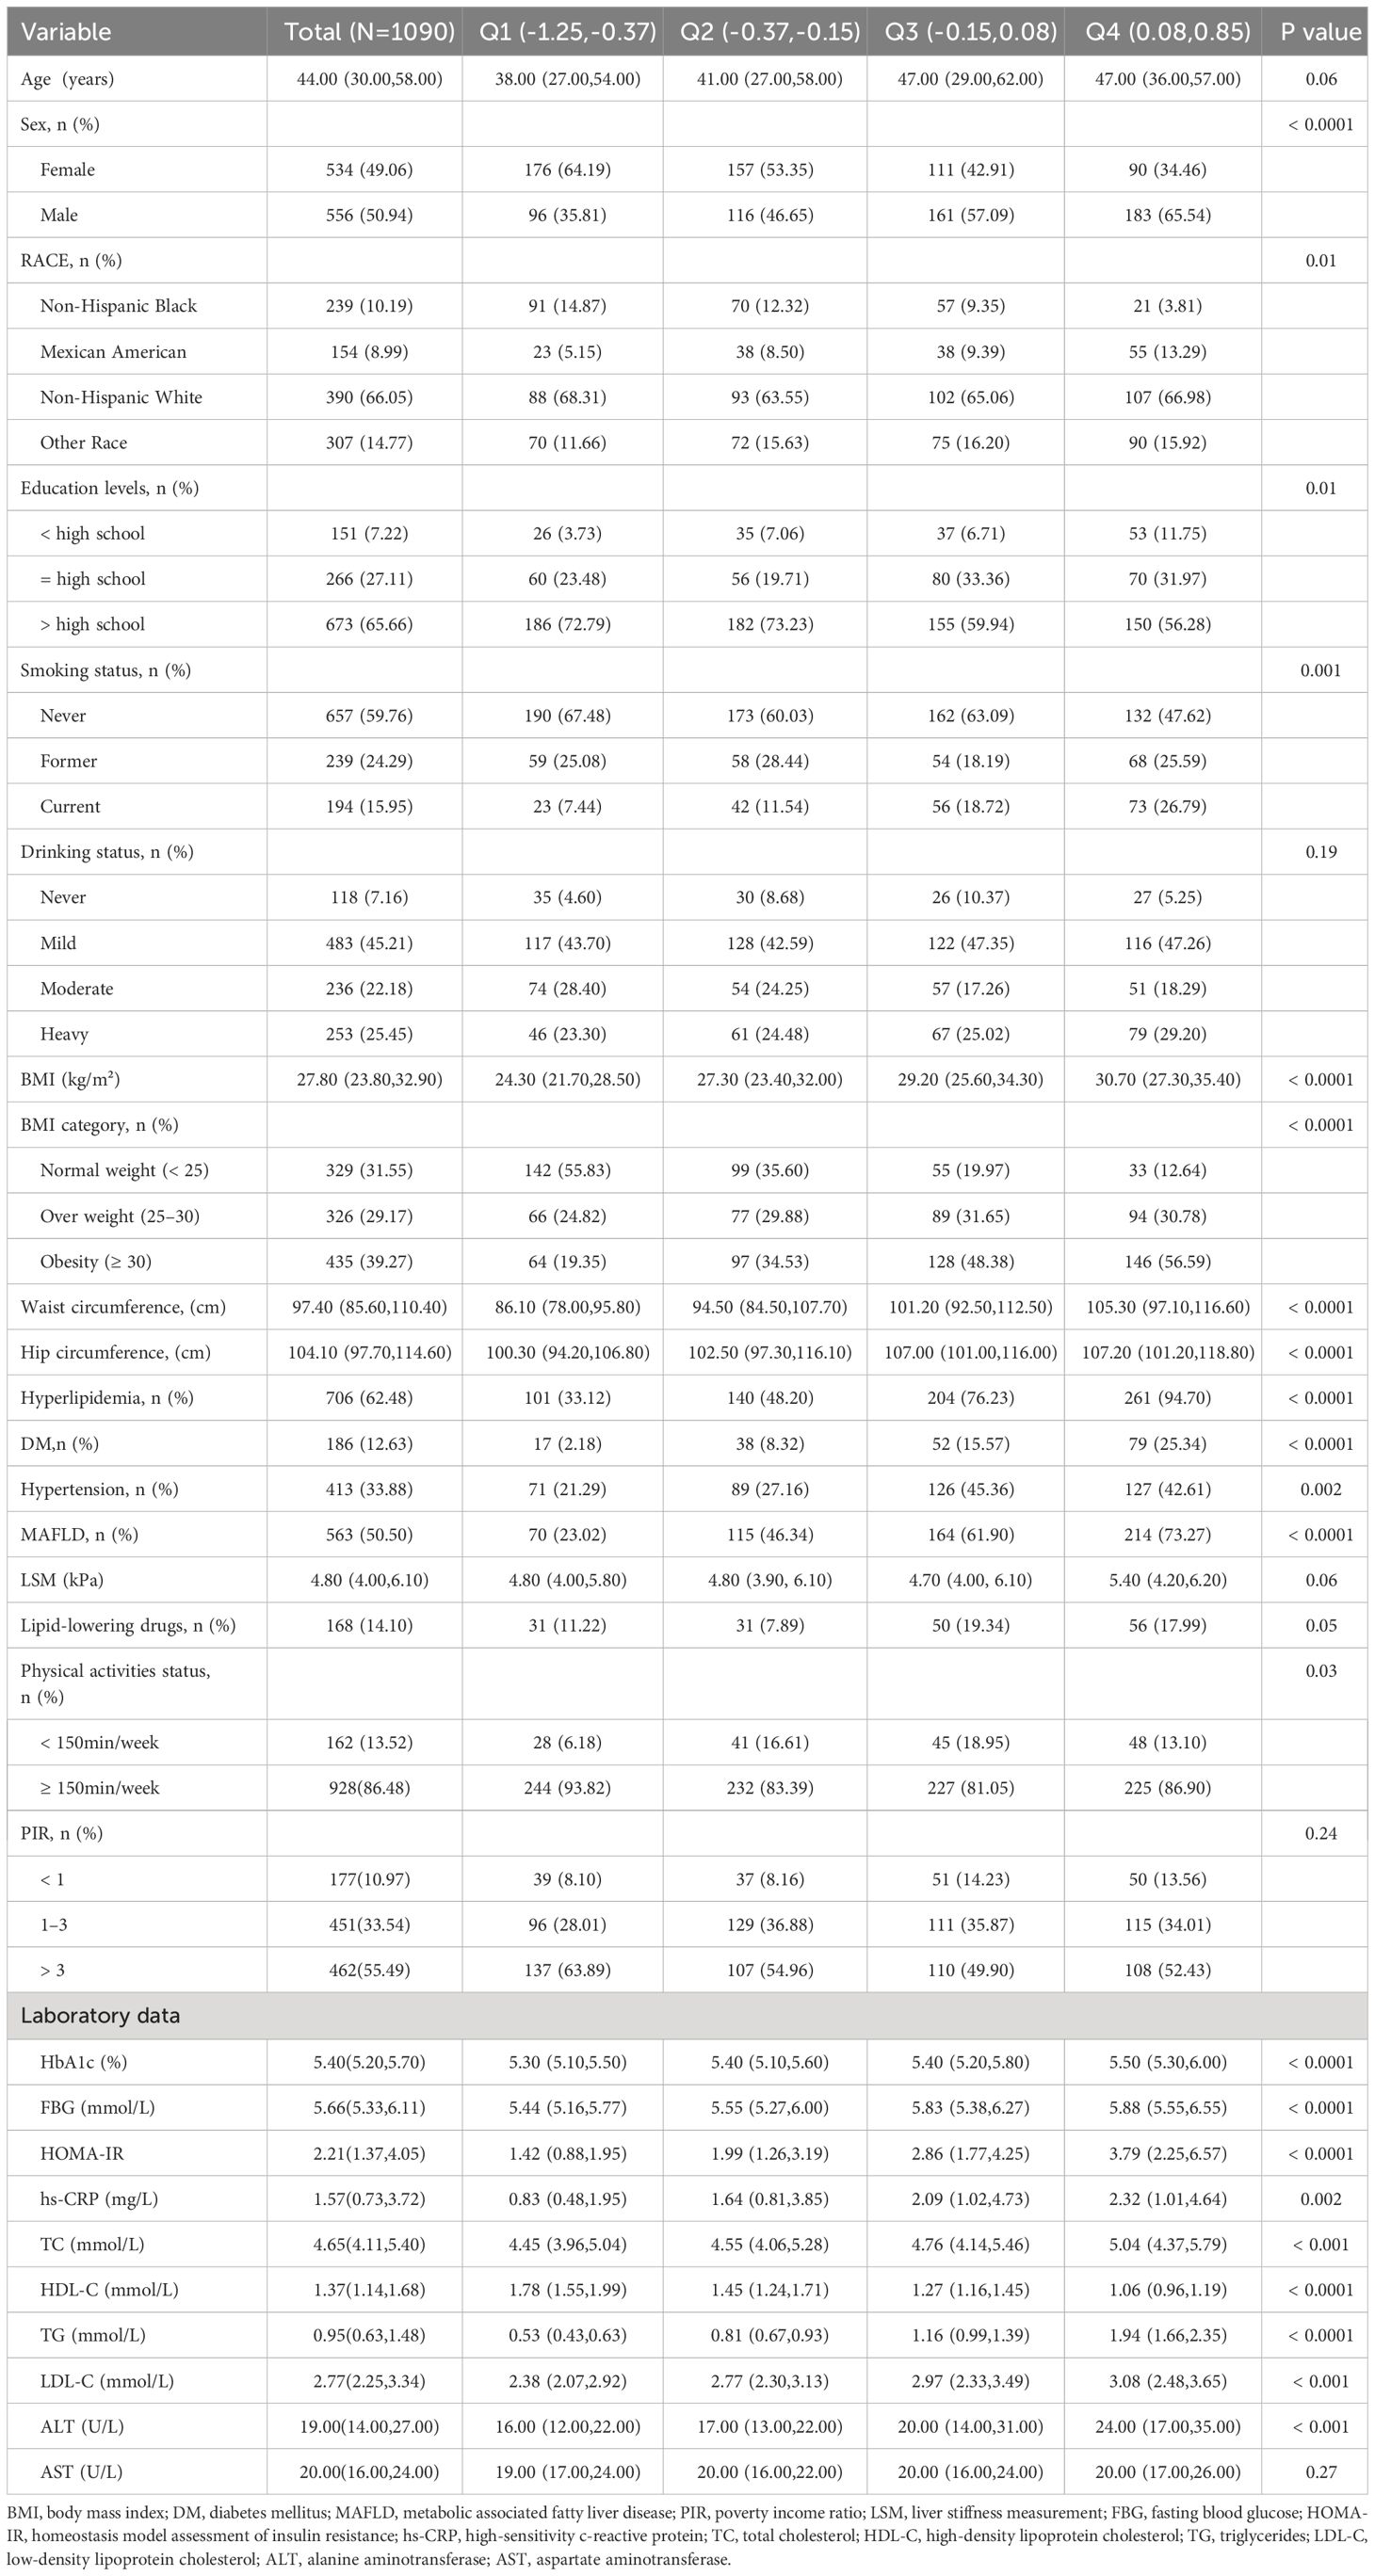
Table 1 Baseline characteristics of the study population based on AIP quartile grouping.
Association between AIP and the presence of MAFLD
The association between AIP and MAFLD prevalence was evaluated based on weighted logistic regression. In the logistic regression model without adjustment, the risk of MAFLD gradually increased in the quartiles with higher AIP compared with the lowest quartile (Q1) (P for trend < 0.0001). Multivariate logistic regression models(Model3) adjusting for potential confounders such as sex, age, race, education level, PIR, BMI, smoking status, drinking status, hyperlipidemia, hypertension, diabetes, physical activities status, ALT, AST, and lipid-lowering drugs, showed that the ORs for participants in Q2, Q3, and Q4 compared to those in Q1 based on their AIP were 2.00 (95% CI 1.03 to 3.91), 2.63 (95% CI 1.39 to 4.96), and 3.85 (95% CI 1.55 to 9.52), respectively (P for trend = 0.006). When AIP was treated as a continuous variable, a strong positive association between AIP and the prevalence of MAFLD remained (Model3: OR = 4.71, 95%CI 1.70–13.01), as detailed in Table 2. Subsequently, in order to further validate the stability of the results and reduce the impact of demographic factors on the results, we used PSM under weighted conditions to adjust demographic characteristics such as gender, age, race, educational level, and PIR between MAFLD patients and those without MAFLD, and the comparison of demographic data between the two groups after adjustment is detailed in Supplementary Table 1. The results of multivariate logistic regression after PSM still suggested a positive association between AIP and the prevalence of MAFLD (Model3: OR = 3.12, 95%CI 1.15–8.42), as detailed in Table 3.
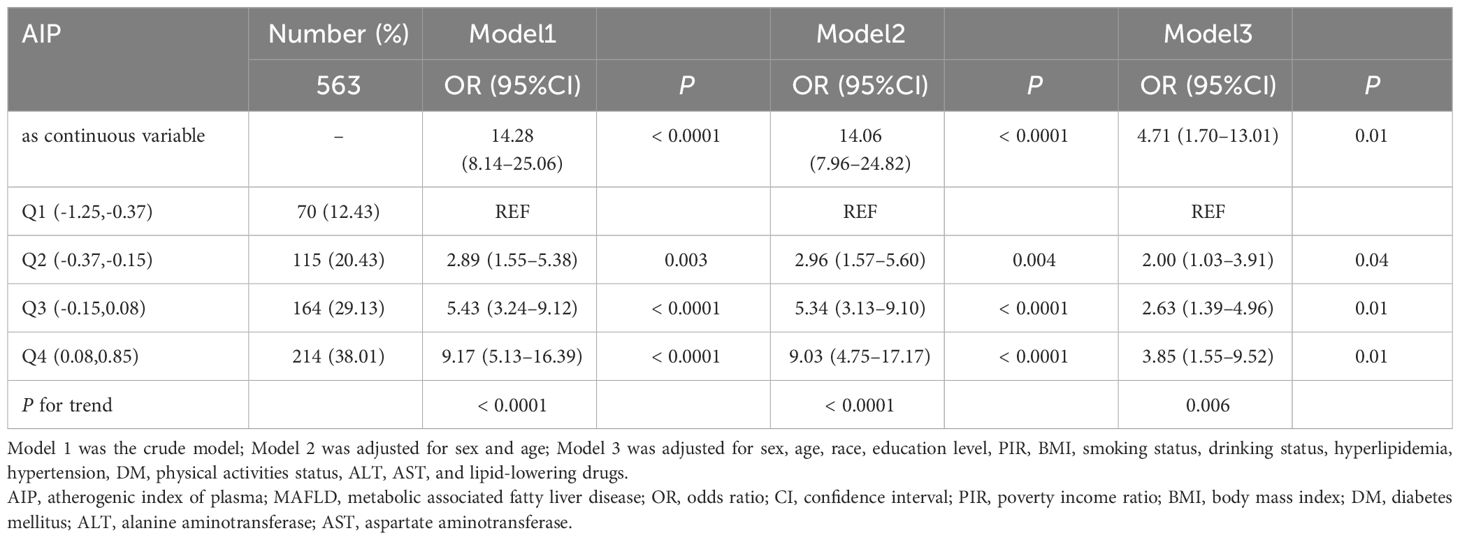
Table 2 Association of AIP as a continuous variable and quartiles with MAFLD.
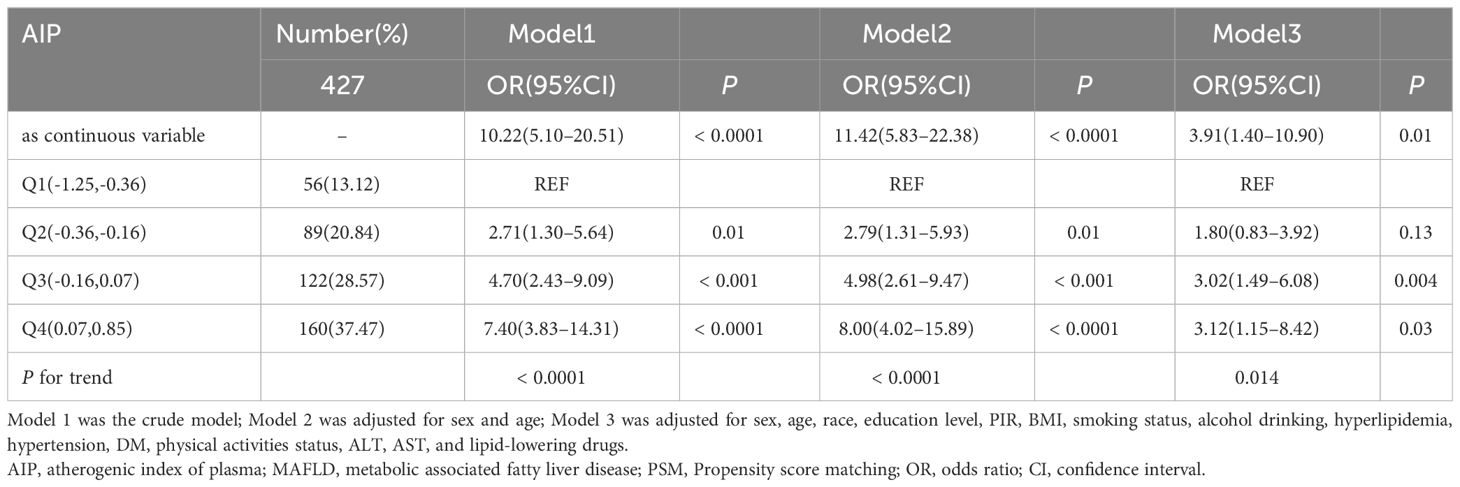
Table 3 Association of AIP as a continuous variable and quartiles with MAFLD after PSM.
In addition, we analyzed the association between AIP and the degree of liver fibrosis, but the results showed no significant association between AIP and liver fibrosis, as detailed in Supplementary Table 2.
Dose-relationship between AIP and MAFLD
The RCS was used to assess the dose-response relationship between AIP and MAFLD and to clarify the pattern of this dose-response relationship. The results showed a linear dose-response relationship between AIP and MAFLD (P for adjusted non-linearity = 0.663), whether adjusted for confounders or not, as shown in Figure 2.
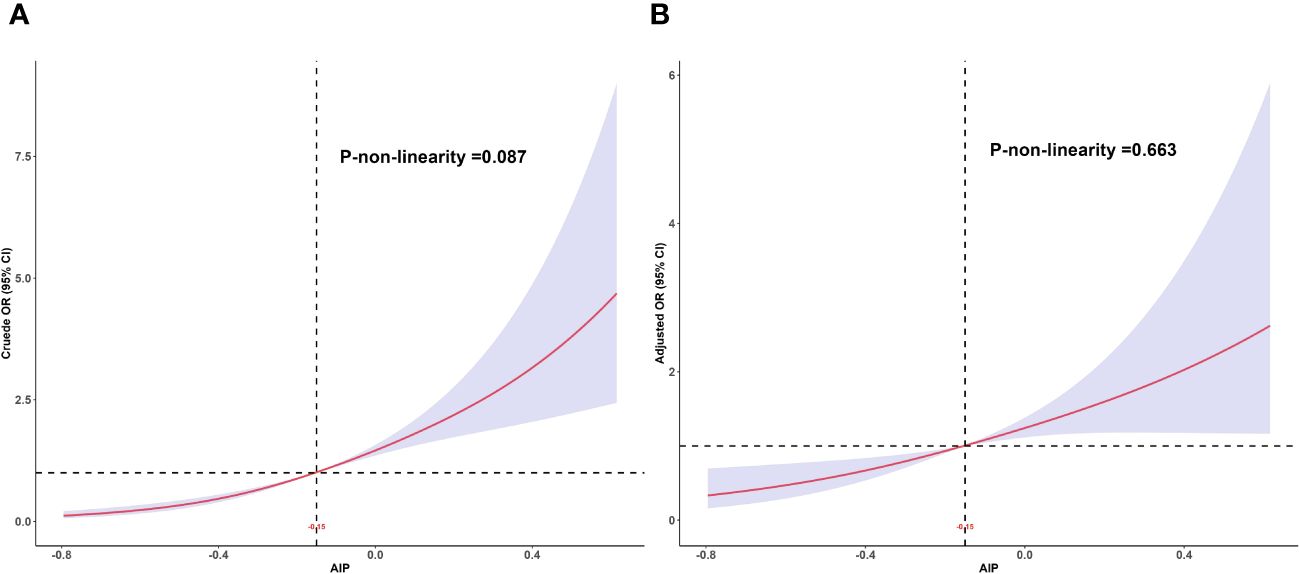
Figure 2 Dose-response relationship between AIP and MAFLD. (A) Unadjusted dose-response relationship between AIP and MAFLD; (B) Adjusted dose-response relationship between AIP and MAFLD. Adjusted factors include sex, age, race, education level, PIR, BMI, smoking status, drinking status, hyperlipidemia, hypertension, DM, physical activities status, ALT, AST, and lipid-lowering drugs. AIP, atherogenic index of plasma; MAFLD, metabolic associated fatty liver disease; PIR, poverty income ratio; BMI, body mass index; DM, diabetes mellitus; ALT, alanine aminotransferase; AST, aspartate aminotransferase.
Due to significant differences in MAFLD prevalence among different age groups and genders, we re-evaluated the dose-response relationship between AIP and MAFLD within these subgroups. The results indicated that a linear dose-response relationship between AIP and MAFLD persisted in both age subgroups (<60 years: P for adjusted non-linearity = 0.851, ≥60 years: P for adjusted non-linearity = 0.879) and gender subgroups (Female: P for adjusted non-linearity = 0.711, Male: P for adjusted non-linearity = 0.824). These findings are detailed in Figure 3.
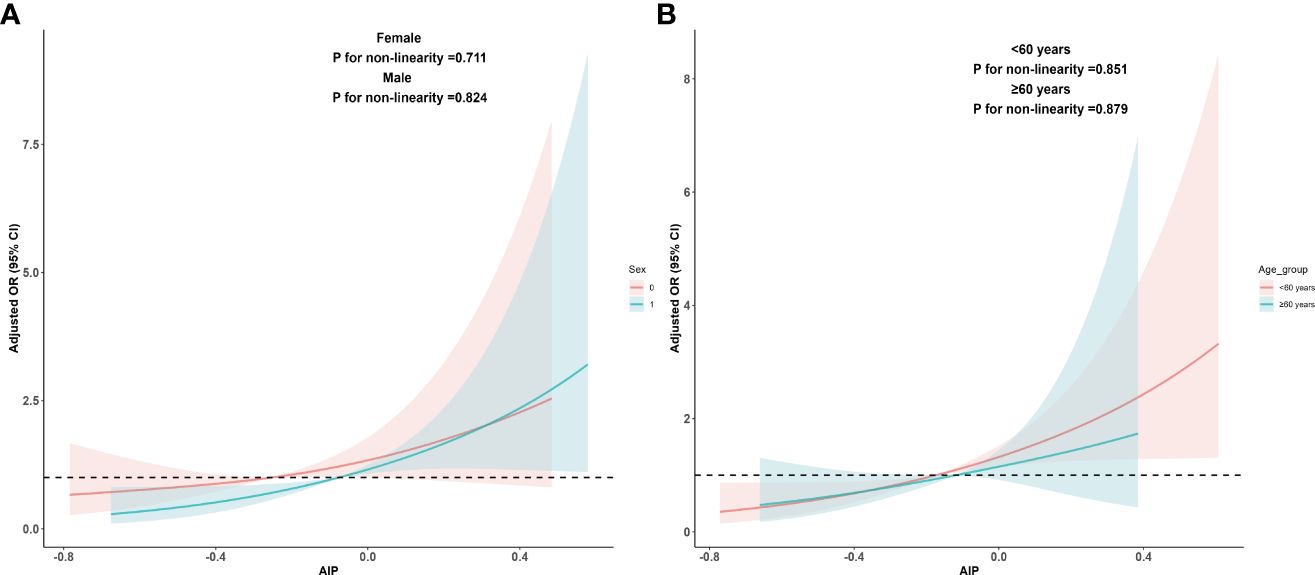
Figure 3 Dose-response relationship between AIP and MAFLD in sex and age subgroups. (A) Adjusted dose-response relationship between AIP and MAFLD in sex subgroups; (B) Adjusted dose-response relationship between AIP and MAFLD in age subgroups. Adjusted factors include sex, age, race, education level, PIR, BMI, smoking status, drinking status, hyperlipidemia, hypertension, DM, physical activities status, ALT, AST, and lipid-lowering drugs. When analyzing sex groups, sex factors should be excluded from confounding factors, and the same applies when analyzing age subgroups. AIP, atherogenic index of plasma; MAFLD, metabolic associated fatty liver disease; PIR, poverty income ratio; BMI, body mass index; DM, diabetes mellitus; ALT, alanine aminotransferase; AST, aspartate aminotransferase.
Predictive value of AIP for the MAFLD
ROC curves were used to evaluate the value of AIP and traditional lipid parameters (TG, HDL-C, TC, LDL-C) in predicting the risk of MAFLD. The results showed that AIP(AUC = 0.732, 95%CI 0.705–0.758) predicted the risk of MAFLD better than individual lipid parameters, as shown in Figure 4. The optimal cut-off level for AIP was -0.21 (sensitivity = 74.07%, specificity = 62.81%). Differences between AIP and traditional lipid parameters in predicting the risk of MAFLD are detailed in Supplementary Table 3.
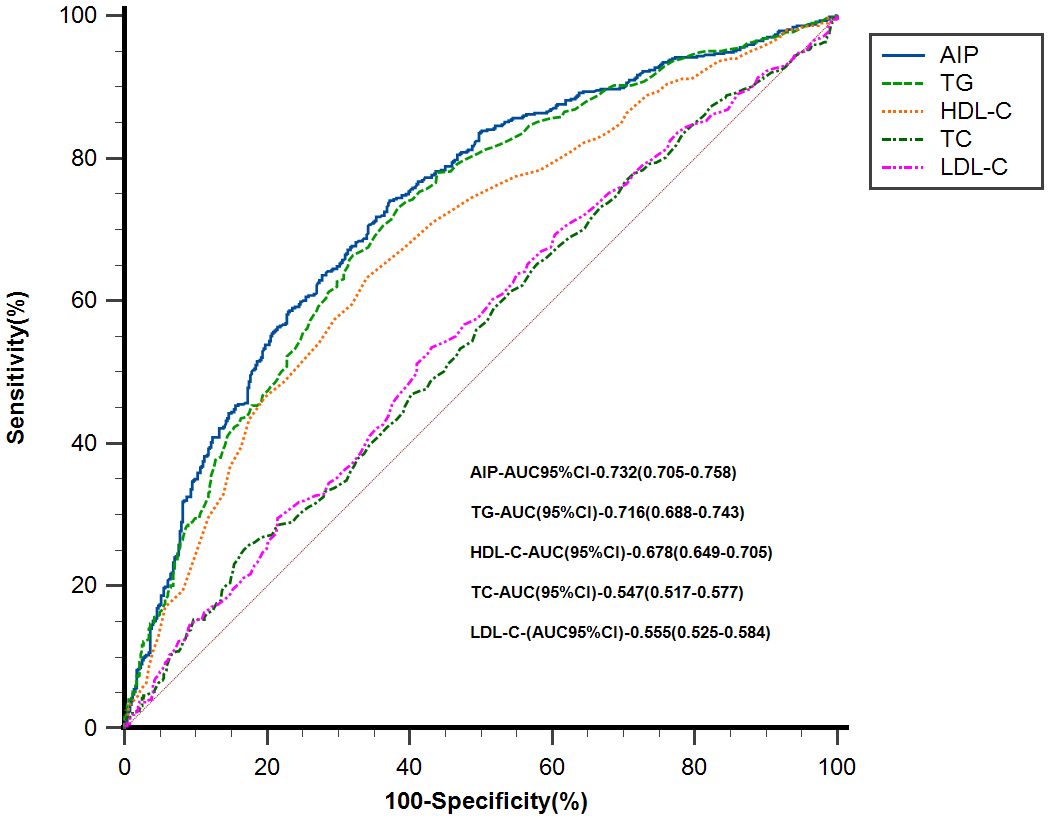
Figure 4 ROC analysis of AIP and traditional lipid parameters for predicting the risk of MAFLD. AIP, atherogenic index of plasma; MAFLD, metabolic associated fatty liver disease; TG, triglyceride; HDL-C, high-density lipoprotein cholesterol; TC, total cholesterol; LDL-C, low-density lipoprotein cholesterol; CI, confidence interval.
Discussion
In this cross-sectional analysis of NHANES 2017–2018, we found a strong association between AIP and MAFLD prevalence. Our study demonstrates for the first time that there is a linear dose-response pattern between AIP and MAFLD, that is, as AIP increases, so does the risk of MAFLD. Finally, the ROC curves analysis demonstrated that AIP is superior to traditional lipid markers in predicting the risk of MAFLD.
Similar to NAFLD, hepatic steatosis is also one of the key features of MAFLD. However, previous studies have demonstrated that individual lipid parameters lack specificity in identifying NAFLD (34, 35), and there remains controversy regarding the evidence of the role of individual lipids in promoting hepatic fat accumulation (7, 36). The advantage of AIP compared with traditional blood lipid indicators is that it combines two blood lipid indicators, TG and HDL-C, in the form of ratio, which can reflect more information about blood lipid metabolism and is more stable than a single blood lipid index. TG is one of the common indicators of atherosclerosis, especially in recent studies, which have found that TG-rich lipoprotein cholesterol plays a significant role in increasing residual cardiovascular risk (37). In contrast, HDL-C is considered to have anti-inflammatory and anti-atherosclerotic effects (38–40). Therefore, to some extent, the AIP can be regarded as an indicator reflecting the balance between atherogenesis and anti-atherogenesis in the body. Previous studies have suggested that MAFLD may mediate the development and progression of atherosclerosis (41, 42). Therefore, the strong association between AIP and MAFLD may be related to their common involvement in the process of atherosclerosis in the body. In addition, IR also plays an important role in hepatic steatosis. When IR occurs in the body, on the one hand, it leads to accumulation of free fatty acids in liver tissue and increases lipid synthesis (43); on the other hand, it also leads to reduced adiponectin availability and weakens its ability to regulate fat metabolism. At the same time, reduced availability of adiponectin further aggravates body IR, causing a vicious cycle (2, 44). Previous studies have already confirmed a close association between AIP and IR (17, 45). From this, it can be inferred that the association between AIP and MAFLD may be explained based on the strong associations between AIP and atherosclerosis as well as IR. However, further studies are still needed to validate these hypotheses. Shin et al. (21) found that AIP was associated with obesity index, blood glucose, and lipid profile in Korean men in a study based on data from the Korea National Health and Nutrition Examination Survey (KNHANES) from 2013 to 2014, and these real-world evidence also directly indicated that AIP was closely related to multiple metabolic indexes of the body, not only to lipids.
To the best of our knowledge, this is the first study to investigate the dose-response relationship between AIP and MAFLD in the adult population of the United States. Although several previous studies have described the association between AIP and MAFLD, none of these studies explored the dose-response relationship between AIP and MAFLD, and the emphasis of these studies was different. A cross-sectional analysis of 864 Chinese participants by Duan et al. showed a positive association between AIP and MAFLD, and combined AIP with BMI and waist circumference to construct a new index that can improve the predictive ability of MAFLD (22). Samimi et al. showed AIP to be a valid predictor of MAFLD in patients with type 2 diabetes, they were more concerned about the relationship between AIP and MAFLD in patients with type 2 diabetes mellitus (T2DM) and this study was mainly conducted in Iranian population (23). Recently, Wang et al. explored the association between AIP and MAFLD on the basis of NHANES survey data (46). Similar to the two previous studies, this study did not explore the dose-response relationship between AIP and MAFLD. Furthermore, when constructing the final model, the study did not consider the impact of exercise and alcohol consumption on the outcome. In our study, we diagnosed MAFLD according to the recommendations of the 2020 international expert panel consensus (1). However, unlike Wang et al.’s study, which utilized a diagnostic threshold of CAP ≥ 285 dB/m for hepatic steatosis, we employed a lower threshold of CAP ≥ 248 dB/m (30), which could identify more underlying patients with MAFLD (34, 47). In addition, to avoid the effect of diet on TG as much as possible, we used TG measured in the fasting state. Considering the significant sex and age differences in the prevalence of MAFLD (48, 49), we explored whether the linear dose-response relationship between AIP and MAFLD remains in the sex and age subgroups separately, as well as the specific pattern of dose-response relationship in the sex and age subgroups. The results showed that the linear dose-response relationship between AIP and MAFLD remained stable across sex and age subgroups.
It has been shown that MAFLD increases the risk of acute myocardial infarction (AMI) and stroke by 35% and 26%, respectively (50), and the results of Chung et al. suggest that MAFLD with DM can be a strong predictor of all-cause mortality and disease-specific mortality (51). It is therefore highly desirable to identify underlying MAFLD patients in clinical work. However, limited by the actual situation of clinical work, it is difficult for clinicians to conduct universal screening of patients with MAFLD. Our results suggest a strong positive association between AIP and MAFLD, and AIP is superior to traditional lipid parameters in predicting the prevalence of MAFLD. Therefore, clinicians may be able to raise concerns about patients with abnormally elevated AIP and consider MAFLD-related diagnostic tests if necessary.
This study has the following limitations: 1. Based on the design of a cross-sectional study, this study cannot identify whether there is a causal association between AIP and MAFLD; 2. The conclusions of this study apply only to the US adult population; 3. The conclusions of this study warrant further validation in a larger cohort study.
Conclusion
The findings of this study revealed a robust positive association between AIP and MAFLD. This association proved significant, irrespective of whether AIP was treated as a continuous variable or categorized using quartiles. At the same time, potential linear dose-response relationships between AIP and MAFLD have been elucidated, that is, the risk of MAFLD also increased as the AIP value increased. Given that MAFLD significantly increases the risk of adverse outcomes for patients, particularly in terms of cardiovascular and cerebrovascular diseases, physicians may consider using AIP to screen for MAFLD in order to better assess the underlying risks for these patients. However, further validation of this conclusion is warranted through larger-scale cohort studies.
Data availability statement
The original contributions presented in the study are included in the article/Supplementary material. Further inquiries can be directed to the corresponding author.
Ethics statement
The studies involving humans were approved by National Center for Health Statistics Research Ethics Review Board (Protocol number: 2018-01). The studies were conducted in accordance with the local legislation and institutional requirements. The participants provided their written informed consent to participate in this study.
Author contributions
YC: Conceptualization, Writing – original draft, Writing – review & editing. CL: Data curation, Writing – review & editing. HJ: Data curation, Writing – review & editing. QZ: Writing – review & editing. XZ: Supervision, Writing – review & editing.
Funding
The author(s) declare financial support was received for the research, authorship, and/or publication of this article. This study was funded by Dalian Medical University, Interdisciplinary Research Cooperation Project Team Funding of Abnormal blood pressure regulation and Hypertension (JCHZ2023014).
Conflict of interest
The authors declare that the research was conducted in the absence of any commercial or financial relationships that could be construed as a potential conflict of interest.
Publisher’s note
All claims expressed in this article are solely those of the authors and do not necessarily represent those of their affiliated organizations, or those of the publisher, the editors and the reviewers. Any product that may be evaluated in this article, or claim that may be made by its manufacturer, is not guaranteed or endorsed by the publisher.
Supplementary material
The Supplementary Material for this article can be found online at: https://www.frontiersin.org/articles/10.3389/fendo.2024.1405828/full#supplementary-material
References
1. Eslam M, Newsome PN, Sarin SK, Anstee QM, Targher G, Romero-Gomez M, et al. A new definition for metabolic dysfunction-associated fatty liver disease: An international expert consensus statement. J Hepatol. (2020) 73:202–9. doi: 10.1016/j.jhep.2020.03.039
2. Swan D, Lisman T, Tripodi A, Thachil J. The prothrombotic tendency of metabolic-associated fatty liver disease. J Thromb Haemost. (2023) 21:3045–55. doi: 10.1016/j.jtha.2023.06.017
3. Lim GEH, Tang A, Ng CH, Chin YH, Lim WH, Tan DJH, et al. An observational data meta-analysis on the differences in prevalence and risk factors between MAFLD vs NAFLD. Clin Gastroenterol Hepatol. (2023) 21:619–629.e617. doi: 10.1016/j.cgh.2021.11.038
4. Lin S, Huang J, Wang M, Kumar R, Liu Y, Liu S, et al. Comparison of MAFLD and NAFLD diagnostic criteria in real world. Liver Int. (2020) 40:2082–9. doi: 10.1111/liv.14548
5. Sun DQ, Jin Y, Wang TY, Zheng KI, Rios RS, Zhang HY, et al. MAFLD and risk of CKD. Metabolism. (2021) 115:154433. doi: 10.1016/j.metabol.2020.154433
6. Tsutsumi T, Eslam M, Kawaguchi T, Yamamura S, Kawaguchi A, Nakano D, et al. MAFLD better predicts the progression of atherosclerotic cardiovascular risk than NAFLD: Generalized estimating equation approach. Hepatol Res. (2021) 51:1115–28. doi: 10.1111/hepr.13685
7. Kim D, Konyn P, Sandhu KK, Dennis BB, Cheung AC, Ahmed A. Metabolic dysfunction-associated fatty liver disease is associated with increased all-cause mortality in the United States. J Hepatol. (2021) 75:1284–91. doi: 10.1016/j.jhep.2021.07.035
8. Moon JH, Kim W, Koo BK, Cho NH. Metabolic dysfunction-associated fatty liver disease predicts long-term mortality and cardiovascular disease. Gut Liver. (2022) 16:433–42. doi: 10.5009/gnl210167
9. Li H, Zhang Y, Luo H, Lin R. The lipid accumulation product is a powerful tool to diagnose metabolic dysfunction-associated fatty liver disease in the United States adults. Front Endocrinol (Lausanne). (2022) 13:977625. doi: 10.3389/fendo.2022.977625
10. Wong RJ, Cheung R. Trends in the prevalence of metabolic dysfunction-associated fatty liver disease in the United States, 2011–2018. Clin Gastroenterol Hepatol. (2022) 20:e610–3. doi: 10.1016/j.cgh.2021.01.030
11. Dobiásová M, Frohlich J. The plasma parameter log (TG/HDL-C) as an atherogenic index: correlation with lipoprotein particle size and esterification rate in apoB-lipoprotein-depleted plasma (FER(HDL)). Clin Biochem. (2001) 34:583–8. doi: 10.1016/s0009–9120(01)00263–6
12. Won KB, Heo R, Park HB, Lee BK, Lin FY, Hadamitzky M, et al. Atherogenic index of plasma and the risk of rapid progression of coronary atherosclerosis beyond traditional risk factors. Atherosclerosis. (2021) 324:46–51. doi: 10.1016/j.atherosclerosis.2021.03.009
13. Guo Q, Zhou S, Feng X, Yang J, Qiao J, Zhao Y, et al. The sensibility of the new blood lipid indicator–atherogenic index of plasma (AIP) in menopausal women with coronary artery disease. Lipids Health Dis. (2020) 19:27. doi: 10.1186/s12944–020-01208–8
14. Bora K, Pathak MS, Borah P, Hussain MI, Das D. Association of the Apolipoprotein A-I gene polymorphisms with cardiovascular disease risk factors and atherogenic indices in patients from Assam, northeast India. Balkan J Med Genet. (2017) 20:59–70. doi: 10.1515/bjmg-2017–0002
15. Li YW, Kao TW, Chang PK, Chen WL, Wu LW. Atherogenic index of plasma as predictors for metabolic syndrome, hypertension and diabetes mellitus in Taiwan citizens: a 9-year longitudinal study. Sci Rep. (2021) 11:9900. doi: 10.1038/s41598-021-89307-z
16. Zhu X, Yu L, Zhou H, Ma Q, Zhou X, Lei T, et al. Atherogenic index of plasma is a novel and better biomarker associated with obesity: a population-based cross-sectional study in China. Lipids Health Dis. (2018) 17:37. doi: 10.1186/s12944–018-0686–8
17. Fernández-Macías JC, Ochoa-Martínez AC, Varela-Silva JA, Pérez-Maldonado IN. Atherogenic index of plasma: novel predictive biomarker for cardiovascular illnesses. Arch Med Res. (2019) 50:285–94. doi: 10.1016/j.arcmed.2019.08.009
18. Shen SW, Lu Y, Li F, Yang CJ, Feng YB, Li HW, et al. Atherogenic index of plasma is an effective index for estimating abdominal obesity. Lipids Health Dis. (2018) 17:11. doi: 10.1186/s12944–018-0656–1
19. Zhu XW, Deng FY, Lei SF. Meta-analysis of Atherogenic Index of Plasma and other lipid parameters in relation to risk of type 2 diabetes mellitus. Prim Care Diabetes. (2015) 9:60–7. doi: 10.1016/j.pcd.2014.03.007
20. Shi Y, Wen M. Sex-specific differences in the effect of the atherogenic index of plasma on prediabetes and diabetes in the NHANES 2011–2018 population. Cardiovasc Diabetol. (2023) 22:19. doi: 10.1186/s12933–023-01740–8
21. Shin HR, Song S, Cho JA, Ly SY. Atherogenic index of plasma and its association with risk factors of coronary artery disease and nutrient intake in Korean adult men: the 2013–2014 KNHANES. Nutrients. (2022) 14. doi: 10.3390/nu14051071
22. Duan SJ, Ren ZY, Zheng T, Peng HY, Niu ZH, Xia H, et al. Atherogenic index of plasma combined with waist circumference and body mass index to predict metabolic-associated fatty liver disease. World J Gastroenterol. (2022) 28:5364–79. doi: 10.3748/wjg.v28.i36.5364
23. Samimi S, Rajabzadeh S, Rabizadeh S, Nakhjavani M, Nakhaei P, Avanaki FA, et al. Atherogenic index of plasma is an independent predictor of metabolic-associated fatty liver disease in patients with type 2 diabetes. Eur J Med Res. (2022) 27:112. doi: 10.1186/s40001-022-00731-x
24. Patel CJ, Pho N, McDuffie M, Easton-Marks J, Kothari C, Kohane IS, et al. A database of human exposomes and phenomes from the US National Health and Nutrition Examination Survey. Sci Data. (2016) 3:160096. doi: 10.1038/sdata.2016.96
25. Tomar SL, Asma S. Smoking-attributable periodontitis in the United States: findings from NHANES III. J Periodontol. (2000) 71:743–51. doi: 10.1902/jop.2000.71.5.743
26. Rattan P, Penrice DD, Ahn JC, Ferrer A, Patnaik M, Shah VH, et al. Inverse association of telomere length with liver disease and mortality in the US population. Hepatol Commun. (2022) 6:399–410. doi: 10.1002/hep4.1803
27. Bull FC, Al-Ansari SS, Biddle S, Borodulin K, Buman MP, Cardon G, et al. World Health Organization 2020 guidelines on physical activity and sedentary behaviour. Br J Sports Med. (2020) 54:1451–62. doi: 10.1136/bjsports-2020–102955
28. Wang L, Liu T, Zhang Q, Wang L, Zhou Q, Wang J, et al. Correlation between dietary inflammation and mortality among hyperlipidemics. Lipids Health Dis. (2023) 22:206. doi: 10.1186/s12944–023-01975–0
29. Isokuortti E, Zhou Y, Peltonen M, Bugianesi E, Clement K, Bonnefont-Rousselot D, et al. Use of HOMA-IR to diagnose non-alcoholic fatty liver disease: a population-based and inter-laboratory study. Diabetologia. (2017) 60:1873–82. doi: 10.1007/s00125–017-4340–1
30. Karlas T, Petroff D, Sasso M, Fan JG, Mi YQ, de Lédinghen V, et al. Individual patient data meta-analysis of controlled attenuation parameter (CAP) technology for assessing steatosis. J Hepatol. (2017) 66:1022–30. doi: 10.1016/j.jhep.2016.12.022
31. Eddowes PJ, Sasso M, Allison M, Tsochatzis E, Anstee QM, Sheridan D, et al. Accuracy of fibroScan controlled attenuation parameter and liver stiffness measurement in assessing steatosis and fibrosis in patients with nonalcoholic fatty liver disease. Gastroenterology. (2019) 156:1717–30. doi: 10.1053/j.gastro.2019.01.042
32. Xie R, Xiao M, Li L, Ma N, Liu M, Huang X, et al. Association between SII and hepatic steatosis and liver fibrosis: A population-based study. Front Immunol. (2022) 13:925690. doi: 10.3389/fimmu.2022.925690
33. Johnson CL, Paulose-Ram R, Ogden CL, Carroll MD, Kruszon-Moran D, Dohrmann SM, et al. National health and nutrition examination survey: analytic guidelines, 1999–2010. Vital Health Stat. (2013) 2:1–24.
34. Tian T, Zhang J, Xie W, Ni Y, Fang X, Liu M, et al. Dietary quality and relationships with metabolic dysfunction-associated fatty liver disease (MAFLD) among United States adults, results from NHANES 2017–2018. Nutrients. (2022) 14. doi: 10.3390/nu14214505
35. Song C, Lv J, Yu C, Zhu M, Yu C, Guo Y, et al. Adherence to Healthy Lifestyle and Liver cancer in Chinese: a prospective cohort study of 0.5 million people. Br J Cancer. (2022) 126:815–21. doi: 10.1038/s41416-021-01645-x
36. Afshin A, Sur PJ, Fay KA, Cornaby L, Ferrara G, Salama JS, et al. Health effects of dietary risks in 195 countries, 1990–2017: a systematic analysis for the Global Burden of Disease Study 2017. Lancet. (2019) 393:1958–72. doi: 10.1016/s0140–6736(19)30041–8
37. Ginsberg HN, Packard CJ, Chapman MJ, Borén J, Aguilar-Salinas CA, Averna M, et al. Triglyceride-rich lipoproteins and their remnants: metabolic insights, role in atherosclerotic cardiovascular disease, and emerging therapeutic strategies-a consensus statement from the European Atherosclerosis Society. Eur Heart J. (2021) 42:4791–806. doi: 10.1093/eurheartj/ehab551
38. Li J, Wang W, Han L, Feng M, Lu H, Yang L, et al. Human apolipoprotein A-I exerts a prophylactic effect on high-fat diet-induced atherosclerosis via inflammation inhibition in a rabbit model. Acta Biochim Biophys Sin. (2017) 49:149–58. doi: 10.1093/abbs/gmw128
39. Patel S, Di Bartolo BA, Nakhla S, Heather AK, Mitchell TW, Jessup W, et al. Anti-inflammatory effects of apolipoprotein A-I in the rabbit. Atherosclerosis. (2010) 212:392–7. doi: 10.1016/j.atherosclerosis.2010.05.035
40. Chen Y, Chen S, Han Y, Xu Q, Zhao X. Elevated ApoB/apoA-1 is associated with in-hospital mortality in elderly patients with acute myocardial infarction. Diabetes Metab Syndr Obes. (2023) 16:3501–12. doi: 10.2147/dmso.S433876
41. Jaruvongvanich V, Wirunsawanya K, Sanguankeo A, Upala S. Nonalcoholic fatty liver disease is associated with coronary artery calcification: A systematic review and meta-analysis. Dig Liver Dis. (2016) 48:1410–7. doi: 10.1016/j.dld.2016.09.002
42. Sinn DH, Kang D, Chang Y, Ryu S, Gu S, Kim H, et al. Non-alcoholic fatty liver disease and progression of coronary artery calcium score: a retrospective cohort study. Gut. (2017) 66:323–9. doi: 10.1136/gutjnl-2016–311854
43. Utzschneider KM, Kahn SE. Review: The role of insulin resistance in nonalcoholic fatty liver disease. J Clin Endocrinol Metab. (2006) 91:4753–61. doi: 10.1210/jc.2006–0587
44. Kim CH, Younossi ZM. Nonalcoholic fatty liver disease: a manifestation of the metabolic syndrome. Cleve Clin J Med. (2008) 75:721–8. doi: 10.3949/ccjm.75.10.721
45. Tan MH, Johns D, Glazer NB. Pioglitazone reduces atherogenic index of plasma in patients with type 2 diabetes. Clin Chem. (2004) 50:1184–8. doi: 10.1373/clinchem.2004.031757
46. Wang A, Li J, Li L, Ding H, Yang N, Xu M. The association between atherogenic index of plasma and metabolic dysfunction-associated fatty liver disease as detected by FibroScan. Nutr Hosp. (2024) 41(2):384–92. doi: 10.20960/nh.04891
47. Zhang X, Heredia NI, Balakrishnan M, Thrift AP. Prevalence and factors associated with NAFLD detected by vibration controlled transient elastography among US adults: Results from NHANES 2017–2018. PloS One. (2021) 16:e0252164. doi: 10.1371/journal.pone.0252164
48. Lonardo A, Nascimbeni F, Maurantonio M, Marrazzo A, Rinaldi L, Adinolfi LE. Nonalcoholic fatty liver disease: Evolving paradigms. World J Gastroenterol. (2017) 23:6571–92. doi: 10.3748/wjg.v23.i36.6571
49. Zhou YJ, Li YY, Nie YQ, Ma JX, Lu LG, Shi SL, et al. Prevalence of fatty liver disease and its risk factors in the population of South China. World J Gastroenterol. (2007) 13:6419–24. doi: 10.3748/wjg.v13.i47.6419
50. Chen S, Xue H, Huang R, Chen K, Zhang H, Chen X. Associations of MAFLD and MAFLD subtypes with the risk of the incident myocardial infarction and stroke. Diabetes Metab. (2023) 49:101468. doi: 10.1016/j.diabet.2023.101468
Keywords: metabolic syndrome, atherogenic index of plasma(AIP), hepatic steatosis, metabolic associated fatty liver disease (MAFLD), restricted cubic spline (RCS), NHANES
Citation: Chen Y, Lu C, Ju H, Zhou Q and Zhao X (2024) Elevated AIP is associated with the prevalence of MAFLD in the US adults: evidence from NHANES 2017–2018. Front. Endocrinol. 15:1405828. doi: 10.3389/fendo.2024.1405828
Received: 23 March 2024; Accepted: 30 April 2024;
Published: 14 May 2024.
Edited by:
Stanisław Surma, Medical University of Silesia, PolandReviewed by:
Mariann Harangi, University of Debrecen, HungaryMarek Hartleb, Medical University of Silesia, Poland
Copyright © 2024 Chen, Lu, Ju, Zhou and Zhao. This is an open-access article distributed under the terms of the Creative Commons Attribution License (CC BY). The use, distribution or reproduction in other forums is permitted, provided the original author(s) and the copyright owner(s) are credited and that the original publication in this journal is cited, in accordance with accepted academic practice. No use, distribution or reproduction is permitted which does not comply with these terms.
*Correspondence: Xin Zhao, zx81830@163.com
†These authors have contributed equally to this work