 Jinxiang Wang
 Jianmin Ma3,4
- 1Graduate Department, Lanzhou City University, Lanzhou, China
- 2College of Urban Environment, Lanzhou City University, Lanzhou, China
- 3Key Laboratory for Environmental Pollution Prediction and Control, College of Earth and Environmental Sciences, Lanzhou University, Lanzhou, Gansu, China
- 4Laboratory for Earth Surface Processes, College of Urban and Environmental Sciences, Peking University, Beijing, China
Ambient non-methane hydrocarbons (NMHCs) were investigated at Shenhua coal chemical industrial park (SH), and Baofeng coal chemical industrial park (BF) in Ningdong Energy and Chemical Industrial Base (NECIB) in China’s Energy Golden Triangle (EGT). Ambient air samples were collected using pre-evacuated 2-L electro-polished stainless steel canisters at SH and BF from 9:00 a.m. to 9:30 a.m. (UTC+8) from 22 to 31 December 2016. Fifty-seven NMHCs were analyzed using gas chromatography-mass selective detector/flame ionization detector. The average NMHCs mixing ratios were 49.05 ± 44.37 ppbv in SH, and 39.31 ± 18.77 ppbv in BF. Overall, alkanes took up the largest proportion (>60%), followed by alkenes, acetylene, and aromatics. The propylene-equivalent (Prop-Equiv) concentration and the ozone formation potential (OFP) of NMHCs were calculated to estimate their chemical reactivities. Alkenes played a predominant role in NMHCs reactivity, among which propylene and ethylene were the largest contributors. OFP values show that alkenes and acetylene were the largest contributors (60%) to measured total NMHCs. Ethylene, propylene, m/p-xylene, n-butane, 1-butene, propane and acetylene were the major precursors in ground-level ozone formation in this region, which accounted for 66% and 62% of the total ozone formed by NMHCs at BF and SH, respectively. This study identified that industrial activities were the primary sources of NMHCs, confirmed by the high ratios of benzene to toluene (B/T = 2.23). Therefore, these organic pollutants should be monitored further based on their high toxicities.
Highlights
• Non-methane hydrocarbons (NMHCs) samples were collected in an emerging industrial base.
• Alkanes were the primary group of NMHCs in this industrial base.
• Alkenes and acetylene were the largest contributors (60%) to the total ozone formation potential (OFPs).
• Industrial activities were the dominant sources of NMHCs in this industrial base.
Introduction
Under the national energy and industrial development strategy, energy industries in China, including oil, natural gas and coal mining industries, petrochemical industries, coal chemical industries, and thermal power generators, have been relocated toward energy-abundant northwestern China (Dorian et al., 1999; Ling et al., 2017; Wang et al., 2017). The Ningdong Energy and Chemical Industrial Base (NECIB), about 45 km to the southeast of Yinchuan (Figure 1), the capital city of Ningxia-Hui Autonomous Region, is a nationally prioritized region for the promotion of the development of large-scale coal mining bases, thermal power generation, and the coal chemical industry (Shen et al., 2016; Feng et al., 2018), featured by the largest coal-to-liquids industry in the world (Liang et al., 2019). In contrast to declining air pollutant (e.g., SO2) emissions and levels in eastern and southern China, annual SO2 emissions from the NECIB exhibited an increasing trend from 2005 to 2015 (Shen et al., 2016; Ling et al., 2017; Wang et al., 2017). It is projected that the development of large-scale coal-chemical industry will be accelerated in NECIB, consistent with the development of China’s energy industry in the next decade (Feng et al., 2016; Ma and Xu, 2017; Liu et al., 2018). Together with the rapid development and expansion of the NECIB and its significance in China’s energy development strategy, a concern has been raised for if and to what extent this region would be contaminated by air pollution. Satellite remote sensing measurements have revealed increasing SO2 in the past decade (Shen et a., 2016; Ling et al., 2017) in the NECIB, in contrast to rest of China. A field campaign was also conducted to measure levels and distribution of fine particles (PM1 and PM2.5) across this energy base (Liang et al., 2019). However, knowledge gaps still remain in the emission of volatile organic compounds (VOCs) and its impact on surface ozone formation. Differing from urban areas and petrochemical industries where ozone precursors are emitted mainly from motor vehicles, services (e.g., solvent use), and petroleum refining and processing (Zhang et al., 2020; Zheng et al., 2021; Ou et al., 2022), the coal-to-liquids project in the NECIB, as the world largest coal-to-liquids industry, was designated to reduce the emission of air pollutants, such as sulfur dioxide (SO2), nitrogen oxides (NOx), and hydrocarbons. It has been reported that this project, lunched in 2016, has successfully produced oil with ultra-low sulfur, low aromatics, high cetane number, and low ash content (Liang et al., 2019).
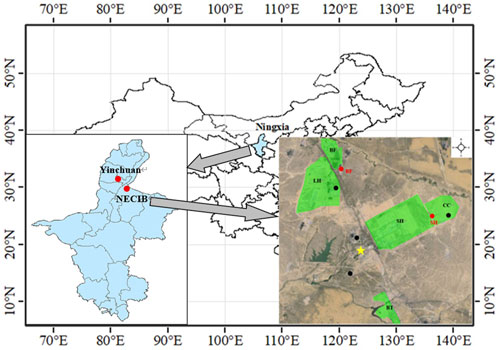
FIGURE 1. Map of Ningxia-Hui Autonomous Region, China (highlighted with blue).
The inner figure on the lower-left corner shows the location of Yinchuan and the Ningdong Energy and Chemical Industrial Base NECIB (marked by red dots). The inner figure on the lower-right corner illustrates the primary industrial parks (marked by green color), and the letters in them indicate the names (BF, baofeng coal chemical industrial park; LH, linhe integrated industrial park; SH, shenhua coal chemical industrial park; CC, changcheng petrochemical corporation; BT, baota petrochemical corporation). The black dots represents the coal-fired power plants, the red dots represents the sampling sites, and the yellow star indicates the center of Ningdong town.
Many volatile organic compounds (VOCs) like benzene, toluene, ethane and propane, etc., have been reported to be toxic, carcinogenic or mutagenic (Mohamed, et al., 2002; Srivastava, 2005; Sahu et al., 2020). VOCs are precursors of secondary organic aerosols (SOA) which are one of the important components of PM2.5. While, PM2.5 is one of the air pollutants, which affects human health and atmospheric visibility (Monod et al., 2001; Jia et al., 2016; Liu et al., 2021). In addition, VOCs are one of the important reactants for ozone formation and play a very important role in tropospheric chemistry (Yadav et al., 2016; Zhang et al., 2020; Ou et al., 2022). As an important component of VOCs, non-methane hydrocarbons (NMHCs) would be converted into ozone and other atmospheric oxidants, affecting the global distribution of hydroxyl radicals (OH), and also affecting the life of other trace chemicals in the troposphere (Warneke et al., 1999; Poisson et al., 2000; Wang et al., 2020a; Wang et al., 2020b).
Extensive studies on NMHCs sources have been conducted worldwide, revealing that industrial emissions were the major VOCs sources (Panopoulou et al., 2018; Yadav et al., 2019; Pernov et al., 2021; Yadav et al., 2021; Ou-Yang et al., 2022). For example, it has been shown that industrial emissions had the greatest influence on the ambient levels of NMHCs in the atmosphere of the Pearl River Delta (PRD), which serves as industrial, industrial-urban, and industrial-suburban areas (Chan et al., 2006). Study on NMHCs in the atmosphere of the Pearl River Delta (PRD), which were classified as industrial, industrial-urban, and industrial-suburban areas, showed that industrial emissions had the greatest influence on the ambient levels of NMHCs (Chan et al., 2006).
Another study of the effect of petrochemical industrial emissions of reactive alkenes and NOx on tropospheric ozone formation in Houston, Texas, indicated that petrochemical industrial facilities were important sources of highly reactive hydrocarbons (Ryerson et al., 2003). Power generators are also the important VOCs emissions due to a lot of gases emitted (Bocola and Cirillo, 1989; dos Santos et al., 2004). The present study provides a snapshot of atmospheric NMHCs in the rapidly industrialized NECIB region featured by the super coal-to-liquids industry, aiming to enhance our understanding to air emission and environmental contamination of precursor chemicals sourced from the new and emerging coal chemical industries that are being developed rapidly in China under the strong support from central and provincial governments, particularly in energy abundant Northwestern China. The study area is used as a land for industrial production base for the first time, and is under construction. In order to obtain air pollution status at the early stage of the construction from the study area, samples collected in winter, which would not represent an interannual change.
Materials and methods
Sampling sites
Two sampling sites were selected, namely Baofeng coal chemical industrial park (BF) (38.23 N, 106.55E) and Shenhua coal chemical industrial park (SH) (38.19 N, 106.66E), both are situated in NECIB. Their geographical locations are showed in Figure 1. BF coal chemical industrial park is located about 8 km to the north of Ningdong town, and 30 km to the southeast of Yinchuan. The sampling site at BF is 200 m away from the southern boundary of BF industrial park, and in the downwind of BF industrial park during the sampling period. Shenhua coal chemical industrial park is located about 8 km to the east of Ningdong town, and 40 km to the southeast of Yinchuan. The sampling site at SH was at the ground of a small company, namely the Changcheng petrochemical corporation, which is surrounded by SH, and a few other chemical enterprises. With the prevailing northeast/east winds during our sampling, SH could be considered as a good receptor site downwind NECIB. The sampling heights at the two sites were 6 m at BF and 2 m at SH, respectively. Due to near-surface strong vertical mixing within the constant flux layer the concentration level of NMHCs between 2 m and 6 m at BF sampling would not differ significantly. At the sampling point BF, when the samples were collected, the wind speed was from 0.3 to 4.8 m/s, with an average of 0.98 m/s; Temperature was from −16.1°C to 16.6°C, and the average was −3.0°C; The humidity was 49.5% and the altitude was 1,165 m. At the sampling point SH, the wind speed was 0.9–5.4 m/s, with an average of 2.76 m/s; Temperature was from −13.6°C to 16.5°C, and the average was −1.8°C, with humidity of 45.6% and the altitude was 1,249 m.
Sample collection
Ambient air samples were collected at BF and SH from 22 to 31 December 2016, using pre-evacuated 2-L electro-polished stainless steel canisters from 9:00 to 9:30 local time once per day. Before sampling, all canisters were flushed at least five times by repeatedly filling and evacuating humidified zero air. In order to avoid any contamination, all canisters were evacuated after the cleansing procedures and re-filled with pure nitrogen before they were stored in the laboratory for at least 24 h. The nitrogen filled in canisters was then analyzed the same way as field samples to ensure that all the target VOC compounds were not present. A flow-controlling valve was used to collect 10-min integrated sample by slightly opening the valve. The sampling inlet is located 1.5 m above the ground.
NMHCs analyses
The samples were transported to the State Key Laboratory of Organic Geochemistry, Guangzhou Institute of Geochemistry, Chinese Academy of Sciences, and analyzed using a Model 7,100 Pre concentrator (Entech Instruments Inc., California, United States) coupled with an Agilent5973N gas chromatography-mass selective detector/flame ionization detector (GC-MSD/FID, Agilent Technologies, United States). The details of analytical procedure, quality control and quality assurance have been reported in previous studies elsewhere (Zhang et al., 2013 and, 2015). The trapped VOCs were transferred by pure helium to a secondary trap at −40°C with Tenax-TA as adsorbent. The majority of H2O and CO2 were removed during these two steps. After the focusing step, the trap was rapidly heated and the VOCs were transferred to the GC-MSD/FID system. The mixture was firstly separated by a HP-1 capillary column (60 m × 0.32 mm × 1.0 μm, Agilent Technologies, United States) with helium as carrier gas, and split into two: one is to a PLOT-Q column (30 m × 0.32 mm × 2.0 μm, Agilent Technologies, United States) followed by FID detection; and another is to a 65 cm × 0.10 mm I.D. stainless steel line followed by MSD detection. The G Coven temperature was programmed to be initially at −50°C, holding for 3 min; increasing to 10°C at 15°C min−1, to 120°C at 5°C min−1, and then to 250°C at 10°C min−1 holding for 10 min. The MSD was used in selected ion monitoring (SIM) mode and the ionization method was electron impacting (EI). 57 NMHCs species were identified from the field samples.
Because VOCs are important precursors for the formation of ozone, identifying the contributions of individual VOCs to ozone formation becomes an important issue for a better understanding of the ozone chemical production (Ho et al., 2004). Photochemical formation of ozone is initiated by reactions of OH radical with VOCs, and the magnitude of ozone formation due to the VOC reactions varies greatly. In order to compare the reactivity and contribution of VOCs to photochemical ozone formation, the two methods Prop-Equiv concentration method (Chameides et al., 1992) and ozone formation potential (OFP) (Carter, 1994), were used for analysis.
The Prop-Equiv concentration method is useful since it ranks the reaction rate of a species as well as its atmospheric concentration (Hagerman et al., 1997). The Prop-Equiv concentration for each individual VOC species can be calculated by
where Prop-Equiv(i) is defined as a VOC compound i on an OH reactivity-based scale, which is normalized to the reactivity of propylene (unit: ppbv); conc(i) is the concentration of a VOC compound i (unit: ppbv); kOH(i) is the rate constant for the reaction of VOC compound i with OH radical (unit: cm3 molecule−1 s−1); and kOH(C3H6) is the rate constant for the reaction of C3H6 with OH radical. These rate constants were given by Atkinson (1990 and 1997), and Atkinson and Arey (2003). The summed VOCs were estimated by first individually calculating the Prop-Equiv concentration for each VOC, and summing the compounds into their appropriate categories.
The MIR method, proposed by Carter (1994), is a good indicator for comparing the OFP of individual NMHCs species, defined by
where OFP(i) is the ozone formation potential of individual hydrocarbon i (unit: ppbv) and MIRcoefficient(i) is the maximum incremental reactivity coefficient of compound i, which is defined by Carter (1994) (unit: O3/NMHCs).
Results
NMHCs concentrations
A total of 57 NMHCs species including alkanes (25), alkenes and acetylene (18), aromatics (14) were extracted during this experiment. The average mixing ratios and standard deviation (SD) of NMHCs observed during the sampling period are listed in Table 1. The compositions of NMHCs at BF were in good agreement with SH, though the averaged concentration at SH (49.05 ± 44.37 ppbv) was higher than BF (39.31 ± 18.77 ppbv) (Figure 2). Total NMHCs ranged from 13.94 to 80.76 ppbv at BF, and 11.28–168.12 ppbv at SH. In group compositions, total mixing ratios of alkanes were the highest at the both sampling sites (63% at BF and 64% at SH), followed by alkenes and acetylene (28% at BF and 29% at SH), and aromatics (9% at BF and 7% at SH) (Figure 3).
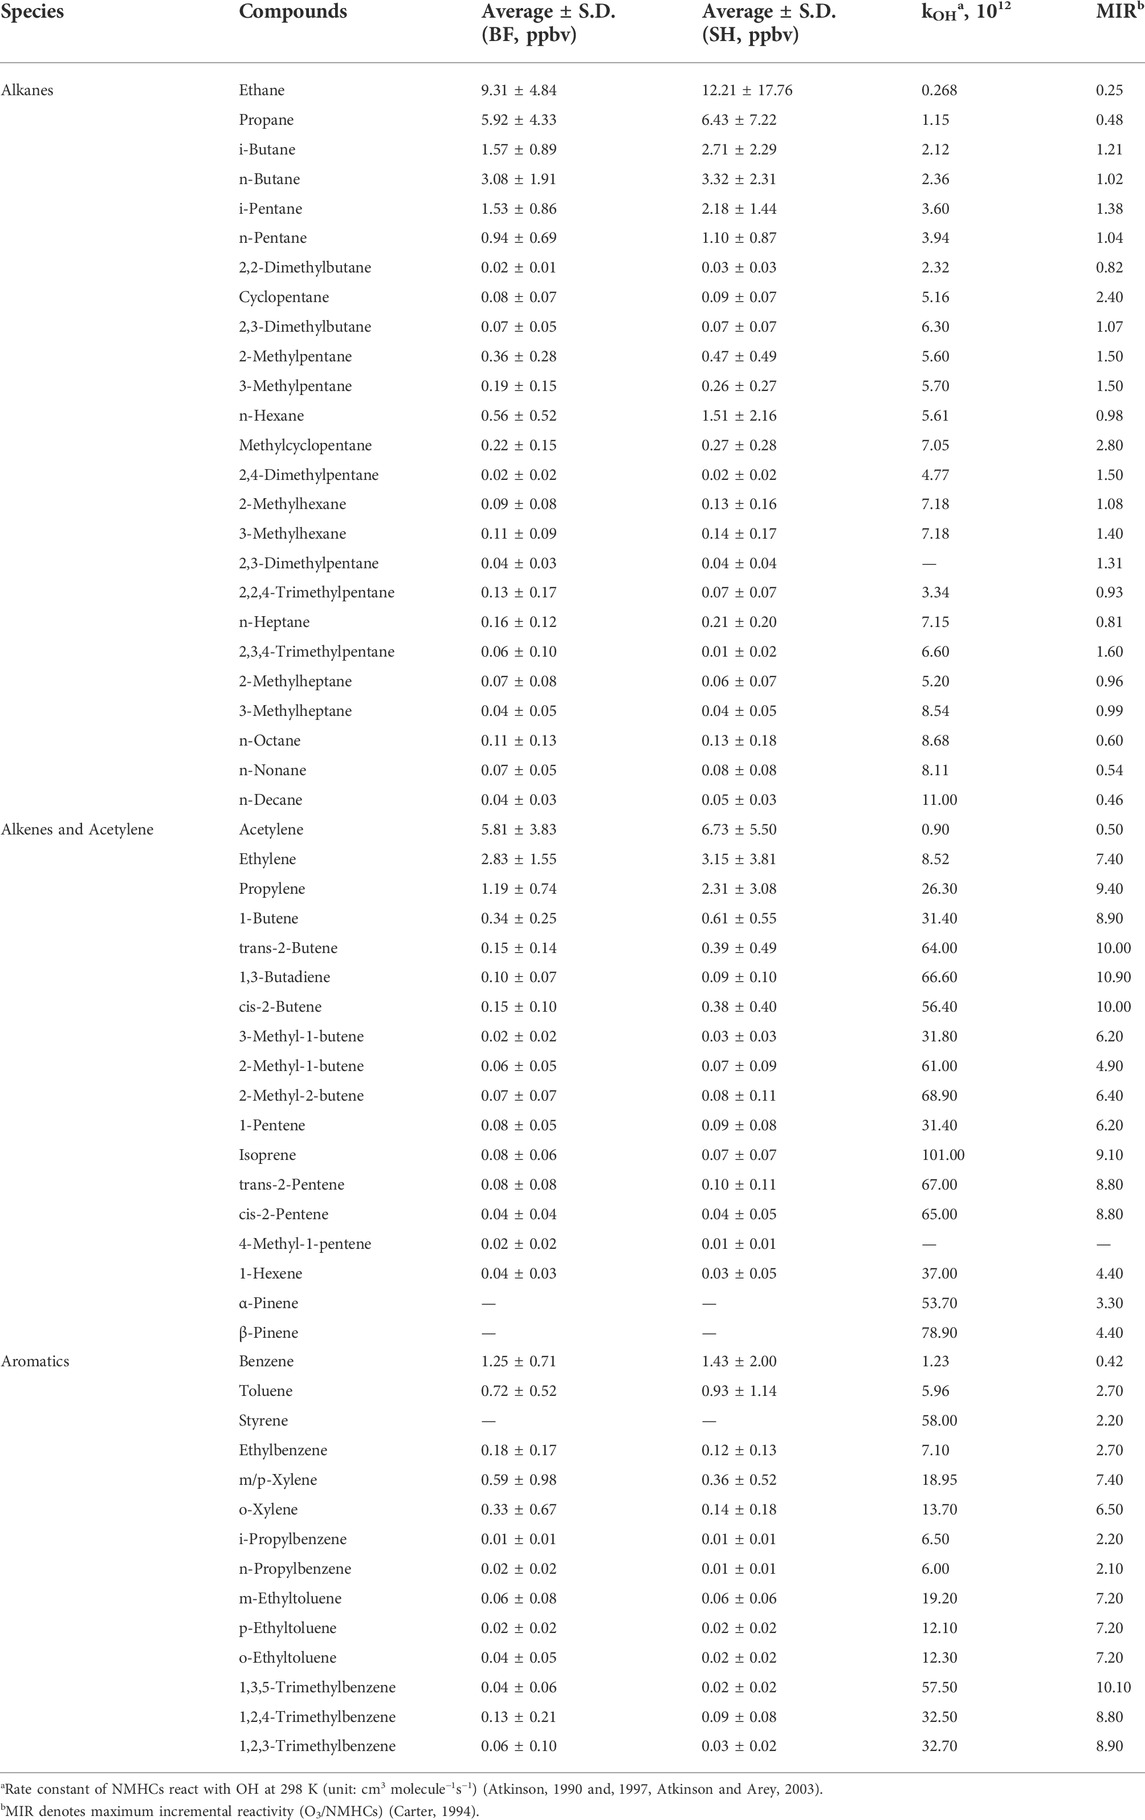
TABLE 1. Concentration (average ± S.D.) and photochemical properties of NMHCs at BF and SH.
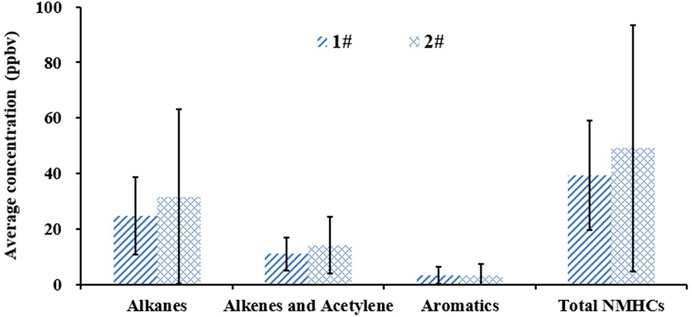
FIGURE 2. Concentrations of alkanes, alkenes and acetylene, aromatics, and total NMHCs at BF (blue bar) and SH (red bar), the values represent mean ± SD, (n = 10).
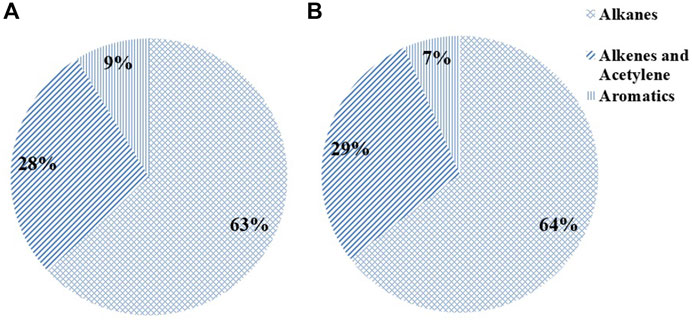
FIGURE 3. Averaged NMHCs percentage for different species of alkanes, alkenes and acetylene, and aromatics at BF (A) and SH (B).
Likewise, the primarily compositions of alkanes, alkenes and acetylene at the BF agree well with that at the SH (Figure 4). Alkanes compounds, ethane, propane, and n-butane were ranked as the top three compounds at both sites, the total concentrations of these compounds accounted for 73.89% and 69.43% of the total alkanes at the BF and SH, respectively. Ethylene, propylene, and 1-butene were the most abundant alkenes and ethylene at both sites, their total concentrations accounted for 82.89% and 81.44% of the total alkenes and ethylene at the BF and SH, respectively. Among aromatic hydrocarbons, benzene, toluene, and m/p-xylene show higher concentrations than other aromatic hydrocarbons at both sites, accounting for 74.26% and 84.29% of the total aromatic hydrocarbons at the BF and SH, respectively.
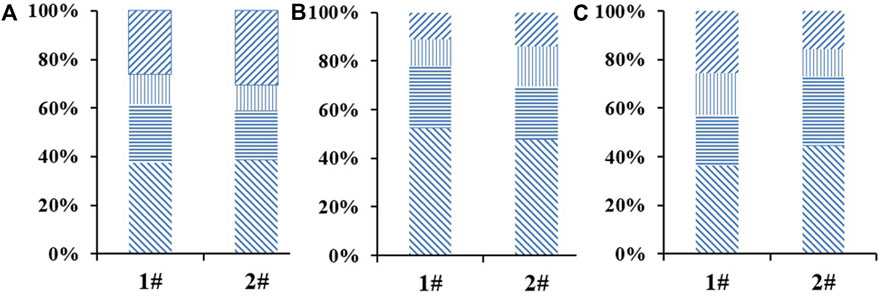
FIGURE 4. (A) Averaged 25 alkanes percentage for the first three species (ethane, propane, n-butane) and others at BF and SH; (B) Averaged 17 alkenes and ethylene percentage for the first three species (ethylene, propylene 1-butene) and others at BF and SH; (C) Averaged 14 aromatic hydrocarbons percentage for the first three species (benzene, toluene, m/p-xylene) and others at BF and SH.
The main compositions of NMHCs did not vary greatly between the BF and SH (Figure 5). The result indicates that ethane, propane, and acetylene are the most abundant hydrocarbons at both sites, with averaged concentrations of 9.31, 5.92, 5.81 ppbv at the BF, and 12.21, 6.43, 6.73 ppbv at the SH, respectively. Ethane, propane, and acetylene accounted for more than 50% of the total NMHCs at both sites. The results were in good agreement with the study by Mo et al. (2015), who reported that propane (19.9%) and ethane (9.5%) were two of top three species of VOCs in the petrochemical plants in the Yangtze River Delta (YRD). n-Butane, ethylene, i-butane, i-pentane, benzene, and propylene consistently appeared in the top 10 most abundant hydrocarbons at both sites. This suggests similar emission sources of NMHCs at two sites.
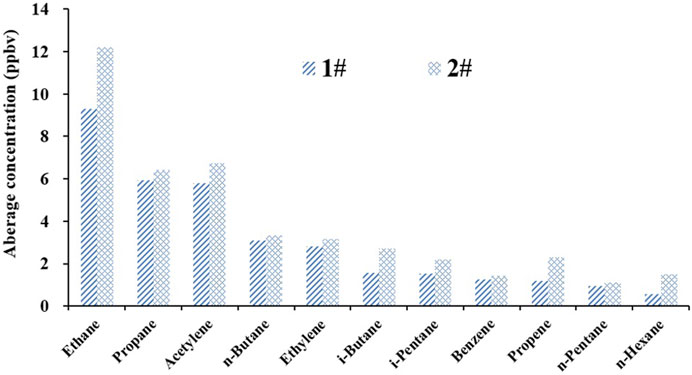
FIGURE 5. The concentrations top of 10NMHCs at BF and SH, except for n-Hexane at BF and n-Pentane for SH.
Comparison with other China cities
Atmospheric concentrations of selected NMHCs at the SH was compared with the results from several Chinese megacities (Barletta et al., 2005; Tang et al., 2007; Cai C. J. et al., 2010; Li et al., 2015; Jia et al., 2016). Numerous factors can affect the hydrocarbon mixing ratios observed in different studies, such as the nature of the sampling sites, time periods of a sampling campaign, meteorological conditions, human activities, and fuel composition in the target cities (Hsieh and Tsai, 2003). Therefore, a direct comparison of hydrocarbon mixing ratios in different studies entails careful interpretation. Hence, in this study, the comparison was just used for the illustration of the variation of NMHC levels in different Chinese megacities. Table 2 shows averaged NMHCs concentrations in Lanzhou, Guangzhou, Shanghai, Beijing, and 43 cities of China, as well as the data collected from our investigation. The averaged concentrations of NMHCs in the NECIB were fall within the ranges of NMHCs measured in the 43 Chinese cities (Table 2). Ethane level (12.21 ppbv) in the NECIB was among the top range (3.7–17.0 ppbv) 43 Chinese cities, higher than that in Beijing (4.73 ppbv), urban center (3.9 ppbv) and industrial park (8.28 ppbv) of Guangzhou. However, most NMHCs in the NECIB were lower than that in Guangzhou (except for n-Hexane), and higher than that in Shanghai and Beijing. On the one hand, most of the plants in the chemical base where the sampling area were set are under construction, and the relevant production equipment does not operate at full capacity. On the other hand, the sampling area is relatively open, flat and windy, which is conducive to the diffusion of pollutants. Comparing with petro-industrialized Lanzhou, the averaged concentrations of NMHCs in the NECIB were higher than the urban of Lanzhou, and lower but close to the industrial park of Lanzhou where large-scale petrochemical industries are located. The benzene to toluene ratio (B/T) in NECIB was 2.23, similar to Lanzhou (1.92), but greater than other cities (0.01–0.62), suggesting that the primary emission of NMHCs in the NECIB might have the same sources as those in Lanzhou. However, unlike the terrain and climate characteristics of Lanzhou, the NECIB belongs to the typical temperate continental climate, with flat terrain (1,250~1,300 m), low vegetation, low precipitation (192.9 mm yr−1), strong evaporation (1762.9 mm yr−1), and stronger wind speed (2.5~2.6 m/s, and can be as high as more than 17 m/s in the maximum) (Han et al., 2007; Wang et al., 2008). Such strong winds can easily disperse air pollutants in the NECIB. Therefore, it is expected that the emission sources of NMHCs in the NECIB may be stronger than that in Lanzhou, though the atmosphere levels were lower in the NECIB as aforementioned.
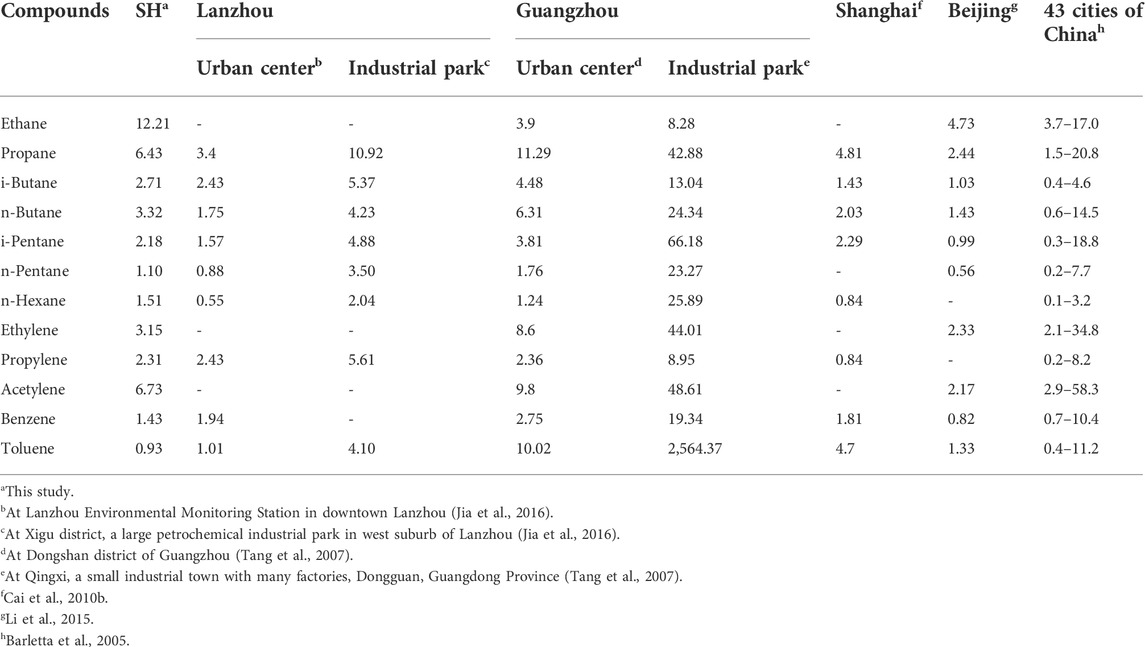
TABLE 2. Comparison of selected NMHCs mixing ratios in SH with other Chinese megacities (units: ppbv).
Discussion
NMHCs reactivity and ozone formation potential
The fractions of each species in mixing volume concentrations, the Prop-Equiv concentrations, and OFP values are shown in Figure 6. The total averaged Prop-Equiv concentrations and OFPs values of NMHCs were 7.38 and 73.04 ppbv at the BF, 7.91 and 76.04 ppbv at the SH. Although alkanes contributed more than 60% of NMHCs at both sampling sites, alkenes and acetylene showed much load on the Prop-Equiv concentrations and OFP values, accounting for about 60% of total Prop-Equiv concentration and OFP at both sites. These results suggest that, while the measured alkanes concentrations were the highest at the both sampling sites, their contributions to ozone formation (less than 30%) were lower than alkenes, acetylene and aromatics (Figure 6), due to the lower OH reactivity. The results were in accordance with the results showed by Jia et al. (2016), who identified that alkenes and aromatics were the primary contributors to ozone formation at the downtown and the west suburb Lanzhou, respectively, though alkanes concentrations were the highest in NMHCs at both sites. The OH rate constants for some of the reported NMHCs (2,3-Dimethylpentane and 4-Methyl-1-pentene) could not be found in the literature and were therefore omitted from the Prop-Equiv NMHCs sums, so the Prop-Equiv concentrations of the summed NMHCs are somewhat under estimated, but not that much.
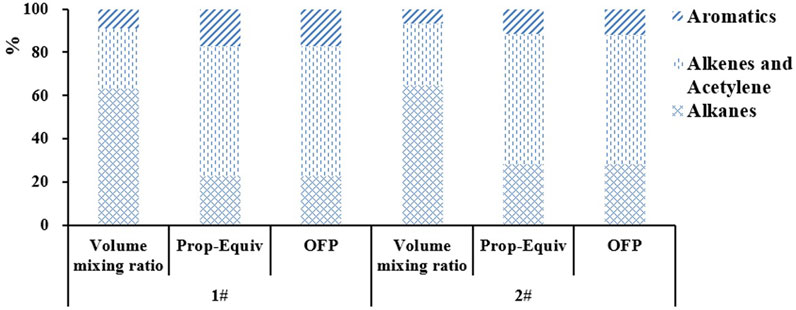
FIGURE 6. Fractions of each NMHC category for three scales (Volume mixing ratio, Prop-Equiv, OFP) at BF and SH.
The top 10 NMHCs ranked by their Prop-Equiv concentrations and OFP were summarized in Table 3, 4, respectively. At BF, Prop-Equiv concentration comes from these 10 NMHCs accounted for 63% of the total Prop-Equiv concentration, and OFP comes from these 10 NMHCs accounted for 75% of the total OFP. Similarly, at SH, the two ratios of these 10 NMHCs are 60% and 74%, respectively. Overall, the main NMHCs species favoring ozone formation identified by the Prop-Equiv concentration were also confirmed by the OFP (propylene, ethylene, 1-butene, n-butane, propane, m/p-xylene) but with different sequences. Propylene ranked No. One by Prop-Equiv concentration and was shared 18% and 15% of total Prop-Equiv concentrations at the BF and SH, respectively. Ethylene ranked second by Prop-Equiv concentration, with 11.9% at BF and 11.6% at the SH. The strong contributions of propylene and ethylene to ozone formation in the NECIB were not consistent with that in Pearl River Delta (toluene and m/p-xylene) by Tang et al. (2007), but similar to Lanzhou’s case (cis-2-butene and propylene) by Jia et al. (2016). Results derived by these two approaches reflect the similar pattern of ozone formation potential by each NMHC, especially those compounds with a greater contribution to ozone formation.
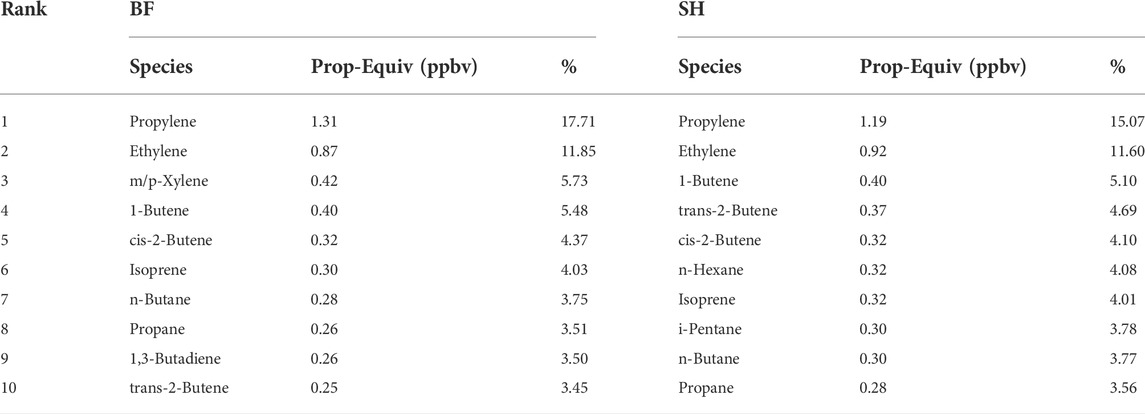
TABLE 3. Top 10 NMHCs ranked according to Prop-Equiv concentration (units: ppbv).
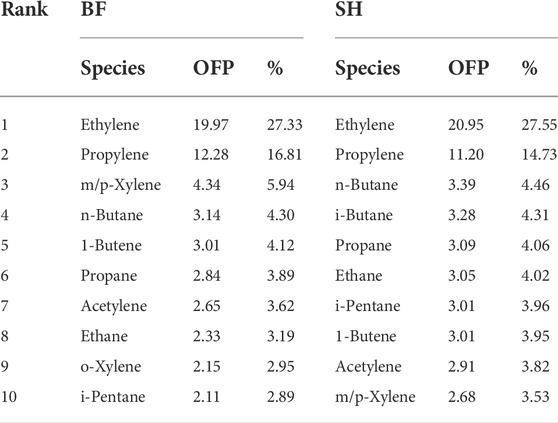
TABLE 4. Top 10 NMHCs ranked according to ozone formation potential (units: ppbv).
Due to the lack of available values for observed NOx and ozone during this experiment, it was difficult to estimate the contribution of NMHCs to the local photochemical formation of ground-level ozone. However, propylene, ethylene, 1-butene, n-butane, propane, m/p-xylene were considered to play significant roles in ground-level ozone formation in this region. Controlling their emissions would be likely to have a positive impact on ozone abatement.
Analysis of main sources of NMHCs in the NECIB
The NECIB is located in an isolated area with no significant external VOC sources in surrounding regions. Considering that the compositions of NMHCs at the BF were in good agreement with that in the SH, we combined the monitoring data collected from the two sampling sites in the diagnostic analysis so as to improve the statistical significance. Since toluene is an industrial solvent extensively used in various industrial processes, and benzene is also the characteristic product of industrial sources (Guo et al., 2004; Tang et al., 2007; Liu et al., 2008; Cai C. et al., 2010), we calculated the correlation coefficients (R) of the top 10 NMHCs to toluene and benzene, respectively (Table 5). Because of petrochemical industrial activities, chemical factories and power plants are thought to be the main sources of NMHCs (Ryerson et al., 2003; Jia et al., 2016), and acetylene is a characteristic product of combustion processes, i-pentane is a marker for gasoline evaporation (Barletta et al., 2005).
The correlation coefficient (R) of NMHCs with acetylene and n-pentane was also calculated (Table 5). The correlation coefficient (R) of short chain alkanes (ethane, propane, n-butane, isopentane and n-pentane) and alkenes (ethylene and propylene) with benzene and toluene were all greater than 0.6. The correlation coefficient (R) of toluene and benzene was 0.799, which confirmed that these gases also came from industrial production. The alkenes (ethylene and propylene) were also correlated well with i-pentane (R = 0.72, and 0.65), illustrating that gasoline evaporation is likely an additional source. The correlation coefficients of n-butane and n-pentane with i-pentane were 0.82 (p < 0.001) and 0.89 (p < 0.001), showing much better correlations than with toluene and benzene, indicating that gasoline evaporation from petrochemical industrial facilities were the dominant sources of these pollutants. The results were in line with the fact that, as a coal and coal chemical industry base, the NECIB can be regarded as a strong source from which the gases were likely continuously emitted from stacks, episodic emissions specific to individual processes, and leaks from pipes and valving for every facility (Ryerson et al., 2003). The lack of correlation between acetylene and benzene, toluene, and i-pentane indicates that combustion processes might be a major source from coal-fired power plants in the NECIB. i-butane and n-hexane also show the lack of correlation with benzene, toluene, i-pentane, and acetylene, suggesting additional sources of these gases.
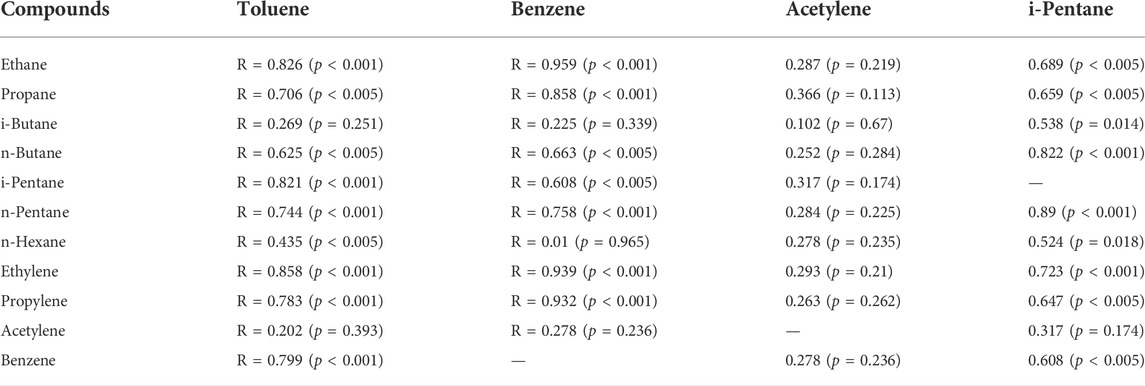
TABLE 5. Correlation coefficients (R) of the top 10 NMHCs with toluene, benzene, acetylene, and i-pentane.
In an attempt to validate the results obtained from this study, the benzene to toluene ratio (B/T) was calculated. Previous studies on vehicular exhaust suggest that the ratios of different aromatic compounds (particularly benzene and toluene) can be used to identify VOC sources, and a B/T ratio at about 0.5 (wt/wt) has been linked with vehicular emissions (Perry and Gee, 1995; Brocco et al., 1997). Higher B/T ratios have been considered as indicators of bio-fuel, charcoal, and coal consumption (Andreae and Merlet, 2001; dos Santos et al., 2004). In the present study, the B/T ratio was 2.23, greater than all of 43 Chinese cities in January/February 2001 (0.2–2.2) (Barletta et al., 2005), implying that industrial actives play more important role in VOC emissions, which is comparable to the ratio from industrial coal burning and oil refinery emissions (Liu et al., 2008).
Conclusion
In the present study, we collected ambient air samples at two sites in the NECIB during December 2016 and retrieved and analyzed 57 NMHCs. The results show that the measured NMHCs concentrations in the NECIB were dominated by alkanes (63% at the BF and 64% at the SH), followed by alkenes and acetylene (28% at the BF and 29% at the SH), and aromatics (9% at the BF and 7% at the SH). The levels of NMHCs in the NECIB were comparable to that sampled in petrochemical industrialized Lanzhou City. Industrial emissions were the primary sources of NMHCs in the NECIB, which was confirmed by the B/T ratio and the good correlation between the top NMHCs and the traces of industrial sources by other studies. Alkenes showed the highest Prop-Equiv concentrations and were the largest contributors to the OFP in the NECIB. Following the shift of energy industries, fossil fuel mining, and chemical industries to Northwestern China, it is expected that the NECIB will be expanded and developed continuously in coming years. As the study area is located in a dry and rainless area with low vegetation coverage and rainfall, the above air pollutants may exist in this NECIB area for a period of time, which may increase the risk of human exposure. The impact the NECIB characterized by degraded air quality and higher pollution levels in the surrounding environment needs to be carefully monitored. More investigations are required to fill knowledge gaps in the emissions of VOCs and their ozone formation potential. Significant efforts can be made to reduce the emissions of VOCs by applying the source and process control strategies under China’s “Volatile Organic Compounds (VOCs) pollution control technological strategy” in the rapidly developed NECIB and other energy bases with similar industrial structures across Northwestern China. In addition, the study is aimed at investigating and analyzing the pollutants discharged by energy and chemical enterprises with coal and oil as the main raw materials. Sampling and analysis were conducted in winter, and further analysis should be conducted in other seasons in order to better understand the pollutant emission characteristics of such enterprises.
Data availability statement
The raw data supporting the conclusions of this article will be made available by the authors, without undue reservation.
Author contributions
The corresponding author, JW wrote and revised the draft. He designed the experiment, collected samples, and analyzed the data. JM improved the experimental design, revised the structure of the paper, and edited the language. PL assisted in sample collection, sample analysis, and paper proof reading.
Funding
This work was financially supported by the Natural Science Foundation of Gansu Province, China (20JR10RA286); and the Foundation of Key Laboratory for Environmental Pollution Prediction and Control, Gansu Province, China (kleppc-2019-02).
Acknowledgments
We acknowledge the State Key Laboratory of Organic Geochemistry, Guangzhou Institute of Geochemistry, Chinese Academy of Sciences, who analyzed the samples. We also thank Chenhui Jia and Zhanxiang Wang for their assistance in sample collection.
Conflict of interest
The authors declare that the research was conducted in the absence of any commercial or financial relationships that could be construed as a potential conflict of interest.
Publisher’s note
All claims expressed in this article are solely those of the authors and do not necessarily represent those of their affiliated organizations, or those of the publisher, the editors and the reviewers. Any product that may be evaluated in this article, or claim that may be made by its manufacturer, is not guaranteed or endorsed by the publisher.
References
Andreae, M.O., and Merlet, P. (2001). Emission of trace gases and aerosols from biomass burning. Glob Biogeochem. 15, 955–966. doi:10.1029/2000GB001382
Atkinson, R., and Arey, J. (2003). Atmospheric egradation of olatile rganic ompounds. Chemical reviews 103, 4605–4638. doi:10.1021/cr0206420
Atkinson, R. (1990). Gas-phase tropospheric chemistry of organic compounds: A review. Atmospheric Environment. Part A. General Topics, 24, 1–41. doi:10.1016/0960-1686(90)90438-S
Atkinson, R. (1997). Gas-Phase ropospheric hemistry of olatile rganic ompounds: 1. Alkanes and lkenes. Journal of Physical and Chemical Reference Data, 26, 215–290. doi:10.1063/1.556012
Barletta, B., Meinardi, S., Sherwood Rowland, F., Chan, C.Y., Wang, X., Zou, S., Chan, L. Y., and Blake, D. R., (2005). Volatile organic compounds in 43 Chinese cities. Atmospheric Environment, 39, 5979–5990. doi:10.1016/j.atmosenv.2005.06.029
Bocola, W., and Cirillo, M.C. (1989). Air pollutant emissions by combustion processes in Italy. Atmospheric Environment, 23, 17–24. doi:10.1016/0004-6981(89)90093-0
Brocco, D., Fratarcangeli, R., Lepore, L., Petricca, M., and Ventrone, I. (1997). Determination of aromatic hydrocarbons in urban air of Rome. Atmospheric Environment 31, 557–566. doi:10.1016/S1352-2310(96)00226-9
Cai, C., Geng, F., Tie, X., Yu, Q., and An, J. (2010b). Characteristics and source apportionment of VOCs measured in Shanghai, China. Atmospheric Environment 44, 5005–5014. doi:10.1016/j.atmosenv.2010.07.059
Cai, C.J., Geng, F.H., Tie, X.X., Yu, Q., Peng, L., and Zhou, G.Q. (2010). Characteristics of mbient olatile rganic ompounds (VOCs) easured in Shanghai, China. Sensors 10, 7843–7862. doi:10.3390/s100807843
Carter, W.P.L. (1994). Development of zone eactivity cales for olatile rganic ompounds. Air & Waste 44, 881–899. doi:10.1080/1073161X.1994.10467290
Chameides, W.L., Fehsenfeld, F., Rodgers, M. O., Cardelino, C., Martinez, J., Parrish, D., Lonneman, W., Lawson, D. R., Rasmussen, R. A., Zimmerman, P., Greenberg, J., Middleton, P., and Wang, T., (1992). Ozone precursor relationships in the ambient atmosphere. Journal Geophysical Research. 97, 6037–6055. doi:10.1029/91JD03014
Chan, L.Y., Chu, K.W., Zou, S.C., Chan, C.Y., Wang, X.M., Barletta, B., et al. (2006). Characteristics of nonmethane hydrocarbons (NMHCs) in industrial, industrial-urban, and industrial-suburban atmospheres of the Pearl River Delta (PRD) region of south China. Journal Geophysical Research. 111, D11304. doi:10.1029/2005JD006481
Dorian, J.P., Abbasovich, U.T., Tonkopy, M.S., Jumabekovich, O.A., and Daxiong, Q. (1999). Energy in central asia and northwest China: major trends and opportunities for regional cooperation. Energy Policy 27, 281–297. doi:10.1016/S0301-4215(99)00020-8
dos Santos, C.Y.M., de Almeida Azevedo, D., and de Aquino Neto, F.R. (2004). Atmospheric distribution of organic compounds from urban areas near a coal-fired power station. Atmospheric Environment 38, 1247–1257. doi:10.1016/j.atmosenv.2003.11.026
Feng, S., Li, P., Liu, Z., Zhang, Y., and Li, Z. (2018). Experimental study on pyrolysis characteristic of coking coal from Ningdong coalfield. Journal of the Energy Institute, 91, 233–239. doi:10.1016/j.joei.2016.12.001
Guo, H., Wang, T., and Louie, P.K.K. (2004). Source apportionment of ambient non-methane hydrocarbons in Hong Kong: Application of a principal component analysis/absolute principal component scores (PCA/APCS) receptor model. Environmental Pollution 129, 489–498. doi:10.1016/j.envpol.2003.11.006
Hagerman, L. M., Aneja, V. P., and Lonneman, W. A. (1997). Characterization of non-methane hydrocarbons in the rural southeast United States. Atmospheric Environment 31, 4017–4038. doi:10.1016/S1352-2310(97)00223-9
Han, Y., Gao, J., Li, H., and Li, Y. (2007). Ecology suitability analysis on the industry overall arrangement lan of ingdong energy ources and chemical industry usage. Environmental Science Management 32, 142–147. (in Chinese). doi:10.3969/j.issn.1673-1212.2007.11.040
Ho, K. F., Lee, S. C., Guo, H., and Tsai, W. Y. (2004). Seasonal and diurnal variations of volatile organic compounds (VOCs) in the atmosphere of Hong Kong. Science of The Total Environment, 322, 155–166. doi:10.1016/j.scitotenv.2003.10.004
Hsieh, C.C., and Tsai, J. H. (2003). VOC concentration characteristics in Southern Taiwan. Chemosphere 50, 545–556. doi:10.1016/S0045-6535(02)00275-8
Jia, C., Mao, X., Huang, T., Liang, X., Wang, Y., Shen, Y., Jiang, W., Wang, H., Bai, Z., Ma, M., Yu, Z., Ma, J., and Gao, H., (2016). Non-methane hydrocarbons (NMHCs) and their contribution to ozone formation potential in a petrochemical industrialized city, Northwest China. Atmospheric Research 169, 225–236. doi:10.1016/j.atmosres.2015.10.006
Li, L., Xie, S., Zeng, L., Wu, R., and Li, J. (2015). Characteristics of volatile organic compounds and their role in ground-level ozone formation in the Beijing-Tianjin-Hebei region, China. Atmospheric Environment, 113, 247–254. doi:10.1016/j.atmosenv.2015.05.021
Liang, X., Huang, T., Lin, S., Wang, J., Mo, J., Gao, H., Wang, Z., Li, J., Lian, L., and Ma, J., (2019). Chemical composition and source apportionment of PM 1 and PM 2.5 in anational coal chemical industrial base of the Golden Energy Triangle, Northwest China. Science of The Total Environment 659, 188–199. doi:10.1016/j.scitotenv.2018.12.335
Ling, Z., Huang, T., Zhao, Y., Li, J., Zhang, X., Wang, J., Lian, L., Mao, X., Gao, H., and Ma, J., (2017). OMI-measured increasing SO2 emissions due to energy industry expansion and relocation in northwestern China. Atmospheric Chemistry and Physics, 17, 9115–9131. doi:10.5194/acp-17-9115-2017
Liu, Q., Lei, Q., Xu, H., and Yuan, J. (2018). China’s energy revolution strategy into 2030. Resources, Conservation and Recycling, 128, 78–89. doi:10.1016/j.resconrec.2017.09.028
Liu, X., Guo, H., Zeng, L., Lyu, X., Wang, Y., Zeren, Y., Yang, J., Zhnag, L., Zhao, S., Li, J., and Zhang, G., (2021). Photochemical ozone pollution in five Chinese megacities insummer 2018. Science of The Total Environment, 801, 149603. doi:10.1016/j.scitotenv.2021.149603
Liu, Y., Shao, M., Fu, L., Lu, S., Zeng, L., and Tang, D. (2008). Source profiles of volatile organic compounds (VOCs) measured in China: Part I. Atmospheric Environment, 42, 6247–6260. doi:10.1016/j.atmosenv.2008.01.070
Ma, J., and Xu, J. (2017). Environment: China's energy rush harming ecosystem. Nature 541, 30–30. doi:10.1038/541030b
Mo, Z., Shao, M., Lu, S., Qu, H., Zhou, M., Sun, J., and Gou, B., (2015). Process-specific emission characteristics of volatile organic compounds (VOCs) from petrochemical facilities in the Yangtze River Delta, China. Science of The Total Environment, 533, 422–431. doi:10.1016/j.scitotenv.2015.06.089
Mohamed, M. F., Kang, D., and Aneja, V. P. (2002). Volatile organic compounds in some urban locations in United States. Chemosphere 47, 863–882. doi:10.1016/S0045-6535(02)00107-8
Monod, A., Sive, B.C., Avino, P., Chen, T., Blake, D.R., and Sherwood Rowland, F. (2001). Monoaromatic compounds in ambient air of various cities: focus on correlations between the xylenes and ethylbenzene. Atmospheric Environment, 35, 135–149. doi:10.1016/S1352-2310(00)00274-0
Ou, R., Chang, C., Zeng, Y., Zhang, X., Fu, M., Fan, L., Chen, P., and Ye, D., (2022). Emission characteristics and ozone formation potentials of VOCs from ultra-low-emission waterborne automotive painting. Chemosphere 305, 135469. doi:10.1016/j.chemosphere.2022.135469
Ou-Yang, C. F., Hsieh, H. C., Cheng, F. Y., Lin, N. H., Chang, S. C., and Wang, J. L. (2022). Decadal rends of peciated on-methane ydrocarbons in aipei. Journal of Geophysical Research: Atmospheres, 125, e2019JD031578. doi:10.1029/2019JD031578
Panopoulou, A., Liakakou, E., Gros, V., Sauvage, S., Locoge, N., and Bonsang, B., (2018). Non-methane hydrocarbon variability in thens during wintertime: he role of traffic and heating. Atmospheric Chemistry and Physics, 18, 16139–16154. doi:10.5194/acp-18-16139-2018
Pernov, J. B., Bossi, R., Lebourgeois, T., Nøjgaard, J. K., Holzinger, R., Hjorth, J. L., and Skov, H. (2021). Atmospheric VOC measurements at a igh rctic site: haracteristics and source apportionment. Atmospheric Chemistry and Physics, 21, 2895–2916. doi:10.5194/acp-21-2895-2021
Perry, R., and Gee, I. L. (1995). Vehicle emissions in relation to fuel composition. Science of The Total Environment, 169, 149–156. doi:10.1016/0048-9697(95)04643-F
Poisson, N., Kanakidou, M., and Crutzen, P. J. (2000). Impact of Non-Methane Hydrocarbons on Tropospheric Chemistry and the Oxidizing Power of the Global Troposphere: 3-Dimensional Modelling Results. Journal of Atmospheric Chemistry, 36, 157–230. doi:10.1023/A:1006300616544
Ryerson, T. B., Trainer, M. W., Angevine, M., Brock, C. A., Dissly, R. W., Fehsenfeld, F. C., Frost, G. J., Goldan, P. D., and Holloway, J. S., (2003). Effect of petrochemical industrial emissions of reactive alkenes and NOxon tropospheric ozone formation in Houston, Texas. Journal of Geophysical Research: Atmospheres, 108 (8), 4249. doi:10.1029/2002JD003070
Sahu, L.K., Yadav, R., and Tripathi, N. (2020). Aromatic compounds in a semi-urban site of India: Seasonal variability and emission ratios. Atmospheric Research, 246, 105114. doi:10.1016/j.atmosres.2020.105114
Shen, Y., Zhang, X., Brook, J.R., Huang, T., Zhao, Y., Gao, H., and Ma, J., (2016). Satellite Remote Sensing of Air Quality in the Energy Golden Triangle in Northwest China. Environmental Science and Technology Letters, 3, 275–279. doi:10.1021/acs.estlett.6b00182
Srivastava, A. (2005). Variability in oc oncentrations in an rban rea of Delhi. Environmental Monitoring and Assessment 107, 363–373. doi:10.1007/s10661-005-3546-8
Tang, J.H., Chan, L.Y., Chan, C.Y., Li, Y.S., Chang, C.C., Liu, S.C., and Wu, D., (2007). Characteristics and diurnal variations of NMHCs at urban, suburban, and rural sites in the Pearl River Delta and a remote site in South China. Atmospheric Environment 41, 8620–8632. doi:10.1016/j.atmosenv.2007.07.029
Wang, J., Mo, J., Li, J., Ling, Z., Huang, T., Zhao, Y., Zhang, X., Mao, X., Gao, H., Shen, Y., and Ma, J., (2017). OMI-measured SO2 in a large-scale national energy industrial base and its effect on the capital city of Xinjiang, Northwest China. Atmospheric Environment 167, 159–169. doi:10.1016/j.atmosenv.2017.08.002
Wang, M., Chen, W., Zhang, L., Qin, W., Zhang, Y., Zhang, X., and Xie, X., (2020a). Ozone pollution characteristics and sensitivity analysis using an observation-based model in Nanjing, Yangtze River Delta Region of China. Journal of Environmental Science 93, 13–22. doi:10.1016/j.jes.2020.02.027
Wang, M., Hu, K., Chen, W., Shen, X., Li, W., and Lu, X. (2020b). Ambient on-ethane ydrocarbons (NMHCs) easurements in aoding, China: Sources and oles in ormation. Atmosphere 11, 1205. doi:10.3390/atmos11111205
Wang, Y., and Zhao, Y. (2008). Issues of environmental protection and ecological construction of ingdong nergy and hemistry ndustry ase. Engineering Technology, 7, 190–193. doi:10.3969/j.issn.1671-7244.2008.02.023
Warneke, C., Karl, T., Judmaier, H., Hansel, A., Jordan, A., Lindinger, W., and Crutzen, P. J., (1999). Acetone, methanol, and other partially oxidized volatile organic emissions from dead plant matter by abiological processes: Significance for atmospheric HOx chemistry. Global Biogeochemical Cycles, 13, 9–17. doi:10.1029/98GB02428
Yadav, R., Beig, G., Anand, V., Kalbande, R., and Maji, S. (2022). Tracer-based characterization of source variations of ambient isoprene mixing ratios in a hillocky megacity, India, influenced by the local meteorology. Environmental Research 205, 112465. doi:10.1016/j.envres.2021.112465
Yadav, R., Sahu, L.K., Beig, G., and Jaaffrey, S.N.A. (2016). Role of long-range transport and local meteorology in seasonal variation of surface ozone and its precursors at an urban site in India. Atmospheric Research, 176–177, 96–107. doi:10.1016/j.atmosres.2016.02.018
Yadav, R., Sahu, L.K., Tripathi, N., Pal, D., Beig, G., and Jaaffrey, S.N.A. (2019). Investigation of emission characteristics of NMVOCs over urban site of India. Environmental Pollution 252, 245–255. doi:10.1016/j.envpol.2019.05.089
Zhang, L., Li, H., Wu, Z., Zhang, W., Liu, K., Cheng, X., Zhang, Y., Li, B., and Chen, Y., (2020). Characteristics of atmospheric volatile organic compounds in urban area of Beijing: Variations, photochemical reactivity and source apportionment. Journal of Environmental Sciences, 95, 190–200. doi:10.1016/j.jes.2020.03.023
Zhang, Y., Wang, X., Barletta, B., Simpson, I. J., Blake, D.R., Fu, X., Zhang, Z., He, Q., Liu, T., Zhao, X., and Ding, X., (2013). Source attributions of hazardous aromatic hydrocarbons in urban, suburban and rural areas in the Pearl River Delta (PRD) region. Journal of Hazardous Materials 250-251, 403–411. doi:10.1016/j.jhazmat.2013.02.023
Zhang, Y., Wang, X., Zhang, Z., Lü, S., Huang, Z., and Li, L. (2015). Sources of C2–C4 alkenes, the most important ozone nonmethane hydrocarbon precursors in the Pearl River Delta region. Science of The Total Environment 502, 236–245. doi:10.1016/j.scitotenv.2014.09.024
Keywords: NMHCs, ozone formation potential, B/t ratio, energy and chemical industrial base, NECIB
Citation: Wang J, Ma J and Liu P (2022) Ambient non-methane hydrocarbons and their contribution to ozone formation potential in a super coal chemical industry in China’s Energy Golden Triangle. Front. Environ. Chem. 3:1002301. doi: 10.3389/fenvc.2022.1002301
Received: 25 July 2022; Accepted: 04 October 2022;
Published: 19 October 2022.
Edited by:
Lei Dong, Shanxi University, ChinaReviewed by:
Ravi Yadav, Indian Institute of Tropical Meteorology (IITM), IndiaDayong Tian, Anyang Institute of Technology, China
Copyright © 2022 Wang, Ma and Liu. This is an open-access article distributed under the terms of the Creative Commons Attribution License (CC BY). The use, distribution or reproduction in other forums is permitted, provided the original author(s) and the copyright owner(s) are credited and that the original publication in this journal is cited, in accordance with accepted academic practice. No use, distribution or reproduction is permitted which does not comply with these terms.
*Correspondence: Jinxiang Wang, d2FuZ2p4ODU0MUAxNjMuY29t