 K. Ramaraju1†
 Tentu Nageswara Rao
 Y. Prashanthi
 Parameswaram Ganji
- 1Department of Chemistry, Mahatma Gandhi University, Nalgonda, India
- 2Department of Analytical Chemistry, Isosphere Biosciences Pvt Ltd., Secundrabad, Telangana, India
- 3Department of Surface Engineering, Jožef Stefan Institute, Ljubljana, Slovenia
Aim: This study examines the photolytic and photocatalytic activities of a polyethylene glycol-capped zinc ferrite nanocomposite aimed at removing sethoxydim herbicide residues from pond water.
Material and Methods: Zinc ferrite nanoparticles were produced using the sol-gel method with precursors like zinc nitrate and iron nitrate. A clear PEG solution was formed by dissolving 1 g of PEG in distilled water. PEG-ZnFe2O4 nanocomposites were synthesized by heating and calcining the mixture at 300 °C for 3 h. Polyethylene glycol capped zinc ferrite nanocomposites (PEG-ZnFe2O4 NCs) were characterized using various methods such as TEM, SEM, FT-IR, UV-Vis spectroscopy, and XRD. Two sets of spiked concentrations were prepared for experiments, one with the catalyst (PEG-ZnFe2O4) and the other without it. The samples were exposed to sunlight, collected at predetermined intervals, and filtered using a 0.45 μm PTFE membrane filter. The filtrates were collected into amber-colored vials before being validated using HPLC. The method validation process involved analyzing untreated control samples, working standard, and test solutions for method specificity, and calibration solutions were analyzed using HPLC at various concentrations.
Results and Discussion: The fortified samples were analyzed using the HPLC method to extract and quantify sethoxydim in pond water. The limit of quantification (LOQ) was established by performing five injections of recovery samples at a fortification level of 0.03 μg/mL for sethoxydim for low-level recovery. The limit of detection (LOD) was determined to be 0.01 μg/mL. The adsorption study assessed the effect of adsorbent dosage by mixing a 50 ml solution with various doses of PEG-ZnFe2O4 NCs. The study found that sethoxydim’s half-life in pond water without a catalyst was 4.80 days, while in the presence of a catalyst, it was 8.42 h.
Conclusion: When compared to photolysis, research on photocatalysis has revealed greater efficiency and quicker reactions, while the DT50 value, or half-life, holds considerable importance in environmental pond water. This study proposes new applications for PEG-ZnFe2O4 NCs in environmental remediation and waste water treatment.
Introduction
A substance can accelerate a chemical reaction by absorbing light energy while remaining unchanged. This process is commonly referred to as photocatalysis. It is widely used for energy conversion, organic synthesis, and environmental applications (Zhu and Wang, 2017; Chakravorty and Roy, 2024; Sabatier and Prize, 2020). The process involves redox reactions, electron excitation, and light absorption (Bhattacharjee and Roy, 2024). There are three types of photocatalysis: heterogeneous, homogeneous, and plasmonic (Boon et al., 2018; Chaturvedi et al., 2012; Hassaan et al., 2023). Plasmonic photocatalysis uses metal nanoparticles (NPs) to improve light absorption and reaction efficiency. Homogeneous photocatalysis involves the catalyst and reactants in the same phase, whereas heterogeneous photocatalysis involves the catalyst in a different phase than the reactants (Rao et al., 2016; Soc et al., 2020; Nageswara Rao et al., 2019).
Photocatalysis is a promising technology for pollution reduction and sustainability that provides numerous environmental benefits (Nageswara Rao et al., 2021; Zhao et al., 2021; Daqa et al., 2023; Mohan et al., 2021; Prabakar et al., 2021). Some of the primary benefits include air purification, water treatment, soil remediation, sustainable energy generation, self-cleaning surfaces, and reduced reliance on fossil fuels (Series; Hammouche et al., 2021; Aisida et al., 2019; Dabagh et al., 2023). Photocatalytic materials such as TiO2 are used in building and road coatings to reduce urban air pollution (Arinzechukwu et al., 2022). They help break down pollutants such as NOx, VOCs, and carbon monoxide. Water treatment effectively removes heavy metals and other persistent contaminants from wastewater while also breaking down organic pollutants, dyes, pesticides, and medications. Soil remediation improves soil health and reduces toxicity. Additionally, photocatalysis contributes to the production of green fuels such as methanol and biodiesel (Saafan et al., 2021; Lo et al., 2016; Anastassiadou et al., 2019; Sevilla-morán et al., 2014; Sevilla-Morán et al., 2010).
The photocatalytic activity of zinc ferrite (ZnFe2O4) nanocomposites (NCs) capped with polyethylene glycol (PEG) was investigated (Calvo et al., 2017). PEG capping improves the stability, biocompatibility, and functionality of zinc ferrite nanoparticles (Saleh et al., 2020). These nanoparticles have improved the structural and optical properties of nickel-zinc ferrite nanocomposites, as well as their effectiveness as MRI contrast agents. PEG capping agents are essential in nanoparticle-based applications such as biomedical and environmental remediation (Nasrollahzadeh et al., 2021).
Sethoxydim, a post-emergent herbicide, is applied to horticultural crops to selectively control grass weeds. It is frequently sold under the brands Past, Torpedo, Ultima, Vantage, Conclude, and Result (Ningthou et al., 2022). One of its chemical properties is the ability to inhibit acetyl-CoA carboxylase, an enzyme required for lipid biosynthesis in grasses (Taghizade Firozjaee et al., 2018; Bruckmann et al., 2022; Singh and Yadav, 2024). The formula is C17H29NO3S. With an average half-life of 5 days in soil, it degrades via photolysis and microbial metabolism and has a water solubility of 4,000 parts per million. It is effective against both annual and perennial grasses, such as wild oats, crabgrass, and Japanese stilt grass (Dehghani et al., 2024). It works best on small, actively growing grasses and must be completely covered for optimal results (El-nahhal and El-nahhal, 2021).
Nanocatalysts play an important role in removing pesticide residues from water through sophisticated oxidation techniques, adsorption, and photocatalysis (Marican and Durán-lara, 2018). These techniques improve water quality and contribute to environmental sustainability by speeding up the breakdown of harmful substances (Sousa et al., 2021). PEG-capped ZnFe2O4 nanocomposites can effectively facilitate the photolytic and photocatalytic degradation of sethoxydim herbicide residues present in pond water (Sattar et al., 2021). The PEG layer enhances dispersion, surface stability, and biocompatibility and prevents the aggregation of nanoparticles. The photolytic process involves the direct breakdown of sethoxydim without a catalyst, while photocatalysis leads to the generation of reactive species (Sattar et al., 2021; Bajwa and Sandhu, 2014; Yang and Wang, 2008). The experimental setup employs hydrothermal or sol-gel methods, X-ray diffraction (XRD), Fourier-transform infrared (FT-IR) spectroscopy, transmission electron microscopy (TEM), and UV–VIS. Expected outcomes include the disappearance of characteristic sethoxydim bands, a reduction in absorbance peaks, and nearly complete degradation (Kurian, 2021).
The nanocomposite is characterized by recyclability and low toxicity, making it a promising candidate for scaling up agricultural runoff treatment (Punyasamudram et al., 2024). PEG capping offers several advantages for nanoparticles and nanocomposites, particularly in environmental and biomedical applications. Key benefits include enhanced stability, improved dispersibility, reduced toxicity, surface functionalization, photocatalytic enhancement, and environmental compatibility. PEG-capped nanocomposites are versatile for chemical sensing, pollutant degradation, and therapeutic delivery. In the photocatalytic process, ultraviolet radiation activates a semiconductor photocatalyst, creating a redox environment in an aqueous solution.
Semiconductors act as sensitizers for light-induced redox processes due to their electronic structure, which is characterized by a filled valence band and an empty conduction band. The energy difference between the valence and conduction bands is called the band gap. Semiconductors absorb photons with energies equal to or greater than their band gap or threshold energy (Eg) and excite electrons in the occupied valence band to the unoccupied conduction band, leading to excited state conduction band electrons and positive holes in the valence band. The recombination of these charge carriers is effectively prevented to utilize them for redox reactions involving adsorbed species. Semiconductors absorb light of energy greater than or equal to the band gap energy (Eg) and promote an electron from the valence band to the conduction band, creating an electronic vacancy or hole (h+) at the valence band edge. This hole can initiate further interfacial electron transfer or other chemical reactions to an adsorbate or diffuse into the bulk solvent with surface-bound OH- ions. The photogenerated electron is usually in the conduction band edge, and the hole is in the valence band edge.
The analysis incorporates high-performance liquid chromatography (HPLC)-photodiode array (PDA) to determine the residue levels of sethoxydim herbicide present in water samples. This approach ensures food safety, analyzes environmental impacts, and supports compliance with regulations.
Materials and methods
Materials
The sethoxydim reference standard (purity 99.82%) was procured from LGC Laboratories GmbH.
Sethoxydim 12.5% EC was acquired from the Secunderabad local market. The HPLC-grade acetonitrile (purity 99.9%), HPLC-grade water (purity 99.99%), ortho-phosphoric acid (purity 85.6%), zinc nitrate (purity 99.5%), iron nitrate (purity 99.3%), AR-grade ethylene glycol (99.4%), and PEG-8000 (with an average molecular weight of approximately 8,000 g/mol) were supplied by M/s. Merck India Ltd., Mumbai.
Preparation of ZnFe2O4 nanocomposite
Zinc ferrite nanoparticles were generated through the sol-gel method. The precursors included 0.5 g of zinc nitrate [Zn (NO3)2·6H2O] and 0.575 g of iron nitrate [Fe (NO3)3·9H2O]. The sol-gel approach involved dissolving the precursors in 50 mL of ethylene glycol (C2H6O2) and magnetically stirring the mixture at 1,000 rpm for 2 h at room temperature to yield a consistent 0.1 M aqueous solution. To thoroughly remove the liquid, the solution was dried at 130 °C for 6 h. To crystallize the resulting dry powder, it was annealed at 500 °C for 1 h in a furnace.
Preparation of polyethylene glycol
A colorless PEG-8000 solution was achieved by dissolving approximately 1 g of PEG-8000 in 100 mL of distilled water at 50 °C and stirring with a magnetic stirrer for 5 min at 1,000 rpm. For later use, the corresponding solution was stored in a glass container.
Synthesis of PEG-ZnFe2O4 NCs
Two grams of ZnFe2O4 powder was placed in a 100 mL glass beaker, 50 mL of PEG solution was added, and the mixture was stirred continuously at 1,000 rpm for 1 h before being heated at 80 °C for 2 h and calcined at 300 °C for 3 h to produce PEG-ZnFe2O4 NCs.
Characterization of PEG-ZnFe2O4 NCs
The produced nanoparticles were characterized using various methods, including X-ray diffraction (Rigaku SmartLab SE Multipurpose X-ray Diffractometer), which determined the crystallite size, phase composition, and lattice parameters. Functional groups and bonds in precursors and products are identified using Fourier-transform infrared spectroscopy (Agilent 4300-FT-IR Spectrometer). Scanning electron microscopy (SEM) can reveal the size, shape, distribution, and morphology of PEG-ZnFe2O4 NCs. A transmission electron microscope (Tescan-TEM) was used to investigate the size, shape, and crystal structure of PEG-ZnFe2O4 NCs. The UV–visible spectrometer UV–VIS-NIR JASCO, V570, was used to record the absorption spectrum of PEG-ZnFe2O4 powder samples in the range of 200–800 nm of wavelength using a combination of tungsten and deuterium lamps.
Pond water collection
Pond water was collected from Shameerpet Pond. The latitude is 17.5917° N, and 78.5822° E is the longitude.
Preparation of mobile phase A (0.1% OPA)
Accurately, 1 mL of ortho-phosphoric acid was transferred into a 1,000 mL mobile-phase bottle containing approximately 500 mL of HPLC-grade water. The volume of the solution was made up to 1,000 mL with HPLC-grade water, sonicated for 15 min to mix completely, and filtered through a 0.45-µm filter.
Preparation of mobile phase B
Acetonitrile was used as the mobile phase B.
Preparation of diluent
Methanol was used as the diluent.
HPLC conditions
The sethoxydim content was determined using HPLC under specific instrument conditions. The instrument was a Shimadzu with a PDA detector, 250 nm wavelength, and a mobile phase of 95%: 5% v/v (0.1% OPA:acetonitrile). The column was a Phenomenex C18 column (250 mm × 4.6 mm, 5 µ), with a 30 °C oven temperature, 1.0 mL/min flow rate, 20 µL injection volume, 8 min run time, and approximately 4.0 min retention time.
Method validation
Method specificity
Untreated control samples of pond water extract, acetonitrile, 0.1% ortho-phosphoric acid, working standard, and test solutions were assayed for method specificity.
Linearity of response
Weighing 10.02 mg of reference standard into a 50 mL volumetric flask and diluting with acetonitrile yielded a stock solution of sethoxydim standard. The correct volume of stock solution was then diluted into various 10 mL volumetric flasks, and acetonitrile was added to bring the flasks to volume, resulting in a series of calibration solutions. The calibration solutions (L1, L2, L3, L4, L5, and L6) were analyzed using HPLC at concentrations of 0.01 µg/mL, 0.03 µg/mL, 0.5 µg/mL, 1.0 µg/mL, 2.0 µg/mL, and 5.0 μg/mL. The correlation coefficient was determined by plotting a linear curve of the standard concentration against the observed peak area.
Assay accuracy and precision
The validation process involves analyzing fortified samples and an untreated (blank) pond water sample. Fortified samples were prepared by adding a known amount of sethoxydim and working up the sample volume. The HPLC method was then used to extract and quantify the amount of sethoxydim in pond water. The concentrations of the fortified samples were 1 × LOQ = 0.03 μg/mL and 10 × LOQ = 0.3 μg/mL. Method validation was carried out using five replicates at each level of fortification. The response area of the fortified samples was used to calculate the percentage recovery and relative standard deviation.
Limit of quantification
The limit of quantification (LOQ) indicates the lowest validated level that provides adequate recovery. The LOQ was defined by performing five injections of recovery samples at a fortification level of 0.03 μg/mL for sethoxydim, and low-level recovery was used to establish the LOQ.
Limit of detection
The limit of detection (LOD) was established at approximately three times the dilution of the LOQ solution. The LOD concentration fell within the linearity range. The LOD was determined to be 0.01 μg/mL.
Adsorption study (effect of adsorbent dosage)
To assess the effect of adsorbent dosage, a 50 mL solution was mixed with various doses of PEG-ZnFe2O4 NCs (50 mg, 100 mg, 150 mg, 250 mg, and 500 mg), while keeping other parameters unchanged. The initial concentration of sethoxydim was established at 1.0 μg/mL, with a contact time of 30 min. Afterward, all samples were filtered using 0.45-µm filter paper and injected into the HPLC.
Photolytic and photocatalytic studies
A concentration of 1.0 μg/mL of the sethoxydim reference standard was utilized to investigate the photolytic and photocatalytic behavior of sethoxydim residues in water across all occasions. At every fortification level, single replications were carried out in addition to the control samples for comparison. Two sets of spiked concentrations were made for the experiments. PEG-ZnFe2O4 NCs (catalyst) were applied to one set of samples, and it was not applied to the other. The samples were placed in direct sunlight. Aliquots of the sample were taken at specified intervals. During this time, water samples were taken at temperatures between 24 °C and 40 °C. Samples collected at different sampling times were filtered using 0.45-µm PTFE membrane filters, and the filtrates were collected into amber-colored vials. Before HPLC analysis, each sample was stored in the dark at 5 °C. The samples containing PEG-ZnFe2O4 NCs were centrifuged for 5 min at 5 °C using a Beckman cooling centrifuge with 4,000 rotations per minute. To prevent further degradation of the residues, the supernatants were transferred to amber-colored bottles and stored in the dark at 5 °C until analysis.
Samples were collected on various occasions until the concentrations of T1 dropped below the LOQ specified by Nageswara Rao et al., 2021. After completing the analysis based on the occasions and concentrations, we calculated the half-life (DT50) of sethoxydim using the provided formula.
The first-order kinetics form is
where C0 is the herbicide concentration at time zero, Ct is the herbicide concentration at time t, and k is the rate constant.
Sample extraction
The representative homogenized 5 mL aliquot of the photocatalytic and photolytic water sample was dried using a vacuum rotary evaporator. It was then diluted with acetonitrile to the mark. Following this, the solution was filtered through a 0.45-µm filter, and finally, it was injected into the HPLC-PDA.
Results and discussion
Characterization of PEG-ZnFe2O4 NCs
FT-IR analysis
The FT-IR spectra (Figure 1) of zinc ferrite nanocomposites capped with PEG reveal distinct functional groups. The band at 400–650 cm−1 confirms the formation of the spinel ferrite structure by distinct metal-oxygen stretching vibrations (Zn-O, Fe-O). PEG coating bands from 800 cm−1 to 2,000 cm−1 indicate effective surface functionalization. C=O stretching (∼1,700 cm−1) of PEG ether bonds is present. The stretching O-H (∼3,400 cm−1) of PEG’s hydroxyl groups increases its hydrophilicity and biocompatibility. These functional groups increase the stability of zinc ferrite nanocomposites by confirming their successful capping with PEG.
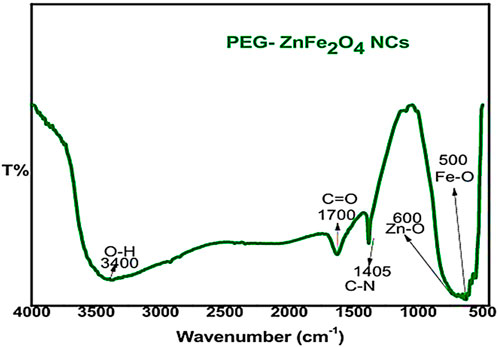
Figure 1. FT-IR spectra of PEG-ZnFe2O4 NCs.
XRD analysis
Figure 2 shows the powder XRD pattern for PEG-ZnFe2O4 NCs with peaks (311). The observed diffraction peaks associated with Zn ferrite NP Bragg reflections were successfully identified as the (220), (311), (222), (400), (422), (440), and (511) planes. These planes correspond to a pure phase with spinel structure and are consistent with the standard Joint Committee on Powder Diffraction Standards (JCPDS) card no. 73–1964. The diffraction peaks of spinel ferrites from PEG-ZnFe2O4 NCs were similar to those of Zn ferrite NPs. Similar PEG-ZnFe2O4 NC diffraction patterns indicate that the crystalline structure of Zn ferrite NPs was unaffected by the PEG coating. The results indicate that the PEG coating was applied successfully to the surface.
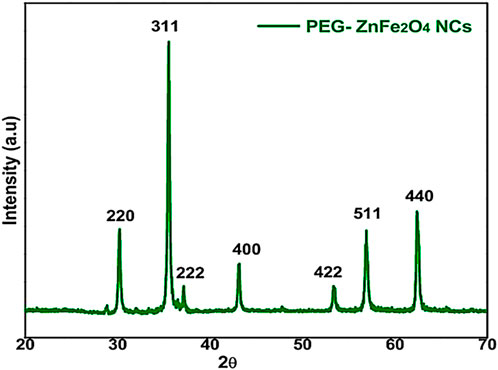
Figure 2. XRD results of PEG-ZnFe2O4 NCs.
SEM analysis
FE-SEM image (Figure 3) shows an agglomeration of spherical nanoparticles. The small size and high surface energy of nanoparticles cause them to agglomerate easily. The FE-SEM image reveals that PEG-ZnFe2O4 NCs agglomerate due to the capping agent’s effect on crystal size modification. FE-SEM cannot accurately measure particle sizes due to agglomeration.
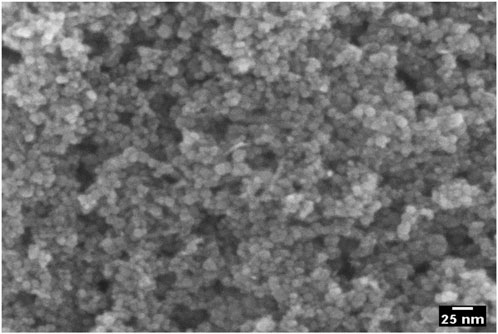
Figure 3. SEM image of PEG-ZnFe2O4 NCs.
TEM analysis
Figure 4 shows a transmission electron microscope image of ZnFe2O4 nanoparticles, illustrating their morphology, particle dimensions, and crystalline structure. These characteristics encompass spherical or quasi-spherical forms, particle sizes between 10 nm and 50 nm, lattice fringes that signify crystallinity, and occasionally aggregated clusters resulting from magnetic interactions. Grasping these properties is essential for comprehending the behavior of ZnFe2O4 in photocatalytic, magnetic, or sensing applications. PEG-ZnFe2O4 NC sizes range from 10 nm to 60 nm. The sample has a different spherical structure, high crystallinity, and particle aggregation. ZnFe2O4 NCs coated with PEG have a different shape and structure.
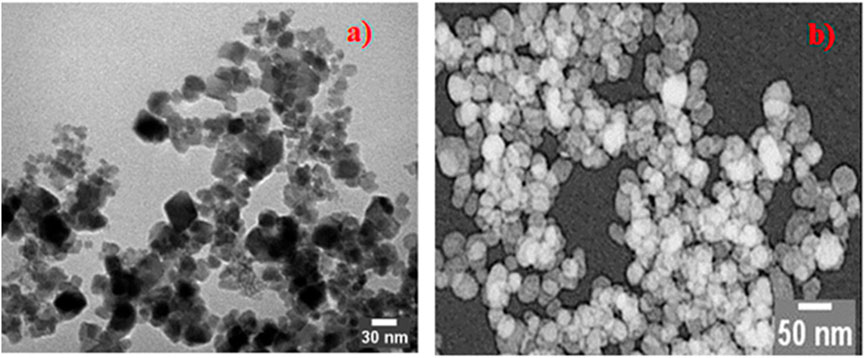
Figure 4. TEM images of (a) ZnFe2O4 NCs (b) PEG-ZnFe2O4 NCs.
UV–VIS spectroscopy and optical properties of PEG-ZnFe2O4 nanoparticles
UV–Vis spectroscopy elucidates the optical properties of ZnFe2O4 nanoparticles, which display strong absorption within the visible range, characterized by an absorption edge approximately between 580 nm and 600 nm. The narrow band gap of 1.9 eV makes it advantageous for photocatalysis utilizing visible light. ZnFe2O4 is particularly effective for the degradation of dyes and organic pollutants and is often paired with other semiconductors to increase charge separation and photocatalytic efficiency. PEG-capped ZnFe2O4 nanoparticles reveal a narrower band gap than uncapped ZnFe2O4, due to improved crystallinity and a decrease in surface defects. PEG-ZnFe2O4 produced via co-precipitation or hydrothermal methods shows band gap values in the range of 1.85–1.95 eV, exhibiting broader and more intense absorption, along with enhanced photocatalytic performance. The UV–VIS spectroscopy and the calculated band gap for ZnFe2O4 NPs and PEG-ZnFe2O4 NCs are shown in Figure 5.
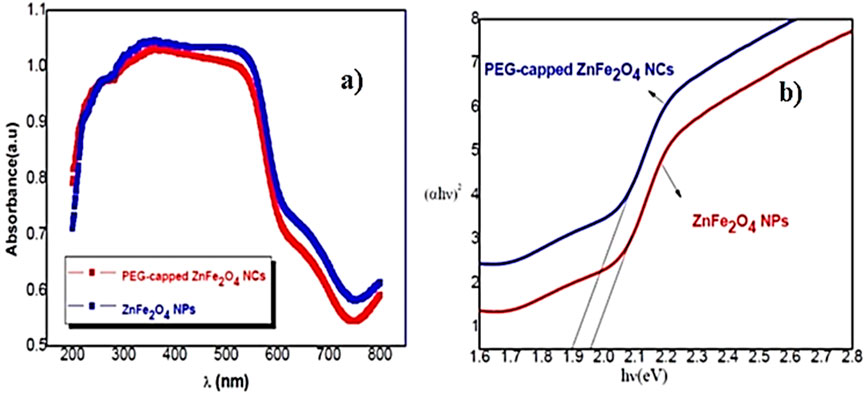
Figure 5. (a) UV–VIS spectroscopy and (b) the calculated band gap for ZnFe2O4 NPs and PEG-ZnFe2O4 NCs.
Method validation
Specificity
The analytical method was found to be specific. There was no interference observed at the retention time of the sethoxydim peak. The percentage difference in retention times of the test item and the reference standard was found to be within ±5.0%.
Linearity
The linearity of the method was established by injecting six different concentrations of the sethoxydim reference standard into HPLC-PDA and by plotting their respective standard concentrations (µg/mL) against the respective peak areas. The area of concentration results are presented in Table 1. The peak areas obtained from the different standard concentrations were used to calculate the linear regression equation, which is Y = 33,951.80X + 4.10, with a correlation coefficient of 0.9999. A calibration curve is shown in Figure 6.
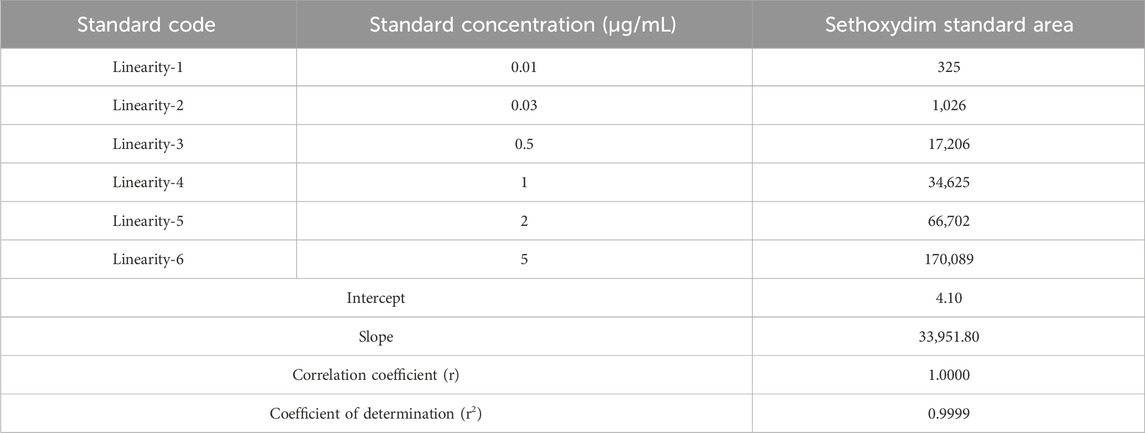
Table 1. Detector linearity test of sethoxydim.
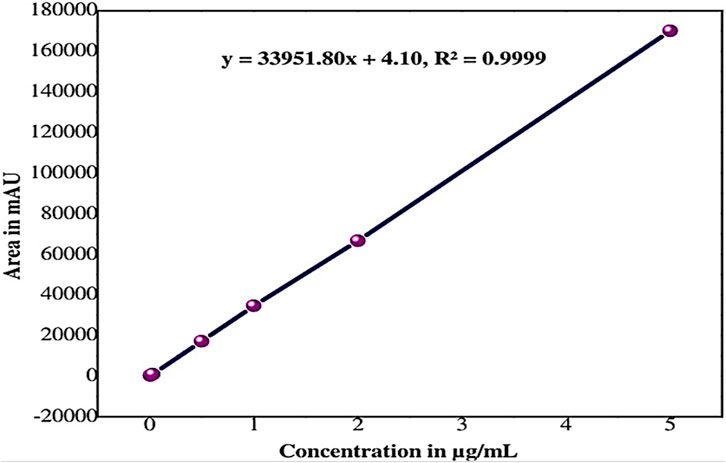
Figure 6. Linearity curve of the sethoxydim standard.
Recovery and repeatability
The recovery control samples (n = 2) at each of two fortification levels, equivalent to 0.03 μg/mL and 0.3 μg/mL for sethoxydim in pond water, were assayed using HPLC-PDA. The results are presented in Table 2. The representative chromatogram (LOQ X10 Level _ R1) was illustrated in Figure 7.
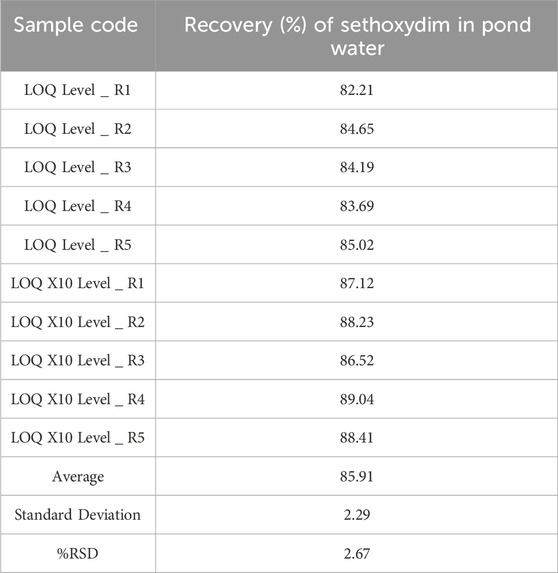
Table 2. Recovery and repeatability of sethoxydim in pond water at 0.03 μg/mL and 0.3 μg/mL.
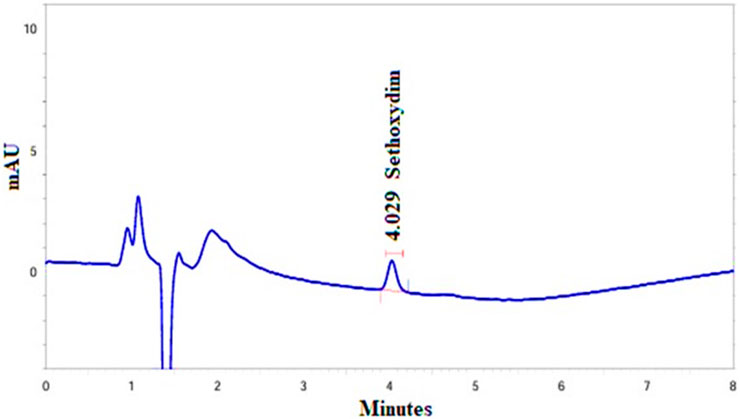
Figure 7. Representative chromatogram (LOQ X10 Level _ R1-0.3 μg/mL).
Limit of quantitation
The LOQ was established to be 0.03 μg/mL from the lower level recovery test in pond water.
Adsorption study (effect of adsorbent dosage)
Figure 8 illustrates that the efficiency of metal ion removal generally increases with an increase in the dosage of PEG-ZnFe2O4 NCs. The removal efficiency for sethoxydim increased (26.4%, 31.8%, 38.6%, and 45.2%) as the adsorbent dosage increased (50 mg, 100 mg, 150 mg, 250 mg) and then decreased to 42.1% at 500 mg. The mass of the adsorbent also increased in line with the removal efficiency. This can be explained by the increasing number of binding sites that are available with a greater amount of adsorbent. The highest adsorption of sethoxydim was found at an adsorbent dosage of 250 mg, which signifies the optimal dosage.
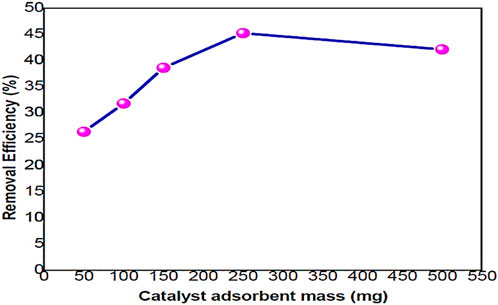
Figure 8. Effect of mass on adsorption efficiency for sethoxydim by PEG-ZnFe2O4 NCs.
Photolytic studies and photocatalytic studies
The half-life of sethoxydim was 4.80 days in pond water without the catalyst, as shown in Table 3 and Figure 9. In contrast, the half-life of sethoxydim in the presence of the catalyst in pond water was 8.42 h. The results are shown in Table 4 and Figure 10.
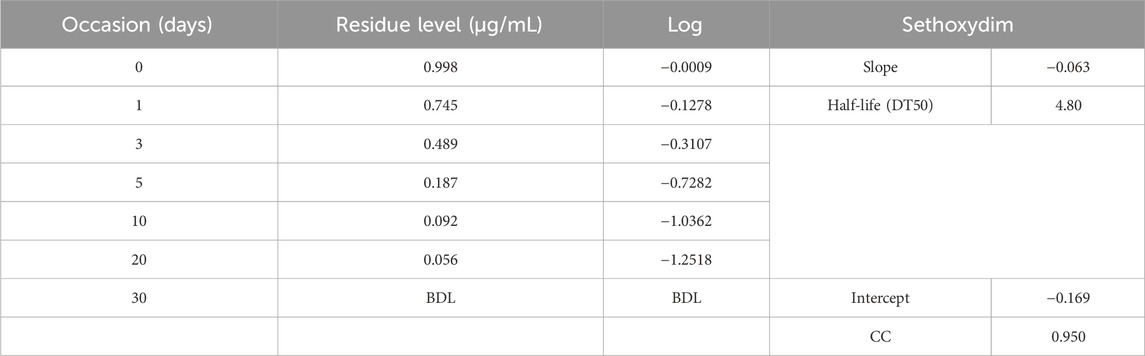
Table 3. Photolysis of sethoxydim under direct sunlight in pond water (without catalyst).
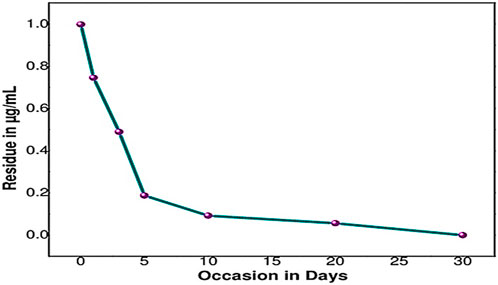
Figure 9. Photolysis curve of sethoxydim in the absence of PEG-ZnFe2O4 NCs in pond water (without catalyst).
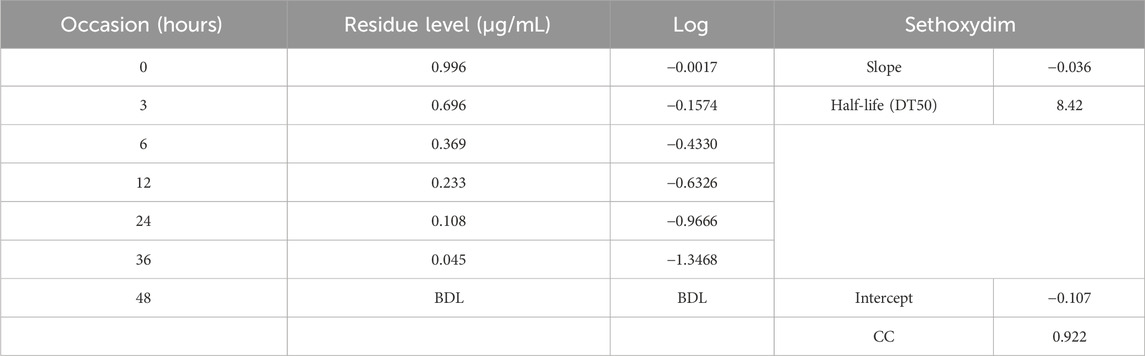
Table 4. Photocatalysis of sethoxydim in the presence of PEG-ZnFe2O4 NCs under direct sunlight in pond water.
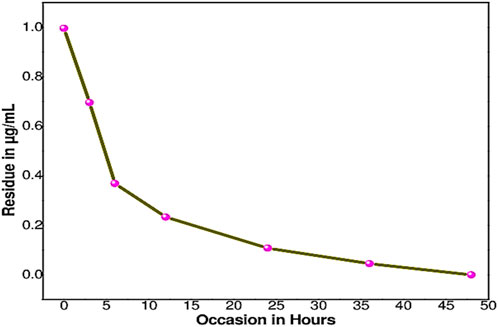
Figure 10. Photocatalysis curve of sethoxydim in the presence of PEG-ZnFe2O4 NCs in pond water (with catalyst).
Conclusions
This study presents a rapid and effective analytical approach employing HPLC-PDA to measure sethoxydim in residues across three different types of buffers. The mobile phase, which includes acetonitrile and 0.1% ortho-phosphoric acid, achieved commendable separation and resolution, with a notably short analysis time of approximately 8 min for each chromatographic run.
Validation parameters, encompassing linearity, recovery, precision, and LOQ, and DT50 values, were successfully established by adhering to the guidelines of the South African National Civic Organization (SANCO) and the Environmental Protection Agency (EPA). Thus, the proposed analytical method and dissipation data could be advantageous for routine monitoring, residue laboratories, and researchers in the assessment of sethoxydim in residues in various commodities such as crops, water, and soil samples. The investigation revealed that PEG-ZnFe2O4 NCs successfully remove sethoxydim residues, which pose a considerable environmental and public health risk, from water. The DT50 value, representing half-life, is crucial in environmental chemistry, and studies on photocatalysis show both effectiveness and fast dissipation times. This study proposes new applications for PEG-ZnFe2O4 NCs in environmental remediation and wastewater treatment.
Data availability statement
The original contributions presented in the study are included in the article/supplementary material; further inquiries can be directed to the corresponding authors.
Author contributions
KR: Validation, Writing – original draft. TR: Conceptualization, Methodology, Writing – original draft. YP: Supervision, Methodology, Writing – review and editing. PG: Funding acquisition, Resources, Writing – review and editing, Visualization.
Funding
The author(s) declare that financial support was received for the research and/or publication of this article. Open access funding provided by corresponding author Institute (Jožef Stefan Institute, Jamova 39, SI-1000 Ljubljana, Slovenia).
Acknowledgments
The authors gratefully acknowledge the Department of Chemistry at Mahatma Gandhi University, Nalgonda, Telangana - 508 254, which has been instrumental in the successful completion of this research work.
Conflict of interest
Author TR was employed by Isosphere Biosciences Pvt Ltd.
The remaining authors declare that the research was conducted in the absence of any commercial or financial relationships that could be construed as a potential conflict of interest.
Generative AI statement
The author(s) declare that no Generative AI was used in the creation of this manuscript.
Any alternative text (alt text) provided alongside figures in this article has been generated by Frontiers with the support of artificial intelligence and reasonable efforts have been made to ensure accuracy, including review by the authors wherever possible. If you identify any issues, please contact us.
Publisher’s note
All claims expressed in this article are solely those of the authors and do not necessarily represent those of their affiliated organizations, or those of the publisher, the editors and the reviewers. Any product that may be evaluated in this article, or claim that may be made by its manufacturer, is not guaranteed or endorsed by the publisher.
References
Aisida, S. O., Akpa, P. A., Ahmad, I., Maaza, M., Ezema, F. I., and Physica, B. (2019). Influence of PVA, PVP and PEG doping on the optical, structural, morphological and magnetic properties of zinc ferrite nanoparticles produced by thermal method. Phys. B Phys. Condens. Matter. 571, 130–136. doi:10.1016/j.physb.2019.07.001
Anastassiadou, M., Brancato, A., Cabrera, L. C., Ferreira, L., Greco, L., Jarrah, S., et al. (2019). Review of the existing maximum residue levels for clethodim according to Article 12 of regulation (EC) No 396/2005. EFSA J. 17, e05706. doi:10.2903/j.efsa.2019.5706
Arinzechukwu, C. E., Aisida, S. O., Agbogu, A., Ahmad, I., and Ezema, F. I. (2022). Polyethylene glycol capped nickel – zinc ferrite nanocomposites: structural, optical and magnetic properties suitable for hyperthermia applications. Appl. Phys. A 128, 1088. doi:10.1007/s00339-022-06248-8
Bajwa, U., and Sandhu, K. S. (2014). Effect of handling and processing on pesticide residues in food-a review. J. Food Sci. Technol. 51, 201–220. doi:10.1007/s13197-011-0499-5
Bhattacharjee, J., and Roy, S. (2024). A review on photocatalysis and nanocatalysts for advanced organic synthesis. Adv 6, 100268. doi:10.1016/j.hybadv.2024.100268
Boon, C., Yong, L., and Wahab, A. (2018). A review of ZnO nanoparticles as solar photocatalysts: Synthesis, mechanisms and applications. Renew. Sustain. Energy Rev. 81, 536–551. doi:10.1016/j.rser.2017.08.020
Bruckmann, F. S., Schnorr, C., Oviedo, L. R., Knani, S., Silva, L. F. O., Silva, W. L., et al. (2022). Adsorption and photocatalytic degradation of pesticides into nanocomposites: a review. Molecules 27, 6261. doi:10.3390/molecules27196261
Calvo, L., Carmen, L., Sevilla-mor, B., Alonso-Prados, J. L., and Sandín-España, P. (2017). Photodegradation behaviour of sethoxydim and its comercial formulation poast® under environmentally-relevant conditions in aqueous media. Study of photoproducts and their toxicity. Chemosphere 168, 501–507. doi:10.1016/j.chemosphere.2016.11.026
Chakravorty, A., and Roy, S. (2024). A review of photocatalysis, basic principles, processes, and materials. Sustain. Chem. Environ. 8, 100155. doi:10.1016/j.scenv.2024.100155
Chaturvedi, S., Dave, P. N., and Shah, N. (2012). Applications of nano-catalyst in new era. J. Saudi Chem. Soc. 16, 307–325. doi:10.1016/j.jscs.2011.01.015
Dabagh, S., Haris, S. A., and Ertas, Y. N. (2023). Engineered polyethylene glycol-coated zinc ferrite nanoparticles as a novel magnetic resonance imaging contrast agent. ACS Biomaterials Sci. and Eng. 9, 4138–4148. doi:10.1021/acsbiomaterials.3c00255
Daqa, W. M., Alshoaibi, A., Ahmed, F., and Rao, T. N. (2023). Potential applications of chitosan-coated zinc oxide nanoparticles for degrading pesticide residues in environmental soils. Crystals 13, 391. doi:10.3390/cryst13030391
Dehghani, M. H., Ahmadi, S., Ghosh, S., Shahnawaz Khan, M., Othmani, A., Ahmad Khanday, W., et al. (2024). Sustainable remediation technologies for removal of pesticides as organic micro-pollutants from water environments: a review. Appl. Surf. Sci. Adv. 19, 100558. doi:10.1016/j.apsadv.2023.100558
El-nahhal, I., and El-nahhal, Y. (2021). Pesticide residues in drinking water, their potential risk to human health and removal options. J. Environ. Manage. 299, 113611. doi:10.1016/j.jenvman.2021.113611
Hammouche, J., Gaidi, M., and Omari, S. C. M. (2021). Enhanced photocatalytic performance of zinc ferrite nanocomposites for degrading methylene blue: effect of nickel doping concentration. J. Inorg. Organomet. Polym. Mat. 31, 3496–3504. doi:10.1007/s10904-021-01960-z
Hassaan, M. A., El, M. A., and Marwa, N. (2023). Principles of photocatalysts and their different applications: a review. Springer International Publishing. doi:10.1007/s41061-023-00444-7
Kurian, M. (2021). Advanced oxidation processes and nanomaterials -a review. Clean. Eng. Technol. 2, 100090. doi:10.1016/j.clet.2021.100090
Lo, C., Sevilla-mora, B., Sandı, P., Mateo-miranda, M. M., and Alonso-Prados, J. L. (2016). Rapid photodegradation of clethodim and sethoxydim herbicides in soil and plant surface model systems. Arabian J. Chem. 9, 694–703. doi:10.1016/j.arabjc.2015.04.007
Lu, F., and Astruc, D. (2020). Nanocatalysts and other nanomaterials for water remediation from organic pollutants. Coord. Chem. Rev. 408, 213180. doi:10.1016/j.ccr.2020.213180
Marican, A., and Durán-lara, E. F. (2018). A review on pesticide removal through different processes. Environ. Sci. Pollut. Res. Int. 25, 2051–2064. doi:10.1007/s11356-017-0796-2
Mohan, H., Ramalingam, V., Adithan, A., Natesan, K., Seralathan, K., and Shin, T. (2021). Highly efficient visible light driven photocatalytic activity of zinc/ferrite: carbamazepine degradation, mechanism and toxicity assessment. J. Hazard. Mat. 416, 126209. doi:10.1016/j.jhazmat.2021.126209
Nageswara Rao, T., Botsa, P., and Manohra Naidu, T. (2019). Effect of pH, humic acid and moisture content on photo catalytic degradation of herbicides in loamy sand soiL. EQA – Int. Environ. Qual. 32, 15–28. doi:10.6092/issn.2281-4485/8243
Nageswara Rao, T., Prashanthi, Y., Ahmed, F., Kumar, S., Arshi, N., Rajasekhar Reddy, G., et al. (2021). Photocatalytic applications of Fe–Ag Co-Doped TiO2 nanoparticles in removal of flumioxazin pesticide residues in water. Front. Nanotechnol. 3, 652364–11. doi:10.3389/fnano.2021.652364
Nasrollahzadeh, M., Sajjadi, M., Iravani, S., and Varma, R. S. (2021). Green-synthesized nanocatalysts and nanomaterials for water treatment: current challenges and future perspectives. J. Hazard. Mat. 401, 123401. doi:10.1016/j.jhazmat.2020.123401
Ningthoujam, R., Disco, Y., Jayasekhar, P., and Tirkey, A. (2022). Nanocatalyst in remediating environmental pollutants. Chem. Phys. Impact 4, 100064. doi:10.1016/j.chphi.2022.100064
Prabakar, A. C., Killivalavan, G., Sivakumar, D., and Babu, K. C. (2021). Exploring structural, morphological, and magnetic properties of zinc nickel ferrites systems nanocomposites. Biointerface Res. Appl. Chem. 11, 7785–7793. doi:10.33263/BRIAC111.77857793
Punyasamudram, S., Reddy, P. P., Bathinapatla, A., Mulpuri, R., Kanchi, S., and Kumar, P. V. N. (2024). Multifunctional characteristics of biosynthesized CoFe2O4@Ag nanocomposite by photocatalytic, antibacterial and cytotoxic applications. Chemosphere 349, 140892. doi:10.1016/j.chemosphere.2023.140892
Rao, T. N., Krishnarao, N., Parameshwar, K., Murthy, S., and Apparao, K. (2016). Photolysis of chlorpyrifos in water under direct sunlight - identification of photo-transformation products by LC-MS-MS electro spray Tandem Mass spectrometry. Scholars Acad. J. Biosci. 4, 432–443. doi:10.36347/sajb.2016.v04i05.014
Saafan, S. A., Elghazawi, E., and Abo-Aita, N. (2021). Preparation and structural investigation of Polyethylene glycol (PEG)/nano-ferrite composites. Solids 43, 174–191. doi:10.21608/ejs.2021.98349.1022
Sabatier, P., and Prize, C. N. (2020). Introduction: nanoparticles in catalysis. Chem. Rev. 120, 461–463. doi:10.1021/acs.chemrev.8b00696
Saleh, I. A., Zouari, N., and Al-ghouti, M. A. (2020). Removal of pesticides from water and wastewater: Chemical, physical and biological treatment approaches. Environ. Technol. Innov. 19, 101026. doi:10.1016/j.eti.2020.101026
Sattar, A., Hashmi, Z., Adriyani, R., Yuniarto, A., Ali, S., Akhter, F., et al. (2021). Recent trends and future challenges of pesticide removal techniques – a comprehensive review. J. Environ. Chem. Eng. 9, 105571. doi:10.1016/j.jece.2021.105571
Series, C. Studies on the synthesis and photocatalytic properties of zinc ferrite materials studies on the synthesis and photocatalytic properties of zinc ferrite materials. J. Phys. Conf. Ser. doi:10.1088/1742-6596/1676/1/012056
Sevilla-Morán, B., Mateo-Miranda, M. M., Alonso-Prados, J. L., García-Baudín, J. M., and Sandín-España, P. (2010). Sunlight transformation of sethoxydim-lithium in natural waters and effect of humic acids. Int. J. Environ. Anal. Chem. 90, 487–496. doi:10.1080/03067310903199500
Sevilla-morán, B., López-goti, C., Alonso-prados, J. L., and Sandín-españa, P. (2014). Aqueous photodegradation of sethoxydim herbicide: qtof elucidation of its by-products, mechanism and degradation pathway. Sci. Total Environ. 472, 842–850. doi:10.1016/j.scitotenv.2013.11.065
Singh, M., and Yadav, E. (2024). Role of nanomaterials in pesticide remediation: an overview. Biochem. Cell. Arch. 24, 1460–1464. doi:10.51470/bca.2024.24.2.1459
Soc, J. I. C., Bhole, D. K., Puri, R. G., Meshram, P. D., and Sirsam, R. S. (2020). Photocatalytic degradation of methyl orange using doped ZnO nanocatalyst. J. Indian Chem. Soc. 97, 440–445.
Sousa, J. da S., Oliveira do Nascimento, H., Gomes, H. de O., and Ferreira do Nascimento, R. (2021). Pesticide residues in groundwater and surface water: recent advances in solid-phase extraction and solid-phase microextraction sample preparation methods for multiclass analysis by gas chromatography-mass spectrometry. Microchem. J. 168, 106359. doi:10.1016/j.microc.2021.106359
Taghizade Firozjaee, T., Mehrdadi, N., Baghdadi, M., and Nabi Bidhendi, G. R. (2018). Application of nanotechnology in pesticides removal from aqueous solutions - a review. Int. J. Nanosci. Nanotechnol. 14, 43–56.
Yang, M., and Wang, L. (2008). Advances in techniques on analysis and removal of pesticide residues in traditional Chinese herbal medicines. World Sci. Technol. 10, 107–112. doi:10.1016/S1876-3553(09)60005-3
Zhao, B., Wang, Y., Yao, X., Chen, D., Fan, M., Jin, Z., et al. (2021). Cancer therapy using nanocatalyst. Nat. Commun., 1–11. doi:10.1038/s41467-021-21618-1
Keywords: polyethene glycol-zinc ferrite nanocomposites, catalytic activity, sethoxydim, DT50, X-ray diffraction, scanning electron microscopy, transmission electron microscopy
Citation: Ramaraju K, Rao TN, Prashanthi Y and Ganji P (2025) Photolytic and photocatalytic activity of polyethylene glycol-capped zinc ferrite nanocomposites for the removal of sethoxydim herbicide residues in pond water. Front. Environ. Chem. 6:1673525. doi: 10.3389/fenvc.2025.1673525
Received: 26 July 2025; Accepted: 29 September 2025;
Published: 28 October 2025.
Edited by:
Javed Ali Khan, Abdul Wali Khan University Mardan, PakistanReviewed by:
Muhammad Ateeq, Abdul Wali Khan University Mardan, PakistanVenkata Nagendra Kumar Putta, Gandhi Institute of Technology and Management (GITAM) Hyderabad, India
Lina A. Calzada, Instituto Politecnico Nacional, Mexico
Copyright © 2025 Ramaraju, Rao, Prashanthi and Ganji. This is an open-access article distributed under the terms of the Creative Commons Attribution License (CC BY). The use, distribution or reproduction in other forums is permitted, provided the original author(s) and the copyright owner(s) are credited and that the original publication in this journal is cited, in accordance with accepted academic practice. No use, distribution or reproduction is permitted which does not comply with these terms.
*Correspondence: Y. Prashanthi, ZHJ5cHJhc2FudGhpQGdtYWlsLmNvbQ==; Parameswaram Ganji, cGFyYW1lc3dhcmFtLmdhbmppQGlqcy5zaQ==
†These authors have contributed equally to this work