 Toshio Mori1,2Saaya Takahashi1Ayumi Soga1Misa Arimoto1Rintaro Kishikawa1Yuhei Yama1
 Hideo Dohra2,3,4,5
 Hirokazu Kawagishi1,2
 Hirofumi Hirai1,2,4*
- 1Faculty of Agriculture, Shizuoka University, Shizuoka, Japan
- 2Research Institute for Mushroom Science, Shizuoka University, Shizuoka, Japan
- 3Faculty of Science, Shizuoka University, Shizuoka, Japan
- 4Research Institute of Green Science and Technology, Shizuoka University, Shizuoka, Japan
- 5Graduate School of Science and Technology, Shizuoka University, Shizuoka, Japan
Biohydrogen is mainly produced by anaerobic bacteria, anaerobic fungi, and algae under anaerobic conditions. In higher eukaryotes, it is thought that molecular hydrogen (H2) functions as a signaling molecule for physiological processes such as stress responses. Here, it is demonstrated that white-rot fungi produce H2 during wood decay. The white-rot fungus Trametes versicolor produces H2 from wood under aerobic conditions, and H2 production is completely suppressed under hypoxic conditions. Additionally, oxalate and formate supplementation of the wood culture increased the level of H2 evolution. RNA-seq analyses revealed that T. versicolor oxalate production from the TCA/glyoxylate cycle was down-regulated, and conversely, genes encoding oxalate and formate metabolism enzymes were up-regulated. Although the involvement in H2 production of a gene annotated as an iron hydrogenase was uncertain, the results of organic acid supplementation, gene expression, and self-recombination experiments strongly suggest that formate metabolism plays a role in the mechanism of H2 production by this fungus. It is expected that this novel finding of aerobic H2 production from wood biomass by a white-rot fungus will open new fields in biohydrogen research.
1 Introduction
Hydrogen gas is considered a potential sustainable energy carrier due to its advantages of high energy density, zero emissions when burning, and ease of production from various renewable sources. H2 can be produced from biomass materials via both thermochemical and biological processes. Photo- and dark fermentation are biological conversion processes by which organic substrates and/or biomass materials can be used to produce H2 by a diverse group of microorganisms. In dark fermentation, carbohydrates in the biomass are broken anaerobically to H2, CO2, and organic acids by hydrogen-producing anaerobes (Ghimire et al., 2015). Some anaerobic bacteria, such as those of the genera Escherichia and Clostridium, can produce H2 from organic acids (Mnatsakanyan et al., 2004; Matsumoto and Nishimura, 2007). Photo-fermentation of organic substrates is performed by photosynthetic bacteria. These bacteria utilize small organic acids to produce H2 under anaerobic conditions in the presence of light (Azwar et al., 2014). Various anaerobic eukaryotes are also able to produce H2 in hydrogenosomes. The anaerobic fungi Neocallimastix and Piromyces spp. are well-known H2 producers (Hackstein et al., 1999). These enteric fungi hydrolyze carbohydrates, and the resulting sugars are metabolized to pyruvate via glycolysis or to malate via the tricarboxylic acid (TCA) cycle (Hess et al., 2020). Hydrogenosomes metabolize pyruvate and malate to acetate for ATP generation, and H2 and CO2 are also generated by the combined ATP generation reaction (Marvin-Sikkema et al., 1993; Hackstein et al., 1999). Organic acids often function as important factors in the H2 production process in anaerobes.
Although hydrogenase-like (or NARF; nuclear prelamin A recognition factor, NAR1; cytosolic Fe-S cluster assembly factor) genes are widely distributed in the genomes of higher eukaryotes, their function and role remain unknown (Horner et al., 2002). It is generally thought that animal cells are unable to generate H2, but it is also known that molecular hydrogen has diverse biological effects in animals, including anti-oxidative stress, anti-inflammatory, and anti-allergic effects (Ohta, 2012). Higher plants are also affected by H2, as it improves tolerance to various abiotic stresses, including oxidative, salt, and desiccation stress (Li et al., 2018). Additionally, it is thought that H2 improves physiological processes such as growth and development in higher plants and interacts other signaling molecules. Some early studies demonstrated hydrogenase-mediated H2 production in seedlings of some higher plants under sterile conditions (Renwick et al., 1964; Torres et al., 1986). Some recent reports indicated that plant hormones and abiotic stresses promote endogenous H2 release in higher plants and that H2 signaling induces plant antioxidant defenses and enhances salt tolerance (Xie et al., 2012; Zeng et al., 2013). Although details of the H2 production and H2 signaling pathways remain unclear, molecular H2 seems to play a very important role in stress responses in higher eukaryotes.
White-rot fungi are unique microorganisms that are capable of degrading all main wood components, cellulose, hemicellulose, and lignin. During lignin degradation, white-rot fungi produce various reactive oxygen species (ROS) and radicals, such as radical mediators (Dashtban et al., 2010). White-rot fungi also produce oxalate to release and mineralize excessive carbon in order to grow on woody materials that have an extremely high C/N ratio (Shimada et al., 1994). Based on these data, the authors predicted that white-rot fungi, which are always exposed to oxidative stress during wood decay and have excellent ability to metabolize organic acids, can produce H2 in conjunction with organic acid metabolism to enhance oxidative stress tolerance. In this study, it was evaluated the H2 production ability of various white-rot fungi during wood decay and investigated the underlying production mechanism.
2 Materials and methods
2.1 Fungal strains
White-rot fungi, Pleurotus ostreatus NBRC 33211, NBRC 104981, Trametes hirsuta NBRC 104984, NBRC 106840, and Trametes versicolor NBRC 104985, NBRC 106839 were obtained from the National Institute of Technology and Evaluation, Japan. Phanerochaete chrysosporium ME-446 (ATCC 34541) and Phanerochaete sordida YK-624 (ATCC 90872) were obtained from the American Type Culture Collection, USA. Ceriporia lacerata K-70 (accession number [AN] of internal transcribed sequence [ITS]: LC312413), Phanerochaete sp. K-64 (AN-ITS: LC710144), K-91 (AN-ITS: LC710143), K-97-2 (AN-ITS: LC710142), M-4 (AN-ITS: LC710145), Schizophyllum commune M-21 (AN-ITS: LC710146), T. hirsuta M-9 (AN-ITS: LC710150), T. versicolor K-39 (AN-ITS: LC710147), K-41 (AN-ITS: LC312415), K-86 (AN-ITS: LC710148), M-24 (AN-ITS: LC710149) and unidentified K-89 were isolated from naturally decaying wood samples and identified based on their ITS, following a previous report (Mori et al., 2018).
2.2 Test of H2 evolution from wood meal
All fungal strains were grown on PDA at 30°C. Two mycelial discs (10 mm diameter) were punched from the edge of the mycelia and placed into a 70-mL serum vial containing 0.5 g of extractive-free beech or cedar wood meal (80-100 mesh, moisture content: 80%). After 5 days of pre-incubation at 30°C under atmospheric pressure, the inoculated vial was sealed with a butyl rubber plug to limit the O2 supply and prevent H2 diffusion. The sealed vial was incubated for 14 days at 30°C, and then the headspace gas was sampled, and H2 production was analyzed by gas chromatography on an instrument equipped with a thermal conductivity detector (GC-TCD), as previously reported (Mori et al., 2016).
2.3 Characterization of H2 production activity of T versicolor K-41
To elucidate the relationship between O2 and H2 production by T. versicolor K-41, the experiments described below were performed. First, 5-day pre-cultures of T. versicolor K-41 on 0.5 g of cedar wood meal (80-100 mesh, moisture content: 80%) in serum vials were incubated stationary at 30°C after sealing with a butyl rubber septum, and the flask headspace gas was analyzed by GC-TCD every 3 days. After 15 days of incubation, the headspace gas was flushed with 10 mL of pure O2 or N2, and then incubation and headspace analysis were continued. To clarify the effect of oxygen concentration on H2 production by T. versicolor K-41, H2 production experiments under different O2 concentration conditions were performed. Sealed cedar wood cultures of T. versicolor K-41 were prepared as described above. The O2 concentrations in vials headspace were adjusted to approximately 2.5%, 6.3%, 12.5%, 25% and 50% by O2 flush, following replacing the headspace gas with pure N2 gas. After 14 days incubation at 30°C, the headspace gas was analyzed.
Two types of cedar wood meal cultures were prepared (0.5 g of cedar wood meal in a 70-mL serum vial). For the first cultures, 0-1.0% (g/g) CaCO3 was mixed thoroughly with cedar wood meal, and then water was added to adjust the moisture content to 80% before autoclaving. Two PDA discs of T. versicolor K-41 were inoculated on the cedar wood meal and then pre-incubated for 5 days at 30°C. After an additional 9 days of incubation with sealing, the headspace gas was analyzed. For the second culture, two PDA discs of T. versicolor K-41 were inoculated on wood meal medium without CaCO3 and pre-incubated for 5 days at 30°C. Then, 200 µL of 15 mM (or 0-120 mM) organic acid salt solution (pH 4.5, sodium acetate, formate or oxalate) or water was added to 5 places (40 µL each) in the wood cultures. The vials were then sealed and incubated for an additional 14 days at 30°C, followed by headspace gas analysis.
Two PDA discs of T. versicolor K-41 were inoculated in 5 mL of T-medium (2 g/L glucose, 1 g/L yeast extract, 1 g/L KH2PO4, 0.2 g/L [NH4]2SO4, and 0.5 g/L MgSO4·7H2O [pH 4.5]) with or without 0.1% CaCO3 in 70-mL serum vials and pre-incubated for 5 days. After 9 days of incubation with sealing, the headspace gas was analyzed in the same manner described above.
2.4 RNA-seq analysis
Cedar wood medium was used for H2 production, and T-medium was used as a non–H2-producing medium. Trametes versicolor K-41 was incubated aerobically for 10 days on cedar wood medium, and total RNA was extracted from 200 mg (wet) of culture by bead beating in 0.7 mL of Plant RNA Purification Reagent (Invitrogen). The RNA was then purified using an RNeasy Plant Mini kit (Qiagen) plus an RNase-free DNase set (Qiagen) following the manufacturer’s protocol. Total RNA was cleaned and concentrated using NucleoSpin RNA Clean-up XS (TaKaRa Bio Inc.) following the manufacturer’s protocol. Under non–H2-producing conditions, 10 mycelial discs were inoculated on 50 mL of T-medium and incubated for 7 days, and total RNA was extracted as described above. RNA quality was assessed by agarose gel electrophoresis and determination of the OD260/OD280 ratio.
For RNA-seq analysis, library construction and sequencing were entrusted to Macrogen-Japan Co. The libraries were constructed using a TruSeq Stranded mRNA Library prep kit (Illumina Inc.) according to the manufacturer’s protocol. Transcriptome sequencing of paired-end reads (150 bp) was performed using a NovaSeq 6000 system (Illumina). The raw reads (DRR374972-75) were cleaned using Trimomatic v. 0.38 to remove adapter sequences and low-quality bases (quality scores <30) and reads shorter than 100 nt (Bolger et al., 2014). Resultant high-quality paired-end reads were aligned to the T. versicolor FP-101664 SS1 genome sequence (GCF_000271585.1) using HISAT2 v. 2.1.0 (Kim et al., 2015). Transcript abundance was estimated using FeatureCounts v. 2.0.0 (Liao et al., 2014). Differentially expressed genes (DEGs) were identified using the likelihood-ratio test implemented in the edgeR package v. 3.16.4 (Robinson et al., 2010). DEGs were defined by a log2 fold-change (logFC) >1 and logFC <−1 with a false discovery rate (FDR) <0.05. To identify significantly over- and under-represented biological features associated with H2 production, gene ontology (GO) enrichment analysis was performed by parametric analysis of gene set enrichment (Kim and Volsky, 2005) based on the logFC between the H2-producing and non–H2-producing conditions.
2.5 Effects of O2 level and CaCO3 on expression of Tvhyd and Tvfdh
Trametes versicolor K-41 was pre-incubated for 5-day on cedar wood meal culture with or without 0.5% CaCO3, as described above. After sealing all cultures following removal of PDA pellets, the cultures (without CaCO3) were divided into three groups: O2 purge (O2 concentration fitted to average 80%), N2 purge (O2 concentration <0.5%), and control (without gas purge). After 7 days of incubation, the headspace gas was analyzed, and total RNA was extracted from 200 mg (wet) of culture. Total RNA (100 ng) was employed for cDNA synthesis using PrimeScript II reverse transcriptase (TaKaRa Bio). Quantitative PCR was performed on a Lightcycler 96 (Roche) system using TB Green Premix Ex Taq II (Tli RNaseH Plus, TaKaRa Bio Inc.). Gene-specific primers for the hydrogenase-like gene (AN: LC710151, Tvhyd; 5’-cgcaaatagcacatcgaccg-3’/5’-gacgtgatacacccactgca-3’), formate dehydrogenase (AN: LC710153, Tvfdh; 5’-tactccgccggaatgaagattgt-3’/5’-aactcatggccctgctcctc-3’), and glyceraldehyde-3-phosphate dehydrogenase (AN: LC710152, Tvgpd; 5’-cgctgtgaacgaccccttca-3’/5’-cttgccgtccttgacctcga-3’) were designed. Expression levels were calculated according to the ΔΔCq method using Tvgpd as the reference gene. Relative H2 production and expression were calculated by comparison to values of the control.
2.6 Tvfdh expression in Escherichia coli
Tvfdh cDNA was amplified to attached KpnI and BamHI sites by PCR using primers (5’-actggtaccatgctcgccggcatctcgtc-3’ and 5’-ataggatcctcacttgcgctggccgtacg-3’), then amplified PCR product was ligated between the corresponding restriction sites of pCold I vector (TaKaRa Bio). Constructed vector was transformed into Chaperone Competent Cells pGro7/BL21 (TaKaRa Bio) following manufacture’s protocol. The transformed E. coli was incubated in 3 mL of LB medium containing 0.5 mg/mL arabinose, 20 µg/mL chloramphenicol and 50 µg/mL ampicillin, at 37 °C, 200 rpm. After OD600 was reached at 0.4, the culture was cooled to 4 °C, then 1.0 mM ATP and 0.1 mM isopropyl-β-D-thiogalactopyranoside (IPTG) were added. The culture was incubated for 15 h, at 15 °C, and bacterial cells were recovered by centrifugation (10,000 × g, 10 min, 4 °C). Recovered cells were disrupted by bead beating (Micro smash MS-100, Tomy Seiko Co., LTD.), and cell-free extract recovered by addition of 0.1 M NaCl containing 0.1 M Tris-HCl (pH 4.5) was used for FDH activity test. FDH activity was determined by increase in absorbance at 340 nm due to formation of nicotinamide adenine dinucleotide (NADH) in the reaction mixture (0.75 mL) contained 75 mM potassium phosphate (pH 6.5), 160 µM β-NAD+, 20 mM sodium formate and 100 µL cell-free extract (Watanabe et al., 2005).
2.7 Construction of pHygr and pTvfdh
Restriction sites were attached to Tvgpd terminator region by 2 step of PCR reactions, using primers (5’-ggcgcgccagatctgttagcacggagta-3’/5’- gtagattctgtttggtgtgcac-3’) for first PCR and (5’-tctagaggatccggcgcgccagatct-3’/5’- gtagattctgtttggtgtgcac-3’) for second PCR. The PCR product was TA-cloned into pMD20 vector (TaKaRa Bio), and the resulting plasmid was digested at NdeI site. Tagged sequence for In-fusion reaction was attached to Tvgpd promoter region by PCR using following primers; 5’-gatctactagtcatactgagatgacctccatagc-3’ and 5’-ctctagaaatccatagtggatgtggtggatgg-3’. The tagged Tvgpd promoter was direct cloned into the NedI digested plasmid by In-fusion reaction using In-fusion HD cloning kit (TaKaRa Bio) following manufacture’s protocol. The constructed plasmid that having AscI and BglII sites between Tvgpd promoter and terminator regions was designated pTvgpd-pro/ter.
Hygromycin resistant gene (hygr) sequence then was redesigned based on P. chrysosporium high-frequency codon usage, and the resulting optimized gene was synthesized by GeneScript Japan, Inc. The AscI and BglII restriction sites were attached to hygr using primers; ggcgcgccatgaagaagcccgagc and agatctttactccttggcgcgt. pTvgpd-pro/ter was digested by AscI and BglII. Then the PCR product was ligated into corresponding restriction enzyme sites of pTvgpd-pro/ter (pHygr). Tvfdh gene was PCR amplified (primers: 5’-agaggatccggcgcgatgctcgccggcatctcgtc-3’/5’-aacagatctggcgcgtcacttgcgctggccgtacg-3’). The resulting product was used for In-fusion reaction to clone into AscI digested pTvgpd-pro/ter to construct plasmid Tvfdh is under control of Tvgpd promoter (pTvfdh hereafter).
2.8 Homologous recombination of Tvfdh
T. versicolor K-41 protoplasts were prepared following method in previous report with some modification. Briefly, T. versicolor K-41 was precultured in liquid CYM medium at 30 °C for 7 days. The culture including mycelium was homogenized and 25 ml homogenate was added to 25 mL fresh CYM medium in 500-ml Erlenmeyer flask. The culture was incubated at 30 °C for 3 days, then mycelium was recovered by filtration. Mycelium was resuspended in 0.5M MgOsm (0.5 M MgSO4·7H2O in 10 mM 2-morpholinoethanesulfonic acid (MES), pH 6.1), following addition of 2 volume of 0.5M MgOsm containing with 5% lysing enzyme (Sigma-Aldrich) and cellulase Onozuka RS (Yakult Pharmaceutical Ind. Co., LTD.). The mixture was incubated at 30 °C, 150 rpm for 16 h. After the reaction, MgSO4 concentration in the solution was adjusted 1.0 M by gently addition of 2.0 M MgOsm. The crude protoplasts solution was layered onto 10 mM MES contained 1.0M sorbitol (SorbOsm), and centrifuged (1,450 × g, 15 min, 4 °C) to removed undigested mycelial debris. Protoplasts accumulated on interface were recovered and washed 2 times with SorbOsm. Finally, protoplasts were resuspended in SorbOsm to fit 0.5 to 0.8 × 10⁸ cells/mL.
Protoplasts were co-transformed with pHygr and pTvfdh. Plasmids (10 µg each) and 40 mM CaCl2 in 300 µL SorbOsm was combined with 500 µL of protoplasts solution. The mixture was incubated for 30 min at 4 °C, and then gently mixed with equal volume of PEG solution (40% PEG #4000, 10 mM CaCl2 in Tris-HCl, pH 7.0). After additional 30 min incubation at 4 °C, the diluted transformation solution with 5mL SorbOsm was mixed with 75 mL of regeneration medium (0.75 M sucrose, 10 mM MES, 0.5% agarose L03 (TaKaRa Bio), 50 µg/mL ampicillin, 20 µg/mL thiabendazole in CYM medium, pH 6.5) at 42 °C, and poured 10 Petri dishes (9 cm diameter). The dishes were incubated at 30 °C for 2 days, 7.5 mL of regeneration medium containing 40 µg/mL hygromycin instead of thiabendazole was overlaid to each dish. Regenerated hyphal clones that appeared in 7 days incubation were picked and subcultured in 20 µg/mL hygromycin containing PDA medium. Genome PCR of regenerated clones were done with specific primers of Tvfdh ORF and Tvgpd terminator sequences (5’- gagctgctcaagagcttcaag -3’/5’-ggtttcgtttgtggcagagatg-3’), and PCR-positive clones were designated as F1-F38 strains. These transformed strains were employed to experiments, H2 production from cedar and effect of supplementation of organic acids to H2 production.
3 Results
3.1 H2 generation from wood by wood-rot fungi
To investigate the H2-production activity of wood-rot fungi, 12 strains of wood-rot fungi (K and M strains) isolated from naturally decaying wood were inoculated on beech wood meal. During limited O2 supply incubation following aerobic cultivation, a small but clear H2 peak was observed on GC-TCD analysis of the headspace gas of several beech wood meal cultures (Figure 1). H2 was produced by 8 of 12 tested strains, and classification of those strains was attempted based on the ITS sequences. All 8 strains were found to belong to the Polyporales (1 Ceriporia strain, 3 Phanerochaete strains, and 4 Trametes strains). Therefore, 4 newly described Trametes fungi (2 strains each of T. versicolor and T. hirsuta) and 2 Phanerochaete fungi (P. chrysosporium and P. sordida) were tested in the same way. In addition, an Agaricales fungus (P. ostreatus) was also tested as a comparison. Although some strains of Polyporales fungi did not show H2 production, all strains showing H2 production belonged to the Polyporales. There were differences in the amount of H2 produced from beech wood meal among strains of same species.
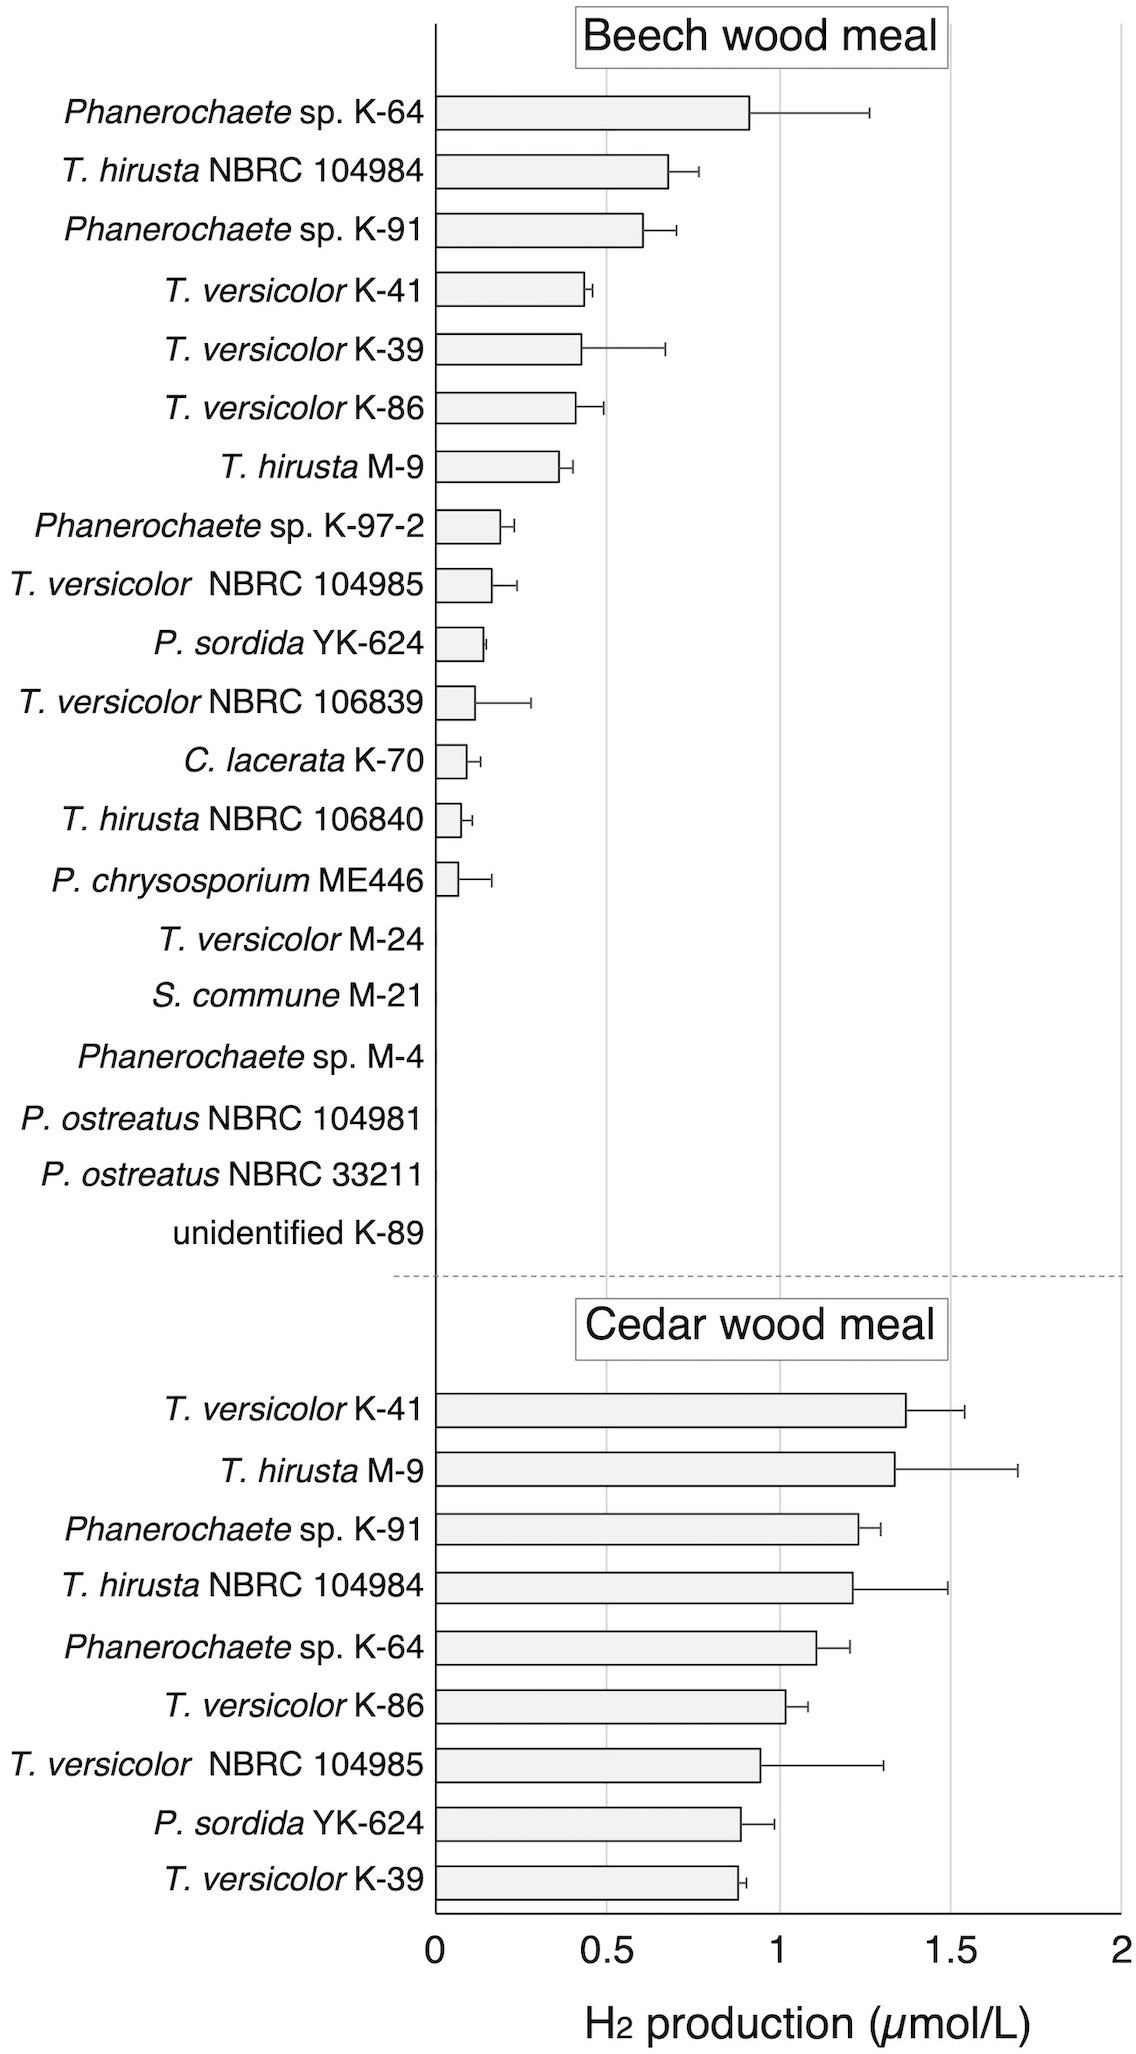
Figure 1 H2 production in beech and cedar wood meal cultures inoculated with white-rot fungi during 14 day incubation with sealing. Values are means ± standard deviation (n=3).
Nine of the 14 H2-producing strains were then investigated for H2 production on cedar wood meal. All tested strains produced H2 from cedar in amounts greater than produced from beech. Because T. versicolor K-41 showed the highest H2 production level (1.36 µmol/L in headspace gas) in cedar wood meal culture (Figure 1), elucidation of H2 production mechanism of this fungus was attempted.
3.2 Characterization of H2 production activity of T versicolor K-41
Time courses of O2 consumption and H2 production by cultures of T. versicolor K-41 on cedar wood meal during cultivation after sealing were traced and shown in Figure 2. The O2 concentration in the headspace began to decrease immediately after sealing (Figure 2A). The concentration fell 2.9% by day 12, and thereafter, little O2 was consumed. By comparison, H2 production was observed at day 3, and production continued until 12 days of incubation. After termination of H2 production after 15 days, part of the headspace was replaced with pure O2 or N2 gas. Although no effect on H2 production was observed following replacement with N2, H2 production re-started following O2 replacement (Figure 2B). However, H2 production stopped again after the O2 was consumed. Effect initial O2 concentration on H2 production is shown in Figure 2C. The result indicated that higher initial O2 consumption and H2 production were well correlated with initial O2 concentration (R2 = 0.983 and 0.863, respectively).
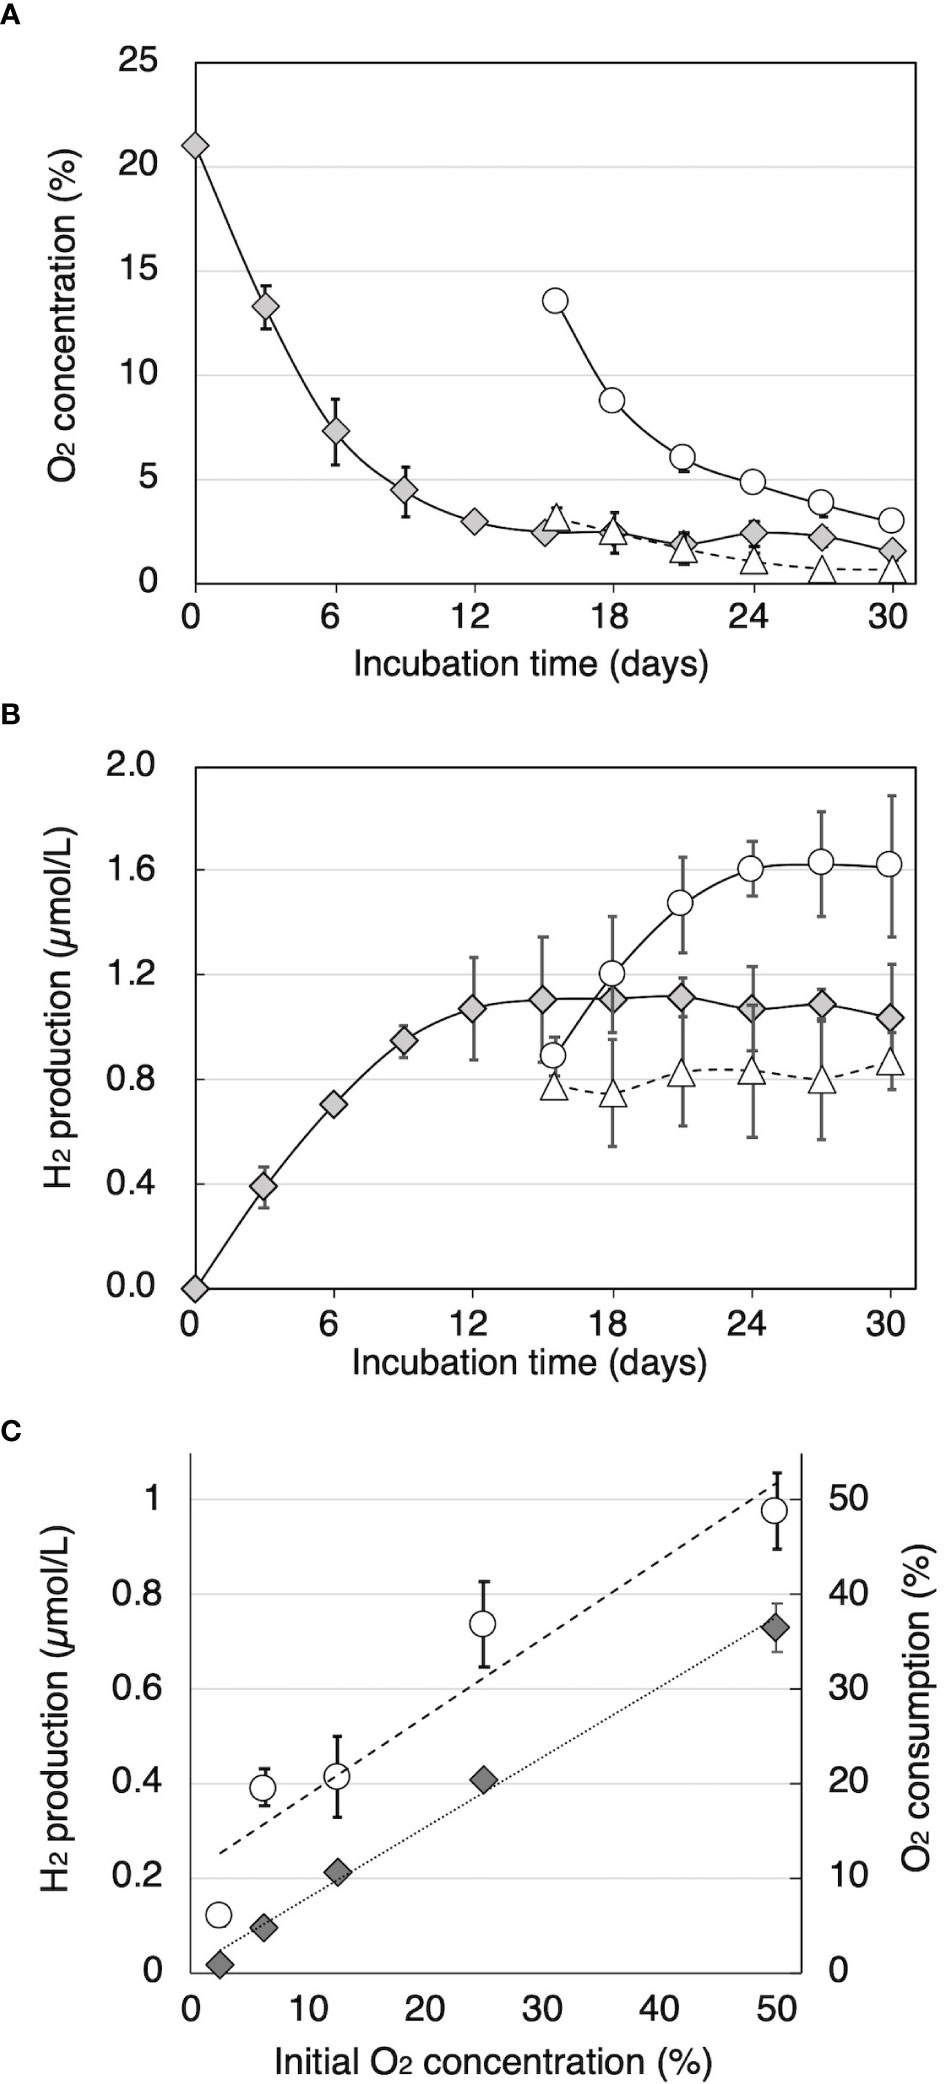
Figure 2 The relationship between O2 concentration and H2 production in sealed cedar wood meal cultures of T. versicolor K-41. Time courses of (A) O2 concentration and (B) H2 concentration in the headspace gas were monitored in sealed cultures (gray diamonds) and cultures flushed with 10 mL of O2 or N2 (black circles and white circles, respectively). (C) O2 consumption (black diamonds) and H2 production (white circles) were measured after 2-week incubation with O2 and N2 adjusted to the specified oxygen concentration. The values are the mean ± standard deviation (n=3).
To investigate the relationship between H2 production and organic acid production during wood decay by T. versicolor K-41, H2 production from cedar wood meal containing 0-1.0% CaCO3 was investigated. It is well known that CaCO3 promotes the production of oxalate and other organic acids generated in the TCA/glyoxylate cycles of basidiomycetes (Takao, 1965). As shown in Figure 3A, T. versicolor K-41 showed significantly higher H2 evolution in cedar meal containing 0.3 and 0.5% CaCO3 than in culture without CaCO3; in particular, 1.5 times higher H2 production was observed in the culture containing 0.5% CaCO3. Therefore, to clarify involvement of organic acids, oxalate, formate, and acetate were added to 5-day-old cedar wood cultures of T. versicolor K-41 just before sealing, and H2 production was then measured. While no difference was observed in H2 production between the control and water- or acetate-supplemented cultures, oxalate and formate supplementation increased H2 production to 120% and 127% compared with the control (Figure 3B). H2 production increased depending on the level of formate supplementation, reaching a plateau at 6 µmol/flask (Figure 3C). In contrast, no H2 evolution was observed regardless of CaCO3 addition in T-medium, even though the oxalate and formate concentrations in the medium were increased by CaCO3 addition (Table 1). Thus, H2 production by T. versicolor K-41 may be a specific phenomenon during wood decay and may be related to the metabolism of organic acids, especially formate.
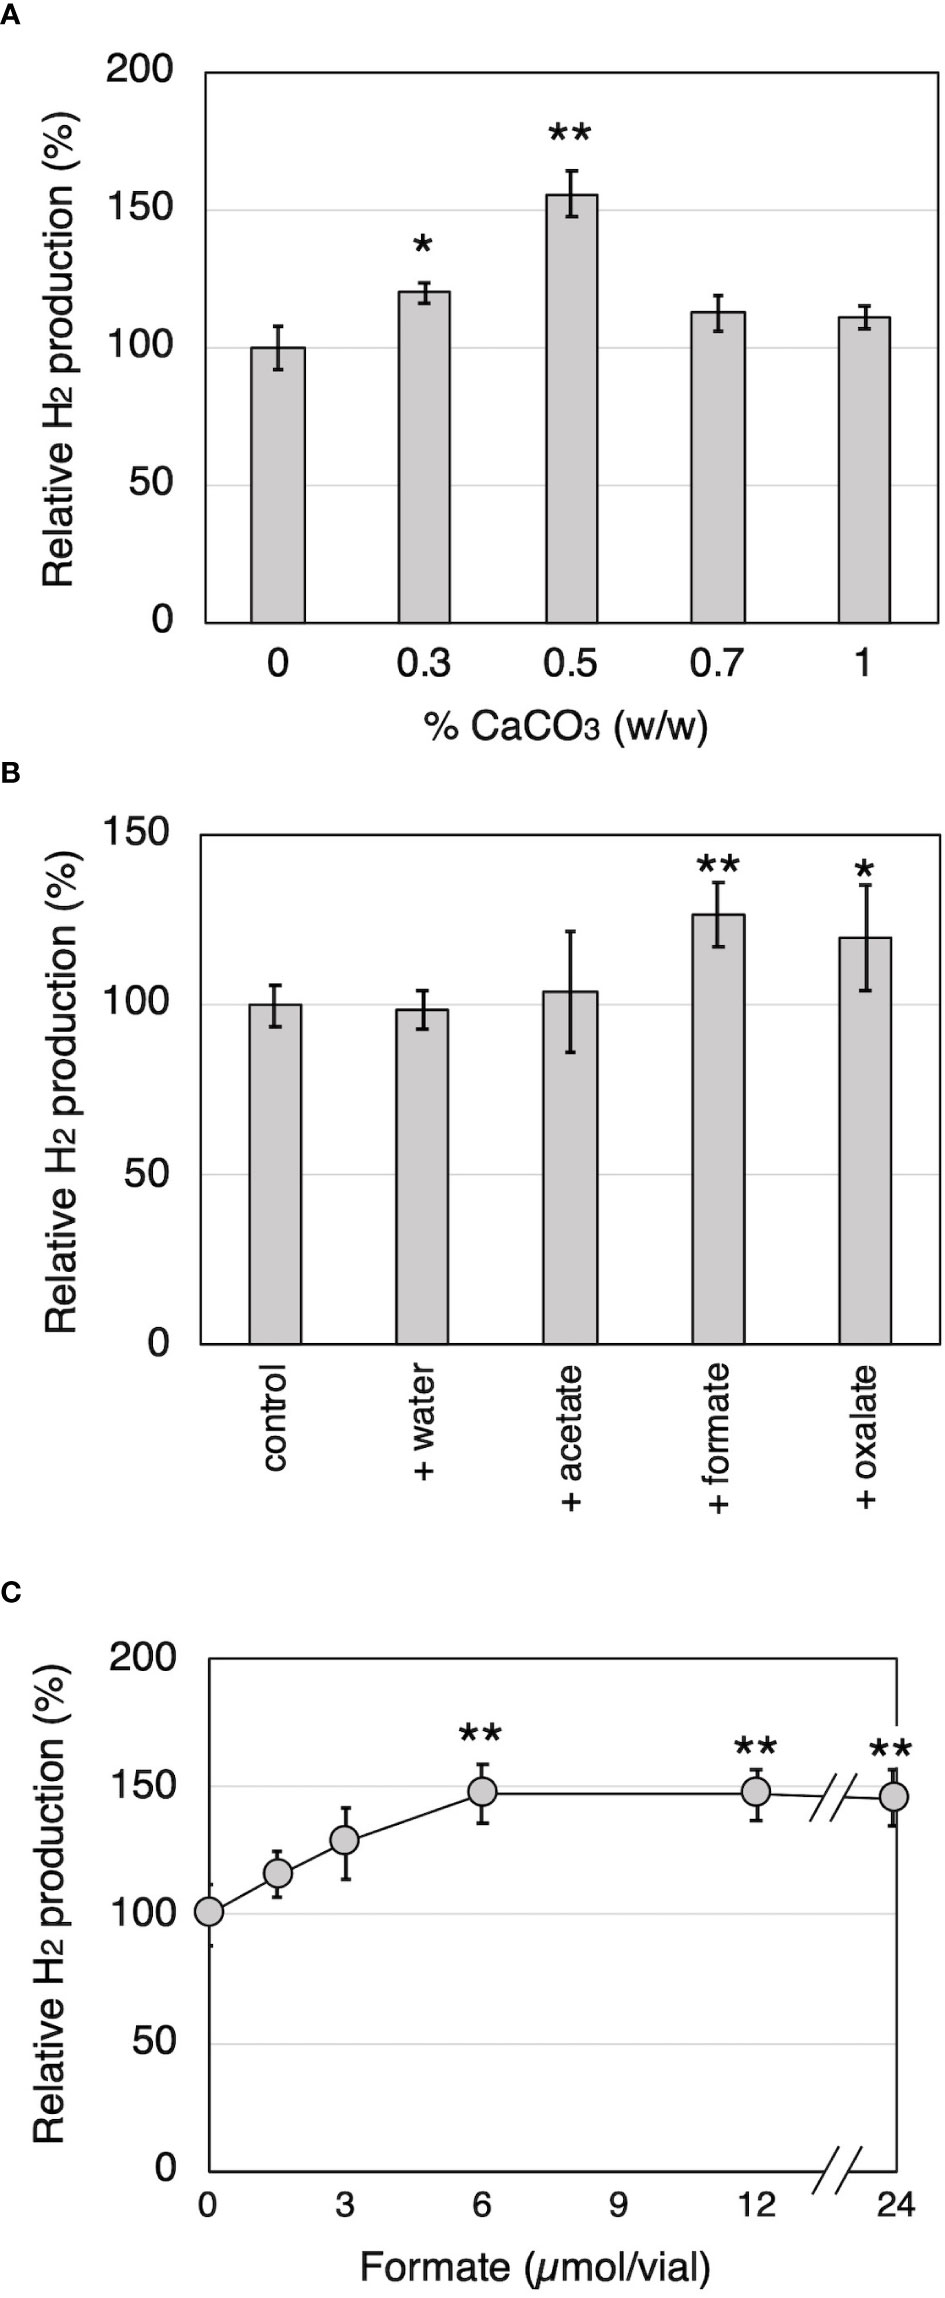
Figure 3 The effects of CaCO3 addition and organic acid supplementation on H2 production by T. versicolor K-41 in cedar wood meal cultures. The effects of (A) CaCO3 mixed ratio to wood medium, and (B) organic acid supplementation prior sealing. (C) The relationship between H2 production and amount of formate added to the wood culture. H2 production was measured on the 14th day after sealing. Asterisks indicate significant differences compared to the control (without any supplementation, * P<0.05, ** P<0.01). Values are mean ± standard deviation (n=3).
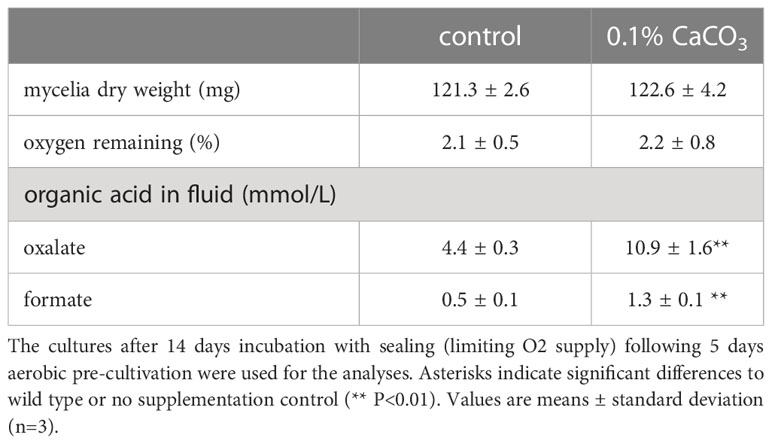
Table 1 Cultivation profiles of T. versicolor K-41 in liquid medium with or without CaCO3.
3.3 Estimation of H2-producing pathway of T. versicolor
To identify differences in gene expression between H2-producing and non–H2-producing conditions, a differential expression analysis between wood and liquid cultures was performed. These culture conditions were completely different, indicating that gene expression patterns are expected to differ significantly. Simultaneously, it was predicted a possibility of differences in the expression of H2 production-related genes due to clear differences in H2 production. Therefore, a differential gene expression analysis under these conditions was conducted. A large number of genes showed differential expression (logFC >1.0 or <−1.0, FDR <0.05); a total of 1,106 and 1,256 genes were up-regulated in wood medium and liquid medium, respectively (Figure 4 and Supplementary Tables 1, 2). In T. versicolor K-41 cultivated on wood medium, many genes encoding cellulolytic and ligninolytic enzymes were up-regulated compared with liquid medium (Supplementary Table 1). In contrast, several genes encoding hydrophobin and amylase-type enzymes were down-regulated on wood medium (Supplementary Table 2). GO enrichment analysis indicated that cellulose metabolic process, peroxidase, processes related to oxidative stress, cation uptake, and peptidase activities were over-represented in wood medium (Supplementary Table 3). These results suggest that T. versicolor K-41 initiates defensive mechanisms for ROS and radicals generated during the wood decay process.
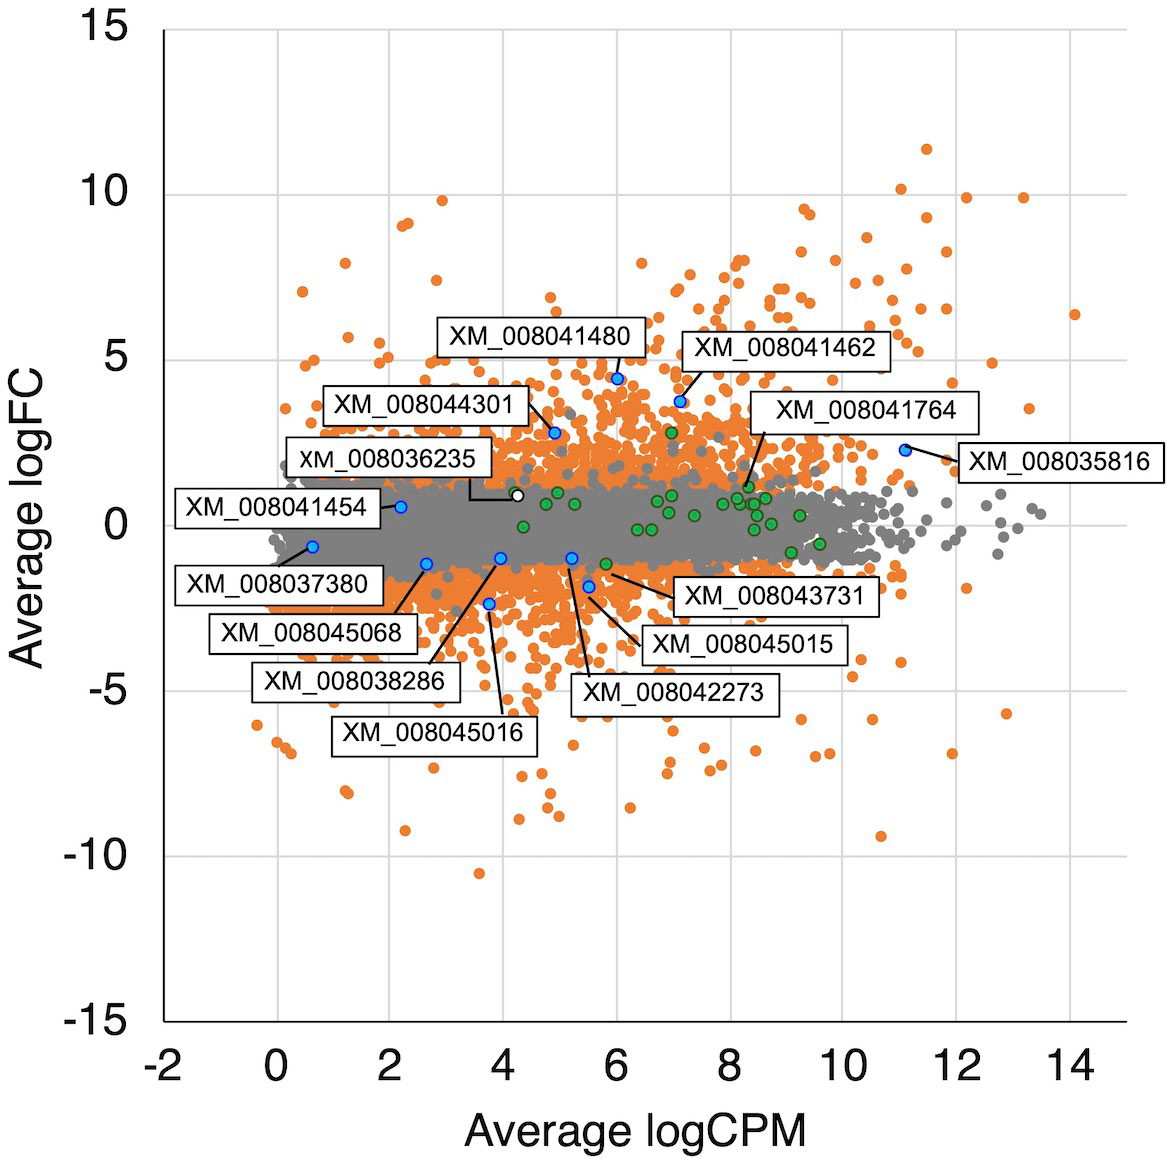
Figure 4 MA plot of the normalized data. Each dot represents a single gene, and significantly differentially expressed genes are colored by orange. The genes related TCA/glyoxylate cycle and oxalate metabolism are colored by green and blue, respectively. A white dot is indicated a hydrogenase-like gene.
In the glyoxylate cycle, only the malate synthase gene (XM_008035809.1) was up-regulated on wood medium (Figure 5 and Table 2). No induction of TCA cycle (GO:0006099) genes was observed compared with liquid culture, although dehydrogenase E1 and transketolase domain-containing protein 1 (XM_008043731.1) were down-regulated, and succinate dehydrogenase cytochrome b560 subunit (XM_008041764.1) was up-regulated in wood culture (Figure 4, Table 2 and Supplementary Table 3). Malate synthase (XM_008035809.1) of the glyoxylate cycle was up-regulated on wood medium. As shown in Figure 5 and Table 2, possible oxalate-producing enzymes were found in the annotations of the T. versicolor FP-101664 SS1 genome: a glyoxylate dehydrogenase (XM_008045016.1) and D- and L-lactate dehydrogenases (XM_008037380.1 and XM_008038286.1) that produce oxalate from glyoxylate (Davies and Asker, 1983; Munir et al., 2001). Although a gene encoding oxalaoacetate, which produces oxalate from oxaloacetate, was not found in the genome, XM_008045015 (annotated as a phosphoenolpyruvate/pyruvate domain-containing protein) showed significant similarity (identity 88.1%, query coverage 86.0%) to the oxaloacetate acetylhydrolase of Fomitopsis palustris (accession: AB690578.1, Hisamori et al., 2013). The expression of all of these putative oxalate-producing enzymes in wood culture was clearly lower than the expression in liquid culture. Five oxalate decarboxylase (ODC) genes have been annotated in the T. versicolor genome (Table 2). Two of these ODCs were up-regulated (XM_008041462.1 and XM_008041480.1) in wood culture, and two others were down-regulated (XM_008042273.1 and XM_008045068.1). Two highly expressed ODC genes were markedly up-regulated (Figure 4); therefore, all ODC genes appear to be up-regulated. Two formate dehydrogenase (FDH) genes (XM_008035816.1 and XM_008044301.1) showed expression levels ≥4 times higher in wood culture than in liquid culture. The transcript XM_008036235.1, annotated as an iron hydrogenase, showed relatively higher expression in wood culture compared with liquid culture (logFC=0.89, P=0.053, and FDR=0.125).
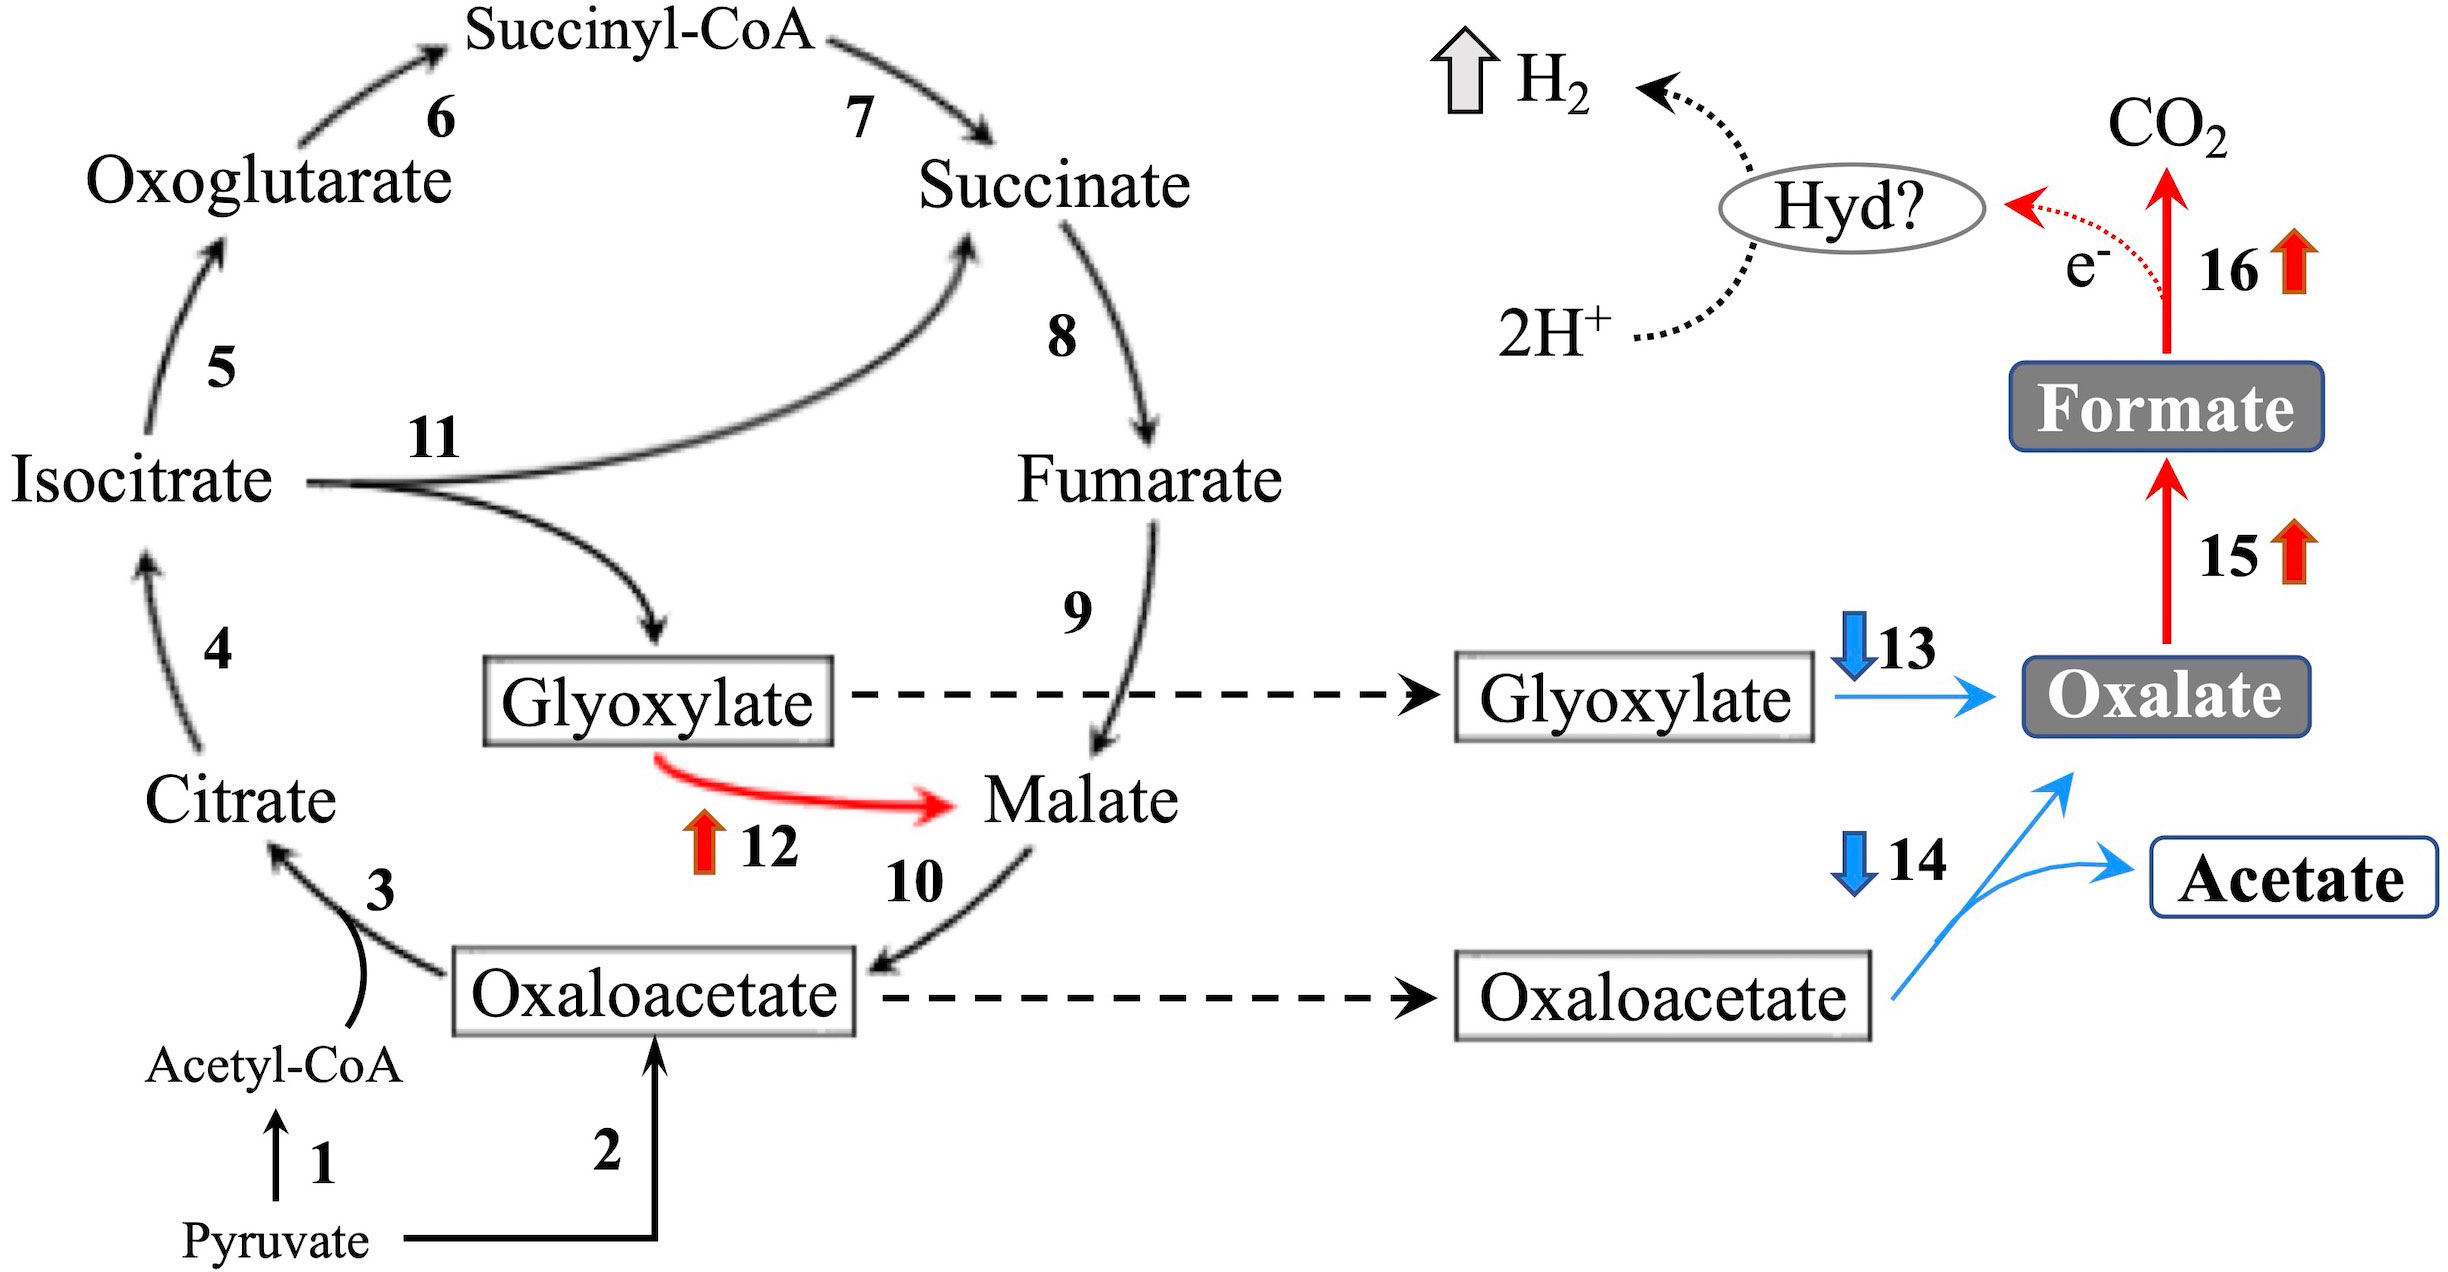
Figure 5 TCA/glyoxylate cycle and proposed H2 production pathway in T. versicolor K-41. Numbers beside arrows indicate enzymes catalyzing the reactions; 1: pyruvate dehydrogenase complex, 2: pyruvate carboxylase, 3: citrate synthase, 4: aconitate hydratase, 5: isocitrate dehydrogenase, 6: oxoglutarate dehydrogenase complex, 7: succinate-CoA ligase, 8: succinate dehydrogenase, 9: fumarate hydratase, 10: malate dehydrogenase, 11: isocitrate lyase, 12: malate synthase, 13: glyoxylate dehydrogenase and D/L-lactate dehydrogenase, 14: oxaloacetate acetylhydrolase, 15: oxalate decarboxylase (ODC), and 16: formate dehydrogenase (FDH). Bold upward and downward arrows indicate up- and down-regulated genes in wood culture compared with liquid culture, respectively. Protons may be reduced to H2 via catalytic reaction of an as yet unknown hydrogen-producing enzyme (Hyd)? using electrons produced during formate metabolism.
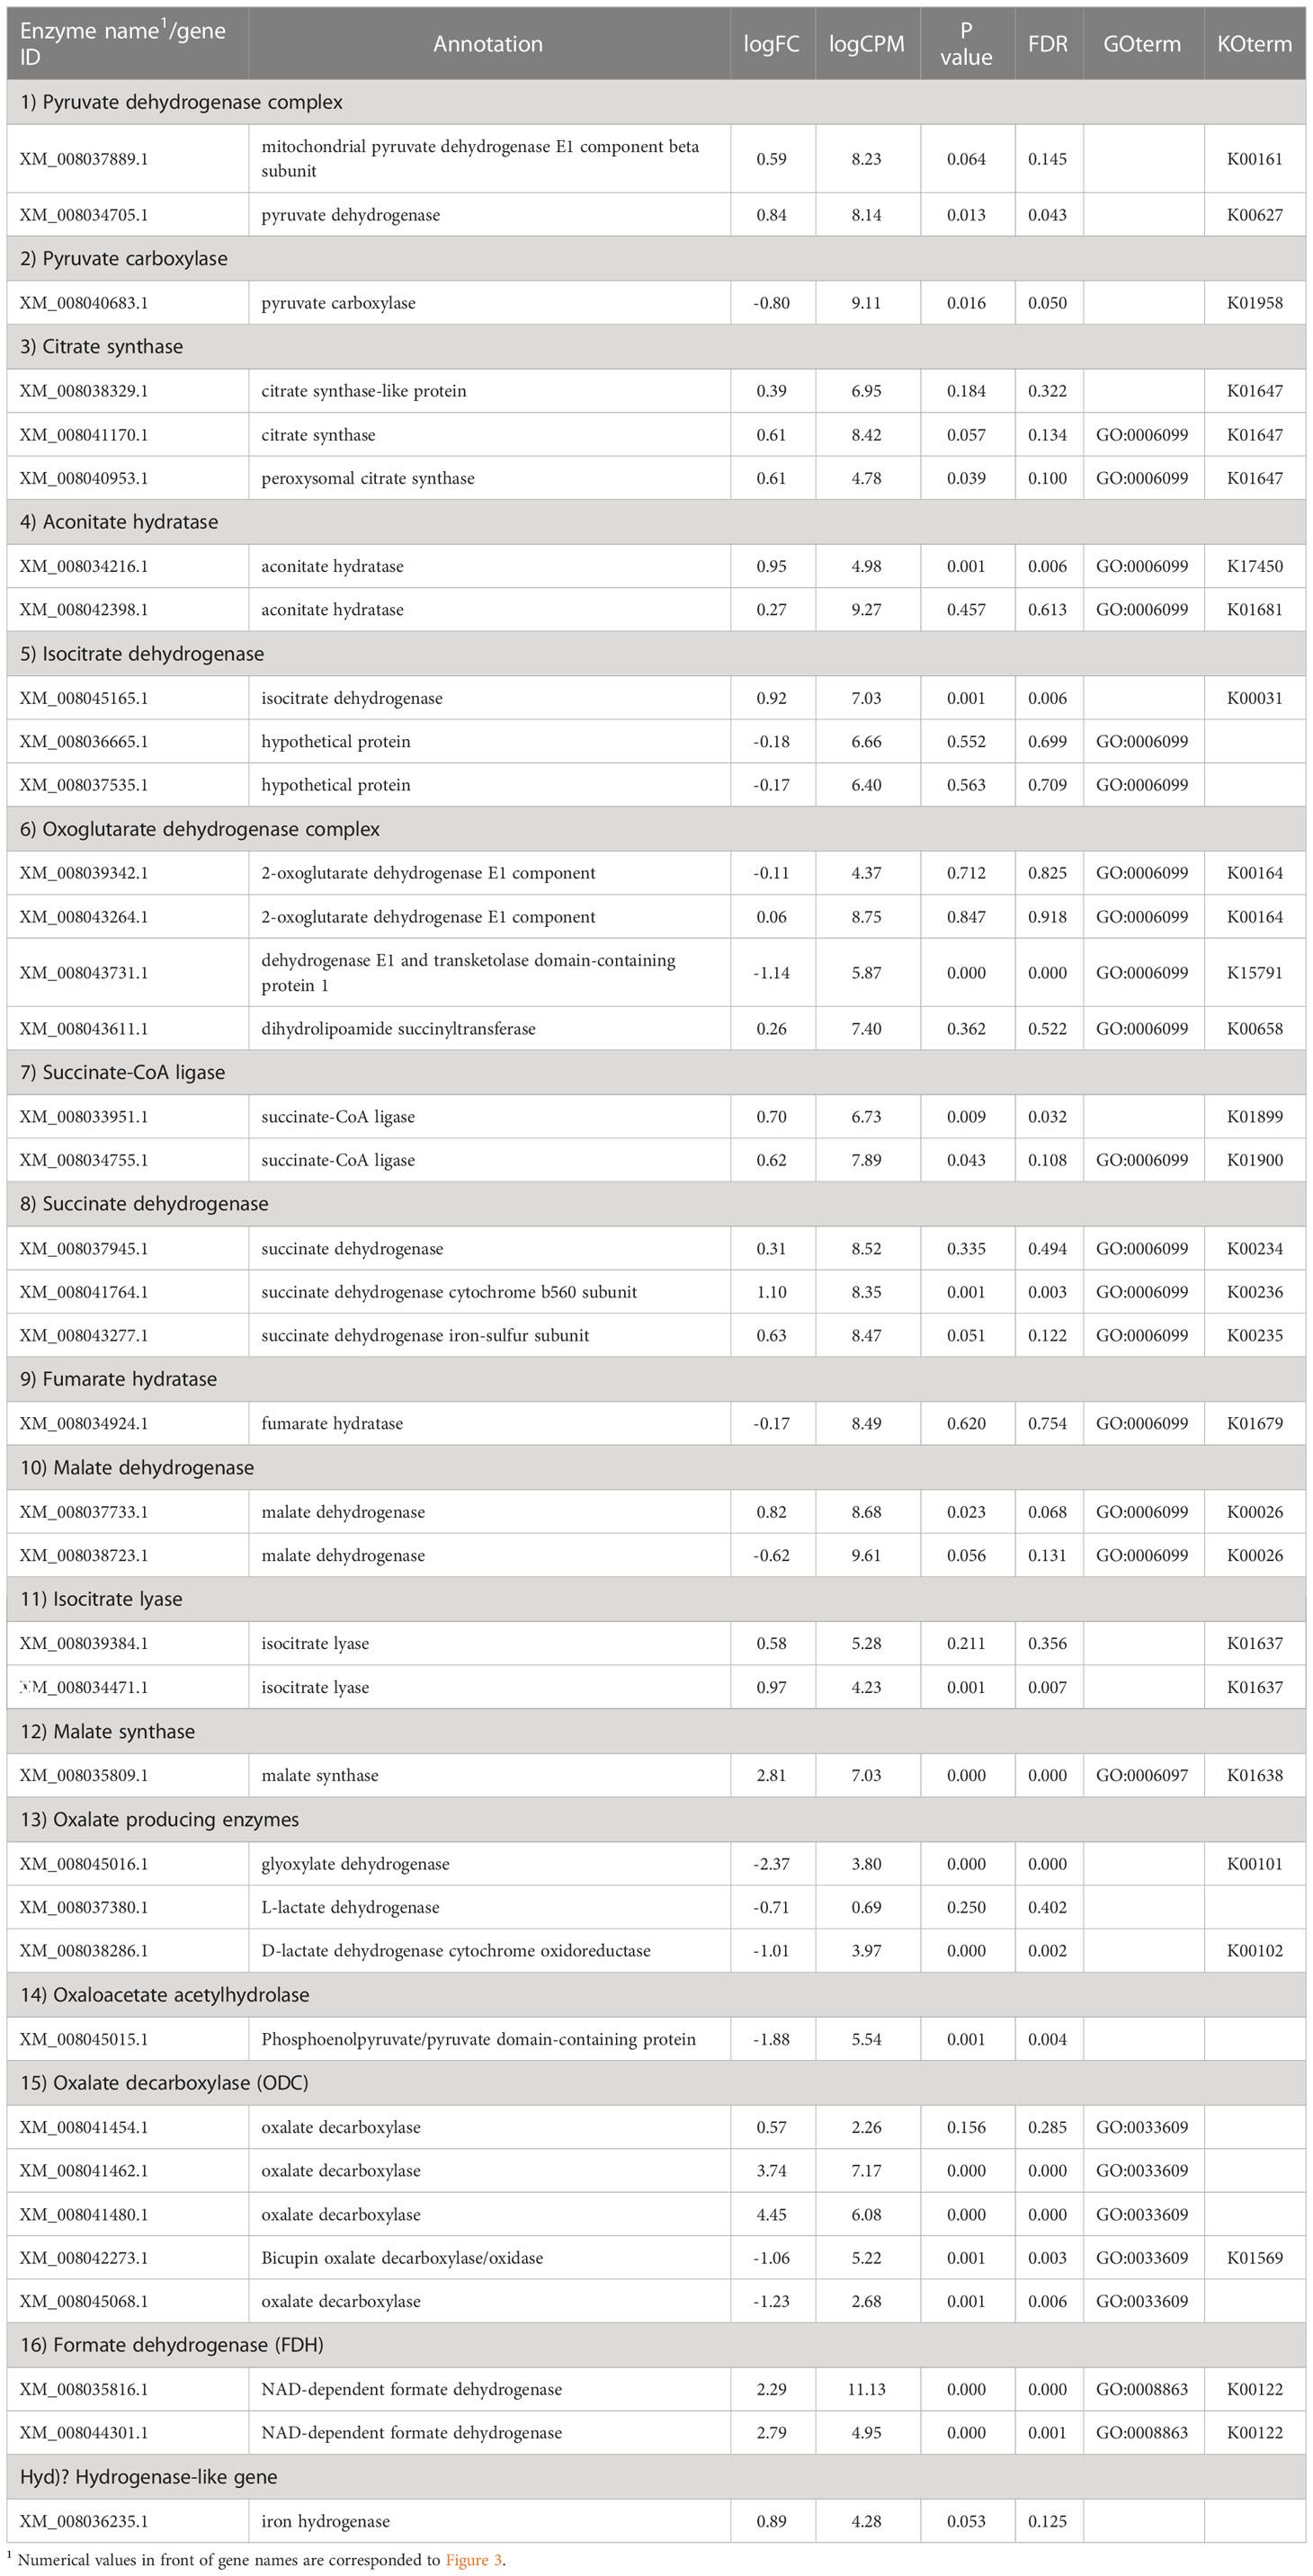
Table 2 Fold-change in expression of genes relating to the TCA/glyoxylate cycle and oxalate metabolism in wood culture compared to liquid culture.
Tvfdh (encoding a formate dehydrogenase) and Tvhyd (annotated as an iron hydrogenase) were identified from the genome and cDNA of T. versicolor K-41. Relative production of H2 and relative expression of Tvhyd and Tvfdh at 7 days after sealing in N2- and O2-purged wood cultures and wood culture containing 0.5% CaCO3 are shown in Figures 6A, B. O2 purge did not affect H2 production; however, H2 was undetectable in N2-purged cultures (Figure 6A). No difference was observed in H2 production between the control and O2-purged samples. This is likely due to the presence of residual O2 in the samples during the early stages after sealing, resulting in H2 production still proceeding in both samples. CaCO3 addition increased H2 production to approximately 150%, as shown in Figure 3A. Relative Tvhyd expression was significantly lower (17%) in N2-purged cultures and higher (172%) in O2-purged cultures compared with the control. In the case of Tvfdh, this gene showed significantly lower expression (less than 1%) in N2-purged cultures and tended to exhibit lower expression (62%, P=0.051) in O2-purged cultures. Although there were no significant differences in the expression levels of Tvhyd and Tvfdh on CaCO3-supplemented cedar culture compared with the control, the expression levels of both genes appeared to be higher. There was a correlation between the Tvfdh expression level and H2 production (r=0.645); therefore, the relationship between Tvfdh and H2 production by T. versicolor K-41 was evaluated.
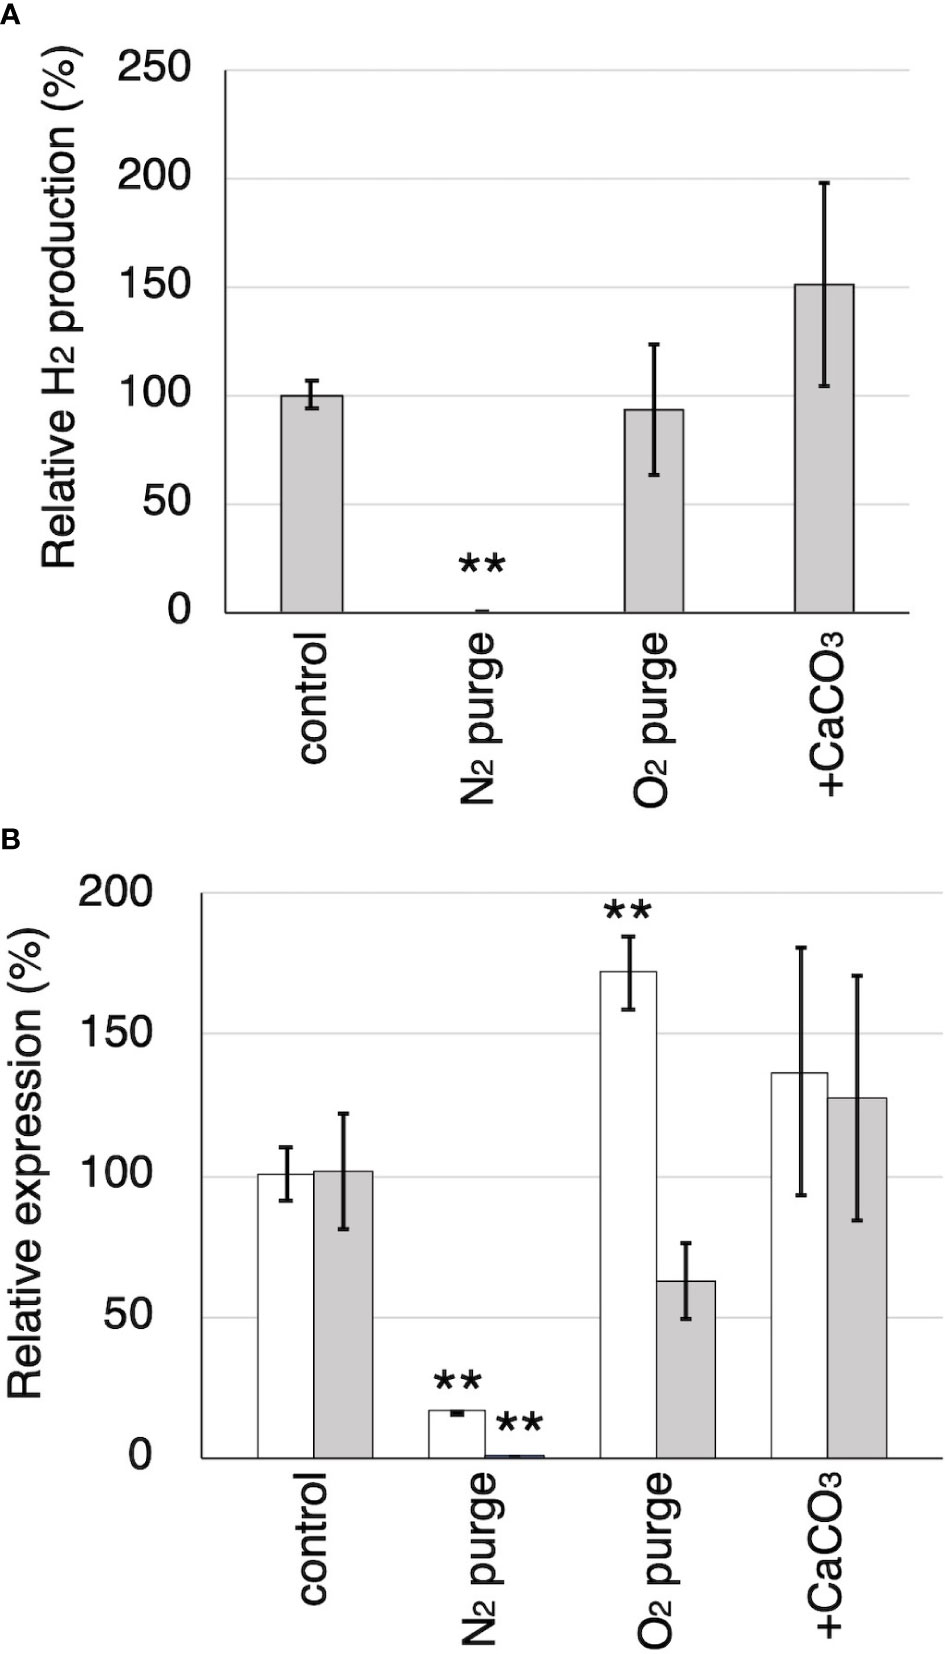
Figure 6 The effects of N2 and O2 purging, CaCO3 addition to the cultures on H2 production and the relative expression of Tvhyd and Tvfdh. (A) Relative H2 production in 7th day compared to the control. (B) Relative expression of Tvhyd (white) and Tvfdh (gray) determined using ΔΔCq method with Tvgpd as a reference gene. Asterisks indicate significant differences compared to the control (** P<0.01). Values are mean ± standard deviation (n=3).
3.4 Effect of self-recombination of Tvfdh on H2 production
Cell-free extract obtained from IPTG-induced E. coli retaining Tvfdh cDNA in pCold I showed clear NADH formation dependent on formate dehydrogenase activity (data not shown). Thus, construction of Tvfdh self-recombinant transformants of T. versicolor K-41 was attempted. A total of 38 self-recombinant strains were recovered by co-transformation, and all of these strains were employed to evaluate O2 consumption during 2 weeks of incubation on cedar wood meal culture to estimate growth on wood meal. Five transformants showing 50% or higher O2 consumption were selected. The remaining 33 strains showed approximately 30% or less O2 consumption, indicating that these strains probably grow slowly on cedar wood medium. The amount of H2 production and remaining O2 concentration after 14 days of incubation following sealing of cedar wood cultures inoculated with 5 selected strains were shown in Figure 7A. All selected strains showed a higher amount of H2 in the headspace. Furthermore, the effect of oxalate and formate supplementation on H2 production of Tvfdh over-expressing strains was investigated (Figure 7B). The wild-type strain exhibited improved H2 production by the addition of oxalate and formate, and formate supplementation in particular showed a clear effect, as shown in Figure 3. Transformants showed higher H2 production in cultures with either supplementation than did the wild-type strain with the same supplementation. In contrast, formate supplementation (3 µmol/vial) improved H2 production by the transformants, whereas oxalate supplementation (3 µmol/vial) did not have a clear effect on H2 production (Figure 7B).
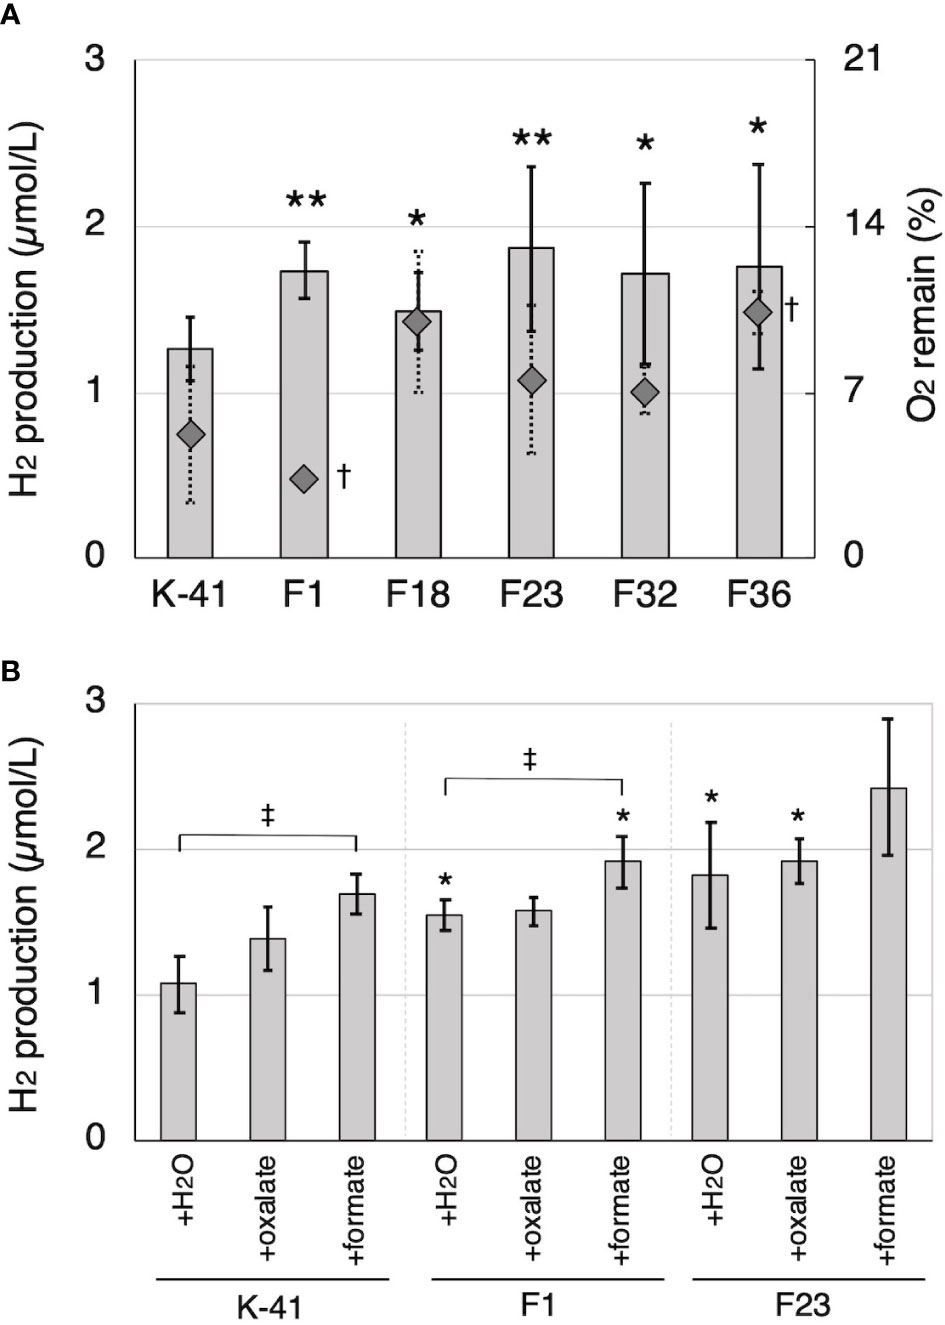
Figure 7 H2 production by Tvfdh self-recombination transformants. (A) H2 production and remaining O2 in cedar wood meal cultures of wild-type strain (K-41) and transformants (F strains). (B) The effects of oxalate and formate supplementation to H2 production of K-41 and transformants. O2 and H2 productions were measured on the 14th day after sealing. Asterisks (* and **) indicate significant differences (P<0.05 and 0.01) in H2 production compared to the wild type (plus same supplementation), respectively. Dagger (†) indicates significant difference in O2 remaining compared to the wild type (P<0.05). Double dagger (‡) indicates significant difference (P<0.05) compared to the H2O supplementation control of the same strain. Values are mean ± standard deviation (n=3).
4 Discussion
Hydrogen and methane gases hold promise as next-generation fuels. Biologically, both gases are produced by anaerobic microorganisms. Recent research revealed that eukaryotes, including animals, plants, and fungi, produce methane during responses to stressors such as ROS, even in the presence of O2 (Liu et al., 2015). In the case of biohydrogen, many reports have described H2 production from not only bacteria but also anaerobic eukaryotes. Hydrogenase-like genes are widely distributed among eukaryotes, including higher eukaryotes; however, the functions of these genes are still unknown (Horner et al., 2002). Some reports have described H2 production by higher plants (e.g., Torres et al., 1986; Jin et al., 2013). Although the physiological roles of H2 in higher eukaryotes remain unclear, it is thought that H2 acts as an antioxidant and signaling molecule in higher plants and animals and improves tolerance to ROS (e.g., Itoh et al., 2011; Li et al., 2018). White-rot fungi produce a variety of radicals and ROS during the wood decay process (ten Have and Teunissen, 2001), and they may also have antioxidative self-defense mechanisms.
Based on these observations, it is hypothesized that white-rot fungi produce H2 as an antioxidant that protects against oxidative stressors such as ROS and radicals that are generated during the wood decay process. In tightly sealed wood cultures, a peak of H2 on GC analysis was observed in the headspace gas of samples of more than half of the white-rot fungi species tested (Figure 1). While this was a very novel and interesting finding, the respective amounts and efficiencies of H2 production were less than 1/1000 of bacterial H2 production from lignocellulose (Ren et al., 2016). Therefore, H2 production by white-rot fungi during wood decay is likely to be a secondary metabolic reaction rather than primary metabolism associated with energy production. It is possible that a portion of the produced H2 is consumed to reduce the toxicity of radicals and ROS generated during wood decay under aerobic conditions. The H2 production properties of T. versicolor K-41, which showed the highest H2 production on wood medium, were thus investigated further. After sealing of the culture vials, this fungus consumed O2 in the headspace via respiration, and H2 production was only observed during O2 consumption (Figures 2A, B). If O2 was re-supplied to the headspace of culture vials after O2 consumption ceased, the fungus resumed H2 production. Additionally, H2 production was well correlated with O2 concentration (Figure 2C). Thus, these results indicated that white-rot fungi emit H2 during aerobic respiration but not anaerobic conditions, a property that contrasts markedly with that of bacterial H2 production. These results also suggested that there is a relationship between H2 production and wood decay by white-rot fungi.
Some H2-producing bacteria are capable of utilizing short-chain organic acids such as formate, acetate, and lactate for H2 production (Barbosa et al., 2001; Matsumoto and Nishimura, 2007; McDowall et al., 2014). It has also been shown that hydrogenosomes, organelles found in a wide variety of anaerobic eukaryotes, produce H2 during pyruvate or malate metabolism (Davidson et al., 2002). These data suggest that organic acids have a significant effect on microbial hydrogen production. In environments with a high C/N ratio, such as wood, it is thought that white-rot fungi dispose of excess carbon as oxalate or other metabolites. Most oxalate is probably produced intracellularly from intermediates (oxaloacetate and glyoxylate) of the TCA and glyoxylic acid cycles (Mäkelä et al., 2002). Although oxalate accumulation in wood culture correlates well with fungal growth and ligninolytic manganese peroxidase activity in some white-rot fungi, including T. versicolor, white-rot fungi readily decompose excessive oxalate via intra/extracellular metabolism in order to avoid its toxic effect ((Dutton et al., 1993; Mäkelä et al., 2002). Oxalate is degraded to CO2 via formate by intracellular ODC and FDH and also degraded to CO2 by extracellular peroxidase systems (Shimada et al., 1994). These pathways may enable white-rot fungi to control the concentration of intra/extracellular oxalate to maintain physiological conditions. The concentration of oxalate in the medium was shown to increase after addition of CaCO3 to white-rot fungi cultures (Takao, 1965). The data presented here provide novel insights into the relationship between oxalate metabolism and H2 production, because higher H2 production was observed in cedar wood cultures supplemented with CaCO3, oxalate, and formate compared with control cultures (Figures 3, 7). These results suggested that metabolism of organic acids, especially formate, is involved in H2 production by T. versicolor K-41.
No hydrogen production was observed in the liquid culture, even though the addition of CaCO3 enhanced extracellular oxalate accumulation (Table 1). RNA-seq analyses showed that T. versicolor K-41 exhibited lower oxalate production and higher oxalate metabolic activity in wood culture compared with liquid culture. As shown in Table 2, T. versicolor K-41 promoted the expression of oxalate metabolic enzymes, ODCs and FDHs, in wood culture. In contrast, oxalate-producing enzymes were suppressed. In addition, T. versicolor K-41 appeared to avoid accumulation of toxic organic acids, glyoxylate, oxalate, and formate, as only malate synthase was upregulated among the enzymes in the glyoxylate cycle. These result support the hypothesis that oxalate/formate metabolism is involved in H2 production in wood culture. However, this data did not clarify the relationship between the expression of hydrogenase-like genes and H2 production by T. versicolor K-41. Thus, these experiments indicate that molecular hydrogen synthesis is not the rate-limiting step in the H2 production system in this fungus.
Accordingly, it was investigated the relationship between the expression of a hydrogenase-like gene (Tvhyd) and FDH gene (Tvfdh) and H2 production under different O2 conditions or CaCO3 supplementation (Figure 6). N2 purge showed clear effects, as low O2 conditions completely suppressed H2 production and inhibited Tvfdh expression. This result suggests that Tvfdh expression is likely more correlated with H2 production than Tvhyd. Therefore, formate metabolism catalyzed by TvFDH is probably involved in H2 production. Tvfdh self-recombination strains that maintained O2 consumption produced higher amounts of H2 in the headspace than the wild-type strain; however, transformants only exhibited improved H2 production following formate supplementation, unlike the wild type (Figure 7). These results suggest that the amounts of oxalate and formate or the associated metabolic activities are the rate-limiting step in H2 production by T. versicolor K-41. Therefore, a possible H2 production pathway for T. versicolor K-41 is proposed, as shown in Figure 5. Oxalate originating in the TCA/glyoxylate cycle is metabolized to form formate by intracellular ODC, and FDH oxidized formate to generate CO2, H+, and two electrons. from formate. Then, TvHYD or an as yet unknown hydrogenase perhaps produces H2 from protons by utilizing electrons produced in formate metabolism.
In this study, it was discovered that some white-rot fungi belonging to the Polyporales are capable of producing H2 during wood decay. In the case of T. versicolor K-41, which showed the highest H2 production, the fungus produced H2 under aerobic conditions, and oxalate/formate metabolism is likely linked to the H2 production system. In addition to these results, self-recombination of Tvfdh clearly improved H2 production in cedar wood culture, thus suggesting that TvFDH is involved in H2 production by this fungus. This novel finding of aerobic H2 production by an aerobic white-rot fungus opens new areas of inquiry in biohydrogen research. It is expected that be economically advantageous over anaerobic fermentation for process control if an aerobic H2 production process could be established. However, the current H2 production by white rot fungi is far below the commercially viable level. Additionally, there are many open questions remaining in terms of the mechanism of aerobic H2 production by white-rot fungi, the involvement of bacterial symbionts in H2 production by white-rot fungi has not been excluded, and the H2 production mechanism remains unclear. In future studies, identification of the enzyme producing H2 and the underlying mechanism will be attempted in order to shed light on the physiological function of H2 production in white-rot fungi.
Data availability statement
The datasets presented in this study can be found in the DDBJ repository, accession number DRA014108 (https://ddbj.nig.ac.jp/resource/sra-submission/DRA014108).
Author contributions
TM screened H2-producing fungi, analyzed gene expression, interpreted experiments, and wrote the manuscript. ST analyzed the effect of oxygen and self-recombinant strains. AS performed characterization of H2 production activity. MA determined gene and cDNA sequences and contributed screening. RK and YY contributed to the construction of recombinant strains. HD performed RNA-seq and analyzed the data. HK proposed the H2 production pathway. HH designed and interpreted the experiments and wrote the manuscript. All authors contributed to the article and approved the submitted version.
Funding
This work was supported by Japan Society for the Promotion of Science Grants-in-Aid for Scientific Research (KAKENHI), grant numbers JP16K15074 and JP18H02311.
Conflict of interest
The authors declare that the research was conducted in the absence of any commercial or financial relationships that could be construed as a potential conflict of interest.
Publisher’s note
All claims expressed in this article are solely those of the authors and do not necessarily represent those of their affiliated organizations, or those of the publisher, the editors and the reviewers. Any product that may be evaluated in this article, or claim that may be made by its manufacturer, is not guaranteed or endorsed by the publisher.
Supplementary material
The Supplementary Material for this article can be found online at: https://www.frontiersin.org/articles/10.3389/ffunb.2023.1201889/full#supplementary-material
References
Azwar M. Y., Hussain M. A., Abdul-Wahab A. K. (2014). Development of biohydrogen production by photobiological, fermentation and electrochemical processes: a review. Renew. Sustain. Energy Rev. 31, 158–173. doi: 10.1016/j.rser.2013.11.022
Barbosa M. J., Rocha J. M. S., Tramper J., Wijffels H. R. (2001). Acetate as a carbon source for hydrogen production by photosynthetic bacteria. J. Biotechnol. 85, 25–33. doi: 10.1016/S0168-1656(00)00368-0
Bolger A. M., Lohse M., Usadel B. (2014). Genome analysis Trimmomatic: a flexible trimmer for illumina sequence data. Bioinfomatics 30, 2114–2120. doi: 10.1093/bioinformatics/btu170
Dashtban M., Schraft H., Syed T. A., Qin W. (2010). Fungal biodegradation and enzymatic modification of lignin. Int. J. Biochem. Mol. Biol. 1, 36–50.
Davidson E. A., van der Giezen M., Horner D. S., Embley T. M., Howe C. J. (2002). An [Fe] hydrogenase from the anaerobic hydrogenosome-containing fungus neocallimastix frontalis L2. Gene 296, 45–52. doi: 10.1016/S0378-1119(02)00873-9
Davies D. D., Asker H. (1983). Synthesis of oxalic acid by enzymes from lettuce leaves. Plant Physiol. 72, 134–138. doi: 10.1104/pp.72.1.134
Dutton M. V., Evans C. S., Atkey P. T., Wood D. A. (1993). Oxalate production by basidiomycetes, including the white-rot species coriolus versicolor and phanerochaete chrysosporium. Appl. Microbiol. Biotechnol. 39, 5–10. doi: 10.1007/BF00166839
Ghimire A., Frunzo L., Pirozzi F., Trably E., Escudie R., Lens P. N. L., et al. (2015). A review on dark fermentative biohydrogen production from organic biomass: process parameters and use of by-products. Appl. Energy 144, 73–95. doi: 10.1016/j.apenergy.2015.01.045
Hackstein J. H. P., Akhmanova A., Boxma B., Harhangi H. R., Voncken F. G. J. (1999). Hydrogenosomes: eukaryotic adaptations to anaerobic environments. Trends Microbiol. 7, 441–447. doi: 10.1016/S0966-842X(99)01613-3
Hess M., Paul S. S., Puniya A. K., Giezen M., Shaw C., Edwards J. E., et al. (2020). Anaerobic fungi: past, present, and future. Front. Microbiol. 11. doi: 10.3389/fmicb.2020.584893
Hisamori H., Watanabe T., Suzuki S., Okawa K., Sakai H., Yoshimura T., et al. (2013). Cloning and expression analysis of a cDNA encoding an oxaloacetate acetylhydrolase from the brown-rot fungus fomitopsis palustris. Sustain. Humanosph. 9, 57–64.
Horner D. S., Heil B., Happe T., Embley T. M. (2002). Iron hydrogenases - ancient enzymes in modern eukaryotes. Trends Biochem. Sci. 27, 148–153. doi: 10.1016/S0968-0004(01)02053-9
Itoh T., Hamada N., Terazawa R., Ito M., Ohno K., Ichihara M., et al. (2011). Molecular hydrogen inhibits lipopolysaccharide / interferon γ-induced nitric oxide production through modulation of signal transduction in macrophages. Biochem. Biophys. Res. Commun. 411, 143–149. doi: 10.1016/j.bbrc.2011.06.116
Jin Q., Zhu K., Cui W., Xie Y., Han B., Shen W. (2013). Hydrogen gas acts as a novel bioactive molecule in enhancing plant tolerance to paraquat-induced oxidative stress via the modulation of heme oxygenase-1 signalling system. Plant Cell Environ. 36, 956–969. doi: 10.1111/pce.12029
Kim D., Langmead B., Salzberg S. L. (2015). HISAT: a fast spliced aligner with low memory requirements. Nat. Methods 12, 357–360. doi: 10.1038/nmeth.3317
Kim S. Y., Volsky D. J. (2005). PAGE: parametric analysis of gene set enrichment. BMC Bioinf. 6, 144. doi: 10.1186/1471-2105-6-144
Li C., Gong T., Bian B., Liao W. (2018). Roles of hydrogen gas in plants: a review. Funct. Plant Biol. 45, 783–792. doi: 10.1071/FP17301
Liao Y., Smyth G. K., Shi W. (2014). FeatureCounts: an efficient general purpose program for assigning sequence reads to genomic features. Bioinformatics 30, 923–930. doi: 10.1093/bioinformatics/btt656
Liu J., Chen H., Zhu Q., Shen Y., Wang X., Wang M., et al. (2015). A novel pathway of direct methane production and emission by eukaryotes including plants, animals and fungi: an overview. Atmos. Environ. 115, 26–35. doi: 10.1016/j.atmosenv.2015.05.019
Mäkelä M., Galkin S., Hatakka A., Lundell T. (2002). Production of organic acids and oxalate decarboxylase in lignin-degrading white rot fungi. Enzyme Microb. Technol. 30, 542–549. doi: 10.1016/S0141-0229(02)00012-1
Marvin-Sikkema F. D., Gomes T. M. P., Grivet J.-P., Gottschal J. C., Prins R. A. (1993). Characterization of hydrogenosomes and their role in glucose metabolism of neocallimastix sp. L2. Arch. Microbiol. 160, 388–396. doi: 10.1007/BF00252226
Matsumoto M., Nishimura Y. (2007). Hydrogen production by fermentation using acetic acid and lactic acid. J. Biosci. Bioeng. 103, 236–241. doi: 10.1263/jbb.103.236
McDowall J. S., Murphy B. J., Haumann M., Palmer T., Armstrong F. A., Sargent F. (2014). Bacterial formate hydrogenlyase complex. Proc. Natl. Acad. Sci. U.S.A. 111, E3948–E3956. doi: 10.1073/pnas.1407927111
Mnatsakanyan N., Bagramyan K., Trchounian A. (2004). Hydrogenase 3 but not hydrogenase 4 is major in hydrogen gas production by escherichia coli formate hydrogenlyase at acidic pH and in the presence of external formate. Cell Biochem. Biophys. 41, 357–365. doi: 10.1385/CBB:41:3:357
Mori T., Kako H., Sumiya T., Kawagishi H., Hirai H. (2016). Direct lactic acid production from beech wood by transgenic white-rot fungus phanerochaete sordida YK-624. J. Biotechnol. 239, 83–89. doi: 10.1016/j.jbiotec.2016.10.014
Mori T., Sudo S., Kawagishi H., Hirai H. (2018). Biodegradation of diuron in artificially contaminated water and seawater by wood colonized with the white-rot fungus trametes versicolor. J. Wood Sci. 64, 690–696. doi: 10.1007/s10086-018-1740-x
Munir E., Yoon J. J., Tokimatsu T., Hattori T., Shimada M. (2001). A physiological role for oxalic acid biosynthesis in the wood-rotting basidiomycete fomitopsis palustris. Proc. Natl. Acad. Sci. U.S.A. 98, 11126–11130. doi: 10.1073/pnas.191389598
Ohta S. (2012). Molecular hydrogen is a novel antioxidant to ef fi ciently reduce oxidative stress with potential for the improvement of mitochondrial diseases. Biochmica Biophys. Acta 1820, 586–594. doi: 10.1016/j.bbagen.2011.05.006
Ren N. Q., Zhao L., Chen C., Guo W. Q., Cao G.-L. (2016). A review on bioconversion of lignocellulosic biomass to H2: key challenges and new insights. Bioresour. Technol. 215, 92–99. doi: 10.1016/j.biortech.2016.03.124
Renwick G. M., Giumarro C., Siegel S. M. (1964). Hydrogen metabolism in higher plants. Plant Physiol. 39, 303–306. doi: 10.1104/pp.39.3.303
Robinson M. D., McCarthy D. J., Smyth G. K. (2010). edgeR: a bioconductor package for differential expression analysis of digital gene expression data. Bioinformatics 26, 139–140. doi: 10.1093/bioinformatics/btp616
Shimada M., Ma D. B., Akamatsu Y., Hattori T. (1994). A proposed role of oxalic acid in wood decay systems of wood-rotting basidiomycetes. FEMS Microbiol. Rev. 13, 285–295. doi: 10.1111/j.1574-6976.1994.tb00049.x
Takao S. (1965). Organic acid production by basidiomycetes, i. screening of acid-producing strains. Appl. Microbiol. 13, 732–737. doi: 10.1128/am.13.5.732-737.1965
ten Have R., Teunissen P. J. M. (2001). Oxidative mechanisms involved in lignin degradation by white-rot fungi. Chem. Rev. 101, 3397–3413. doi: 10.1021/cr000115l
Torres V., Ballesteros A., Fernández V. M. (1986). Expression of hydrogenase activity in barley ( hordeum vulgare l.) after anaerobic stress. Arch. Biochem. Biophys. 245, 174–178. doi: 10.1016/0003-9861(86)90202-X
Watanabe T., Hattori T., Tengku S., Shimada M. (2005). Purification and characterization of NAD- dependent formate dehydrogenase from the white-rot fungus Ceriporiopsis subvermispora and possible role of the enzyme in oxalate metabolism. Microb. Technol. 27, 68–75. doi: 10.1016/j.enzmictec.2005.01.032
Xie Y., Mao Y., Lai D., Zhang W., Shen W. (2012). H2 enhances arabidopsis salt tolerance by manipulating ZAT10 / 12-mediated antioxidant defence and controlling sodium exclusion. PloS One 7, e49800. doi: 10.1371/journal.pone.0049800
Keywords: aerobic H2 production, formate dehydrogenase, oxalate metabolism, Trametes versicolor, white-rot fungi
Citation: Mori T, Takahashi S, Soga A, Arimoto M, Kishikawa R, Yama Y, Dohra H, Kawagishi H and Hirai H (2023) Aerobic H2 production related to formate metabolism in white-rot fungi. Front. Fungal Biol. 4:1201889. doi: 10.3389/ffunb.2023.1201889
Received: 07 April 2023; Accepted: 05 June 2023;
Published: 27 June 2023.
Edited by:
Xiaoyun Su, Chinese Academy of Agricultural Sciences (CAAS), ChinaReviewed by:
Jiwei Zhang, University of Minnesota Twin Cities, United StatesRakesh Kumar Sharma, Manipal University Jaipur, India
Copyright © 2023 Mori, Takahashi, Soga, Arimoto, Kishikawa, Yama, Dohra, Kawagishi and Hirai. This is an open-access article distributed under the terms of the Creative Commons Attribution License (CC BY). The use, distribution or reproduction in other forums is permitted, provided the original author(s) and the copyright owner(s) are credited and that the original publication in this journal is cited, in accordance with accepted academic practice. No use, distribution or reproduction is permitted which does not comply with these terms.
*Correspondence: Hirofumi Hirai, aGlyYWkuaGlyb2Z1bWlAc2hpenVva2EuYWMuanA=