 Haris Ballis
 Loukas Dimitriou
- Lab for Transport Engineering, Department of Civil and Transport Engineering, University of Cyprus, Nicosia, Cyprus
The unprecedented volume of urban sensing data has allowed the tracking of individuals at remarkably high resolution. As an example, Telecommunication Service Providers (TSPs) cannot provide their service unless they continuously collect information regarding the location of their customers. In conjunction with appropriate post-processing methodologies, these traces can be augmented with additional dimensions such as the activity of the user or the transport mode used for the completion of journeys. However, justified privacy concerns have led to the enforcement of legal regulations aiming to hinder, if not entirely forbid, the use of such private information even for purely scientific purposes. One of the most widely applied methods for the communication of mobility information without raising anonymity concerns is the aggregation of trips in origin–destination (OD) matrices. Previous work has showcased the possibility to exploit multi-period and purpose-segmented ODs for the synthesis of realistic disaggregate tours. The current study extends this framework by incorporating the multimodality dimension into the framework. In particular, the study evaluates the potential of synthesizing multimodal, diurnal tours for the case where the available ODs are also segmented by the transport mode. In addition, the study proves the scalability of the method by evaluating its performance on a set of time period-, trip purpose-, and transport mode-segmented, large-scale ODs describing the mobility patterns for millions of citizens of the megacity of Tokyo, Japan. The resulting modeled tours utilized over 96% of the inputted trips and recreated the observed mobility traces with an accuracy exceeding 80%. The high accuracy of the framework establishes the potential to utilize privacy-safe, aggregate urban mobility data for the synthesis of highly informative and contextual disaggregate mobility information. Implications are significant since the creation of such granular mobility information from widely available data sources like aggregate ODs can prove particularly useful for deep explanatory analysis or for advanced transport modeling purposes (e.g., agent-based, microsimulation modeling).
Introduction
Prior to the introduction of smart mobility sensors (e.g., smartphones, smartwatches, GPS trackers, etc.), the study of mobility had mainly relied on costly and time-consuming transport surveys. However, improvements in the field of urban sensing technology have allowed the deeper understanding of mobility at an unprecedented resolution and with a significantly lower cost compared to traditional methods (Ghahramani et al., 2020). Although travel surveys are still an integral part of transport-related studies, passively collected urban sensing data are gradually substituting them for various reasons (Calabrese et al., 2014; Kadhim et al., 2016). Firstly, passively collected data can be collected for considerably larger portions of the population and in notably more frequent intervals compared to traditional surveys. Secondly, passively collected data are usually not expensive since they can derive as by-products of other processes (e.g., telecommunications call detail records). Thirdly, the recording of relevant information places no burden on the tracked user. Although this attribute initially limits the depth of detail that can be obtained from passively collected data, various post-processing data augmentation methodologies have managed to accurately restore significant parts of the missing information, such as the transport mode used by the user (Prelipcean et al., 2017; Huang et al., 2019; Liu et al., 2020), and therefore have reduced the effects of this limitation.
The increasing availability of mobility-related data has led researchers to the development of models able to identify patterns and connections between the system's state variables (i.e., inputs and outputs) without explicit knowledge of the analyzed system. These so-called data-driven models promise to minimize uncertainty and improve accuracy by fusing and integrating multiple sources of (dynamic) data into the core of (transport) modeling (Jha, 2015; Angria et al., 2018; Antoniou et al., 2019). The applications of data-driven methodologies in the field of transport and travel behavior modeling have been strongly supported by the introduction of the previously discussed automated, continuous data collection technologies that are able to compliment or even improve the statistical representativeness of traditional surveys (Cottrill et al., 2013). The significant role of these modern urban sensing data sources (e.g., mobile phone data, GPS traces, transit smart cards, etc.) in the study of travel behavior has been explored by numerous researchers (Caceres et al., 2013; Calabrese et al., 2013; Yue et al., 2014; Çolak et al., 2015; Vlahogianni et al., 2015; Bassolas et al., 2019).
One of the most widely used technologies utilized in urban mobility sensing is arguably the mobile phone. According to a recent GSMA intelligence data report (GSMA, 2017), there are almost 5.13 billion mobile phone users around the globe, accounting for 66.5% of the world's population. Telecommunication service providers (TSPs) are unable to provide their services without monitoring the position of the devices registered to the communications network; therefore, the location of each mobile phone is continuously queried. Mobility researchers have been leveraging this type of information for almost a decade already, and a considerable number of relevant methodologies have expanded the understanding of mobility using mobile phone data (MPD). For example, a data-driven modeling framework enabling the estimation of human mobility trajectories has been presented by Pappalardo and Simini (2018), where observed MPD data were utilized to construct individual diaries based on an exploration and preferential return methodology. The comparison of their results against observed data showcased the capability of the methodology to accurately reproduce the statistical properties of the observed trajectories. Finally, a prominent methodology providing anonymized and fully detailed activity schedules from MPD is presented by Lin et al. (2017). The authors first utilize an input–output hidden Markov model (IO-HMM) to infer activity sequences and subsequently apply a long short-term memory (LSTM) deep neural network for the assignment of exact locations to the previously identified activities. The framework presented reasonable performance when 465,000 synthetic activity schedules were assigned in a multimodal, micro-simulator model and the observed traffic and transit counts were compared against the corresponding modeled figures.
TSPs are able to record the mobility traces of their users with great accuracy; however, justified privacy concerns raised by the distinctiveness of personal mobility footprints (De Montjoye et al., 2013) are forbidding the use of such data (Batty et al., 2012), unless an appropriate anonymization technique is firstly applied. Various methodologies have been suggested for the achievement of what is often referred to as differential privacy of the tracked population. Differential privacy requires that the probability distribution on the published results of an analysis is “essentially the same,” independently of whether any individual opts into or opts out of the data set (Dwork et al., 2010). Despite the widespread research in relation to ensuring differential privacy and the obfuscation of mobility traces (You et al., 2007; Krumm, 2009; Suzuki et al., 2010; Kato et al., 2012; Shokri et al., 2012; Bindschaedler and Shokri, 2016), no standard procedure has been established so far. One of the most common approaches to guarantee intractability is the aggregation of mobility traces with similar characteristics (e.g., similar origin). For example, the study of Balzotti et al. (2018) conducted a travel behavioral analysis using only aggregated cellular network data (in the form of hourly counts of mobile phones in spatial zones) without subjecting the tracked users to privacy risk. Another frequently deployed methodology for the construction of privacy-safe traces is based on generative models (Chow and Golle, 2009; Krumm, 2009; Kato et al., 2012; Shokri et al., 2012; Bindschaedler and Shokri, 2016). These models utilize observed traces to create realistic trajectories with similar semantics while at the same time ensuring intractability through location privacy protection mechanisms (LPPMs). LPPMs rely on a wide range of techniques including data perturbation (Andrés et al., 2013), data encryption (Mascetti et al., 2011), and fake data generation (Pelekis et al., 2011). For example, Isaacman et al. (2012) introduced a probabilistic modeling framework (coined as WHERE) to produce synthetic call detail records (CDRs), while Mir et al. (2013) enhanced the framework by adding a differential privacy mechanism (DP-WHERE) to guarantee privacy preservation. The interested reader can find an extensive review of relevant data anonymization techniques by Primault et al. (2019). Despite the wide range of available data anonymization techniques, the standard approach for the presentation of MPD is through aggregate origin–destination (ODs) matrices (Caceres et al., 2007; Bonnel et al., 2015; Tolouei and Alvarez, 2015). ODs ensure anonymity through the segmentation of the mobility traces into individual trips and the aggregation of these trips into groups with similar characteristics (e.g., trip purpose, time period of departure, mode of transport, etc.).
The increasing requirements for high-precision disaggregate mobility information, in conjunction with the data privacy regulations (i.e., GDPR-EU, APPI-Japan, etc.) that promote the aggregated publishing of information, have led researchers to experiment with data disaggregation methodologies. Recently, Huber and Lißner (2019) utilized aggregate cycling data obtained from the Strava app to synthesize disaggregate mobility data. Their approach applies a double-constrained routing algorithm on aggregate OD cycling demand to derive single bicycle routes. However, their model does not aim at the reproduction of the cycling travel demand through individual cycling traces but rather on the development of a bicycle route choice model based on the OD information. The possibility of synthesizing travel demand based on aggregated data from TSPs has been recently evaluated by Anda et al. (2020). Their Markovian-based approach allows the synthesis of realistic daily tours using aggregate joint distributions (histograms) that can be provided by TSPs since they are considerably less likely to raise data privacy concerns. Multiple different model architectures were evaluated over a large dataset of 1 million synthetic travelers and resulted in a remarkably high accuracy (≥95%) in terms of replicating the observed travel patterns. A potential drawback of the methodology is its reliance on multiple and very detailed hourly distributions at the zonal level (e.g., duration of stay time in a zone by hour, number of people transitioning to a previously unvisited zone by zone and departure hour, etc.).
To the best knowledge of the authors, except from the above-mentioned studies and the relevant work supporting this paper (Ballis and Dimitriou, 2020a,b,c), no other study has attempted the exploitation of ODs for the synthesis of mobility data at the person level. The contribution of this study is two-fold. In particular, the study:
• Showcases the extendibility of the framework to incorporate and exploit all the available dimensions of the inputted ODs. In this implementation, the focus has been placed on multimodality and, in particular, on the typical scenario where the available ODs are segmented by time period, trip purpose, as well as by the transport mode used to complete each trip.
• Assesses the scalability of the framework by applying the methodology on ODs describing the mobility patterns for the whole metropolitan area of Tokyo, Japan (11.6 million trips in total).
The next section (section Materials and Methods) presents the methodology, while section Large-Scale Experiment presents the large-scale scenario used to evaluate the framework. Finally, \* MERGEFORMAT section Discussion discusses the results and concludes the study.
Materials and Methods
Overview
Mobility is a phenomenon that unravels continuously both in space and time, but often, its analysis requires the discretization of the spatiotemporal domain. The most common approach entails the division of space into smaller areas (usually referred to as zones) and the division of time into consecutive time windows, referred to as time periods. Using this definition enables the grouping of trips based on their origin, destination, and time of departure. Depending on the purposes of each application, ODs can be further segmented based on additional dimensions such as the transport mode or the purpose of each trip. Nonetheless, the capturing of mobility in multiple ODs does not negate the continuity of the phenomenon, and this study strengthens the argument that it is indeed possible to unveil continuous mobility patterns based on discretized snapshots of mobility.
A key observation supporting the here presented methodology is the fact that the vast majority of the population begins and ends their daily activity schedules at home (Bowman, 1998; Schoenfelder and Axhausen, 2001; Schneider et al., 2020). Consequently, the trips included in ODs should belong to longer home-based trip chains (often referred to as tours). This attribute holds particularly true for ODs deriving from urban sensing data sources (e.g., mobile phone data, GPS, etc.) since they are built by continuously tracking the movements of mobile phone holders. This study exploits this observation and attempts to synthesize continuous mobility traces, in the form of tours, based on aggregate ODs.
The identification of continuous mobility traces within ODs is accomplished in a modular fashion following the methodology having been previously presented by the authors (Ballis and Dimitriou, 2020a,b). Nonetheless, for the completeness of presentation, the outline of that methodology is also presented here. Firstly, the graph generation module exploits the connectivity matrices of the input OD matrices for the conversion of the latter into a single directed graph. This conversion allows the expression of trip chains as sequences of nodes (i.e., paths), where each edge of the path is directly associated with a trip from the inputted ODs. More importantly, the conversion of ODs into a graph allows the analysis of mobility through the prism of the well-established discipline of graph theory. The second step, referred to as the identification module, exploits this concept and applies a sophisticated graph theory-based process for the efficient enumeration of all the possible tours within the graph. The output of this step is a set of all the possible tours that can take place using the trips of the input ODs. For ODs of realistic scale (e.g., hundreds of OD pairs), the enumeration of tours in a graph can prove particularly challenging (mainly due to the combinatorial explosion issue), but the predictability of travel behavior patterns (Schneider et al., 2013) can significantly simplify the process. For example, tours with unrealistic durations or with an excessive number of visited locations (e.g., above six) can be excluded from the search space and, as a result, support the tackling of combinatorial explosion. The completion of the second step produces a set of plausible tours that are referred to as the candidate tours. At the third step, the optimization module deploys a combinatorial optimization method (either an exact method or a metaheuristic) in order to identify the combination of the candidate tours that reproduces the travel demand patterns as captured in the inputted ODs. More precisely, the optimizer attempts to identify the non-negative frequency of usage for each of the candidate tours so that the difference between the total number of trips in the inputted ODs and the total number of trips required for the completion of the tours in the solution is minimized.
In the case that additional information describing the characteristics of the expected output is available, that calibration data can be translated into constraints, forcing the optimizer to identify a solution that adheres to that calibration data. The provision of a calibration dataset, although not mandatory, increases the likelihood of identifying the most realistic solution out of all the possible ones. The above-described process is presented in the flowchart of Figure 1.
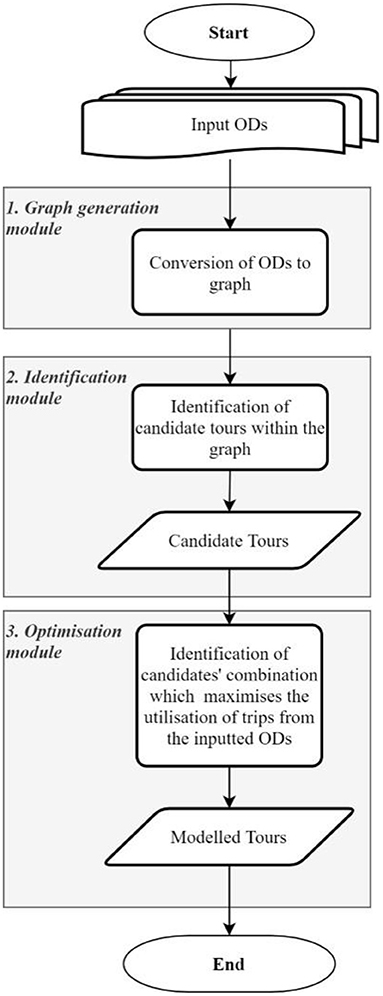
Figure 1. Flowchart of the suggested methodology.
Problem Formulation
Formulation
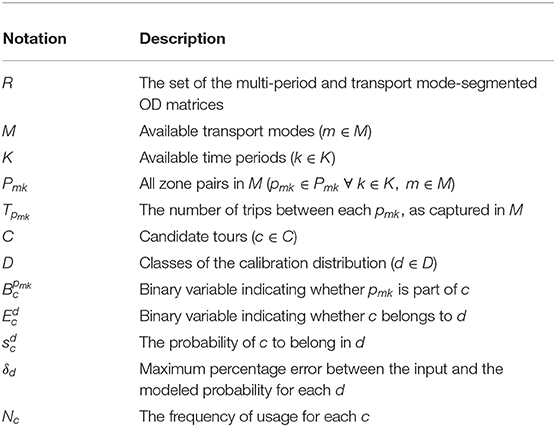
Let R be a set of multi-period (k ∈ K) and transport mode-segmented (m ∈ M) ODs which describe the mobility patterns of a certain population. Given this set R, one can deduct the connectivity matrix of the corresponding graph and then express all the home-based multimodal tours as sequences of nodes (i.e., paths). The objective of the optimization problem (4) is the identification of the frequency of each candidate tour (Nc ∀ c ∈ C) so that the difference between the total number of trips in the inputted ODs and the trips required to form the candidate tours in the solution is minimized.
The calculation of the optimum frequency for each tour (Nc) must take place while respecting the travel demand information included in the input ODs. This is achieved by the hard constraint (5), which guarantees that the required trips to form the solution will not exceed the available trips in the inputted ODs. In addition, constraint (6) assures that Nc does not turn negative, though without precluding the optimizer from excluding candidate tours from the final solution (i.e., Nc can be 0). The objective function takes the minimum value of 0 when the number of trips in R and those required to complete the tours in the solution are the same.
Due to the combinatorial nature of the problem, it is possible that multiple global optima can exist (Redondo et al., 2011) and that, consequently, more than one combinations of tours can result to optimal solutions. For this reason, a mechanism to guide the optimization routine toward the identification of a solution that closely reflects reality is required. Under the presence of a (joint) calibration distribution describing the characteristics of the expected tours (e.g., total travel time, number of legs, modes of transport used, etc.), the output can be shaped accordingly. To achieve so, each tour in C is assigned to the class of the distribution (d) that best describes it. The adherence of the output to the calibration information is achieved by constraint (7), which guarantees that the output will follow that distribution. The introduction of the term δd allows for tolerance between the observed and the modeled distributions and supports the feasibility of the solution in cases where an exact match between the two distributions cannot be achieved. The optimization problem is mathematically formulated as:
subject to:
The next section presents the results obtained by the application of the methodology on an excessively large-scale experiment based on 5 million multi-modal tours.
Large-Scale Experiment
The Open PFLOW Dataset
As has been already discussed, the acquisition of disaggregate information regarding mobility (e.g., trip chains, tours, activity schedules, etc.) can prove a difficult and/or costly task. Fortunately, a large-scale, accurate, and open dataset describing mobility at the person level has been published by Kashiyama et al. (2017). The Open PFLOW1 dataset reports the minute-by-minute locations as well as the currently used mode of transport (bicycle, car, or train) for thousands of individuals around the wider area of Tokyo, Japan (Figure 2). The dataset is fully compliant with privacy regulations since the data are synthetic and therefore can be used for any purpose without raising anonymity concerns. A sample of the dataset can be found in Table 1. The Open PFLOW dataset constitutes the basis over which the suggested methodology was evaluated. The stationary points presented in the dataset were converted into complete tours, a sample of which is presented in Table 2. Since the trip purpose information is missing from the dataset, the first and the last trip of each trace are classified as Home-Based while all the rest as Non-Home-Based. For the purposes of this analysis, incomplete tours (i.e., trip chains not returning to the origin location) were excluded from the analysis. In order to increase the size of the problem, the total 617,000 mobility traces present in Open PFLOW were sampled with replacement in order to create an upscaled population of 5 million tours. These observed tours form the ground truth against which the suggested methodology was evaluated.
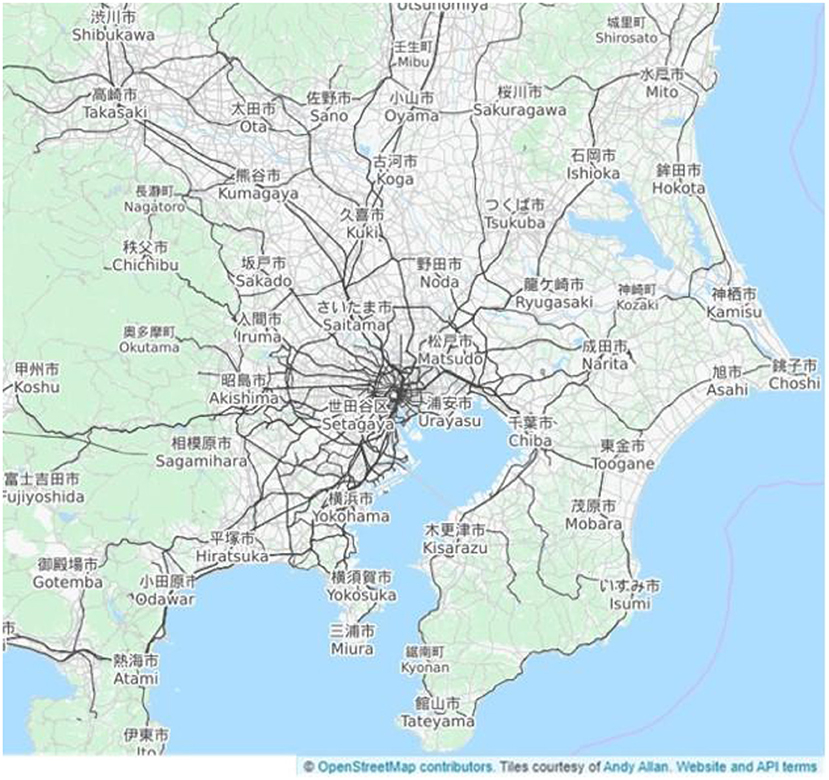
Figure 2. The multimodal transport network of megacity Tokyo.
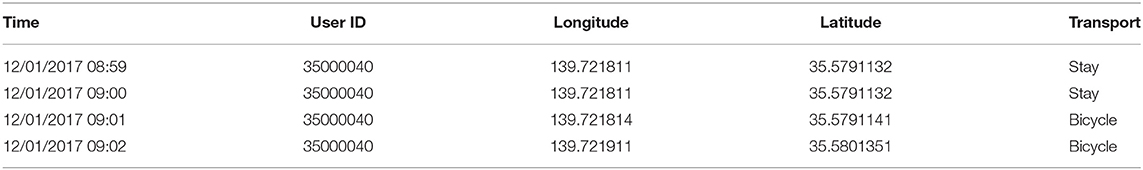
Table 1. Extract from the Open PFLOW dataset.
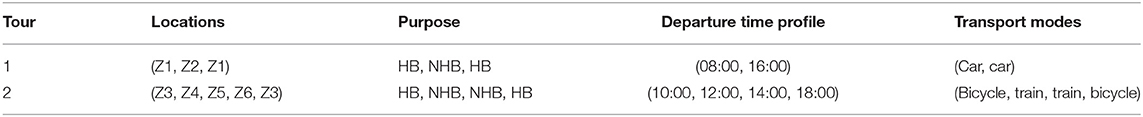
Table 2. Sample of the observed tours from the Open PFLOW dataset.
Aggregation to ODs
Tours are, by definition, trip chains consisting of at least two legs (a Home-Based outbound and a Home-Based inbound trip), while they can also include intermediate Non-Home-Based trips. For the case of the observed tours, the number of individual trips required for their completion is 11,636,471. These trips were able to be aggregated into a set of multi-period-, purpose-, and mode-segmented ODs since the (a) origin, (b) destination, (c) purpose (Home-Based and Non-Home-Based), (d) departure time, and (e) the transport mode for each trip are known. The preparation of the above-mentioned ODs requires the definition of a zoning as well as a temporal classification system. For that purpose, the wider area of Tokyo was divided into a grid of 1 km2 (12,138 zones in total), while the temporal domain was discretized into 12 groups of 2 h duration each. Following this classification, the trips required for the completion of the observed tours were classified into 66 observed ODs, whose totals are summarized in Table 3. In addition, Figure 3 visualizes this information by depicting the total number of trips originating from each of the 12,138 zones of the network, segmented by mode of transport.
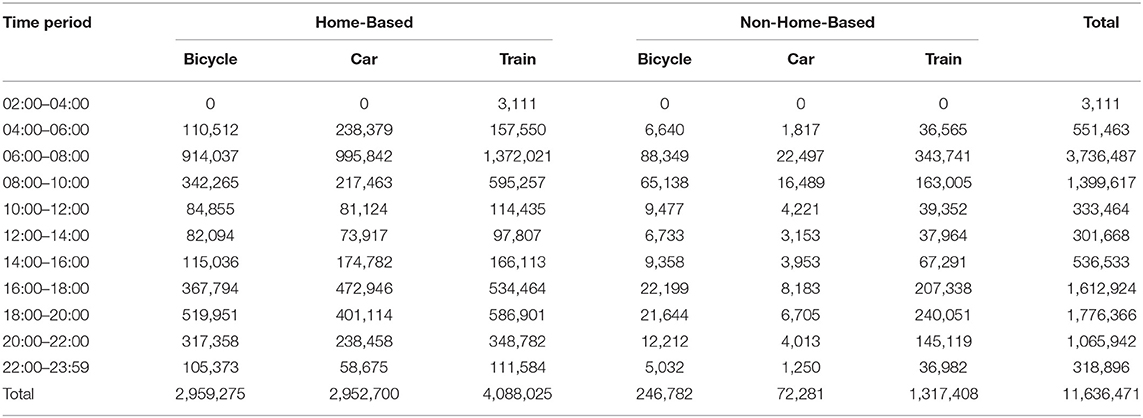
Table 3. Total number of trips in observed origins–destinations (ODs) by time period, purpose, and transport mode.
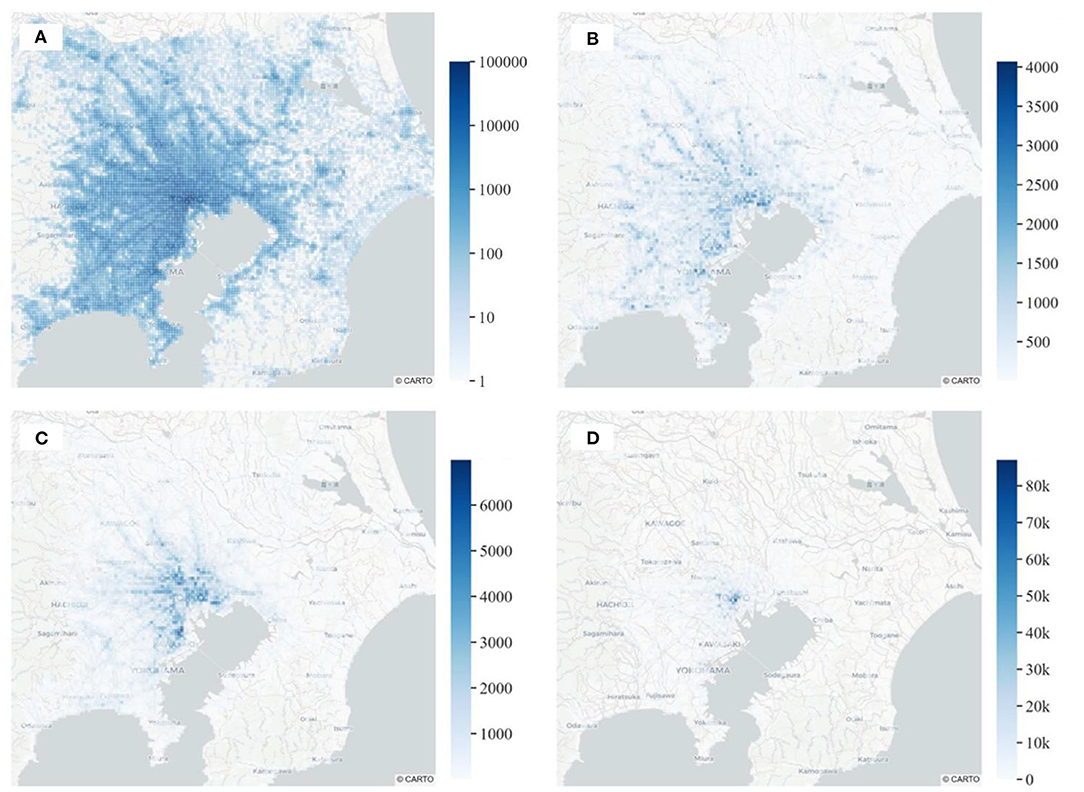
Figure 3. Map of total daily trip origins per transport mode by (A) all transport modes, (B) car, (C) bicycle, and (D) train.
The Calibration Distribution
As already discussed, the combinatorial nature of the problem allows for the manifestation of multiple optimal solutions. Nonetheless, the realness of the output can be enhanced by the provision of a high-level calibration (joint) distribution describing various dimensions of the expected output. In principle, the calibration distribution can be supplied by the data provider itself (e.g., the TSP) since the data are high level, aggregate, and anonymous. In the case that this is not possible, traditional travel surveys can be used instead, although the accuracy of the methodology is likely to decrease.
For the purposes of this study, the characteristics of the observed tours have been utilized to categorize the tours into classes based on (a) the total distance, (b) the time departure profile, and (c) the transport modes used for the completion of the tours (Figure 4). The distance band has been set at 5 km, the time departure profile follows the temporal classification of the inputted ODs (i.e., 2-h periods), while the available modes are bicycle, car, and train. A statistical analysis based on this classification enabled the calculation of the share of each class in the sample and subsequently allowed the creation of the calibration distribution. For reasons of visual clarity, the distributions of the unimodal and multimodal (Figure 4, top and bottom, respectively) tours are presented separately. In addition, Figure 5 presents the pairwise marginals of the three dimensions defining the calibration distribution.
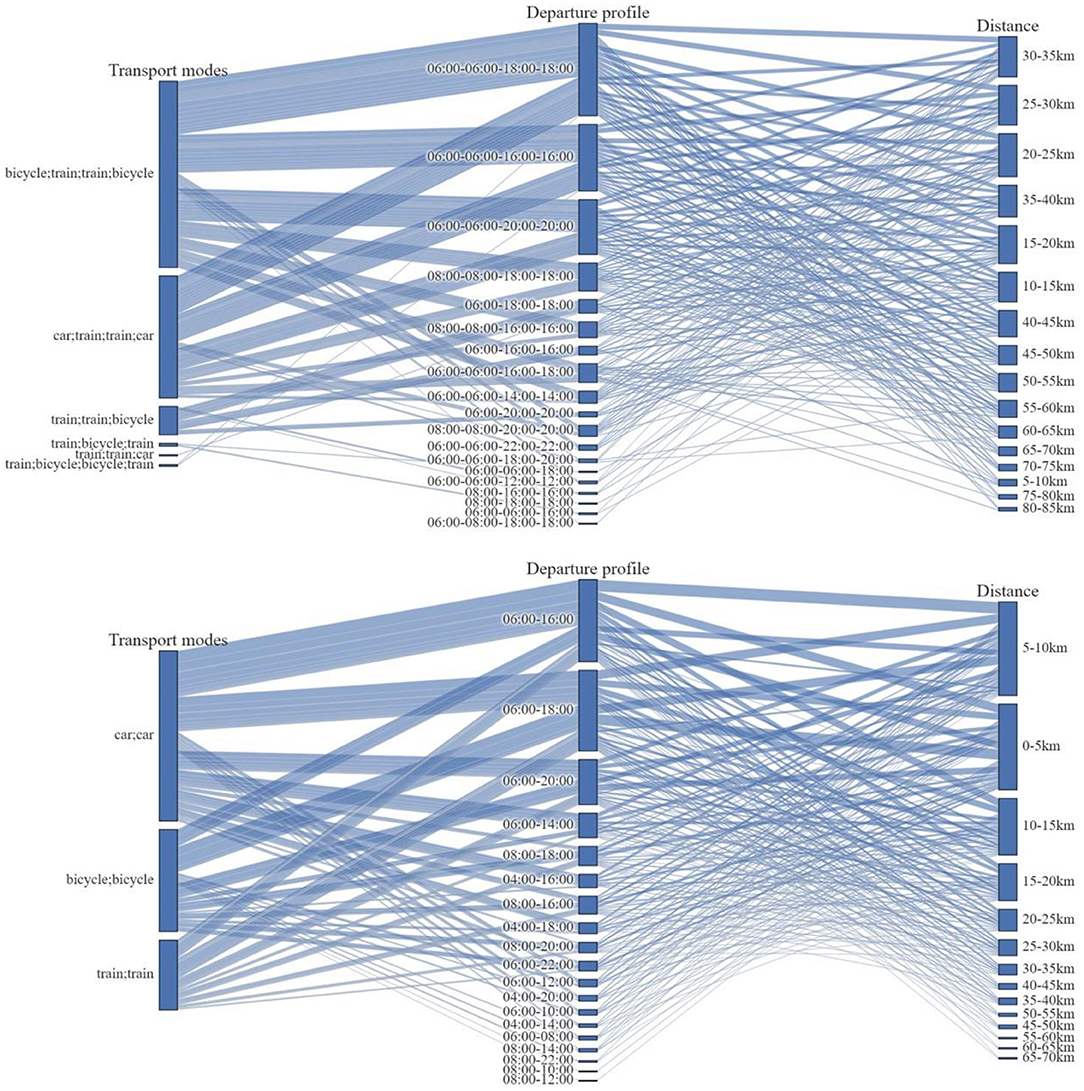
Figure 4. Presentation of the three-dimensional calibration distribution for the multimodal (Top) and unimodal (Bottom) tours.
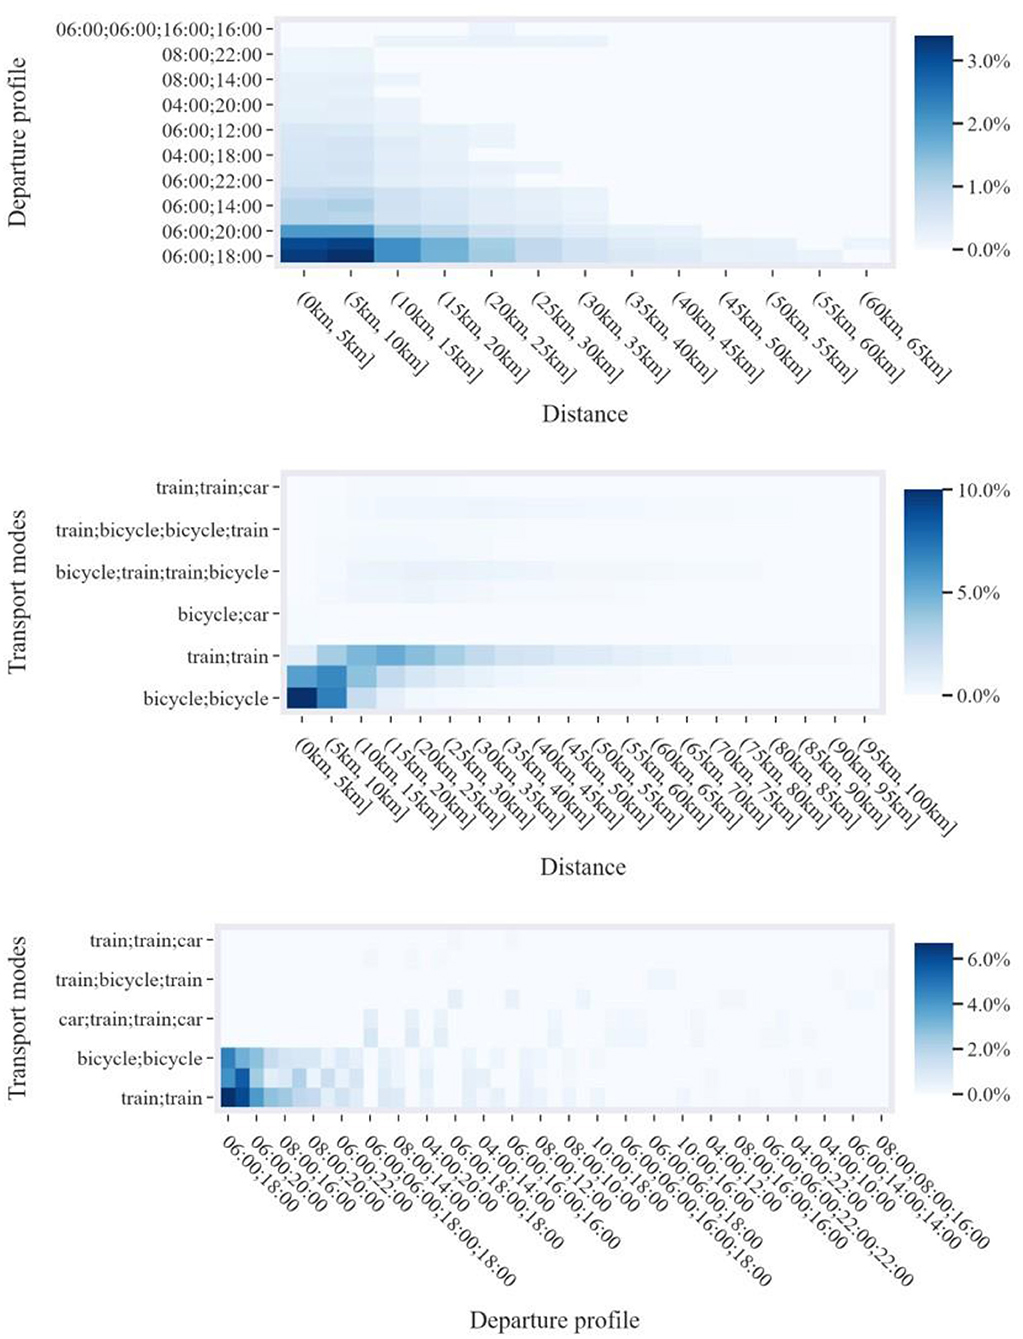
Figure 5. Pairwise marginals of the three dimensions defining the calibration distribution. Each plot presents the 100 classes with the highest share.
Apart from the beneficial role of the calibration distribution in the identification of the most realistic solution, the distribution is also exploited to counter the combinatorial explosion issue. In particular, tours belonging into classes with particularly low or even zero likelihood can be excluded from the candidate tours set and therefore reduce the size of the problem. As an example, the analysis of the calibration distribution indicated that only 2% of the observed tours are completed in more than four legs; therefore, the effect of their exclusion, for the sake of simplification, can be well-justified. Additionally, the calibration distribution revealed that no observed tour exceeds a total distance of 95 km; therefore, the identification of candidate tours was also limited by that threshold. More importantly, out of the 347,776 plausible classes which can be defined for multimodal tours of up to four legs, the 95-km distance binned in the 5-km groups and three available transport modes, only 8,306 present a share in the calibration distribution; as such, all candidate tours not belonging in those non-zero classes were excluded. A significant benefit of this approach is that impossible or very infrequent travel behaviors (e.g., tours not respecting vehicle availability) will not be present in the calibration distribution; therefore, no additional mechanism is required for the preclusion of unrealistic tours.
Configuration Parameters
This section provides information useful for the replication of the suggested methodology. The required parameters for the execution of the process are grouped based on the process step (i.e., module) they relate to.
Parameters for the Identification Module
The most crucial parameter for this module is the maximum number of legs and the maximum distance of the candidate tours that will be identified. In order to render the problem solvable in tractable time, the identification module was constrained to enumerate all tours whose total traveled distance did not exceed 95 km and the number of visited zones (i.e., legs) that did not exceed four. Numerous studies have showcased that the majority of tours do not include more than four legs (Wallner et al., 2018; Schneider et al., 2020). In addition, a brief analysis of the UK National Travel Survey 2016 (Department for Transport, 2017) indicated that only 0.5% of the recorded tours exhibited more than five legs, supporting the argument to limit the maximum number of legs in tours at this level. Finally, the open PFLOW dataset includes roughly 2% of tours with more than four legs, which were excluded from the analysis in order to simplify the problem.
Parameters for the Optimization Module
The optimization module is implemented via the commercial branch-and-bound optimizer CPLEX (IBM, 2020), with the only parameter being the maximum time of the optimization set at 6 h. In terms of constraints, the maximum deviation between the classes of the calibration and the modeled distribution (i.e., δd) was set at ±1.0%.
The preparation of the input ODs and the calibration distribution allows the execution and, subsequently, the evaluation of the methodology on a realistic, very large-scale scenario. The results of this evaluation are presented below.
Results
The execution of the previously presented methodology resulted in a set of 1,097,117 unique candidate tours that were used to form a solution of 4,807,364 tours in the final solution. These modeled tours require 11,161,651 trips for their completion compared to the 11,636,471 trips required by the observed tours (96% of trips included in the modeled solution).
In terms of performance, the whole process was executed in approximately 30 h (108,452 s) on a 12-core Intel® Xeon CPU powered computer with 32 Gb of available RAM. The majority of the execution time (24 h) was devoted to the enumeration of all the possible paths in the OD-derived graph (identification module), while the last 6 h were devoted to the optimization part of the methodology. The processing time requirements, although not negligible, can be significantly reduced by additional processing cores due to the parallel processing implementation of the approach.
Despite the beneficial role of the calibration distribution in the optimization process, the sheer size, and complexity of the problem render the identification of the optimum solution a demanding task. Figure 6 presents the distribution of the number of candidate tours in the distribution classes. As can be observed, the majority of the distribution classes include more than 10 candidate tours, while a significant portion of the distribution classes include more than 100 or even 2,000 candidates. As a consequence, the task of identifying the optimal combination between millions of alternatives based solely on high-level calibration data is evidently a very complex procedure.
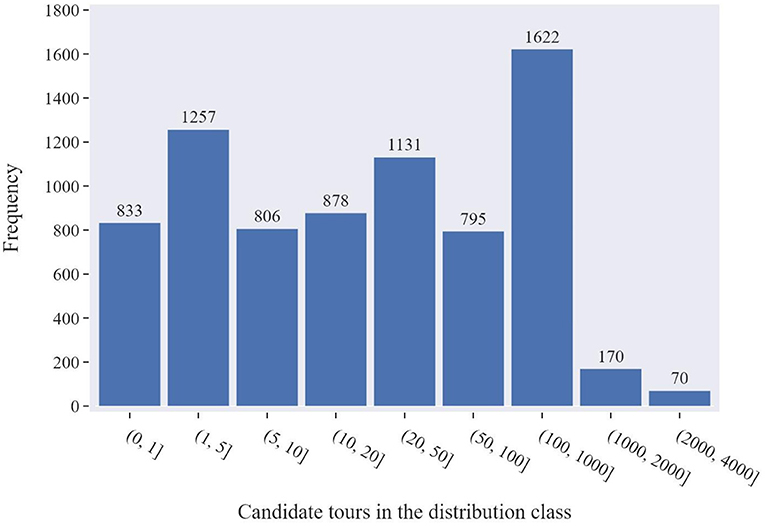
Figure 6. Distribution of the number of candidate tours in the distribution classes.
The next section delves into the evaluation of the methodology in terms of the quality of the outputted ODs, the fidelity of the modeled tours, as well as in terms of the adherence to the provided calibration distribution.
Comparison Against the Observed ODs
The first level of analysis evaluates the performance of the methodology in utilizing the available trips in the observed ODs for the production of disaggregate mobility traces (i.e., tours). Based on the obtained results (Table 4), the methodology did not manage to include only 474,870 trips out of the 11,636,471 observed trips (i.e., 4% difference). This calculation can also be visually verified in Figure 7, where it is showcased that the number of missing trips by zone of origin is considerably smaller than the total observed trips.
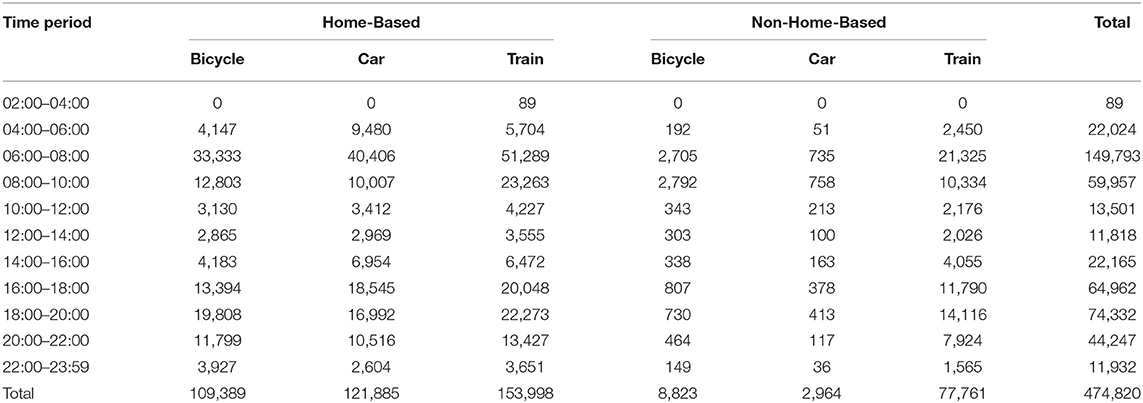
Table 4. Difference in the total number of trips between the observed and the modeled origins–destinations (ODs).
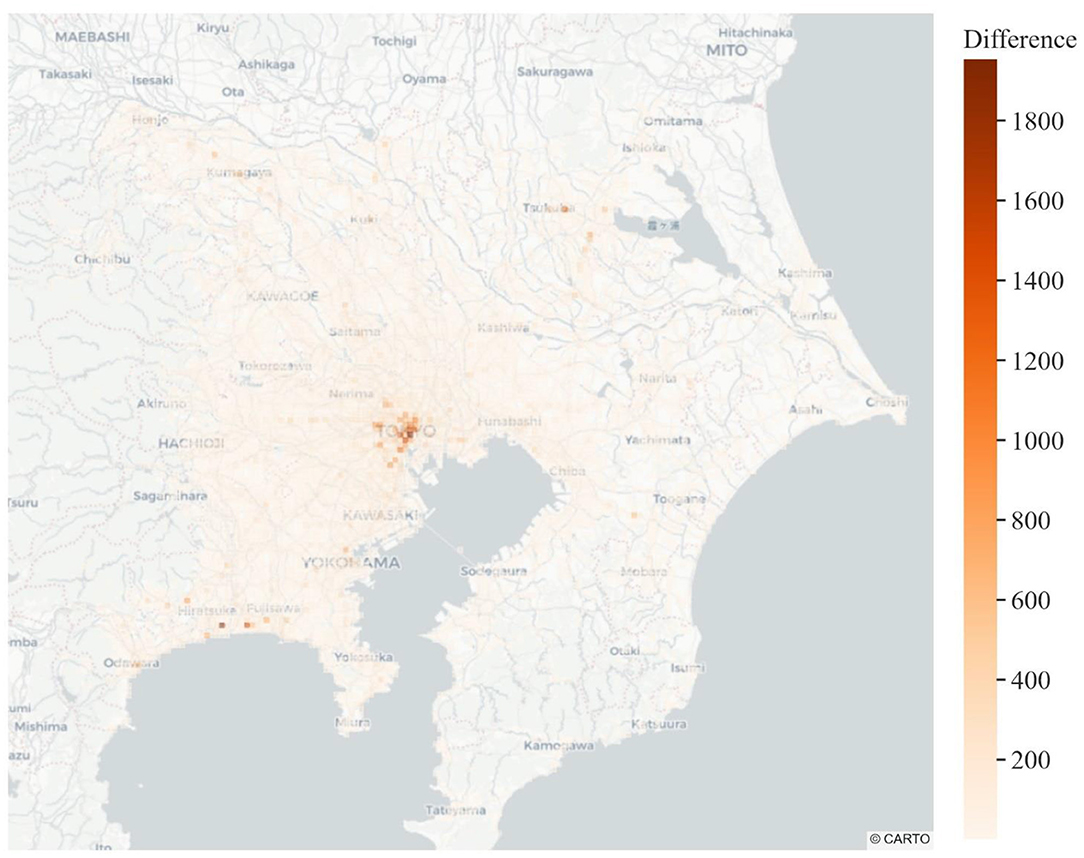
Figure 7. Total trip origin difference between the observed and modeled origins–destinations (ODs).
The accuracy of the methodology is also verified via the following scatter plot (Figure 8). The plot depicts the number of trips within each of the 66 observed ODs and the respective number in the modeled ODs. As can be seen, the methodology has managed to identify a set of tours resulting very similar to the observed travel demand patterns. This argument is supported by the particularly high R2 value and the close to 1 slope of the curve.
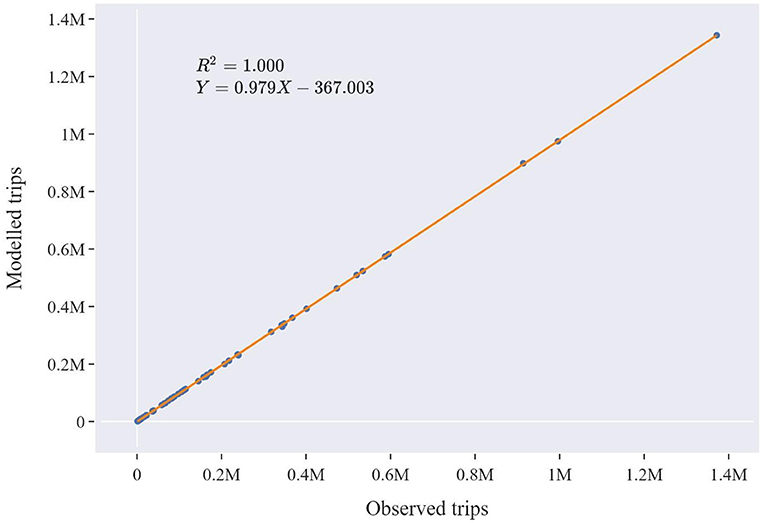
Figure 8. Scatter plot comparing the observed and the modeled origin–destination (OD) matrices.
Comparison Against the Observed Tours
Based on the previous results, it can be argued that the methodology produces ODs that closely resemble their corresponding observed ODs. However, the quality of the modeled tours must also be evaluated in terms of their resemblance to the observed input at the disaggregate level. As has been already mentioned, the identification of a solution as similar as possible to the observed tours is supported by the provision of the calibration distribution. Based on the obtained results, 81.7% of the observed tours were perfectly replicated across all the defining dimensions (i.e., locations, departure time profile, and transport modes). The distribution of error between the combinations of the defining dimensions is presented in Figure 9. As can be observed, the main element driving the misalignment between the observed and the modeled tours is the sequence of the visited locations (explaining 7.4% of the discrepancy). However, this figure is arguably justified considering the tremendously high number of possible sequences of zones in the observed ODs (12,000+) and the very aggregate information used for the calibration of this dimension (i.e., distribution of tours' total distance). The contributions of the departure profile and the transport mode sequence are significantly lower and attribute to around 3.1 and 4.7%, respectively.
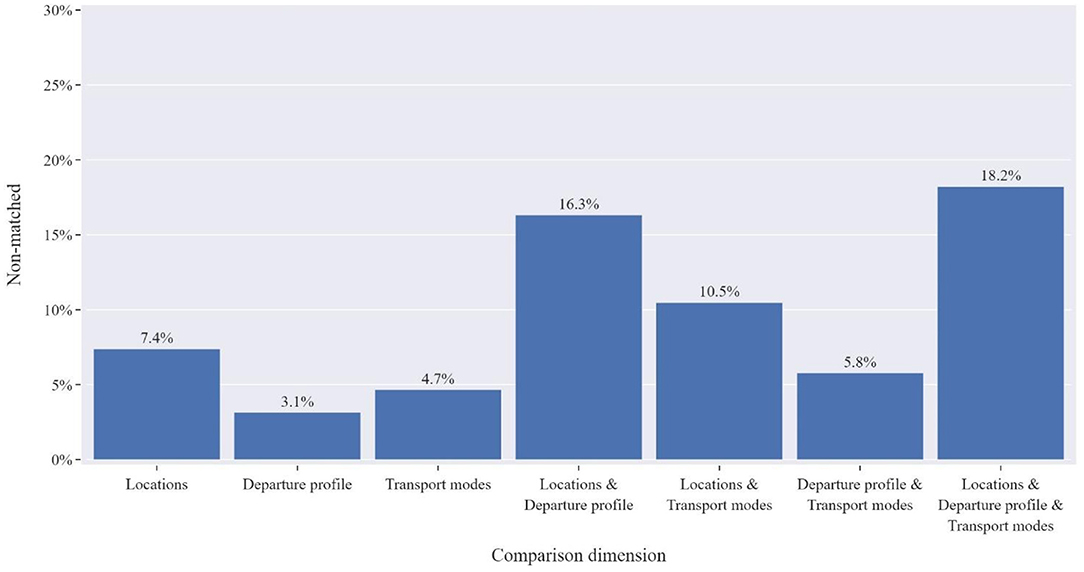
Figure 9. Assessment of mismatched tours based on the defining dimensions.
Figure 10 presents the evaluation regarding the matching between the observed and the modeled tours' characteristics in the form of a scatter plot where each point on the diagrams represents one out of the 8,362 calibration distribution classes. For reasons of visual clarity, the results are segmented by the number of legs in each tour. As can be observed, the projection of the calibration data on the output is very accurate, with an R2 of around 0.98 and the slope from 0.858 to 0.947. In addition, the Jensen and Shannon distance (Endres and Schindelin, 2003), a metric used for the comparison between two distributions, was calculated at 9%, indicating strong resemblance between the modeled and the calibration distribution.
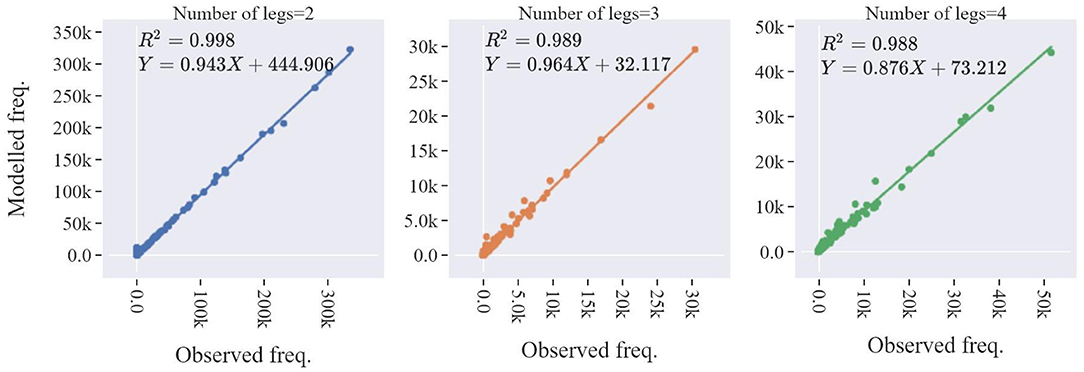
Figure 10. Scatter plot comparison of the calibration distribution by number of legs.
Explanatory Analysis
After having established the validity of the modeled tours, the analysis proceeds with the exploitation of the disaggregate output for explanatory purposes. Although not exhaustive, the following analysis showcases the additional explanatory depth which can be achieved by the conversion of aggregate ODs to disaggregate mobility traces. It should also be emphasized that the rest of the analysis could not have taken place based only on the initial input (i.e., aggregate ODs and the calibration distribution). For example, the diverse patterns characterizing the various types of multimodal chains presented in Figure 11 would have remained unhidden without the disaggregation of the input. As can be observed, the spatial profile of the tours varies significantly in terms of the zone of origin. Residents outside the city center are more likely to use their car (Figure 11B), while people living in the center are more likely to utilize a bicycle (Figure 11A) or train (Figure 11C) for the completion of their diurnal tours. Interestingly, Figures 11D–F indicate that multimodal tours are more evident for people residing nearby (but not inside) the city center.

Figure 11. |Tours' origins by zone and transport mode sequence. (A) Transport modes: bicycle; bicycle, (B) transport modes: car; car, (C) transport modes: train; train, (D) transport modes: car; train; train; car, (E) transport modes: bicycle; train; train; bicycle, and (F) transport modes: train; bicycle; bicycle; train.
Finally, the effect of the temporal dimension on multimodal tours is assessed in Figure 12, where the departures from and the arrivals to home by the most frequent types of multimodal tour are presented. As can be observed, all tour origins, and regardless of their transport mode composition, reach their peak around 06:00 h. However, the departure time to home seems to be strongly influenced by the type of multimodal chain since the departure profiles vary considerably across the different types (e.g., tours including the use of bicycle seem to reach their departure peak later than unimodal car and train tours).

Figure 12. Diurnal distribution of departures from (Top) and to (Bottom) home by transport mode sequence.
Discussion
The ubiquity of urban sensing devices (e.g., smartphones, GPS trackers, etc.) has allowed the monitoring of personal mobility at unprecedented levels of accuracy. However, justified privacy concerns demand the anonymization of such personal information prior to their usage. Furthermore, the increasing adoption of data protections acts (e.g., GDPR-EU, APPI-Japan, etc.) is expected to render the acquisition of personal information (even for purely scientific purposes) a particularly difficult task. To overcome this issue, mobility data providers (e.g., TSPs, smartphone applications, etc.) often publish mobility traces in the form of aggregate origin–destination (OD) matrices instead of individual traces. The aggregate representation of mobility in the form of ODs can indeed bolster privacy and eliminate privacy concerns.
Despite the long-proven value of ODs at describing the mobility patterns at a high level, their aggregate nature deprives them of the ability to retain significant dimensions of mobility such as trip interdependency and trip chaining. From the standpoint of modern transportation requirements, the inability to utilize granular mobility information poses a considerable barrier for the application of sophisticated modeling paradigms (e.g., agent- and activity-based modeling). Recently completed studies by the authors (Ballis and Dimitriou, 2020a,b,c) have showcased the potential to create disaggregate mobility traces from privacy-safe data sources, namely, aggregate ODs and calibration information (in the form of a joint distribution) describing the high-level characteristics of the expected output. The suggested methodology employs advanced graph theory and combinatorial optimization concepts for the identification of a plausible set of disaggregate mobility traces that result in the same travel demand patterns as described in the inputted ODs. Since both the ODs as well as the calibrating distribution are aggregate, and therefore can be acquired without raising privacy concerns, the methodology proves as a viable alternative for the exploitation of urban sensing data toward the preparation of disaggregate, but privacy-safe, mobility information. This study expands and bolsters in a two-fold manner. Firstly, the study evaluates the scalability of the methodology by applying it on a particularly large-scale scenario where the inputted ODs cover the whole area of metropolitan Tokyo and include more than 11.6 million trips. Secondly, the study showcases the extendibility and the flexibility of the framework in incorporating and exploiting all the available dimensions of the input ODs, with the focus on this implementation being shifted to transport modes and multimodality. The proof that the methodology can accurately incorporate the dimension of multimodality into the process significantly enhances its explanatory capability since transport mode constitutes an integral component of travel behavior.
The spatiotemporal information available in the large-scale multi-period and transport mode-segmented ODs coupled with a calibrating distribution describing the characteristics of the observed traces in terms of distance, departure profile, and transport modes are utilized for the synthesis of disaggregate multimodal mobility traces. The application of the methodology on large-scale ODs deriving from the aggregation of 5 million observed tours (obtained from the open-source dataset “Open PFLOW”) converted 96% of the inputted demand (11,636,471 trips) into a set of 4,807,364 modeled multimodal tours (instead of the 5,000,000 observed), which match their observed counterparts by 80%. The accuracy of the methodology proves that aggregate and private-secure data sources such as ODs can be indeed used for the creation of disaggregate information suitable for in-depth mobility analysis. In addition, the complementary analysis on the modeled output highlighted the considerably improved granularity of the analysis, which can be conducted when the input consists of disaggregate mobility traces instead of aggregate ODs.
As a final remark, the authors want to emphasize that, despite the remarkable accuracy of the methodology and the considerable additional value which it brings to the analysis of mobility, some elements require further attention. Firstly, the effect of incorporating in the input ODs of trips not belonging to tours must be quantified since most of the available ODs are bound to include such trips. Secondly, the case where little, inaccurate, or even no calibration information is available should also be evaluated. Nonetheless, the above-presented study makes a clear argument in favor of the potential of the suggested methodology to exploit aggregate mobility information for the preparation of individual traces which can fuel in-depth and very sophisticated mobility analysis and modeling processes.
Data Availability Statement
Publicly available datasets were analyzed in this study. This data can be found at: https://github.com/sekilab/OpenPFLOW.
Author Contributions
HB: conception, data preparation, analysis, evaluation, and manuscript. LD: conception, evaluation, and manuscript. Both authors contributed to the article and approved the submitted version.
Conflict of Interest
The authors declare that the research was conducted in the absence of any commercial or financial relationships that could be construed as a potential conflict of interest.
Supplementary Material
The Supplementary Material for this article can be found online at: https://www.frontiersin.org/articles/10.3389/ffutr.2021.647852/full#supplementary-material
Footnotes
1. ^Available at: https://github.com/sekilab/OpenPFLOW.
References
Anda, C., Ordonez Medina, S., Arturo, S., Axhausen, K. W., and Medina, S. A. O. (2020). Synthesising Digital Twin Travellers Individual Travel Demand From Aggregated Mobile Phone Data Synthesising Digital Twin Travellers: Individual Travel Demand From Aggregated Mobile Phone Data. Zurich. doi: 10.3929/ethz-b-000442517
Andrés, M. E., Bordenabe, N. E., Chatzikokolakis, K., and Palamidessi, C. (2013). “Geo-indistinguishability: Differential privacy for location-based systems,” in Proceedings of the ACM Conference on Computer and Communications Security (Seoul), 901–914. doi: 10.1145/2508859.2516735
Angria, S. L., Dwi Sari, Y., Zarlis, M., and Tulus (2018). “Data-driven Modelling for decision making under uncertainty,” in IOP Conference Series: Materials Science and Engineering (Medan). doi: 10.1088/1757-899X/300/1/012013
Antoniou, C., Dimitriou, L., and Pereira, F. (2019). Mobility Patterns, Big Data and Transport Analytics: Tools and Applications for Modeling. Elsevier.
Ballis, H., and Dimitriou, L. (2020a). Deriving daily activity schedules from dynamic, purpose dependent origin-destination matrices. Transp. Res. Rec. 2674, 375–386. doi: 10.1177/0361198120939094
Ballis, H., and Dimitriou, L. (2020b). Revealing personal activities schedules from synthesizing multi-period origin-destination matrices. Transp. Res. Part B Methodol. 139, 224–258. doi: 10.1016/j.trb.2020.06.007
Ballis, H., and Dimitriou, L. (2020c). Optimal synthesis of tours from multi-period origin-destination matrices using elements from graph theory and integer programming. Eur. J. Transp. Infrastruct. Res. 20, 1–21. doi: 10.18757/ejtir.2020.20.4.5303
Balzotti, C., Bragagnini, A., Briani, M., and Cristiani, E. (2018). Understanding Human Mobility Flows from Aggregated Mobile Phone Data. IFAC-Papers OnLine 51, 25-30. doi: 10.1016/j.ifacol.2018.07.005
Bassolas, A., Ramasco, J. J., Herranz, R., and Cantú-Ros, O. G. (2019). Mobile phone records to feed activity-based travel demand models: MATSim for studying a cordon toll policy in Barcelona. Transp. Res. Part A Policy Pract. 121, 56–74. doi: 10.1016/j.tra.2018.12.024
Batty, M., Axhausen, K. W., Giannotti, F., Pozdnoukhov, A., Bazzani, A., Wachowicz, M., et al. (2012). Smart cities of the future. Eur. Phys. J. Spec. Top. 214, 481–518. doi: 10.1140/epjst/e2012-01703-3
Bindschaedler, V., and Shokri, R. (2016). “Synthesizing plausible privacy-preserving location traces,” in IEEE Symposium on Security and Privacy, 546–563. doi: 10.1109/SP.2016.39
Bonnel, P., Hombourger, E., Olteanu-Raimond, A. M., and Smoreda, Z. (2015). Passive mobile phone dataset to construct origin-destination matrix: potentials and limitations. Transp. Res. Proc. 11, 381–398. doi: 10.1016/j.trpro.2015.12.032
Bowman, J. L. (1998). The Day Activity Schedule Approach to Travel Demand Analysis. Cambridge, MA: Massachusetts Institute of Technology.
Caceres, N., Romero, L. M., and Benitez, F. G. (2013). Inferring origin-destination trip matrices from aggregate volumes on groups of links: a case study using volumes inferred from mobile phone data. J. Adv. Transp. 47, 650–666. doi: 10.1002/atr.187
Caceres, N., Wideberg, J. P., and Benitez, F. G. (2007). Deriving origin-destination data from a mobile phone network. IET Intell. Transp. Syst. 1, 15–26. doi: 10.1049/iet-its:20060020
Calabrese, F., Diao, M., Di Lorenzo, G., Ferreira, J., Ratti, C., Lorenzo, G., et al. (2013). Understanding individual mobility patterns from urban sensing data - a mobile phone trace example. Transp. Res. Part C Emerg. Technol. 26, 301–313. doi: 10.1016/j.trc.2012.09.009
Calabrese, F., Ferrari, L., and Blondel, V. D. (2014). Urban sensing using mobile phone network data: a survey of research. ACM Comput. Surv. 47:25. doi: 10.1145/2655691
Chow, R., and Golle, P. (2009). “Faking contextual data for fun, profit, and privacy,” in Proceedings of the ACM Conference on Computer and Communications Security (New York, NY: ACM Press), 105–108. doi: 10.1145/1655188.1655204
Çolak, S., Alexander, L. P., Alvim, B. G., Mehndiratta, S. R., and Gonzalez, M.C. (2015). Analyzing cell phone location data for urban travel. Transp. Res. Rec. J. Transp. Res. Board 2526, 126–135. doi: 10.3141/2526-14
Cottrill, C. D., Pereira, F. C., Zhao, F., Dias, I. F., Lim, H. B., Ben-Akiva, M. E., et al. (2013). Future mobility survey. Transp. Res. Rec. 2354, 59–67. doi: 10.3141/2354-07
De Montjoye, Y. A., Hidalgo, C. A., Verleysen, M., and Blondel, V. D. (2013). Unique in the Crowd: the privacy bounds of human mobility. Sci. Rep. 3, 1–5. doi: 10.1038/srep01376
Dwork, C., Naor, M., Pitassi, T., and Rothblum, G. N. (2010). “Differential privacy under continual observation,” in Proceedings of the Annual ACM Symposium on Theory of Computing (Cambridge, MA), 715–724. doi: 10.1145/1806689.1806787
Endres, D. M., and Schindelin, J. E. (2003). A new metric for probability distributions. IEEE Trans. Inf. Theory 49, 1858-1860. doi: 10.1109/TIT.2003.813506
Ghahramani, M., Zhou, M., and Wang, G. (2020). Urban sensing based on mobile phone data: approaches, applications, and challenges. IEEE/CAA J. Autom. Sin. 7, 627–637. doi: 10.1109/JAS.2020.1003120
Huang, H., Cheng, Y., and Weibel, R. (2019). Transport mode detection based on mobile phone network data: a systematic review. Transp. Res. Part C Emerg. Technol. 101, 297–312. doi: 10.1016/j.trc.2019.02.008
Huber, S., and Lißner, S. (2019). Disaggregation of aggregate GPS-based cycling data – how to enrich commercial cycling data sets for detailed cycling behaviour analysis. Transp. Res. Interdiscip. Perspect. 2:100041. doi: 10.1016/j.trip.2019.100041
IBM (2020). CPLEX Optimizer. IBM. Available online at: https://www.ibm.com/analytics/cplex-optimizer (accessed July 28, 2018).
Isaacman, S., Becker, R., Cáceres, R., Martonosi, M., Rowland, J., Varshavsky, A., et al. (2012). “Human mobility modeling at metropolitan scales,” in MobiSys'12 - Proceedings of the 10th International Conference on Mobile Systems, Applications, and Services (Low Wood Bay Lake), 239–251. doi: 10.1145/2307636.2307659
Jha, V. (2015). Study of Machine Learning Methods in Intelligent Transportation Systems. Reno, NV: University of Nevada.
Kadhim, N., Mourshed, M., and Bray, M. (2016). Advances in remote sensing applications for urban sustainability. Euro Mediterranean J. Environ. Integr. 1, 1–22. doi: 10.1007/s41207-016-0007-4
Kashiyama, T., Pang, Y., and Sekimoto, Y. (2017). Open PFLOW: Creation and evaluation of an open dataset for typical people mass movement in urban areas. Transp. Res. Part C Emerg. Technol. 85, 249–267. doi: 10.1016/j.trc.2017.09.016
Kato, R., Iwata, M., Hara, T., Suzuki, A., Xie, X., Arase, Y., et al. (2012). “A dummy-based anonymization method based on user trajectory with pauses,” in GIS: Proceedings of the ACM International Symposium on Advances in Geographic Information Systems (New York, NY: ACM Press), 249–258. doi: 10.1145/2424321.2424354
Krumm, J. (2009). “Realistic driving trips for location privacy, Lecture Notes in Computer Science (Including Subseries Lecture Notes in Artificial Intelligence and Lecture Notes in Bioinformatics). (Berlin, Heidelberg; Springer), 25–41. doi: 10.1007/978-3-642-01516-8_4
Lin, Z., Yin, M., Feygin, S., Sheehan, M., Paiement, J.-F., and Pozdnoukhov, A. (2017). Deep generative models of urban mobility. IEEE Trans. Intell. Transp. Syst. 9. doi: 10.475/123
Liu, X., Huang, Q., Gao, S., and Xia, J. (2020). Activity knowledge discovery: detecting collective and individual activities with digital footprints and open source geographic data. Comput. Environ. Urban Syst. 85:101551. doi: 10.1016/j.compenvurbsys.2020.101551
Mascetti, S., Freni, D., Bettini, C., Wang, X. S., and Jajodia, S. (2011). Privacy in geo-social networks: proximity notification with untrusted service providers and curious buddies. VLDB J. 20, 541–566. doi: 10.1007/s00778-010-0213-7
Mir, D. J., Isaacman, S., Caceres, R., Martonosi, M., and Wright, R. N. (2013). “DP-WHERE: differentially private modeling of human mobility,” in Proceedings - 2013 IEEE International Conference on Big Data, Big Data 2013 (Silicon Valley, CA), 580–588. doi: 10.1109/BigData.2013.6691626
Pappalardo, L., and Simini, F. (2018). Data-driven generation of spatio-temporal routines in human mobility. Data Min. Knowl. Discov. 32, 787–829. doi: 10.1007/s10618-017-0548-4
Pelekis, N., Gkoulalas-Divanis, A., Vodas, M., Kopanaki, D., and Theodoridis, Y. (2011). “Privacy-aware querying over sensitive trajectory data,” in Proceedings of International Conference on Information and Knowledge Management (New York, NY: ACM Press), 895–904. doi: 10.1145/2063576.2063706
Prelipcean, A. C., Gidófalvi, G., and Susilo, Y. O. (2017). Transportation mode detection–an in-depth review of applicability and reliability. Transp. Rev. 37, 442–464. doi: 10.1080/01441647.2016.1246489
Primault, V., Boutet, A., Mokhtar, S., and Brunie, L. (2019). The long road to computational location privacy: a survey. IEEE Commun. Surv. Tutorials 21, 2772–2793. doi: 10.1109/COMST.2018.2873950
Redondo, J. L., Pelegrin, B., Fernandez, P., Garcia, I., and Ortigosa, P. M. (2011). Finding multiple global optima for unconstrained discrete location problems. Optim. Methods Softw. 26, 207–224. doi: 10.1080/10556780903567760
Schneider, C. M., Belik, V., Couronné, T., Smoreda, Z., and González, M. C. (2013). Unravelling daily human mobility motifs. J. R. Soc. Interface 10:20130246. doi: 10.1098/rsif.2013.0246
Schneider, F., Ton, D., Zomer, L.-B., Daamen, W., Duives, D., Hoogendoorn-Lanser, S., et al. (2020). Trip chain complexity: a comparison among latent classes of daily mobility patterns. Transportation 48, 953–975. doi: 10.1007/s11116-020-10084-1
Schoenfelder, S., and Axhausen, K. W. (2001). “Analysing the rhythms of travel using survival analysis,” in Transportation Research Board (TRB) Annual Meeting. doi: 10.3929/ETHZ-A-004241369
Shokri, R., Theodorakopoulos, G., Troncoso, C., Hubaux, J. P., and Le Boudec, J. Y. (2012). “Protecting location privacy: optimal strategy against localization attacks,” in Proceedings of the ACM Conference on Computer and Communications Security (Raleigh, NC), 617–627. doi: 10.1145/2382196.2382261
Suzuki, A., Iwata, M., Arase, Y., Hara, T., Xie, X., and Nishio, S. (2010). “A user location anonymization method for location based services in a real environment,” in GIS: Proceedings of the ACM International Symposium on Advances in Geographic Information Systems (San Jose, CA), 398–401. doi: 10.1145/1869790.1869846
Tolouei, R., and Alvarez, P. (2015). “Developing and verifying Origin-Destination matrices using mobile phone data: the LLITM case,” in European Transport Conference (Frankfurt).
Vlahogianni, E. I., Park, B. B., and van Lint, J. W. C. W. C. (2015). Big data in transportation and traffic engineering. Transp. Res. Part C Emerg. Technol. 58:161. doi: 10.1016/j.trc.2015.08.006
Wallner, G., Kriglstein, S., Chung, E., and Kashfi, S. A. (2018). Visualisation of trip chaining behaviour and mode choice using household travel survey data. Public Transp. 10, 427–453. doi: 10.1007/s12469-018-0183-5
You, T. H., Peng, W. C., and Lee, W. C. (2007). “Protecting moving trajectories with dummies,” in Proceedings - IEEE International Conference on Mobile Data Management, 278–282. doi: 10.1109/MDM.2007.58
Yue, Y., Lan, T., Yeh, A. G. O., and Li, Q. Q. (2014). Zooming into individuals to understand the collective: a review of trajectory-based travel behaviour studies. Travel Behav. Soc. 1, 69–78. doi: 10.1016/j.tbs.2013.12.002
Nomenclature
Keywords: origin-destination matrices, multimodal tours, mobility traces, disaggregation, urban sensing data, large-scale dataset, mega-cities
Citation: Ballis H and Dimitriou L (2021) Exploitation of Aggregate Mobility Sensing Data for the Synthesis of Disaggregate Multimodal Tours in Megacities. Front. Future Transp. 2:647852. doi: 10.3389/ffutr.2021.647852
Received: 30 December 2020; Accepted: 10 March 2021;
Published: 30 April 2021.
Edited by:
Francesco Viti, University of Luxembourg, LuxembourgReviewed by:
Richard Connors, University of Leeds, United KingdomAngelo Furno, Institut Français des Sciences et Technologies des Transports, de l'Aménagement et des Réseaux (IFSTTAR), France
Copyright © 2021 Ballis and Dimitriou. This is an open-access article distributed under the terms of the Creative Commons Attribution License (CC BY). The use, distribution or reproduction in other forums is permitted, provided the original author(s) and the copyright owner(s) are credited and that the original publication in this journal is cited, in accordance with accepted academic practice. No use, distribution or reproduction is permitted which does not comply with these terms.
*Correspondence: Haris Ballis, YmFsbGlzLnRoZW9jaGFyaXNAdWN5LmFjLmN5