 Bruno Cimoli1*
 Haitao Xing2
 Victor Ho3
 Igor Passchier3
 Geerd Kakes4
 Simon Rommel1
 Henk Nijmeijer2
 Idelfonso Tafur Monroy1
- 1Department of Electrical Engineering, Eindhoven University of Technology, Eindhoven, Netherlands
- 2Department of Mechanical Engineering, Eindhoven University of Technology, Eindhoven, Netherlands
- 3Siemens Industry Software Netherlands, Helmond, Netherlands
- 4KPN, The Hague, Netherlands
In this paper we report the implementation and experimental evaluation of a proposed hybrid communication ecosystem for CCAM applications such as cooperative adaptive cruise control (CACC) and smart intersections. Three wireless technologies have been suggested for communications between vehicles and intelligent traffic lights and are evaluated in this work: ITS-G5 based on IEEE 802.11p and LTE sidelink with PC5 air interface for direct short range links, and regular mobile LTE with LTE Uu air interface for long range or indirect links. The applications used are independent of the communication channel, to enable a comparison on the application level of the different communication technologies. Field experiments were carried out with two CACC-equipped vehicles and three intelligent traffic lights in two field test locations under ideal, i.e., no-traffic, conditions and with real traffic. Experimental results related to CACC show that the best performance in terms of latency is achieved by the ITS-G5 system, while LTE PC5 and LTE Uu links show a penalty of 20 and 50 ms respectively. However, experimental results show that all three communication technologies were still able to guarantee string stable performance of the vehicle platoon. Regarding the smart intersections, an analysis based on field measurements and comparison between long- and short-range solutions is proposed; the analysis includes the impact of each channel on the applications such as speed advisory and green light prediction. The reported experimental evaluation shows the potential of current mobile technologies for CCAM use cases and highlights the way for further CCAM applications based on 5G and beyond mobile networks.
1 Introduction
The past decades have seen a significant increment of the number of vehicles, while the road capacity could not follow at the same pace. Moreover, multiple studies have shown the low efficiency of human driving due to human distractions, slow reaction time, and non-optimal maneuver decisions (World Health Organization, 2018). These limitations pushed the development of cooperative, connected, and automated mobility (CCAM) technologies and applications with the goal to improve traffic efficiency, road safety and autonomous driving. The European Union proposed connected cooperative intelligent transport systems (C-ITSs) to provide vehicle-to-vehicle (V2V) and vehicle-to-infrastructure (V2I) connectivity for enabling cooperation and information sharing, which are essential for CCAM applications (C-ITS Platform, 2018). The most common technology for V2V communication is referred as ITS generation 5 (ITS-G5) (ETSI EN 302 663, 2012) and it is based on IEEE 802.11p for the physical layer (IEEE 802.11p, 2010) and the GeoNetworking protocol for the transport layer (ETSI EN 302 665, 2010). Recently, cellular technologies have been investigated as an alternative for the implementation of C-ITSs. In this scenario communication between vehicles is achieved indirectly via the mobile network, i.e., vehicle-to-network V2N communication. The feasibility of C-ITSs based on LTE networks has been investigated (Lianghai et al., 2017) and has been proven for different CCAM use cases (Nafi et al., 2014; Dey et al., 2016). The advantage of mobile network based solutions is that they can provide a broader coverage and they can enable multi-access edge computing (MEC) for more complex applications (Pyykönen et al., 2020). However, these solutions are also typically affected by larger latency and lower bandwidth efficiency compared to direct ITS-G5 systems. A solution to these limitations will be the imminent deployment of 5G networks that, combined with MEC, are expected to significantly reduce the gap to ITS-G5 in terms of network key performance indicators (KPIs) (5G-PPP, 2021). Another mobile technology developed for C-ITSs is LTE sidelink, which supports direct V2V communications while the mobile network role is limited to the initial vehicle localization and link configuration (ETSI TS 303 613, 2020). LTE sidelink has arisen as an alternative to ITS-G5 because, theoretically, it is comparable in terms of latency and coverage (Gonzalez et al., 2019; Giambene et al., 2020; 5GAA P-190033, 2019).
In this paper we investigate a C-ITS solution based on a hybrid network ecosystem that combines ITS-G5 and mobile LTE. The proposed ecosystem has been developed for two CCAM use cases: Vehicle platooning with cooperative adaptive cruise control (CACC) and smart intersections for green light optimized speed advisory (GLOSA) (5GAA Working Group1, 2019). The platoon use case was implemented with field experiments that were carried out with two CACC-equipped vehicles under ideal traffic conditions (Xing et al., 2021). The GLOSA use case was evaluated with a vehicle crossing three intersections with smart traffic lights under real traffic conditions.
The outline of this paper is as follows: Section 2 introduces the ecosystem architecture and CACC strategy, Sections 3, 4report the CACC and GLOSA evaluation and results respectively, and Section 5 summarizes and concludes the paper.
2 Hybrid Ecosystem Architecture and Cooperative Adaptive Cruise Control Strategy
2.1 Hybrid Ecosystem Architecture
The proposed hybrid ecosystem supports V2V and infrastructure-to-vehicle (I2V) communications as shown in Figure 1. In terms of communication scenarios, direct V2V is clearly defined by messages originating from vehicles and targeting other vehicles, whereas I2V is more complex due to the several different sort of C-ITS infrastructures that can be source or destination of messages. Furthermore, indirect V2V and I2V, i.e., vehicle-to-everything (V2X), communications results in V2N2V and I2N2V communications respectively, where “N” represents the network backend, comprising servers, communication lines, and related ICT services. ITS-G5 and LTE sidelink, with PC5 air interface, are the two technologies considered for the implementation of the direct or short range V2X link. The frequency band allocated for both systems is (5.855, 5.925) GHz, which is defined in (ETSI EN 302 663, 2012) and (ETSI TS 303 613, 2020). For indirect or long range link the proposed technology is regular LTE, with Uu air interface. Two LTE bands are available: B20, which has uplink (0.832, 0.862) GHz and downlink (0.791, 0.821) GHz, and B3, which has uplink (1.710, 1.785) GHz and downlink (1.805, 1.880) GHz. Furthermore, the LTE Uu solution includes an edge computing solution based on the message queuing telemetry transport (MQTT) protocol, which runs over TCP/IP and is based on the publish/subscribe principle. For all technologies the allocated bandwidth is 10 MHz, except for LTE Uu when using B3 in which case 20 MHz are available.
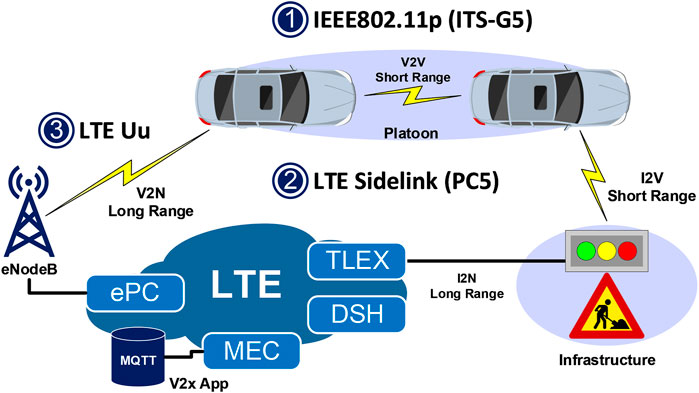
FIGURE 1. Hybrid ecosystem for CACC and GLOSA with short and long range communication technologies. The LTE network includes evolved packet core (ePC), MEC, traffic light exchange (TLEX) and data services hub (DSH).
Figure 2 shows the messages exchanged over the V2X links for CACC and GLOSA. More specifically, for CACC cooperative awareness messages (CAMs) and i-GAME cooperative lane change messages (iCLCMs) are exchanged at 25 Hz, while for GLOSA signal phase and time (SPAT) and mapdata (MAP) messages are exchanged at 1 Hz (Santa et al., 2014; Amsterdam Group, 2015; van de Sluis et al., 2015). Moreover, real-time kinematic positioning (RTK) GPS is used for vehicle localization and clock synchronization.
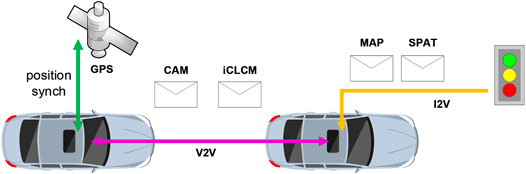
FIGURE 2. Message types exchanged over V2V and I2V links for CACC and GLOSA use cases.
The V2V communication stacks of the three communication technologies are similar, as shown in Figure 3. The two top layers, i.e., application and facility, are identical for the three technologies. The network layer of the two short range technologies includes public key infrastructure (PKI) for security and Geonet basic transport protocol (BTP) encoding. On the other hand, the network layer of the LTE Uu solutions includes transport layer security (TLS) and the MQTT encoding on top of TCP/IP. MQTT headers are used by the MEC to distribute messages according to the publish/subscribe principle. The access layer implementations of the two short range technologies follow different strategies: ITS-G5 is based on carrier sense multiple access, which allows data transmission only after verifying the absence of other traffic, while LTE PC5 access layer is based on time synchronization using semi-persistent scheduling (SPS) (ETSI TS 303 613, 2020).
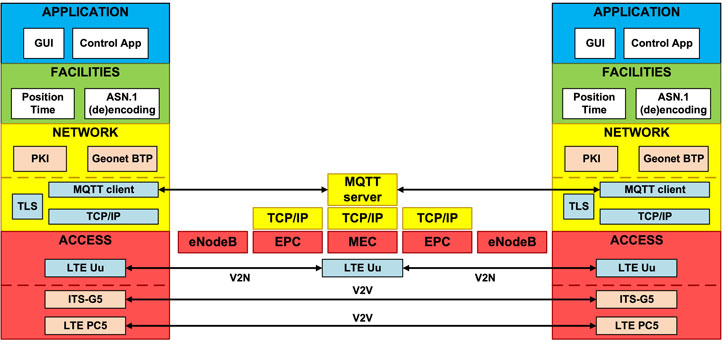
FIGURE 3. V2V OSI stack with main functions and protocols.
For the smart intersection scenario, the V2I link connects a vehicle to the intelligent traffic light controller (iTLC), which is installed together with the traffic light. The iTLC broadcasts MAP and SPAT messages to the approaching vehicles; therefore, communications are monodirectional I2V in the wireless domain. The communication stack of the direct V2I link is identical to the direct V2V except for the message types and their frequency. On the other hand, the indirect I2V link includes a wired connection between the iTLC and the traffic light exchange (TLEX), which is a central platform that collects data from the different traffic lights. From the TLEX the data is then sent to a data services hub (DSH) where it becomes available to the MQTT server. The MQTT server distributes messages according to the requests from the users, i.e., the vehicles. This type of solutions enables filtering messages before the wireless V2N link, from the eNodeB towards the vehicle, according to the use case needs, instead of continuously broadcasting messages even when no relevant information is available. However, LTE solutions based on MQTT are forced to allocate separate channels for every vehicle even when they require the same information, while direct communication solutions can use the same channel for all users. Fortunately, advanced 5G multicast techniques are expected to alleviate this issue.
2.2 Cooperative Adaptive Cruise Control Strategy
The typical CACC strategy, which is employed in the test, is introduced here. In a homogeneous CACC platoon composed of n vehicles is considered, where li, qi, vi and ui are the length, position, velocity, and desired acceleration of vehicle i, respectively, as illustrated in Figure 4A). A simplified vehicle model is often adopted for CACC design, obtained through feedback linearization of a nonlinear vehicle model (Hedrick et al., 1994). In CACC, a lower level controller is normally implemented to accurate the desired acceleration, although the dynamics of two vehicles might be slightly different. The resulting vehicle dynamics reads:
where ai is the actual acceleration of vehicle i, θa represents the vehicle actuator delay, and τ is a time constant representing the longitudinal vehicle dynamics. (Ploeg et al., 2011) showed the validated model is sufficient to analyze CACC performances considering that the deceleration limitation will not be challenged. Consequently, the transfer function G(s) from the desired acceleration ui to position qi reads:
where
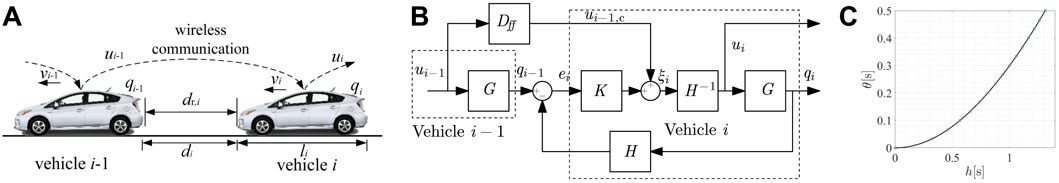
FIGURE 4. Illustration of the one-vehicle look-ahead CACC scheme: (A) illustration of vehicle i and i − 1 and corresponding parameters, (B) block diagram of the CACC system, (C) maximum string stable communication time delay θ with respect to time gap h (with τ = 0.1, θa = 0.2 s).
To realize the vehicle-following objective, the inter-vehicle distance error ei, defined as:
should asymptotically converge. To this end, the PD controller in (Ploeg et al., 2011) is adopted. An internal input ξi is introduced, which is related to the desired acceleration ui as follows:
ui−1,c(t) is the received desired acceleration of the preceding vehicle, which suffers from the wireless communication latency θ, reading:
Here, the latency θ due to different communication technologies will be varying, and thus resulting in corresponding vehicle performances.
Hence, the control structure can be depicted as in Figure 4B), where H(s) = hs + 1, K(s) = kp + kds and Dff(s) = e−θ(s) represent the Laplace transforms.
Therefore, the string stability transfer function S(s), which describes the relation between a relevant (scalar) signal of vehicle i and the corresponding signal of its preceding vehicle, reads:
Note that the transfer function is the same for the velocity, acceleration, inter-vehicle distance and distance error in a homogeneous CACC string. A CACC system of interconnected vehicles is string stable if:
In the theoretical analysis considering a constant latency, there exists a maximum latency that string stability can be still guaranteed (Xing et al., 2019), which is shown in Figure 4C). The vehicle parameters have been identified in (Ploeg et al., 2011): τ = 0.1, θa = 0.2 s. This figure also indicates that time gaps of 0.3, 0.6, and 1.0 s require maximum delays of 29 ms, 111 ms, and 300 ms, respectively. Note that any packet loss is ignored here.
3 Cooperative Adaptive Cruise Control Evaluation
In this section the execution and evaluation of the CACC use case is reported. CACC which employs V2V communication between vehicles can lead to a safer and smoother platoon than ACC. In addition, the CACC application is suitable to evaluate the effects of different communication technologies on ITS.
The use case has been implemented with two Toyota Prius car labs that drive in a two-vehicle platoon, where the following vehicle is in CACC mode, i.e., automatically adjusts the velocity and acceleration profiles to the ones of the leading vehicle. For the evaluation, two CACC solutions are considered for the wireless V2V link: The short range solution based on ITS-G5 or LTE PC5 and the long range solution based on LTE Uu. Note that the CACC controller is identical for all three communication technologies; however, it can be optimized according to the communication performance of the wireless channel. The hardware in the vehicles consists in a PC Engines APU2 board equipped with Sierra Wireless MC7455 LTE-A modem, which is attached to a 3 dBi MIMO LTE antenna. For the network infrastructure of the LTE Uu solution, bands 20 and 3 are available. Furthermore, at the metro core network in Helmond a mobile edge computing (MEC) node is used as MQTT server for the CACC application (Xing et al., 2021). Field measurements have been conducted in the RDW test centre in Lelystad (NL) shown in Figure 5 (RDW, 2021). The test centre is a ring track designed for maintaining high velocity profiles even in the curved sections. The main target of the tests in Lelystad was evaluating the vehicle platooning when driving with high speed profiles and no traffic interference (only authorized vehicles can drive on the track). However, in the test centre, the mobile network has only one base station, eNodeB 29,551, which is positioned at a minimum and maximum distance from the track of 900 1750 m respectively. Because of the coverage limitations, only the B20 band was available for the LTE Uu link. The leading vehicle, Prius 2 (P2), is manually driven, and it follows the acceleration profile shown in Figure 5. The following vehicle, Prius 3 (P3), accelerates or decelerates automatically in CACC mode. For each test four laps are executed, for a total of four acceleration and deceleration sections. The CACC controller is set in gap control mode, which aims to maintain the time gap between the CACC-equipped vehicle and its predecessor. The CACC schematic of the vehicles is reported in Figure 5: The C-ITS gateway is the platform of the access layers of the three channels, the on-board-unit (OBU) executes the functions of the network and facility layers, the real-time CACC platform runs the CACC controller algorithm, the vehicle gateway MOVE interfaces the controller with the vehicle actuators and the human machine interface (HMI) platform displays information on a dashboard. Furthermore, two measurement points are considered for the data logging: The flow of exchanged CAMs and iCLCMs at the OBU, and the vehicle state and position at the controller are network (CAN) bus. Moreover, the GPS receiver provides the vehicle position to the CACC platform and time synchronization to the OBU by a pulse per second (PPS) signal with sub millisecond resolution.
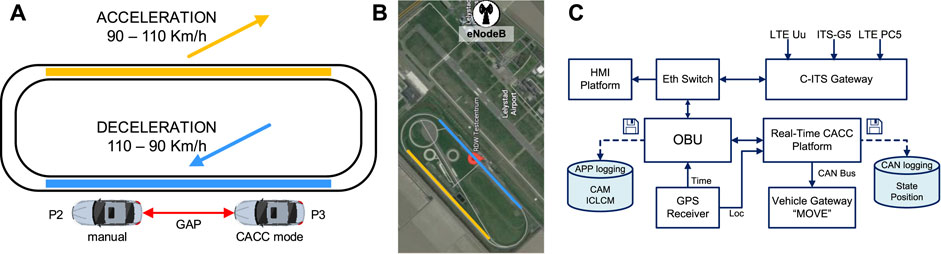
FIGURE 5. (A) CACC field test at the RDW Testcentrum in Lelystad (NL). (B) location of LTE base station eNodeB 2955. (C) schematic of the CACC system inside the two vehicles.
3.1 Key Performance Indicators Definition for Cooperative Adaptive Cruise Control Use Case
The most critical KPI for CACC applications is latency because it determines how fast the CACC controller can react. Another important KPI is the number of lost messages, which characterizes the quality and stability of the wireless channel. Regarding the platooning application, the function to optimize is the deviation from the target gap, which is typically characterized as KPI by the inter-vehicle distance. Moreover, the stability of platoon is characterized by the acceleration and velocity amplifications. The selected KPIs are defined as follows:
• One Trip Time latency (OTTl), which refers to the difference between the transmitted TTx and received TRx timestamps of a packet or message. At the receiver side, the transmission order and the lost messages are not considered.
• Packet error rate (PER), which refers to the percentage of lost packets or messages. A packet is considered lost when it appears in the log file of the Tx and not in the Rx one.
• Velocity amplification, which refers to the deviation of the velocity profiles of the vehicles in a platoon due to the acceleration amplification.
• Inter-vehicle distance, which refers to the distance from the leading to the following vehicle.
3.2 Short Range Cooperative Adaptive Cruise Control Solution
In this section experimental results when operating with the direct V2V solution are reported for both ITS-G5 and LTE PC5. Figure 6 shows the empirical curves of the probability density function (PDF) and cumulative distribution function (CDF) of the OTTl from the measurements with the ITS-G5 and LTE PC5 links. The mode of the OTTl of the ITS-G5 link was approximately 4 ms with more than 45% of the total messages, while the one of the LTE PC5 link ranges between 22 and 24 ms. Moreover, the latency PDF of the LTE PC5 link is spread on the left side of the mode, reaching values up to 80 ms. The correspondent CDF curves shows that only 10% of the messages are received with OTTl below the mode and only 60% below 40 ms that corresponds to the message frequency of 25 Hz.
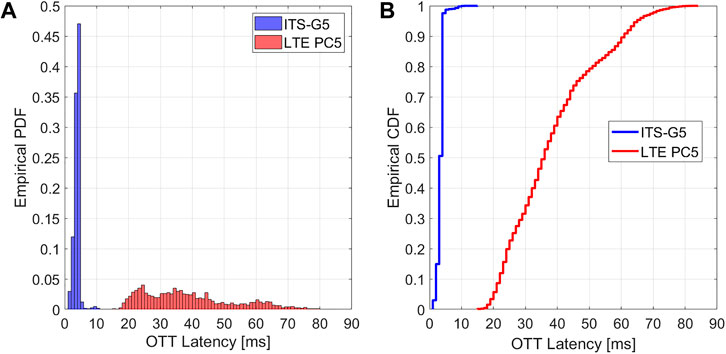
FIGURE 6. Empirical PDF (A) and CDF (B) of the OTTl of the CAMs.
Table 1 (top) reports the OTTl statistical properties of both CAMs and iCLCMs in the two directions: P2 to P3 (P3 to P2). As expected from the curves in Figure 6, the mode of the ITS-G5 link is 4 ms, the mean drops between 3.4 and 3.9 ms and the standard deviation is between 1 and 1.5 ms. Moreover, more than 95% of the messages was received within 5 ms. On the other hand, the OTTl of the LTE PC5 link has a mode between 22 and 25 ms, a mean is shifted on the left to 38 ms and a standard deviation between 13 and 15 ms. Lastly the PER of the ITS-G5 link is below 0.1% for iCLCMs and below 0.02% for CAMs, while the PER of the LTE PC5 link ranges between 4.5 and 5%.
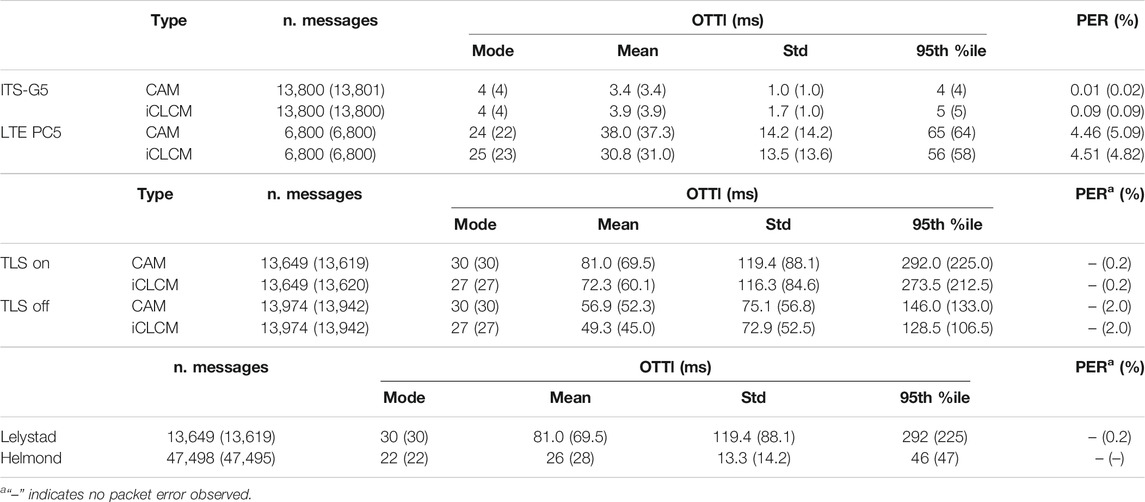
TABLE 1. OTTl specifications derived from the measurements in Lelystad with the ITS-G5 and LTE PC5 links (top) and with the LTE Uu link (middle). Latency comparison of the LTE mobile networks in Lelystad test center and Helmond, where the MEC is physically located (bottom).
Experimental results show an outstanding performance in terms of OTTl and PER when operating with the ITS-G5 link. However, it must be taken into consideration the ideal conditions in the Lelystad, where no other vehicles were involved and there was almost no interference from other wireless devices. The performance of the LTE PC5 solution was significantly worse than ITS-G5. The main cause of this penalty is the mismatch between the frequency of the SPS flow defined by the LTE PC5 standard and the message frequency defined by the application layer. The result of this mismatch is the larger OTTl mode and variance shown in both Figure 6 and Table 1 (top).
3.3 Long Range Cooperative Adaptive Cruise Control Solution
Experimental results of the CACC tests executed with the long range solution based on LTE Uu are reported in this section. The first KPI to be analyzed is the OTTl that is reported in Figure 7. Transport layer security (TLS) is applied and included in the OTTl calculation. From the CDF curves we can observe that there is no significant impact of the TLS for the messages received within 40 ms, which are 60%. The TLS becomes relevant when we consider the remaining 40% of the messages that were received with OTTl larger than 40 ms. More specifically, the CDF curves show a penalty between 20 and 40 ms when the TLS is applied.
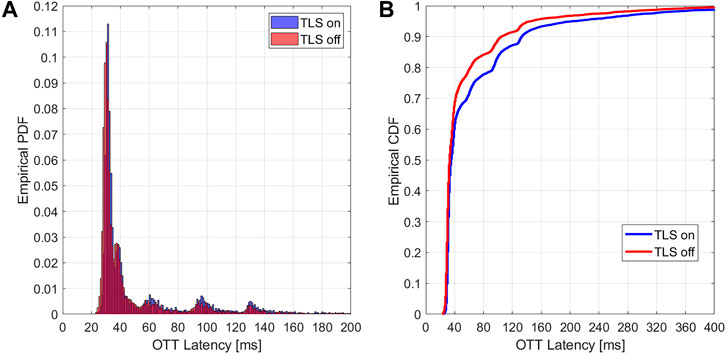
FIGURE 7. Empirical PDF (A) and CDF (B) of the OTTl of the CAMs with TLS on/off. Four laps were executed with TLS on and other four laps with TLS off.
A more quantitative description of the OTTl measurements is reported in Table 1 (middle). Data is presented for CAMs with TLS on/off. Experimental results confirm that the impact of the TLS does not affect the distribution around the mode, which is between 27 and 31 ms. We can notice that the 95th percentile doubles and both mean and standard deviation are shifted by 20–30 ms when the TLS is on. Another KPI to consider is the reliability described by the PER, which is almost null as long the mobile network coverage is granted. However, occasionally the connection was lost in the straight line section with the lowest signal strength, which is the most distant from the eNodeB, thus raising the PER.
Overall, the performance of the long range system was penalized by the weak coverage of the eNodeB and the distance from the MEC located in Helmond (Passchier et al., 2015), which is more than 100 km from Lelystad. To characterize this penalty, we also recorded data in Helmond, where the MEC is hosted. For these measurements the two vehicles were in CACC mode and they were communicating through the LTE network. However, CACC vehicle platooning could not be tested. The LTE network in Helmond allowed to use B3; however, we only enabled B20 to be comparable with the results in Lelystad. Figure 8 shows the comparison between the OTTl measured in Lelystad and Helmond. We can see that in Helmond the distribution of the OTTl was shifted down by approximately 8 ms compared to the one in Lelystad.
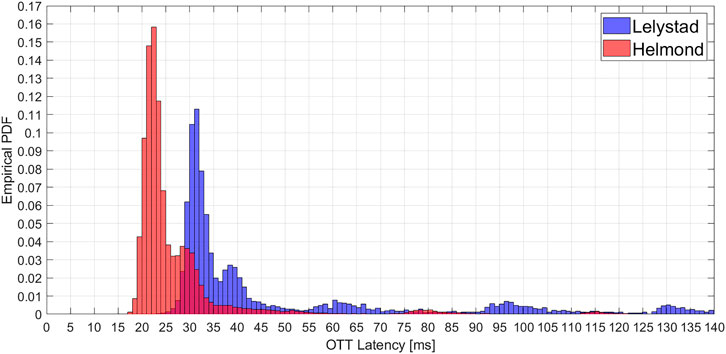
FIGURE 8. OTTl comparison between data collected in Lelystad and Helmond.
Furthermore, Table 1 (bottom) reports the statistical characteristics of the OTTl measured in Lelystad and Helmond. We can notice a significant improvement in Helmond; more specifically, the mode is 8 ms lower and the 95th percentile is 47 ms, which is a fifth of the one in Lelystad.
3.4 Vehicle Dynamic Analysis of Cooperative Adaptive Cruise Control Solutions
To continue the evaluation, we analyzed the vehicle dynamic KPIs related to latency and PER; more specifically, the analysis focuses on the effect of the OTTl on the performance of the CACC controller. Experimental results of three communication technologies with a time gap of 0.3 s are reported. For each communication technology, four laps were carried out. Results with the most similar speed profiles of P2 are chosen, to compare the performances of P3 and the effects due to communication technologies. The distance error contains the constant inter-vehicle distance when the CACC string is standstill, thus the error will converge to the constant inter-vehicle distance when the CACC string is achieved at static conditions, i.e., the velocities are constant. Due to the limited length of the test field, the CACC string may not have been in a static condition when the preceding vehicle started accelerating or decelerating. The acceleration/velocity indicators extracted are based on the time period when velocity variations occurred, while the inter-vehicle distance and distance error indicators are extracted when the velocity variations finished. In Figure 9, the acceleration phase and deceleration phase are shown for the two short range technologies: ITS G5 and LTE PC5. Furthermore, the key performance indicators based on the experiments are summarized in Table 2. Note that the string stable or unstable performances will be better observed in the case of longer platoon (Ploeg et al., 2011). For the accelerating phase, the acceleration magnitude of the preceding vehicle is around 0.8 m/s2. For ITS-G5 and LTE PC5 the maximum acceleration of P3 reached the peak value. For the deceleration phase, the magnitude is much larger, thus the acceleration amplification performances will be more obvious if there is overshoot. For ITS-G5, the deceleration of P3 (1.28 m/s2) is much smaller than that of P2 (1.55 m/s2). For LTE PC5, the deceleration of P3 (1.60 m/s2) almost reaches that of P2 (1.65 m/s2). Clearly, there is no overshoot for ITS-G5 and LTE PC5.
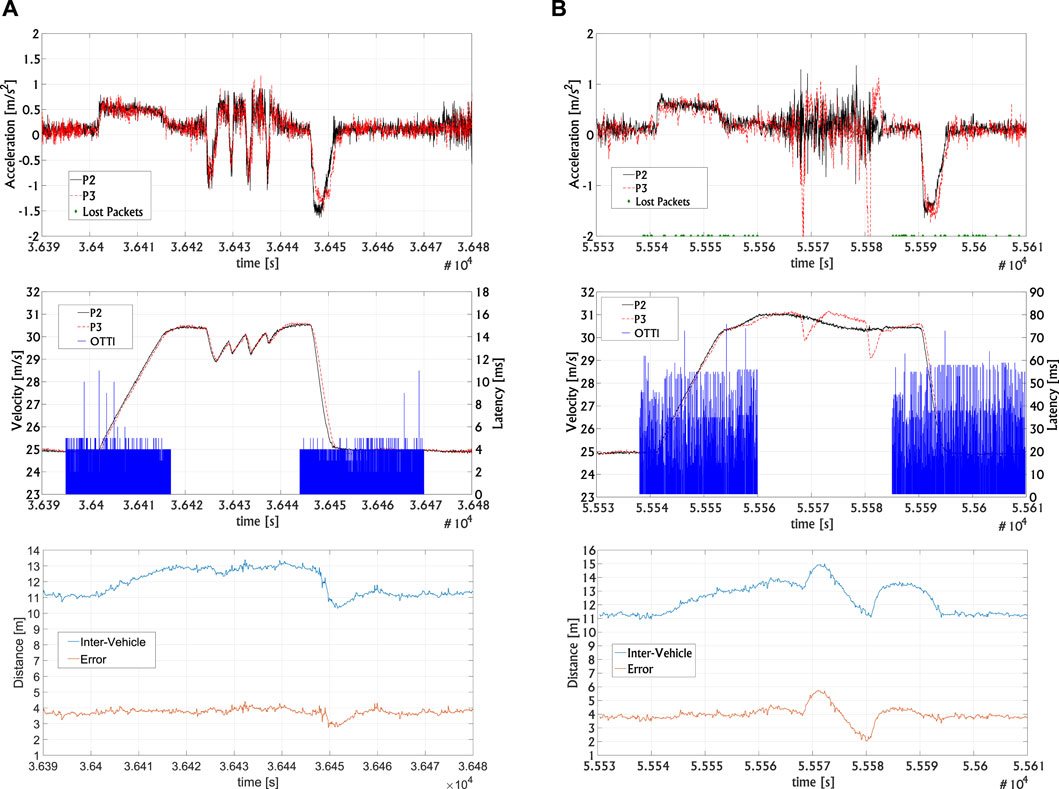
FIGURE 9. Vehicle responses of CACC string with ITS-G5 (A) and LTE PC5 (B).
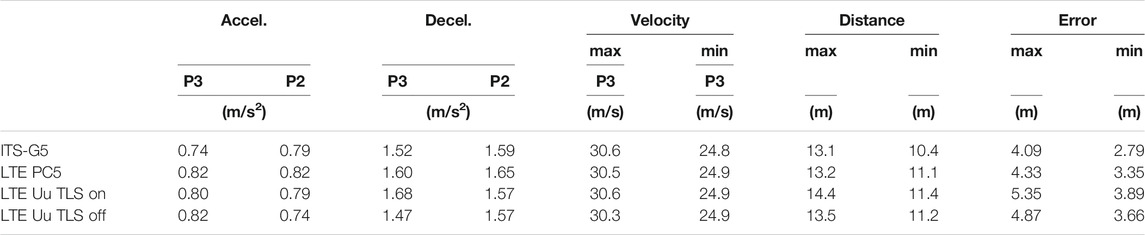
TABLE 2. String stability KPIs for short-range communication technologies, with time gap = 0.3 s.
In view of velocity responses, for both communication technologies, the velocity of P3 reaches that of P2 without observable overshoot. For the inter-vehicle distance and error, the LTE PC5 communication experiences a larger maximum error since the following vehicle P3 responses for acceleration with the longer latency. With the different communication environment (e.g., in Helmond), the latency and PER shall be influenced (Lei et al., 2011). Thus, we artificially added latency and packet error to show the CACC-equipped vehicle performances in a more realistic driving environment. When 20% packet error is added, there exists two or three consecutive packet losses for ITS-G5, while three or four consecutive packet losses occur with LTE PC5, as shown in Figure 10. Furthermore, the following vehicle decelerated with more than 0.5 m/s2, when the connection is lost. In fact, the CACC will degrade to ACC mode when three packets are lost or the latency of over 100 ms due to the safety functionality. Therefore, CACC is sensitive with large PER with the short-range communication technologies.
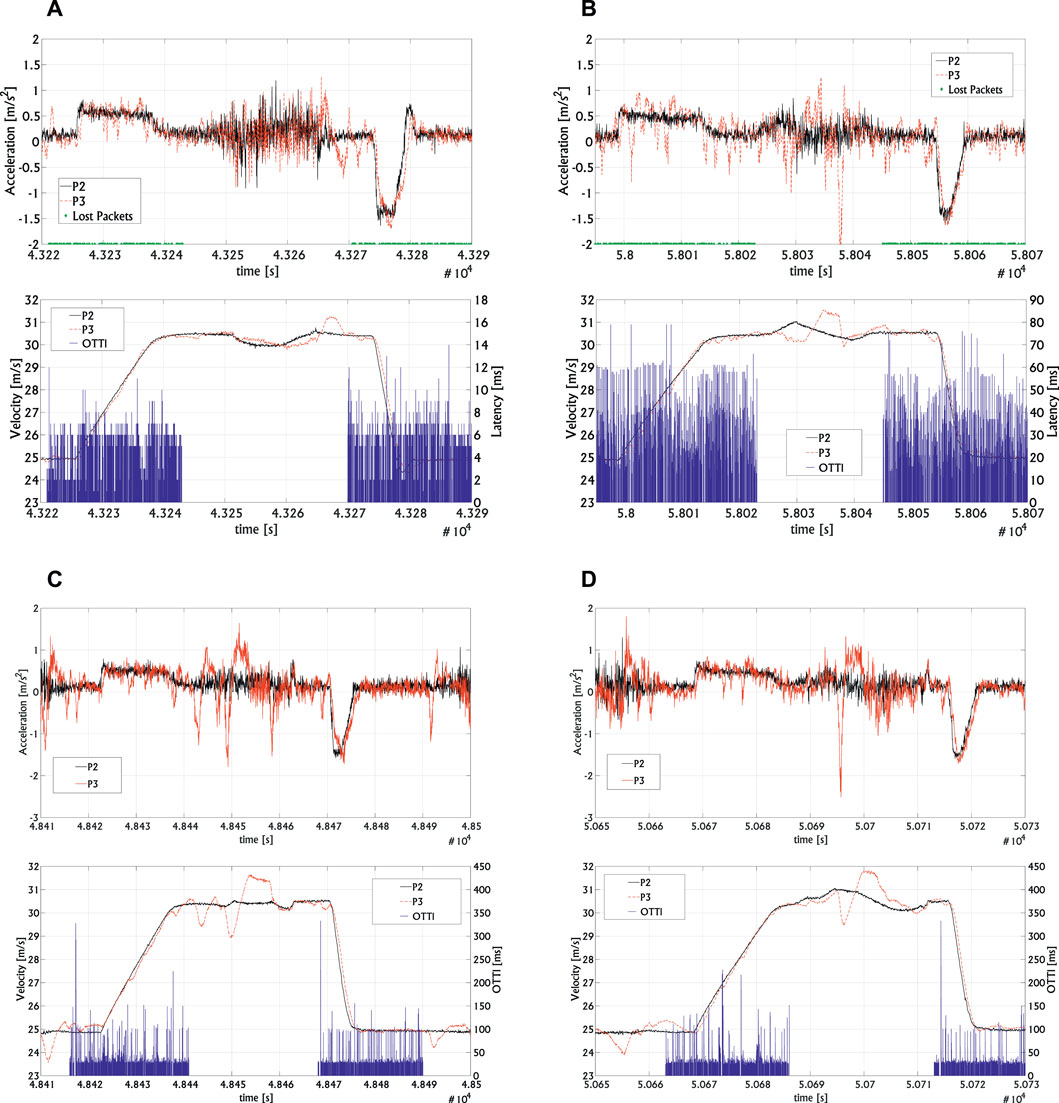
FIGURE 10. (A) ITS-G5 and (B) LTE PC5 solutions acceleration and velocity responses with 20% PER impairment. LTE Uu solution acceleration and velocity responses with TLS on (C) and off (D).
Figure 10 shows the vehicle responses by LTE Uu with TLS on and off. When TLS is on, there is a slightly acceleration overshoot, while the deceleration is amplified along the CACC string (Table 2). When the latency is over 100 ms, CACC will degrade to the ACC mode. When TLS is off, the latency is less compared to that with TLS on. However, the CACC connection functionality still degrades. Note that for LTE Uu, the connection on the curves is influenced, such that the CACC string is not at a stationary situation before the acceleration/deceleration slots. This will significantly affect the inter-vehicle distance indicator. Thus, the inter-vehicle distance will not be focused for LTE Uu. When the communication environment is better in Helmond (where more MECs exist and the signal strength is higher), LTE Uu should be able to support the CACC application.
4 Green Light Optimized Speed Advisory Evaluation
GLOSA is one of the applications of smart intersection systems that involve I2V communications. In this section we report the evaluation of the smart intersection C-ITS, whose infrastructure is located in the Helmond test site shown Figure 11. The test site covers a section of Europaweg (provincial road N270) of almost 2 km (Passchier et al., 2011). For the evaluation we selected three intersections with three intelligent traffic lights HEL804, HEL806 and HEL701. Two solutions are available for I2V communications from the iTLCs to the approaching vehicles: Short range based on ITS-G5 and long range based on LTE Uu. Unfortunately, LTE sidelink was not supported by the iTLCs hardware; thus, a short range solution based on LTE PC5 could not be implemented and tested on the field. The LTE mobile network included two eNodeB units and both B20 and B3 bands were available. Specifications of the messages broadcasted by iTLCs are reported in Table 3 (top). The size of CAM is fixed to 26 bytes, while the size of the MAP ones derives from the area considered as the road crossing; therefore, it differs for each iTLC. On the other hand, the size of SPAT messages is variable and ranges between 300 and 1000 bytes. The final length of a message includes the headers and footers, whose size depends on the technology. However, only SPAT messages provide information that requires to be updated, while the information of CAMs and MAP messages provide static information that is used by the vehicle to locate the positions of the traffic light and the geography of the intersection. The update rate of the messages is 100 ms; however, iTLCs are configured to publish new messages every second, i.e., at a rate of 1 Hz, unless a change has occurred. Therefore, the iTLC is expected to broadcast CAM and MAP messages at a constant rate of 1 Hz, because their content is constant over time. SPAT messages instead describe the signal state of the intersection, which mutates over time; therefore, iTLCs are expected to sporadically publish SPAT messages within the 1 s window.
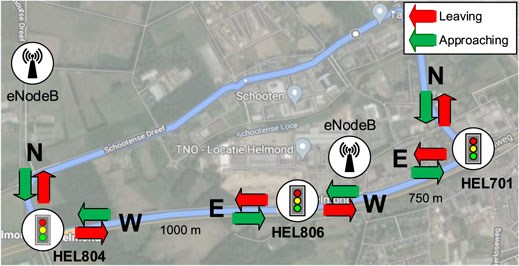
FIGURE 11. GLOSA field test site in Helmond with the three intelligent traffic lights: HEL804, HEL806 and HEL701.
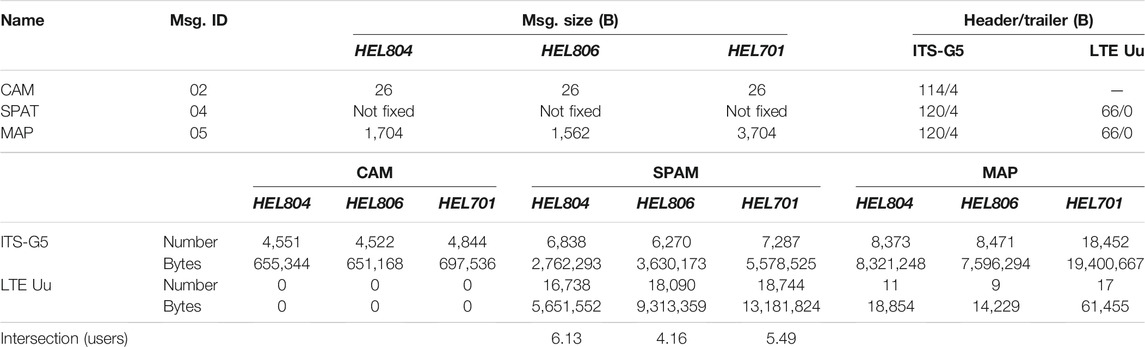
TABLE 3. Specifications of the messages broadcasted by the iTLCs in the Helmond test site (top) and messages broadcasted over the two wireless links and the number of users to have same data efficiency (bottom).
4.1 Key Performance Indicators Definition for Green Light Optimized Speed Advisory Use Case
Latency is not the most critical KPI of the GLOSA use case because of the typical low transmission rate. In this scenario, other KPIs such as the coverage become more relevant because of the larger number of potential vehicles involved in the use case. Regarding the application performance, the most typical KPIs are travelling time and energy consumption. Following the definition of the selected KPIs:
• Data efficiency, which refers to the percentage of data considered relevant for the use case from the total of data transmitted through the wireless channel. This KPI provides a tool to compare efficiency MQTT publish/demand and standard broadcasting approaches.
• Coverage, which refers to the distance when the vehicle enters in or leaves the covered area, which is defined as the area around the traffic light where the packet delivery rate (PDR) measured by the vehicle is above a chosen threshold.
• Energy consumption with respect to GLOSA requirements of the communication distance. The fuel consumption and battery loss of a vehicle model in Matlab/Simulink are calculated, in which a longitudinal hybrid electric vehicle with parallel hybrid transmission is used.
• Traveling time crossing the traffic lights. The GLOSA-equipped vehicle targets a highest speed passing the intersection.
4.2 Evaluation Green Light Optimized Speed Advisory Solutions
In this section we report the experimental data and result analysis of the short and long range solutions based on ITS-G5 and LTE Uu respectively. For the evaluation the vehicle was collecting data from the two systems that were running in parallel. Experimental data has been collected over five test sessions at different hours of the day for a total of 225 min. Table 3 (bottom) reports the number of messages received by the vehicle from the iTLCs overall the test sessions. Moreover, Figure 12 shows the respective percentages of each message type. For this use case we assume that only the SPAT messages are relevant for the application; therefore, the data efficiency of the short range solution has an efficiency of 24% while the long range is above 99%. More specifically, the ITS-G5 channel is penalized by the large size MAP messages, which must be continuously broadcast despite having the same content. Furthermore, the short range system could not block messages from other iTLCs of nearby traffic lights, despite it was not transitioning through their intersections; these messages are referred as others. Measurements show a clear a clear advantage of the long range solution in terms of data efficiency; however, the short range system has the advantage that multiple users can share the same channel. On the other hand, the long-range solution must allocate dedicated channels for each user even if they are requesting the same data. Therefore, the data efficiency of LTE Uu decreases linearly with the number of users while the one of ITS-G5 remain constant. Table 3 (bottom) reports the intersection point when the number of users make the data efficiency of the two systems to be the same. For the three intersections in field test, we can derive that the long range solution is more efficient than the short range one if the number of vehicles is lower than four to six, depending on the MAP size and frequency of SPAT updates.
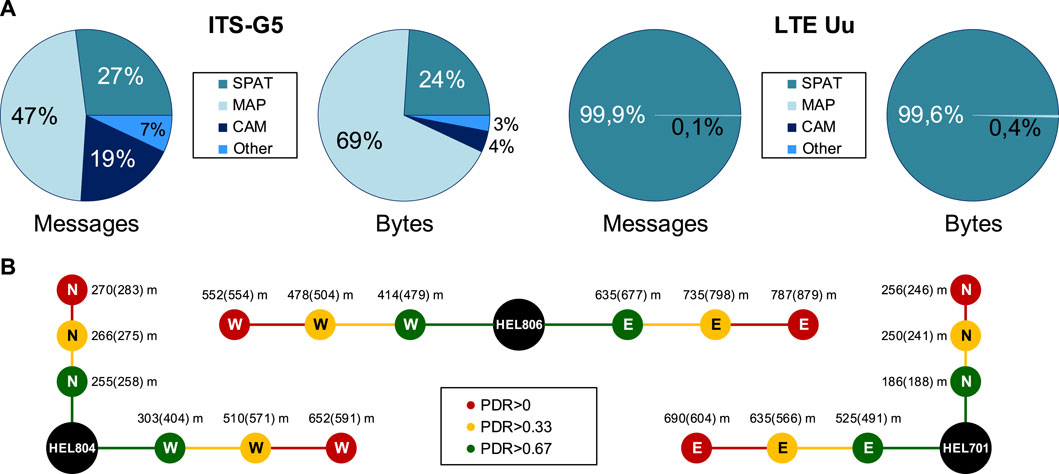
FIGURE 12. Percentages of SPAT, MAP, CAM, and other received messages from the ITS-G5 link (A). Average reach of the three iTLCs when approaching (leaving) the intersections (B).
When analyzing the coverage, measurements showed that there was no loss of connection in the LTE Uu link, i.e., the PDR was always 1 when the vehicle was crossing the intersections. This is due to the optimal coverage of the mobile network in Helmond and the significant message frequency of 1 Hz. On the other hand, the ITS-G5 link was bounded to the distance of the vehicle from the traffic light. Figure 12 shows the coverage of the three iTLCs for three PDRs. Measurements show a coverage above 400 m when the vehicle was driving in the main road, i.e., west and east directions, while it drops below 300 m in the secondary road. This large coverage is mainly due to the gain of the antennas on the vehicle and the ideal conditions of the road. To continue the evaluation, we studied the impact of the communication KPIs on the GLOSA application and objectives. When considering the GLOSA application, we must consider both the individual and multiple vehicle cases. For an individual vehicle, the GLOSA strategy targets the highest speed when crossing the intersection, i.e., the smallest speed deceleration. Therefore, the maneuver of the GLOSA equipped vehicle will have a lower influence on the other traffic participants following the vehicle. Regarding the fuel consumption, simulation results reported in (MathWorks, 2021) shows that responding to SPAT messages further in advance cannot guarantee the total energy consumption would be lower. On the other hand, if the vehicle can receive SPAT messages earlier, it can also start decelerating earlier, thus reducing the deceleration amplitude and consequently the travelling time. Therefore, it can be suggested that the longer coverage achieved by the LTE Uu system would enable to improve the travelling time KPI in the single vehicle scenario. If we consider the scenario with multiple vehicles crossing the intersection and all of them are GLOSA-equipped, the optimal communication distance around 350 m (Katsaros et al., 2011), such that the lowest total energy consumption is achieved. Moreover (Katsaros et al., 2011), reported that an increase of GLOSA-equipped vehicles would enables reductions of energy consumption.
5 Conclusion
The proposed hybrid ecosystem for C-ITSs has been implemented and tested for two use cases. For the CACC use case we perform a platoon with two vehicles equipped to support the three air interfaces: ITS-G5, LTE Uu and LTE PC5. Experimental results show that the best performance in terms of latency is achieved by the ITS-G5 solution proving the maturity of the technology. The other short range solution, based on LTE sidelink, was penalized by the strict requirement on the synchronization between modem and applications. Despite this penalty, the CACC platoon could guarantee string stability and keep the vehicle following smoothly with both technologies. The performance of the long range solution based on LTE Uu was significantly affected by the low coverage and the distance from the MEC; During the tests latency values above 100 ms occurred, which resulted in fluctuations during the CACC platoon. However, a second session of measurements that were taken in another location closer to the MEC and with higher coverage, showed a significant improvement of the OTTl comparable to LTE PC; these results suggest that string stable platoons are achievable also with the long range solution. For the GLOSA use case we recorded the traffic broadcasted by three intelligent traffic lights to compare coverage and data efficiency of the short range and long range solutions based on ITS-G5 and LTE Uu respectively. Measurements show that the long range solution has the potential to improve GLOSA related KPIs and even improve the efficiency of the system when targeting single vehicles; however, the MQTT protocol becomes less efficient when more than four to six vehicles are involved.
Data Availability Statement
The datasets presented in this article are available from the corresponding author on reasonable request. Requests to access the datasets should be directed to Yi5jaW1vbGlAdHVlLm5s.
Author Contributions
BC, HX, VH, IP, and GK contributed and participated to the testing activities. BC and HX analyzed the data that was discussed among all authors as were the results. VH and IP developed the systems on the vehicles and GK contributed to set the mobile network connection. BC, HX, SR, HN, and IT wrote the manuscript. All authors read and approved the manuscript.
Funding
This work was carried out within the CONCORDA project, an action co-financed by the European Union under the Grant Agreement number INEA/CEF/TRAN/M2016/1364 071.
Conflict of Interest
GK was employed by the company KPN, IP and VH were employed by the company Siemens Industry Software Netherlands.
The remaining authors declare that the research was conducted in the absence of any commercial or financial relationships that could be construed as a potential conflict of interest.
Publisher’s Note
All claims expressed in this article are solely those of the authors and do not necessarily represent those of their affiliated organizations, or those of the publisher, the editors and the reviewers. Any product that may be evaluated in this article, or claim that may be made by its manufacturer, is not guaranteed or endorsed by the publisher.
Acknowledgments
The authors like to thank all CONCORDA project partners for their contributions to this work.
Supplementary Material
The Supplementary Material for this article can be found online at: https://www.frontiersin.org/articles/10.3389/ffutr.2022.742731/full#supplementary-material.
References
5 GAA P-190033 (2019). V2x Functional and Performance Test Report; Test Procedures and Results. Report.
5 GAA Working Group1 (2019). C-V2X Use Cases Methodology, Examples and Service Level Requirements. White paper. Available at: https://5gaa.org/news/5gaa-releases-white-paper-on-c-v2x-use-cases-methodology-examples-and-service-level-requirements/.
5 G-PPP (2021). Service Performance Measurement Methods over 5G Experimental Networks. White paper – ICT-19 performance KPIs. doi:10.5281/zenodo.4748385
Amsterdam Group (2015). Signal Phase and Time (SPAT) and Map Data (MAP). ver 1.1 SPAT/MAP. Amsterdam, Netherlands: Amsterdam Group Institution.
C-ITS Platform (2018). C-ITS Platform Phase II: Certificate Policy for Deployment and Operation of European Cooperative Intelligent Transport Systems (C-ITS). Release 1.1. European Commission’s Communication.
Dey, K. C., Yan, L., Wang, X., Wang, Y., Shen, H., Chowdhury, M., et al. (2016). A Review of Communication, Driver Characteristics, and Controls Aspects of Cooperative Adaptive Cruise Control (CACC). IEEE Trans. Intell. Transport. Syst. 17, 491–509. doi:10.1109/TITS.2015.2483063
ETSI EN 302 663 (2012). Intelligent Transport Systems (ITS); Access Layer Specification for Intelligent Transport Systems Operating in the 5 GHz Frequency Band. V.1.2.0. France: ETSI.
ETSI EN 302 665 (2010). Intelligent Transport Systems (ITS); Communications Architecture. V1.1.1. France: ETSI.
ETSI TS 303 613 (2020). Intelligent Transport Systems (Its); Lte-V2x Access Layer Specification for Intelligent Transport Systems Operating in the 5 Ghz Frequency Band. V1.1.1. France: ETSI.
Giambene, G., Rahman, M. S., and Vinel, A. (2020). “Analysis of V2V Sidelink Communications for Platoon Applications,” in IEEE International Conference on Communications (ICC), Dublin, Ireland, 7-11 June 2020 (Dublin: IEEE). doi:10.1109/ICC40277.2020.9148968
Gonzalez, A., Villamil, A., Franchi, N., and Fettweis, G. (2019). “String Stable CACC under LTE-V2v Mode 3: Scheduling Periods and Transmission Delays,” in IEEE 5G World Forum (5GWF), Dresden, Germany, 30 Sept.-2 Oct. 2019 (IEEE), 292–297. doi:10.1109/5GWF.2019.8911631
Hedrick, J. K., Tomizuka, M., and Varaiya, P. (1994). Control Issues in Automated Highway Systems. IEEE Control. Syst. 14, 21–32. doi:10.1109/37.334412
IEEE 802.11p (2010). Wireless LAN Medium Access Control (MAC) and Physical Layer (PHY) Specifications Amendment 6: Wireless Access in Vehicular Environments. New York, United States: IEEE.
Katsaros, K., Kernchen, R., Dianati, M., and Rieck, D. (2011). “Performance Study of a green Light Optimized Speed Advisory (GLOSA) Application Using an Integrated Cooperative ITS Simulation Platform,” in International Wireless Communications and Mobile Computing Conference (IWCMC), Istanbul, Turkey, 4-8 July 2011 (Istanbul: IEEE). doi:10.1109/IWCMC.2011.5982524
Lei, C., van Eenennaam, E. M., Wolterink, W. K., Karagiannis, G., Heijenk, G., and Ploeg, J. (2011). “Impact of Packet Loss on CACC String Stability Performance,” in International Conference on ITS Telecommunications (ITST), St. Petersburg, Russia, 23-25 Aug. 2011 (St. Petersburg: IEEE), 381–386. doi:10.1109/ITST.2011.6060086
Lianghai, J., Weinand, A., Han, B., and Schotten, H. D. (2017). “Feasibility Study of Enabling V2X Communications by LTE-Uu Radio Interface,” in International Conference on Communications in China (ICCC), Qingdao, China, 22-24 Oct. 2017 (Qingdao: IEEE). doi:10.1109/iccchina.2017.8330349
MathWorks (2021). Parallel Hybrid Transmission. Available at: https://nl.mathworks.com/help/physmod/sdl/ug/parallel-hybrid-transmission.html (Accessed December 12, 2020).
Nafi, N. S., Khan, R. H., Khan, J. Y., and Gregory, M. (2014). “A Predictive Road Traffic Management System Based on Vehicular Ad-Hoc Network,” in Australasian Telecommunication Networks and Applications Conference (ATNAC), Southbank, VIC, Australia, 26-28 Nov. 2014 (Melbourne: IEEE), 135–140. doi:10.1109/ATNAC.2014.7020887
Passchier, I., Driessen, B., Heijligers, B., and Netten, B. (2011). “The Road Side Unit for the A270 Test Site the Road Side Unit for the A270 Test Site,” in 8th ITS European Congress, Lyon, France (Lyon: TNO), 1–5.
Passchier, I., Van Vugt, G., and Tideman, M. (2015). “An Integral Approach to Autonomous and Cooperative Vehicles Development and Testing,” in IEEE 18th International Conference on Intelligent Transportation Systems, Gran Canaria, Spain, 15-18 Sept. 2015 (Gran Canaria: IEEE), 348–352. doi:10.1109/ITSC.2015.66
Ploeg, J., Scheepers, B. T., Van Nunen, E., Van de Wouw, N., and Nijmeijer, H. (2011). “Design and Experimental Evaluation of Cooperative Adaptive Cruise Control,” in Int. IEEE Conf. Intell. Transp. Syst, Washington, DC, USA, 5-7 Oct. 2011 (IEEE), 260–265. doi:10.1109/itsc.2011.6082981
Pyykönen, P., Lumiaho, A., Kutila, M., Scholliers, J., and Kakes, G. (2020). “V2X-supported Automated Driving in Modern 4G Networks,” in International Conference on Intelligent Computer Communication and Processing (ICCP), Cluj-Napoca, Romania, 3-5 Sept. 2020 (Cluj-Napoca: IEEE). doi:10.1109/ICCP51029.2020.9266189
RDW (2021). RDW Testcentrum. Available at: https://www.rdw.nl/zakelijk/branches/fabrikanten-en-importeurs/typegoedkeuring-aanvragen/testen/rdw-testcentrum.
Santa, J., Pereñíguez, F., Moragón, A., and Skarmeta, A. F. (2014). Experimental Evaluation of CAM and DENM Messaging Services in Vehicular Communications. Transportation Res. C: Emerging Tech. 46, 98–120. doi:10.1016/j.trc.2014.05.006
van de Sluis, J., Baijer, O., Chen, L., Bengtsson, H. H., Garcia-Sol, L., and Balaguer, P. (2015). I-GAME D3.2: Proposal for Extended Message Set for Supervised Automated Driving. European Commission.
World Health Organization (2018). Global Status Report on Road Safety 2018. Geneva, Switzerland: World Health Organization.
Xing, H., Ploeg, J., and Nijmeijer, H. (2019). Compensation of Communication Delays in a Cooperative ACC System. IEEE Trans. Veh. Tech. 69, 1177–1189. doi:10.1109/TVT.2019.2960114
Keywords: C-ITS, ITS-G5, LTE Uu, LTE PC5, CACC, GLOSA, MEC, MQTT
Citation: Cimoli B, Xing H, Ho V, Passchier I, Kakes G, Rommel S, Nijmeijer H and Tafur Monroy I (2022) Practical Challenges in Hybrid Communication Ecosystems Based on ITS-G5 and LTE for CACC and GLOSA. Front. Future Transp. 3:742731. doi: 10.3389/ffutr.2022.742731
Received: 16 July 2021; Accepted: 24 January 2022;
Published: 11 March 2022.
Edited by:
Jose Santa, Universidad Politécnica de Cartagena, SpainCopyright © 2022 Cimoli, Xing, Ho, Passchier, Kakes, Rommel, Nijmeijer and Tafur Monroy. This is an open-access article distributed under the terms of the Creative Commons Attribution License (CC BY). The use, distribution or reproduction in other forums is permitted, provided the original author(s) and the copyright owner(s) are credited and that the original publication in this journal is cited, in accordance with accepted academic practice. No use, distribution or reproduction is permitted which does not comply with these terms.
*Correspondence: Bruno Cimoli, Yi5jaW1vbGlAdHVlLm5s