 Samuel Petkac
 Tetsuya Sato
 Kun Xie
 Yusuke Yamani
- 1Department of Psychology, Old Dominion University, Norfolk, VA, United States
- 2Department of Psychology, Wichita State University, Wichita, KS, United States
- 3Department of Civil and Environmental Engineering, Old Dominion University, Norfolk, VA, United States
Trust is a crucial factor that influences human-automation interaction in surface transportation. Previous research indicates that participants tend to display higher levels of subjective trust toward lower-level automated systems compared to high-level automated systems. However, administering subjective trust measures via questionnaires can interfere with primary task performance, limiting researchers’ ability to measure trust continuously in a real-world manner. The current study investigated whether objective and subjective measures of trust exhibit similar patterns across different levels of automation in a simulated driving environment. Twenty-five drivers using an automated driving system (ADS) were randomly assigned to either an active (L2) or passive (L3) automated driving condition. Participants experienced eight near-miss driving scenarios with or without obstructions in a distributed driving simulator and rated their subjective trust before and after navigating the scenarios. Additionally, we coded hand positions from recorded video footage of the participants’ in-vehicle behavior. Hand placements were coded on a predefined five-point system near the time of the simulated connected vehicle technology’s collision alert. Results showed that drivers progressively lost trust in the automated system as they approached and passed the projected collision point in each scenario. Furthermore, drivers in the active condition displayed lower levels of trust than those in the passive condition. This finding contrasts with previous research suggesting that subjective trust ratings are comparable between Level 2 and Level 3 vehicle automation groups. These findings highlight a dissociation between subjective and behavioral measures of trust, suggesting that self-report methods may overlook important aspects of drivers’ trust that can be captured through behavioral measures.
Introduction
Motor vehicle accidents are the second leading cause of death due to unintentional injuries in the U.S., accounting for 42,514 deaths in 2022 with an estimated annual economic impact of $340 billion (IIHS, 2024). Despite a gradual decline of vehicle crash deaths per 100 million miles traveled since 1975, total vehicle deaths have not shown the same decline (IIHS, 2024). Additionally, a major factor in 94 percent of all crashes is human error (NHTSA, 2008; National Highway Traffic Safety Administration, 2017). Human errors include but not limited to turning into an intersection, failing to stay in the proper lane, and failing to maintain control of the vehicle. However, with the development of automated vehicle technology, modern vehicles are beginning to rely less on human intervention and more on emerging technologies such as advanced sensors, automation, and connected vehicle technologies (Yamani et al., 2024a).
The current taxonomy of vehicle automation, as defined in the Society of Automotive Engineering (SAE) J3016, defines six levels of vehicle automation. Level 0 provides momentary driving assistance (e.g., lane departure and collision alerts, or emergency safety interventions) while the driver remains fully in control of the vehicle. Level 1 automation still requires the driver to be responsible for the vehicle, but the automated system can perform either steering or acceleration/braking. Level 2 automation provides continuous assistance with both acceleration/braking and steering while the driver needs to be prepared to take over at any time. In level 3 automation, the system handles all aspects of the driving task within its operational design domain (ODD) while the driver monitors the system. In level 4 automation, the system is fully responsible for driving tasks, operating the vehicle within its ODD while the driver only acts as a passenger and does not need to be engaged in the task. Level 5 automation is the last level, and when engaged, the system can operate the vehicle autonomously under all roadways and road conditions.
Even though automated vehicles are expected to decrease accident rates (Wang et al., 2020), road accidents still occur when an automated system is implemented in a vehicle (Kuehn and Bende, 2019). Between July 2021 and May 2022, 367 accidents occurred that involved a Level 2 automated vehicle (NHTSA, 2022). Of the 98 accidents where injury information was reported, 11 resulted in serious injuries or fatality. Furthermore, Honda vehicles accounted for the second most accidents across makes with 90, and Tesla accounted for the most with 273. It is worth noting that this higher crash count may be due to the greater number of Level 2 automated vehicles on the road, resulting in increased exposure. Thus, these crash numbers may not accurately reflect relative risk associated with automated vehicles.
One accident that was especially eye-opening was the fatal Tesla crash on 7 May 2016. While being operated in autopilot mode, a Tesla Model S struck a tractor trailer that was crossing an intersection on a highway, causing fatal injuries to the Model S operator (NTSB, 2016). An investigation surrounding the accident found that the emergency brake system had not attempted to stop or provide any warnings to the driver. Human error was deemed to be the cause of the accident, but it was argued that the design of the autonomous system played a significant role (Banks et al., 2018). Accidents that involve automation can impact many factors of human-automation interaction, and one factor that drives human-automation interaction is trust.
Trust is a critical determinant for successful interaction between a human operator and automation (Hoff and Bashir, 2015; Karpinsky et al., 2018; Lee and See, 2004; Muir, 1994; Muir and Moray, 1996; Yamani et al., 2020). Research on automation trust emerged from studies on interpersonal trust, which has been defined as an attitude (e.g., Rotter, 1967), a willingness to be vulnerable (e.g., Mayer et al., 1995), and a state of perceived risk (e.g., Kramer, 1999). Lee and See (2004) defined trust as “an attitude that an agent will help achieve an individual’s goal in a situation characterized by uncertainty and vulnerability” (p. 51), drawing on Ajzen and Fishbein’s (1980) original theoretical framework. According to Ajzen and Fishbein (1980), an attitude shapes behavioral intention based on beliefs and contextual information. In accordance with Lee and See’s (2004) definition, the present study defines trust as an attitude that influences the willingness to rely on automation when automation is not perfectly reliable.
Muir and Moray (1996) conducted an empirical study that aimed to examine whether automation trust grows similarly to interpersonal trust (Barber, 1983; Rempel et al., 1985). Specifically, they tested that automation trust is governed by predictability (i.e., consistency of automation behaviors), then dependability (i.e., dependence on automation), and finally faith (i.e., certainty of future state of automation) as operators interacted with automation. However, their results indicated the opposite pattern such that faith governed trust at the beginning of their interaction with automation, followed by dependability and then predictability (but see Lee et al., 2021; Long et al., 2022). Together, the results suggest that 1) automation trust is a multifaceted construct as interpersonal trust and 2) automation trust tends to evolve in a different trajectory than interpersonal trust. Expanding upon Muir and Moray (1996), Lee and See (2004) proposed three bases of trust development including performance (i.e., observable behavior of automation), process (i.e., underlying algorithm that automation operates on), and purpose (i.e., system designer’s intention for developing automation). Hoff and Bashir (2015) further extended this theoretical framework by introducing additional dimensions of trust such as dispositional (e.g., age and gender) and contextual factors (e.g., system transparency and anthropomorphism). These theoretical frameworks imply that automation trust is indeed a multifaceted construct, and a single measure is unlikely to be able to comprehensively capture the complexities of the construct.
Trust is often measured using subjective (e.g., Chancey et al., 2017; Jian et al., 2000), physiological (e.g., Hergeth et al., 2016; Lu and Sarter, 2019) and/or behavioral measures (e.g., Yu et al., 2021). On subjective measures, researchers ask participants to provide subjective ratings on questionnaire items for a specific scale that aims to measure trust. Jian et al.’s (2000) trust scale was empirically developed and aims to measure trust and distrust toward automation. More recently, Chancey et al. (2017) proposed a scale, adapted from Madsen and Gregor’s (2000) trust scale, that rests on the triad theory of automation trust by Lee and See (2004) to assess three attributions of trust--performance-, process-, and purpose-based trust. While both scales often show high internal consistency, the two scales likely measure two weakly related aspects of automation trust (Yamani et al., 2025). Second, some physiological measures have been shown to predict the human operator’s trust (Hergeth et al., 2016; Lu and Sarter, 2019; Sato et al., 2023b). Some studies demonstrated a negative correlation between eye movements and trust in automation in a simulated flight environment (Sato et al., 2023a) and in automated driving (Hergeth et al., 2016).
Finally, certain behaviors predict automation trust. These include human-automation response agreement, compliance to and reliance on automation (Chancey et al., 2017; Dixon et al., 2006), and hand placement on the steering wheel (Yu et al., 2021). Often, researchers characterize response patterns of human participants when automation issues are either congruent or incongruent from decisional recommendation in a decision-making task (Bartlett and McCarley, 2019; Chancey et al., 2017; Dixon et al., 2006; Meyer, 2001; Meyer et al., 2014; Yamani and McCarley, 2016). Unlike the analysis of response patterns, Yu et al. (2021) demonstrated that trust in automation can be assessed by examining the driver’s hand position on the steering wheel. In the study, drivers who rated low, medium, and high trust levels exhibited top (i.e., placing at least one hand on the top of the steering wheel), mid (i.e., placing one hand on the middle of the steering wheel while other hand is hovering, resting, or on the bottom or middle of the steering wheel), and low (i.e., placing one hand on the bottom of steering wheel while other hand is hovering, resting, or on the bottom of the steering wheel) hand position, respectively.
The literature on automation trust has collected mounting evidence that driver trust toward a partially automated vehicle (Gold et al., 2015; Yamani et al., 2024b; Yu et al., 2021) and a fully autonomous vehicle (Lee and Kolodge, 2020; Li et al., 2023) can influence driver takeover performance. However, few works directly compared trust across different levels of automation in a driving environment (Kircher et al., 2013; Verberne et al., 2012). Findings from these studies supported Hoff and Bashir’s (2015) prediction that drivers display lower trust towards systems with greater levels of automation due to higher levels of automation taking human operators “out of the loop” and lower levels of automation keeping operators “in the loop.” For example, Kircher et al. (2013) demonstrated that participants rated lower trust towards adaptive cruise control (ACC) systems that can follow a lead vehicle (i.e., high automation level) compared to ACC systems with no such capability (i.e., low automation level). Also, Verberne et al. (2012) demonstrated that participants rated higher trust towards ACC systems that provide instructions for driving a vehicle (i.e., low automation level) compared to ACC systems that can take over control of the vehicle (i.e., high automation level). Yet, it is uncertain whether behavioral measures of trust follow similar patterns across different levels of automation in a driving environment where drivers may need to anticipate for a road hazard.
This short communication reports a result of analysis of hand position data and subjective trust ratings from drivers of either L2 or L3 SAE vehicle automation in a distributed driving simulator as reported in Yamani et al. (2024a). The driving simulator study examined driving performance in several risky scenarios according to pre-crash scenario typology by NHTSA (2025a). In a distributed driving simulator environment, multiple simulators are connected via a local network, which allows researchers to examine driving behaviors in near-miss scenarios closely replicated across participants. The present analysis of hand position data of drivers in Yamani et al. (2024a) followed the protocol of Yu et al. (2021), in which trust was measured by participants’ hand positions on the steering wheel at critical points-- 1.5 s before, 1 s before, 0.5 s before, at the onset, and 0.5 s after the onset of an alert. Hands positioned higher on the steering wheel were indicative of lower trust in the automated system while hands positioned lower on the steering wheel were indicative of higher trust. We hypothesized that participants in the L2 group would display more trust in the automated system than those in the L3 group, as measured by hand position on the steering wheel and subjective trust ratings.
Methods
A fuller description of the method is in Yamani et al. (2024b). Briefly, a distributed driving simulation platform (Realtime TechnologiesInc, 2023) was used for this study. Four high-risk driving scenarios selected from the NHTSA Pre-Crash Scenario Typology (NHTSA, 2025a) were modeled using SimCreator for driving simulation. These included two intersection scenarios and two highway merging scenarios, each modeled both with and without visual obstruction that occluded the entry of a conflict vehicle, resulting in a total of eight scenarios. In the present study, we analyzed video data available from 25 licensed drivers (4 females; mean age = 31.00 years, SD = 6.03 years, range = 22–46 years; mean years since obtaining a license = 12.04 years, SD = 7.99 years) of a total of 48 drivers recruited from Old Dominion University for Yamani et al. (2024a). None of the 25 drivers included in the current analysis showed symptoms of simulator sickness. Each participant was randomly assigned to either active (L2) or passive (L3) automated driving system (ADS) group. The partial-cab simulator (Real-Time Inc., Figure 1.) behaved the same for both groups, but the type of instruction given to participants was manipulated.
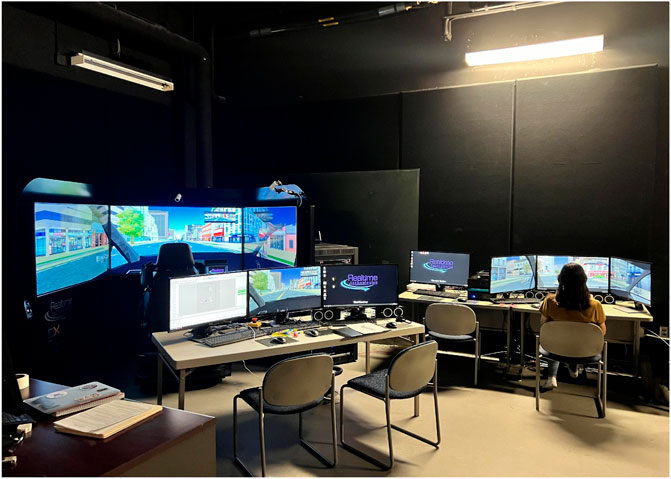
Figure 1. Distributed Driving Simulator Platform at Old Dominion University. A partial-cab driving simulator (RDS-1000; left) and a desktop simulator (RDS-100; right).
Following Samuel et al. (2020), the level of vehicle automation was manipulated by the framing of the driver’s responsibility. Participants in the active and passive ADS groups were given different instructions on how to operate the automated vehicle and how to take over the vehicle if a warning is issued. The participants in the active ADS driving group were told: “You are expected to have your hands on the steering wheel and foot over the brakes even though the simulator will handle the maneuvering (steering, braking, acceleration, and other vehicle control parameters) aspects of your driving throughout the entire simulation. You are also expected to pay attention to the forward roadway even though the vehicle handles your navigation in autonomous driving.” Participants in the passive ADS driving group were told that “All aspects of your drive will be handled by the simulation, but you need to be ready to take over if requested to do so by the system.” Participants completed a 5-min practice drive in the RDS-1000 to familiarize themselves with the driving simulator. During the practice session, participants were instructed to obey all traffic laws including traffic lights, signs, and signals for the practice and experimental trials. In addition, participants were informed about the function of the ADS. After practice drives, participants navigated a series of the eight scenarios presented randomly across participants. During each experimental drive, a trained experimenter drove in the networked simulator. The experimenter approached the predetermined collision point by manually controlling the vehicle’s speed and traveling direction. The experimenter controlled the vehicle based on the participant’s behavior as viewed in the top-down scenario map on the master control display. In the experimental drive, participants were asked to abide by speed limit signs and obey all traffic rules. In addition, participants were briefed on how and where warning signs would appear on the display.
Each participant rated their subjective trust toward the ADS in Chancey et al. (2017) and Jian et al. (2000) trust scales before experiencing a series of driving scenarios in the simulator. Each participant filled out Chancey et al. (2017) and Jian et al. (2000) trust scales for a second time after the completion of their scenarios. Chancey et al. (2017) reported high internal consistency for their scale (Cronbach’s alpha = 0.97). Previous research has shown similar reliability for Jian et al.’s (2000) trust scale (Cronbach’s alpha = 0.94; Chavaillaz et al., 2016). Participants were either given course credit or were paid $20 at the conclusion of the study. Each experimental session took about 1 h to complete.
Data coding for hand placement on the steering wheel followed the protocol from Yu et al. (2021). Five levels of hand placement were coded as below.
Level 1 (Resting): both hands were at rest below the wheel, on participant’s lap, or beside participant’s body;
Level 2 (Hovering): one hand was hovering over the wheel, and the other hand was hovering or resting;
Level 3 (Low): one hand was in the low area of the wheel, and the other hand stayed resting, hovering, or in the low area of the wheel;
Level 4 (Mid): one hand was in the middle area of the wheel, and the other hand stayed resting, hovering, or in the low or middle area of the wheel;
Level 5 (Top): at least one hand was in the top position of the wheel.
Hand placement data were coded at five different time intervals for each scenario -- 1.5, 1.0, and 0.5 s before the onset of the collision alert, at the onset of the alert, and 0.5 s after the onset of the alert.
To examine how different levels of vehicle automation (L2 vs. L3) impact behavioral measure of trust during near-collision events, hand position data were analyzed using a mixed analysis of variance (ANOVA) with Time (−1.5s, -1s, -.5s, 0, vs. +.5s from the onset of the takeover request) as a within-subject factor and Group (L2 vs. L3 ADS) as a between-subject factor. Due to an eye tracker failure, 5.5% of the hand position data were lost, resulting in 955 valid data points included in the analysis. Assumption checks revealed no violations of normality. However, Mauchly’s test indicated a violation of the sphericity assumption. As a result, the Greenhouse-Geisser correction was applied to adjust the degrees of freedom where necessary. To further investigate the relationship between driver hand position and subjective trust, a series of Spearman rank correlation analyses were conducted as hand position data were measured on an ordinal scale. Specifically, we assessed whether hand position was associated with each dimension of Jian et al. (2000) and Chancey et al. (2017) trust scales. These analyses were based on trust questionnaire responses collected after participants completed the driving task. Post-task ratings were used because they were more likely to reflect participants’ trust after experiencing near-collision events rather than their initial trust.
Results and discussion
Results indicated that drivers generally maintained hand positions on the lower area of the steering wheel across the time points but progressively moved their hands to higher positions as they approached and received the takeover request (Figure 2), F (1.69, 39.01) = 2.86, p = 0.03, η2G = 0.0006. Although the effect size was small, this pattern suggests that drivers increasingly lose trust in the automated system as the hazardous scenarios unfolded, regardless of the level of vehicle automation. The upward shift in hand position may reflect an anticipatory response, in which participants subtly adjusted their hands in preparation for resuming manual control, potentially signaling early signs of automation disuse. Most important, drivers in the L2 ADS averaged a higher score on the Yu et al. (2021) hand position scale than drivers in the L3 ADS group, M = 3.60 vs. 2.45, F (1,23) = 8.78, p = 0.007, η2G = 0.28, indicating lower trust than the L3 ADS group (cf. Yu et al., 2021). This contrasts with the findings on subjective trust ratings reported in Yamani et al. (2024b) that the drivers reported trust ratings comparable between the L2 and L3 groups, M = 3.56 vs. 3.70, t < 1, n. s. On Jian et al. (2000) trust scale; M = 6.88 vs. 8.53, t(23) = 1.33, p = 0.19 on Chancey et al. (2017) trust scale. Additionally, this finding contrasts with Hoff and Bashir’s (2015) theoretical prediction that trust decreases as the level of automation increases. One possible explanation is that the near-collision events heightened attentional demand and perceived risk, which may have led to increased trust in the L3 ADS. Prior research suggests that trust in automation can actually increase under conditions of high task load and elevated risk (Sato et al., 2020).
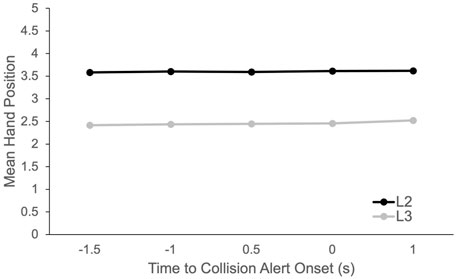
Figure 2. Mean hand position as a function of time to the onset of collision alert.
The results from Spearman rank correlation analyses indicated no significant associations between hand position and any dimension of Jian et al. (2000) or Chancey et al. (2017) trust scales (−0.38 < r < 0.16, n. s.) except that a significant negative correlation was found between Distrust on Jian et al. (2000) scale and Yu et al. (2021) hand position scale in the L3 condition, r = −0.65, p = 0.02. This suggests that drivers in the L3 group tended to place their hands higher on the steering wheel when they reported lower levels of distrust. Taken together, the results largely suggest a dissociation between subjective and behavioral (objective) measures of trust. One possible reason for this discrepancy is the temporal delay between the development of trust during the task and the point at which it is reported. By the time participants completed the trust questionnaires, sufficient time may have passed for memory decay to occur, potentially dampening the trust levels experienced during the driving task and masking condition differences. Indeed, Yeh and Wickens (1988) reported that discrepancies between subjective and objective measures may be attributed differences in working memory demands. Moreover, subjective measurement techniques are inherently intrusive, as they typically must be administered after the target task. Completing a questionnaire often requires respondents to either temporarily suspend the ongoing task or divide their attention between task execution and subjective reporting.
The present study suggests that discrepancies between subjective and objective measures of trust may be attributed to differences in working memory demands. In contrast to Yu et al.’s (2021) behavioral trust scale, which revealed differences across experimental conditions, Yamani et al. (2024a) found that trust ratings were comparable across both the Jian et al. (2000) and Chancey et al. (2017) scales. Their findings support the idea that these questionnaires capture only weakly related aspects of trust.
A growing body of evidence indicates that trust in automation is dynamic, evolving in response to factors such as user disposition, situational context, system familiarity (Hoff and Bashir, 2015), perceived system capabilities (Sato, 2024), and attentional demand of the environment (Sato, 2024). ADS operate in inherently dynamic, unpredictable, and complex environments, making it likely that driver trust fluctuates accordingly. As such, there is a need for continuous and sensitive measurement technique to support effective integration of human drivers and automated and connected vehicle technologies.
Several limitations should be acknowledged in the present study. First, the manipulation of vehicle automation levels may have inadvertently introduced compliance effects. Participants in the passive ADS group were instructed to ‘be ready to take over if requested to do so by the system,” which may have encouraged direct compliance–where participants followed system prompts regardless of perceived system capability. As a result, observed differences in objective trust may partially reflect variations in compliance rather than trust alone. Future studies should manipulate automation levels in ways that isolate compliance effects to distinguish trust-related behaviors from compliance-driven responses. Second, the study’s relatively small sample size may have limited the statistical power to detect subtle effects. Therefore, results should be interpreted with caution. Future research should replicate the current findings with a larger sample to improve generalizability and statistical robustness. Third, while hand position served as a behavioral proxy for trust, it remains unclear whether this measure is more valid than physiological indicators. Future research should comprehensively evaluate the properties of different trust assessment methods including behavioral, subjective, and physiological techniques. Each method likely exhibit a unique combination of characteristics such as sensitivity, intrusiveness, diagnosticity, transferability, and implementation demands (Wierwille and Eggemeier, 2012). Identifying these attributes would help researchers and system designers better estimate driver trust in evolving automated and connected vehicle technologies. Fourth, although hand position data were originally coded on a five-point ordinal scale, they were treated as continuous to satisfy ANOVA assumptions. This decision may have introduced analytic limitations. Future research should consider appropriate methods for ordinal data, such as ordinal logistic regression (Harrell, 2015). Fifth, the present study recruited undergraduate students from a single university, which may limit the generalizability of the findings. To enhance external validity, future research should include participants from more diverse educational backgrounds. Sixth, while the dissociation between objective and subjective trust measures is consistent with theories of memory decay (Yeh and Wickens, 1988), the present study does not provide direct evidence to support this explanation. Although plausible, this hypothesis should be explicitly tested in future research. Finally, the present study did not analyze hand position transition probabilities, which could provide insights into the temporal dynamics of trust during near-miss events. Future work should aim to collect more granular behavioral data around critical moments to better understand fluctuations in driver trust.
Conclusion
The present study compared subjective and behavioral trust measures across different levels of automation in a series of high-risk driving scenarios. Results showed that drivers progressively placed their hands higher on the steering wheel in hazardous scenarios, irrespective of the levels of automation. This adjustment reflects a gradual decline in driver’s trust in automation during high-risk situation. Furthermore, drivers demonstrated lower trust in L2 ADS compared to L3 ADS, contrasting with Yamani et al.’s (2020) findings on drivers’ subjective trust rating. This dissociation between the subjective and behavioral trust measures indicates that behavioral measures may capture important aspects of drivers’ trust that subjective measures overlook. Our findings suggest that designers and practitioners incorporate objective and subjective trust measures to gain a comprehensive understanding of drivers’ trust, thereby informing design strategies that enhance safety in automated driving.
Data availability statement
The raw data supporting the conclusions of this article will be made available by the authors, without undue reservation.
Ethics statement
The studies involving humans were approved by Old Dominion University Institutional Review Board. The studies were conducted in accordance with the Declaration of Helsinki, local legislation and institutional requirements. The participants provided their written informed consent to participate in this study.
Author contributions
SP: Formal Analysis, Writing – original draft, Data curation. TS: Writing – review and editing. KX: Writing – review and editing, Funding acquisition, Project administration, Supervision. YY: Funding acquisition, Project administration, Supervision, Conceptualization, Formal Analysis, Investigation, Methodology, Writing – original draft.
Funding
The author(s) declare that financial support was received for the research and/or publication of this article. This study is based upon work supported by the National Science Foundation under Grant No. 1949760 (PI: Yamani) and by Batten College of Engineering and Technology at Old Dominion University under Multidisciplinary Research Seed Grant (PI: Xie).
Conflict of interest
The authors declare that the research was conducted in the absence of any commercial or financial relationships that could be construed as a potential conflict of interest.
Generative AI statement
The author(s) declare that no Generative AI was used in the creation of this manuscript.
Any alternative text (alt text) provided alongside figures in this article has been generated by Frontiers with the support of artificial intelligence and reasonable efforts have been made to ensure accuracy, including review by the authors wherever possible. If you identify any issues, please contact us.
Publisher’s note
All claims expressed in this article are solely those of the authors and do not necessarily represent those of their affiliated organizations, or those of the publisher, the editors and the reviewers. Any product that may be evaluated in this article, or claim that may be made by its manufacturer, is not guaranteed or endorsed by the publisher.
References
Ajzen, I., and Fishbein, M. (1980). Understanding attitudes and predicting social behavior. UpperSaddle River, NJ: Prentice Hall.
Banks, V. A., Plant, K. L., and Stanton, N. A. (2018). Driver error or designer error: using the perceptual cycle model to explore the circumstances surrounding the fatal Tesla crash on 7th May 2016. Saf. Sci. 108, 278–285. doi:10.1016/j.ssci.2017.12.023
Bartlett, M. L., and McCarley, J. S. (2019). No effect of cue format on automation dependence in an aided signal detection task. Hum. Factors. 61 (2), 169–190.
Chancey, E. T., Bliss, J. P., Yamani, Y., and Handley, H. A. (2017). Trust and the compliance– reliance paradigm: the effects of risk, error bias, and reliability on trust and dependence. Hum. Factors 59 (3), 333–345. doi:10.1177/0018720816682648
Chavaillaz, A., Wastell, D., and Sauer, J. (2016). System reliability, performance and trust in adaptable automation. Appl. Ergon. 52, 333–342. doi:10.1016/j.apergo.2015.07.012
Dixon, S. R., Wickens, C. D., and McCarley, J. S. (2006). “How do automation false alarms and misses affect operator compliance and reliance?,” Proceedings of the Human Factors and Ergonomics Society Annual Meeting, 50 (1), 25–29.
Gold, C., Körber, M., Hohenberger, C., Lechner, D., and Bengler, K. (2015). Trust in automation– before and after the experience of take-over scenarios in a highly automated vehicle. Procedia Manuf. 3, 3025–3032. doi:10.1016/j.promfg.2015.07.847
Harrell, F. E. (2015). “Ordinal logistic regression,” in Regression modeling strategies (Springer), 311–325. doi:10.1007/978-3-319-19425-7_13
Hergeth, S., Lorenz, L., Vilimek, R., and Krems, J. F. (2016). Keep your scanners peeled: gaze behavior as a measure of automation trust during highly automated driving. Hum. Factors 58 (3), 509–519. doi:10.1177/0018720815625744
Hoff, K. A., and Bashir, M. (2015). Trust in automation: integrating empirical evidence on factors that influence trust. Hum. Factors 57 (3), 407–434. doi:10.1177/0018720814547570
Jian, J. Y., Bisantz, A. M., and Drury, C. G. (2000). Foundations for an empirically determined scale of trust in automated systems. Int. J. Cognitive Ergonomics 4 (1), 53–71. doi:10.1207/S15327566IJCE0401_04
Karpinsky, N. D., Chancey, E. T., Palmer, D. B., and Yamani, Y. (2018). Automation trust and attention allocation in multitasking workspace. Appl. Ergon. 70, 194–201. doi:10.1016/j.apergo.2018.03.008
Kircher, K., Larsson, A., and Hultgren, J. A. (2013). Tactical driving behavior with different levels of automation. IEEE Trans. Intelligent Transp. Syst. 15 (1), 158–167. doi:10.1109/tits.2013.2277725
Kramer, R. M. (1999). Trust and distrust in organizations: emerging perspectives, enduring questions. Annu. Rev. Psychol. 50 (1), 569–598. doi:10.1146/annurev.psych.50.1.569
Kuehn, M., and Bende, J. (2019). Accidents involving cars in automated mode–Which accident scenarios will (Not) be avoided by level 3 systems? Ger. Insur. Accid. Res.
Lee, J., Yamani, Y., Long, S. K., Unverricht, J., and Itoh, M. (2021). Revisiting human-machine trust: a replication study of Muir and Moray (1996) using a simulated pasteurizer plant task. Ergonomics, 64 (9), 1132–1145.
Lee, J. D., and Kolodge, K. (2020). Exploring trust in self-driving vehicles through text analysis. Hum. Factors 62 (2), 260–277. doi:10.1177/0018720819872672
Lee, J. D., and See, K. A. (2004). Trust in automation: designing for appropriate reliance. HumanFactors 46 (1), 50–80. doi:10.1518/hfes.46.1.50.30392
Li, J., He, Y., Yin, S., and Liu, L. (2023). “Effects of automation transparency on trust: evaluating HMI in the context of fully autonomous driving,” in Proceedings of the 15th International Conference on Automotive User Interfaces and Interactive Vehicular Applications, 311–321. doi:10.1145/3580585.3607171
Long, S. K., Lee, J., Yamani, Y., Unverricht, J., and Itoh, M. (2022). Does automation trust evolve from a leap of faith? An analysis using a reprogrammed pasteurizer simulation task. Applied Ergonomics, 100, 103674.
Lu, Y., and Sarter, N. (2019). Eye tracking: a process-oriented method for inferring trust in automation as a function of priming and system reliability. IEEE Trans. Human-Machine Syst. 49 (6), 560–568. doi:10.1109/thms.2019.2930980
Madsen, M., and Gregor, S. (2000). Measuring human-computer trust. 11th Australas. Conf. Inf. Syst. 53, 6–8.
Meyer, J. (2001). Effects of warning validity and proximity on responses to warnings. Hum. Factors. 43 (4), 563–572.
Meyer, J., Wiczorek, R., and Günzler, T. (2014). Measures of reliance and compliance in aided visual scanning. Hum. Factors. 56 (5), 840–849.
Mayer, R. C., Davis, J. H., and Schoorman, F. D. (1995). An integrative model of organizational trust. Acad. Manag. Rev. 20 (3), 709–734. doi:10.2307/258792
Muir, B. M. (1994). Trust in automation: Part I. Theoretical issues in the study of trust and human intervention in automated systems. Ergonomics 37 (11), 1905–1922. doi:10.1080/00140139408964957
Muir, B. M., and Moray, N. (1996). Trust in automation. Part II. Experimental studies of trust and human intervention in a process control simulation. Ergonomics 39 (3), 429–460. doi:10.1080/00140139608964474
National Highway Traffic Safety Administration (2008). National motor vehicle crash causation survey: report to Congress Report No. DOT HS 811 059. Available online at: https://crashstats.nhtsa.dot.gov/Api/Public/ViewPublication/811059.
National Highway Traffic Safety Administration (2017). Automated driving systems: a vision for safety - NHTSA. Available online at: https://www.nhtsa.gov/sites/nhtsa.gov/files/documents/13069a-ads2.0_090617_v9a_tag.pdf.
National Transportation Safety Board (2016). Collision between a car operating with automated vehicle control systems and a tractor-semitrailer truck. Available online at: https://www.ntsb.gov/investigations/Pages/HWY16FH018.aspx#:∼:text=At%204%3A36%20p.m.%20eastern,2014%20Freightliner%20Cascadia%20truck%2Dtractor.
Realtime Technologies, Inc. (2023). Website. Available online at: https://www.faac.com/realtime-technologies/.
Rempel, J. K., Holmes, J. G., and Zanna, M. P. (1985). Trust in close relationships. J. Personality Soc. Psychol. 49 (1), 95–112. doi:10.1037//0022-3514.49.1.95
Rotter, J. B. (1967). A new scale for the measurement of interpersonal trust. J. Personality 35, 651–665. doi:10.1111/j.1467-6494.1967.tb01454.x
Samuel, S., Yamani, Y., and Fisher, D. L. (2020). Understanding drivers’ latent hazard anticipation in partially automated vehicle systems. Int. J. Hum. Factors Ergonomics 7 (3), 282–296. doi:10.1504/IJHFE.2020.110093
Sato, T. (2024). Tracing the development of trust in automation/autonomy in a multitasking environment. Norfolk, VA: Old Dominion University. Available online at: https://digitalcommons.odu.edu/psychology_etds/357.
Sato, T., Yamani, Y., Liechty, M., and Chancey, E. T. (2020). Automation trust increases under high-workload multitasking scenarios involving risk. Cognition, Technol. & Work 22, 399–407. doi:10.1007/s10111-019-00580-5
Sato, T., Inman, J., Politowicz, M. S., Chancey, E. T., and Yamani, Y. (2023a). “A meta- analytic approach to investigating the relationship between human-automation trust and attention allocation,”, 67. Sage CA: Los Angeles, CA: SAGE Publications, 959–964. Proceedings of the Human Factors and Ergonomics Society Annual Meeting1.
Sato, T., Islam, S., Still, J. D., Scerbo, M. W., and Yamani, Y. (2023b). Task priority reduces an adverse effect of task load on automation trust in a dynamic multitasking environment. Cognition, Technol. & Work 25 (1), 1–13. doi:10.1007/s10111-022-00717-z
Verberne, F. M., Ham, J., and Midden, C. J. (2012). Trust in smart systems: sharing driving goals and giving information to increase trustworthiness and acceptability of smart systems in cars. Hum. Factors 54 (5), 799–810. doi:10.1177/0018720812443825
Wang, L., Zhong, H., Ma, W., Abdel-Aty, M., and Park, J. (2020). How many crashes can connected vehicle and Automated Vehicle Technologies Prevent: a meta-analysis. Accid. Analysis & Prev. 136, 105299. doi:10.1016/j.aap.2019.105299
Wierwille, W. W., and Eggemeier, F. T. (2012). Recommendations for mental workload measurement in a test and evaluation environment. Hum. Factors. 35 (2), 263–281.
Yamani, Y., and McCarley, J. S. (2016). Workload capacity: a response time–based measure of automation dependence. Hum. Factors. 58 (3), 462–471.
Yamani, Y., Long, S. K., and Itoh, M. (2020). Human–automation trust to technologies for naïve users amidst and following the COVID-19 pandemic. Hum. Factors 62 (7), 1087–1094. doi:10.1177/0018720820948981
Yamani, Y., Glassman, J., Alruwaili, A., Yahoodik, S. E., Davis, E., Lugo, S., et al. (2024a). Post take-over performance varies in drivers of automated and connected vehicle technology in near-miss scenarios. Hum. Factors 66 (11), 2503–2517. doi:10.1177/00187208231219184
Yamani, Y., Long, S. K., Sato, T., Braitman, A. L., Politowicz, M. S., and Chancey, E. T. (2024b). Multilevel confirmatory factor analysis reveals two distinct human–automation trust constructs. Hum. Factors. 00187208241263774. doi:10.1016/j.nantod.2024.102215
Yamani, Y., Long, S. K., Sato, T., Braitman, A. L., Politowicz, M. S., and Chancey, E. T. (2025). Multilevel confirmatory factor analysis reveals two distinct human–automation trust constructs. Hum. Factors 67 (2), 166–180. doi:10.1177/00187208241263774
Yeh, Y. Y., and Wickens, C. D. (1988). Dissociation of performance and subjective measures of workload. Hum. Factors 30 (1), 111–120. doi:10.1177/001872088803000110
Keywords: trust, automated driving system, driving simulation, connected vehicle technology, hand position
Citation: Petkac S, Sato T, Xie K and Yamani Y (2025) Dissociation of subjective and objective measures of trust in vehicle automation: a driving simulator study. Front. Future Transp. 6:1627368. doi: 10.3389/ffutr.2025.1627368
Received: 15 May 2025; Accepted: 15 September 2025;
Published: 02 October 2025.
Edited by:
Qinaat Hussain, Qatar University, QatarReviewed by:
Muhammad Wisal Khattak, University of Hasselt, BelgiumZahid Hussain, Qatar University, Qatar
Abubeker Arshi, Qatar University, Qatar
Copyright © 2025 Petkac, Sato, Xie and Yamani. This is an open-access article distributed under the terms of the Creative Commons Attribution License (CC BY). The use, distribution or reproduction in other forums is permitted, provided the original author(s) and the copyright owner(s) are credited and that the original publication in this journal is cited, in accordance with accepted academic practice. No use, distribution or reproduction is permitted which does not comply with these terms.
*Correspondence: Yusuke Yamani, eXlhbWFuaUBvZHUuZWR1