 Davide Di Domenico
 Carlo Beatrice
 Ilaria Henke2
- 1National Research Council - Institute of Sciences and Technologies for Sustainable Energy and Mobility (CNR-STEMS), Naples, Italy
- 2Department of Engineering and Sciences, Universitas Mercatorum, Rome, Italy
- 3Department of Engineering, University of Campania “Luigi Vanvitelli”, Caserta, Italy
- 4Department of Architecture and Industrial Design, University of Campania “Luigi Vanvitelli”, Caserta, Italy
The transport sector’s decarbonization remains a critical challenge in reducing greenhouse gas (GHG) emissions and achieving the EU Green Deal 2030 targets (−43.7% with respect to 2005). This article develops forecasts for 2030 to assess the potential reduction in tank-to-wheel (TtW) and well-to-wheel (WtW) GHG emissions within the Italian road transportation sector. Two tendential scenarios, namely, “High Decarbo” and “Moderate Decarbo,” are constructed based on differing hypotheses and on adoption rates of measures and policies aimed at promoting sustainable transportation (e.g., subsidies for electric vehicles) that are already in effect. The “Moderate Decarbo” forecasts project a 12% TtW and a 15% WtW GHG emissions reduction compared to 2005 levels. Under favorable assumptions, GHG emissions could potentially be reduced by 28% TtW and 33% WtW, nearing EU targets but still falling below them. The impact of electrification has been broken down, and the hybrid electric vehicle (HEV) contribution on GHG reduction is expected to be very close to that of battery electric vehicles (BEVs), underlining the advantages that an increased spread of HEVs might have, in addition to the BEVs. The introduction of the law-required quantities of second-generation biofuels is the main driver for the higher WtW reductions. Two more “trend-breaking” 2030 scenarios are developed in which biofuels are spread, maximizing the Italian production capabilities to abate the environmental impact of the freight sector. In the High Decarbo scenario, the WtW GHG emissions reduction is up to 40%, demonstrating the impact that a smart use of biofuels might have.
1 Introduction
The European Union (EU) set the ambitious target of being the first carbon-neutral region by 2050. In 2019, the EU embraced the Green Deal, aiming to enhance well-being by mitigating the environmental impact of economic development through the promotion of innovative green technologies, expansion of green energy, ensuring accessible energy and clean air, and addressing social inequalities. Simultaneously, as part of the Green Deal, specifically in the Fit for 55 packages, the EU outlined its objectives to slash carbon dioxide emissions from the transportation sector by at least 55% by 2030. It is widely recognized that transport is more difficult to decarbonize than other sectors, and technological change alone cannot achieve ambitious GHG reductions (Danielis et al., 2021; Pietzcker et al., 2014; de Blas et al., 2020).
The sectors covered by effort sharing regulation (ESR), among which the Italian road transportation lies, must provide a global reduction of 43.7% GHG emissions compared to 2005 (European parliament, 2022). Assuming that this percentage would be spread equally across all ESR sectors, an important question comes to mind: Will the Italian transport sector be able to reduce its carbonaceous footprint by at least 43.7% in 2030 compared to the 2005 footprint?
The Emissions Trading System (ETS) II, which will incorporate the Italian road transport sector in 2027/2028, is expected to set the objective at −43% of GHG emissions compared to 2005. The two objectives are very similar, and the validity of the announced question will remain even for future policies.
The means to decarbonize the transport sectors are the subject of research and discussion. In recent years, electrification has been recognized as one of the strongest weapons against on-road-provided GHG emissions (Sorrentino et al., 2014). Light-duty vehicle (LDV) electrification provides very low CO2eq emissions (Rottoli et al., 2021), and the spreading of this technology to the heavy-duty vehicle (HDV) sector is currently under evaluation (Liimatainen et al., 2019); however, difficult problems must be overcome. The main ones are the long recharge times and limited battery capacity (Kucukoglu et al., 2021) that, considering the high amount of mileage that the long-haul HDVs must cover every day, represent a big obstacle that is not going to be solved soon (Arora et al., 2021). Moreover, as suggested in (Wang et al., 2021), the country’s electric system might not be able to satisfy an increase in the electric energy demand due to a hypothetical wide use of BEVs and plug-in hybrid electric vehicles (PHEVs). Cerruti et al. (2023) showed that Italy will not be able to have more than 7 million electric cars (about 17% of the Italian car fleet in 2023 (Associazione Nazionale Filiera Industria Automobilistica, 2024)) without increasing the net carbon emissions.
An important alternative to traditional fuels in the long-term scenario could be hydrogen (H2) with its zero carbon content that would lead to zero carbonaceous emissions related to fuel combustion. The potential of using hydrogen to feed internal combustion engines or use in fuel cell systems is being studied (Mogi et al., 2022; María de las Nieves Camacho et al., 2022), and hydrogen is expected to better fit the needs of HDVs than electricity. Second-generation biofuels are also worth considering. They derive from biomass (special crops on infertile soils and municipal and agricultural wastes) and do not impact the food chain. Because biomass captures CO2 during the life cycle (accumulating a “bio-credit”), burning their derivatives returns the captured CO2 to the environment, providing high benefits in the CO2eq net emission balance (Prussi et al., 2020). Hydrotreated vegetable oil (HVO) and compressed bio methane (CBM) can substitute for diesel and compressed natural gas (CNG) on the actual vehicle fleet, granting important advantages in a short time without the need to substitute vehicle technology (Noussan et al., 2024; Soam and Hillman, 2019). The Italian government approved a law decree that forces the fuel manufacturers to spread a minimum of 1.1 billion m3 of CBM and 1 million tons of HVO by 2030, but higher shares can be reached (Law decree, 2022). These alternatives to traditional carbon-based fuels are equally important, having their own advantages that could be exploited in specific fleet segments. The combined effects of the latter can be critical to reduce the impact of the road transport sector. As an example, it would be difficult to imagine a complete electrification of the road sector in 2030, both for the impact on the electric system and for the effective replacement of a wide fleet. Similarly, it is unlikely to envision a fleet powered entirely by H2. Combining the different technologies might be the solution.
The main objective of this work is to provide a realistic quantitative analysis on the amount of GHG emissions and energy consumption that the Italian vehicle sector is expected to produce and exploit in 2030 to underline the possible critical issues in meeting the set target introduced above and propose a realistic technology mix to eventually close the gap. The EU defined the targets, but it is up to the individual member states to figure out how to achieve them. This analysis is not only made for a pure characterization purpose; it also aims to identify realistic tools for Italy to make coherent, informed decisions on the policies needed to respect or get close to EU targets. That is why this work can be a highly particularized quantitative analysis of GHG emissions from the national road fleet. It is very important to establish the actual situation to evaluate future scenarios with the policies in place and to propose new technological paths that must be properly supported by new policies. It is this work’s highest point of originality, as until now, quantitative scenarios on a national scale with detailed analysis of mileage and technological evolution for 2030 have not been done.
The different technologies available today and those that are supposed to be available in 2030 are spread across the fleet by making plausible hypotheses, together with realistic assumptions on the fleet mileage. Even if the European targets are set (nowadays, but it might change in the next future) on a TtW base (European Commission, 2021), limiting the analysis to “on-road” emissions, the energy conversion in the vehicle for its traction (chemical energy of the fuel into kinetic energy of the vehicle) represents the last step of the energy carrier life cycle. For a correct computation of the net emission of CO2eq in the use phase of the vehicle fleet, the emission balance should also be extended to its production/extraction/distribution, in other words, on the WtW cycle. Although the official EU target (−43.7% wrt 2005) is defined on a TtW basis, in the present work, it has also been shifted to a WtW basis, as this approach provides a more accurate and comprehensive assessment of the overall emissions.
In this article, the TtW and WtW energy consumption and GHG emissions provided by two different tendential scenarios for 2030 (maximum and minimum decarbonization ones) have been numerically estimated. Tendential scenarios are so defined because they are developed considering the actual technological trends and ongoing policies. It is important to understand that there are infinite combinations of hypotheses that might reflect the real 2030 scenario. In such uncertainty, all the realistic assumptions highly in favor of decarbonization have been condensed in the high decarbonization (High Decarbo) scenario, while all the realistic assumptions less favorable to decarbonization have been condensed in the moderate decarbonization (Moderate Decarbo) scenario. In other words, the aim has been pursued by providing the extremes of a quantitative range in the middle of which the 2030 actual scenario will be placed. Two additional trend-breaking 2030 High Decarbo and Moderate Decarbo scenarios have been developed and characterized. These scenarios keep the total fleet mileage constant but vary the rate of technology spread; they are based on a very high use of biofuels for specific vehicle segments. In fact, Italy has the possibility to produce far more biofuels than required by law by 2030 (Law decree, 2022) through the main national fuel manufacturers.
The developed methodology will be discussed in the following sections, particularly dwelling on the main sources exploited (Istituto Superiore per la Protezione e la Ricerca Ambientale, Ministero della Transizione Ecologica, Joint Research Centre, Real Driving Emissions, and worldwide harmonized light-duty vehicles test procedure (WLTP) tests official data, etc.) and the emissions and consumption calculation algorithms utilized. To have the highest accuracy possible when evaluating technologies and their spread in particular fleet segments, a bottom-up approach-based model is needed; starting from the mileage of the fleet characterized through a deep segmentation, the emissions and consumption are calculated.
This is a complementary approach to the European reference method (based on the COPERT software), which estimates emissions by cross-checking vehicle demand with on-road energy vector sales (Ntziachristos and Samaras, 2024). The authors do not use sales data as input (except for validation purposes, as will be shortly explained) but rely solely on vehicle demand and specific consumption and emission coefficients typical of various vehicle categories, segmented by road trip type, EURO class, and propulsion technology. Additionally, the assumptions made regarding the evolution of vehicle demand, the environmental impact of the WtT processes of various energy vectors, and the amount of biofuels considered are specific to the Italian case.
The model has been validated for the 2022 scenario, for which there are many sources to compare the results to and ensure algorithm reliability. In particular, a comparison with fuels/energy carriers sold for road use was conducted to address the uncertainty arising from the variability of Italian official traffic data sources. This is essential to ensure, with reasonable accuracy, the estimated demand, which is the starting point of the 2030 scenarios. The methodology behind the fleet demand reconstruction will not be strongly deepened because it is not the aim of this work, and it is better described in another recent publication by Henke et al. (2024). Then, the 2030 High Decarbo and Moderate Decarbo scenarios results will be shown.
Even if the High Decarbo scenario is optimistic, it is very far from the target for both TtW and WtW analysis, underlining the difficulties for Italy to reach the EU requests. The results achieved by the trend-breaking scenarios are much better, highlighting the high potential of biofuels on a WtW basis in addition to the electrification process of the vehicle fleet. Although it is important to remember that the trend-breaking High Decarbo scenario is very difficult to realize, the result achieved is close to the EU target if considered in a WtW optic: -43.7% GHG emissions compared to 2005.
1.1 Context: energy vectors available in 2022 and expected in 2030
In 2022, the main utilized fuels/energy vectors in the Italian road transport sector were gasoline E5, diesel B7, natural gas (NG), liquefied petroleum gas (LPG), and electricity; the E5 and B7 refer to the share of biofuel utilized. The gasoline on the market is usually made with a 5% share of bioethanol, while diesel fuel is made with a 7% share of fatty acid methyl ester (FAME). Gasoline and diesel are very similar from a WtW perspective, emitting similar amounts of CO2eq per unit of energy produced by the combustion of the fuel on-road (TtW emission factors), just as the WtT processes produce similar amounts of CO2eq per energy unit of fuel supplied to service stations. NG has the highest hydrogen-to-carbon ratio among hydrocarbons, resulting in the lowest TtW emission factor among these fuels. Full electric vehicles do not emit on the road, but the WtT processes related to electricity do. Therefore, in a WtW perspective, the electric vehicles contribute to the global GHG emissions. It is worth mentioning that the Italian electricity production system is based on 40% renewable sources (Il sole 24 ore, 2023).
As stated in the introduction section, HVO, CBM, and H2 will be evaluated in the 2030 scenarios. HVO is used on an industrial scale in Europe (BIKE, 2021). However, its consumption and related GHG contribution in the 2022 global impact from the Italian road transport sector are negligible compared to diesel, and it has not been considered in the 2022 scenario. CBM is chemically equal to high-purity NG, and its on-road emissions can be considered equal, while HVO’s emission factor is slightly lower than diesel fuel, as the carbon content is slightly lower. Therefore, GHG emission benefits in the use of both HVO and CBM derive mainly from their very low WtT impact.
H2 is leading to zero carbon emissions on the road, but its production processes are critical. Indeed, the H2 production systems are highly energy-intensive, and if non-renewable energy sources are used, the GHG emissions linked to WtT are high. The Joint Research Centre (JRC) suggests that the WtT process efficiency will hardly improve for electricity in 2030, while the other technologies will most likely not take advantage of any significant enhancement. In particular, the Integrated National Plan Energy and Climate (PNIEC) provides the guidelines for the improvement of the Italian electricity production and distribution chain.
In Table 1, a comparison of the unitary GHG emission factors based on energy for the above-mentioned energy vectors is shown for the 2022 and 2030 scenarios (Prussi et al., 2020; Il sole 24 ore, 2023).
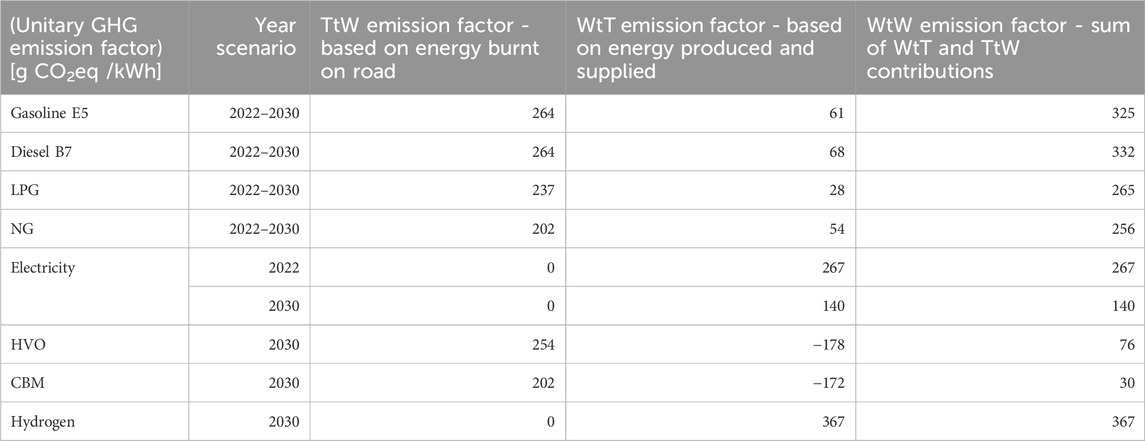
Table 1. Comparison of unitary GHG emission factors of the different technologies based on energy burnt on road or produced and transported.
The values presented refer to the Italian most commonly used pathways to produce and distribute the energy vectors. In 2022, electricity’s WtW emission factor is very close to those of LPG and CNG, even though the Italian mix consists of 40% from renewable sources. The WtT processes of hydrocarbon-based fuels are much less emissive than electricity ones (in particular LPG). Compared to gasoline E5 and diesel B7, a mean reduction of only 20% is achieved in a WtW optic. In 2030, the Italian mix is supposed to improve, and 55% of its energy source will be renewable. Consequently, the WtW emission factor is reducing from 267 gCO2eq/kWh to 140 gCO2eq/kWh, and each BEV will halve its environmental impact.
H2 production is very emissive, and the WtW emission factor reflects the problem, reaching 367 gCO2eq/kWh; higher than traditional fuels. If the WtT processes adequately shift toward renewable energy sources, its potential will be optimized as an energy carrier for internal combustion engine (ICE) and fuel cell vehicles, but the time framework will probably go beyond 2030.
HVO and CBM offer very low emission factors, with gains of ≈77% and ≈85% against their traditional counterparts, namely, diesel and NG. The negative values in the WtT columns referred to biofuels will be better explained in the Methodology section and mainly depend on the bio-credit. Biofuels are very competitive: The impact of HVO is half and that of CBM is about 1/5 that of electricity in 2030. The advantages that can be achieved through a wide use of biofuels can be important, also considering that there is no need for any technological change in the actual fleet, while their availability remains a crucial point that will be discussed later.
2 Methodology and assumptions
The research first aims to comprehensively estimate energy consumption and GHG emissions for the year 2022 to validate the calculation model. The model is based on different types of vehicles using different fuels and various road types. The choice of 2022 as the reference year is motivated by two main reasons: it was unaffected by the COVID-19 pandemic, and it was the most recent year with consolidated available data for circulated fleets and fuel/energy vector sales for road transport (Ministero della Transizione Ecologica, 2022). Update of the database is ongoing for 2023 and 2024; however, relevant changes are unexpected (CDN, 2024).
The bottom–up approach involves estimating Vehicles×Km for both passengers and freight, for the assumed categories.
A scheme of the main categories is reported in Figure 1.
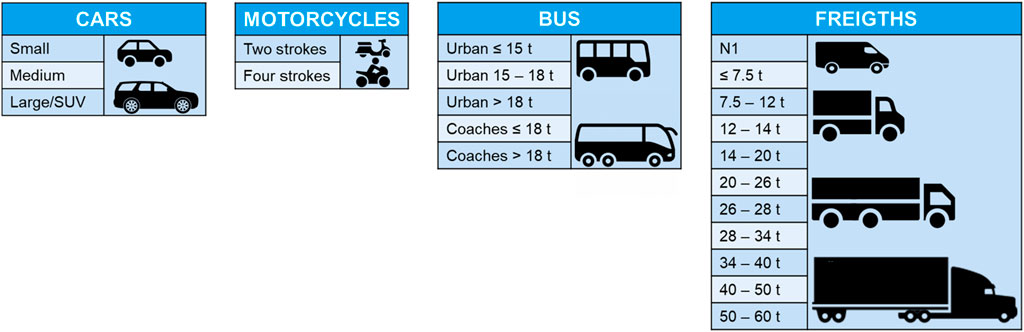
Figure 1. Road vehicle fleet segmentation.
Each category is subsequently divided per Euro category, trip category (urban, rural, highway) and fuel/energy vector used (diesel, gasoline, GPL, electricity, etc.). A multi-source and multi-type quantitative analysis was carried out to estimate the demand for passenger and freight mobility by type of road, vehicle, and euro emission class.
The estimation of Vehicle×km was achieved through statistical data derived from the primary national sources (e.g., The Institute for Environmental Protection-ISPRA (Istituto superiore per la protezione e la ricerca ambientale, 2021), National Institute for Training and Research in Transport-ISFORT (ISFORT, 2022), National Institute of Statistics-ISTAT (ISTAT, 2011), Ministry of Sustainable Infrastructures and Mobility-MIMS (MIMS, 2022), and the Urban Plans of Sustainable Mobility-PUMS). These data are often aggregated and not exhaustive of national mobility. This method enabled a detailed estimate of mobility demand for predefined categories, which is valuable for estimating emissions and consumption.
The second stage of the bottom–up approach involves computing emissions and consumption, beginning with the estimated matrix of Vehicle×km per vehicle segment, technology, and trip.
The TtW GHG emissions and energy consumption were calculated for each vehicle type and trip context (according to Equations 1, 2) to determine their yearly contribution to the scenario.
Where
• TtW CO2eq [g] is the total amount of GHG emissions for vehicle type and trip context
• TtW CO2eq [
• TtW [kWh] is the total energy spent for vehicle type and trip context
• EC [
It is important to underline that the specific coefficients strongly depend on the energy efficiency of vehicles. For example, hybrid vehicles are more efficient than ice-based vehicles on average, and the specific fuel consumption reduces for the same vehicle type (as the CO2eq emitted). The ISPRA database (FETRANSP, 2019b) served as the main source for specific emissions and energy consumptions that mainly derive from the use of the COPERT software. The collected values underwent validation, modifications, or additions, when necessary, through comparison with real driving emissions (RDE) data obtained by consulting different vehicle manufacturers’ data. Those data sources included the Vehicle Energy Consumption Calculation Tool (VECTO) data (Ragon and Rodríguez, 2021) for HDVs and homologation data provided by various vehicle manufacturers or data obtained through custom vehicle MATLAB code that estimates the energy consumption (and subsequent emissions) across a homologation cycle for LDVs.
This last method calculates the energy spent during a WLTP test cycle for the different passenger car segments and light commercial vehicles (LCVs). The various vehicle categories have been modelled considering the different average masses and resistances (aerodynamic, rolling, and inertia (Kühlwein, 2016), as well as the different powertrains. The ECWLTP
This formula is specifically valid for energy consumption along the whole WLTP cycle. However, it can be divided into three different parts succeeding each other over time: urban, rural, and highway. Adjusting the ECWLTP and the length to make them both correspond to a particular cycle section. Modifying the efficiency properly (e.g., a gasoline car has lower efficiency in an urban cycle than a rural one, while BEVs are more homogeneous (Achariyaviriya et al., 2024)), it is possible to estimate the specific consumption for urban, rural, and highway trips. The MATLAB vehicle model was validated through comparison with actual homologation data. Its outputs were utilized in cases where data sources were lacking (e.g., BEVs and rural trips). Additionally, adjustments were made to the WLTP data and MATLAB outputs to account for the expected increase in energy consumption when transitioning from homologation cycles to real driving conditions through correction factors. The average correction factor per vehicle class, technology, and trip was appropriately derived from various data sources, including reports on RDE test results and proprietary data (Pra et al., 2021; Doulgeris et al., 2021; Mamarikas et al., 2022; Orecchini et al., 2018; Al-Ogaili et al., 2020).
The averaged EC and CO2eq emissions per vehicle class, technology, and trip are shown for cars and commercial vehicles in Supplementary Appendix A.1–A.3 in Appendix A.
Starting from the TtW analysis, it became possible to determine the total fuel mass/volume (kg/L) consumed annually by the 2022 vehicle fleet. Starting from the TtW analysis, it became possible to determine the total fuel mass/volume (kg/L) consumed annually by the 2022 vehicle fleet, according to the following Equations 4, 5.
Where:
•
•
•
•
•
A minor proportion of bifuel LPG and CNG vehicle consumption was allocated to gasoline due to the automatic start in gasoline mode during the engine warm-up. Therefore, 7% of the trip (the initial part) always involves burning gasoline, according to Grzelak and Taubert (2021), who tested a medium bi-fuel LPG vehicle on the WLTP cycle. While this is a simplified approximation in estimating actual LPG and CNG consumption, as the gasoline consumption fraction varies depending on car type, engine calibration, and road trip, adopting this assumption yields more accurate estimations than ignoring it, as demonstrated later.
Following the TtW analysis, a WtT assessment was conducted. The yearly WtT emissions and energy consumption were evaluated according to the following Equations 6, 7:
The
The whole calculation procedure is summarized in the flowchart reported in Figure 2, which is valid for every category, energy vector, technology, and Euro class.
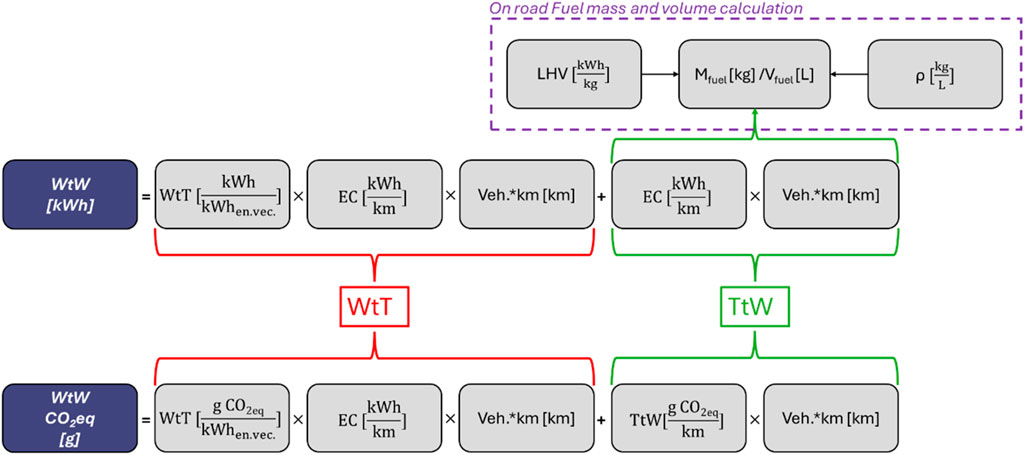
Figure 2. Flowchart of the methodology applied for calculating WtW energy consumption and GHG emissions for every category, technology, energy vector, and EURO class. The calculation of fuel mass and volume is based on TtW results aggregated by the energy vector.
The methodology is validated by comparing consumption estimates with sales data provided by the Italian Ministry for Ecological Transition (MiTE) (Il sole 24 ore, 2023). The same approach was utilized to assess the year 2005, facilitating a meaningful comparison with the data for 2030.
Validating the algorithms and methodology for the year 2022 was essential before characterizing 2005. This was done to minimize potential errors arising from many variables: data sources for 2005 are fewer and inherently less reliable than those for 2022 due to the utilization of older methodologies.
Two forecasting scenarios, Moderate Decarbo and High Decarbo, have been devised for the period 2022–2030, based on realistic penetration trends of diverse energy vectors. These scenarios incorporate different assumptions regarding exogenous variables and penetration rates of sustainable transportation measures and policies, including the introduction of renewable fuels like HVO, CBM, and hydrogen.
From a legislative standpoint, the “fit for 55” directive does not account for the Renewable Energy Directive III (RED III), which mandates a zero TtW emissive contribution for biofuels. However, the use of biofuels remains integral to the decarbonization trajectory of road transport, and both TtW and WtW GHG emissions must be computed.
The second-generation biofuels’ bio-credit (introduced in the above section) is considered in the balance of WtT CO2eq emissions, reducing the WtT specific environmental impact (
The bio-credit value depends on the biofuel source. The same types of biofuels produced by different sources have different bio-credit values. This explains the negative values for the WtT factors of HVO and CBM shown in Table 1: the bio-credit has a higher value than the raw GHG emissions produced for their production and distribution. However, if not used, the CO2 harvested by biomass would be naturally reintroduced to the environment during its decomposition, and the possible advantages provided would be lost. Because the production chain of second-generation biofuels primarily uses waste as its main source, their production represents a convenient waste recycling pathway. In Italy, important stakeholders produce and distribute HVO and CBM. Pure HVO is eligible to substitute for diesel for the EURO 6/VI vehicles (homologated to run with pure HVO 100%), while CBM can substitute for CNG for every vehicle technology. Furthermore, HVO can be blended with standard diesel fuel, up to approximately 15%, while remaining compliant with the current EU diesel specification EN590. This blended fuel can refuel all diesel vehicles, including those predating EURO VI/6 regulations.
For the Moderate Decarbo scenario, the expected available HVO and CBM quantities for the vehicle fleet are those that Italian fuel manufacturers are obliged by law to introduce on road: the previously introduced 1.1 billion m3 of CBM and 1 million tons of HVO (Law decree, 2022). A higher share has been hypothesized for High Decarbo, with the HVO available up to 2 million tons and CBM up to 1.5 billion m3 (Il sole 24 ore, 2023).
For the trend-breaking scenarios, HVO is hypothesized to reach 4.5 million tons, and CBM could reach 2.8 billion m3 (plausible values according to the main Italian stakeholders (Il sole 24 ore, 2023)). The 2030 vehicle fleets are the ones used for the previous tendential scenario analyses. The TtW analysis is the same as the tendential scenarios, as biofuels do not affect the latter.
The total WtW and TtW CO2eq emissions in 2030 were calculated and compared with the 2005 results to assess the achieved reductions. The target aim was set at −43.7% for both.
2.1 Road transportation demand (passenger and freight), energy consumption, and GHG emissions for the year 2022 and database validation
The total mileage of the 2022 scenario is depicted in Figure 3.
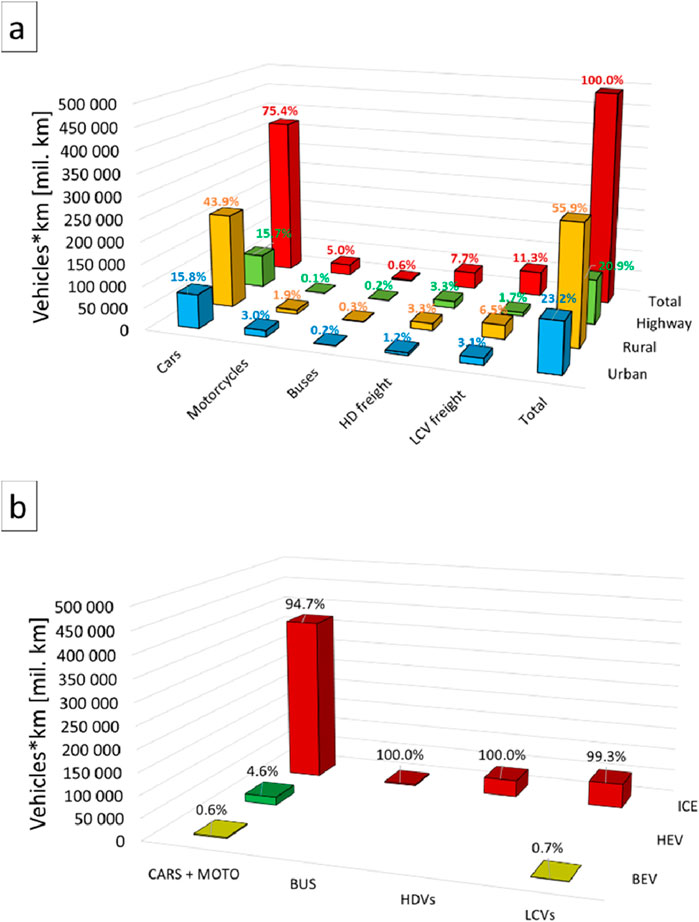
Figure 3. Mileage of vehicle fleet distribution for the year 2022 (a) per category and (b) per technology.
The total fleet demand stands at 491 billion km. Cars are responsible for approximately 75% of road mobility, freight sector accounts for 19%, and rural roads have the highest total mileage. Most vehicles are equipped with ICEs, and electrification is very rare; only 5% of cars (BEVs (0.6%) and HEVs (4.6%)), and 0.7% among LCVs. An increase in mileage of HEVs and BEVs for years 2023 and 2024 is expected, but no more than a few percent with respect to those estimated in 2022, so the global scenario of mobility demand is expected to be unchanged.
Figure 4 illustrates the global TtW GHG emissions (mil. t CO2eq).
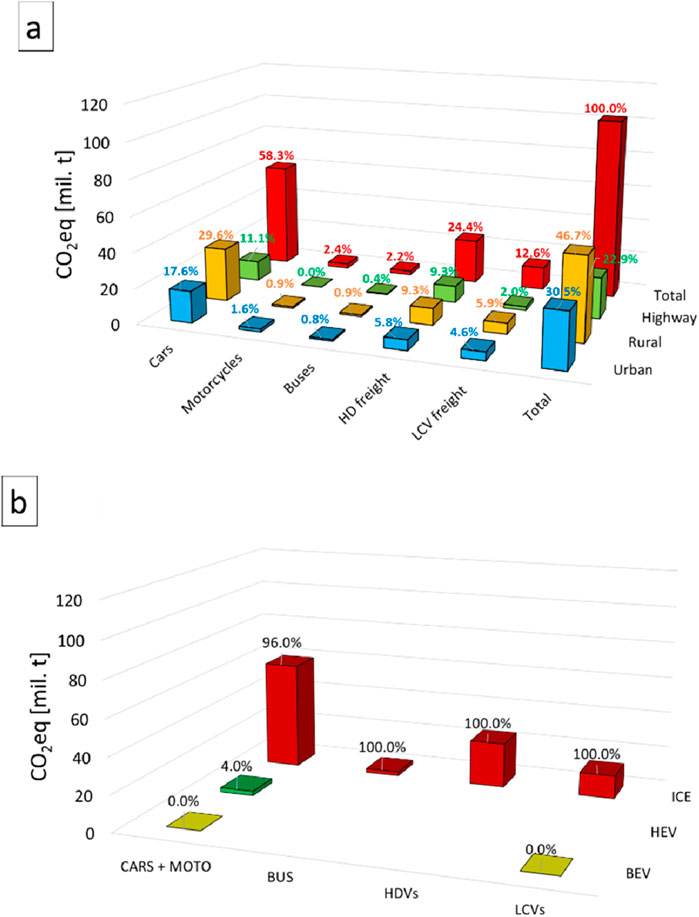
Figure 4. GHG TtW emissions for the year 2022 (a) per category and (b) per technology.
The total CO2eq emitted by the road transport sector in 2022 is approximately 102 million tons. Passenger mobility (cars, motorcycles, and buses) is responsible for 63% of road transport emissions; the remaining 37% is provided by freight. Moreover, it is also interesting that the impact of the urban sector on the total emissions from cars is 30%, which could be more easily reduced than other contributions with appropriate transport policies. In contrast, despite having lower mileage than LCVs (Figure 3a), HDV emissions are approximately twice as high. The BEVs do not emit on a TtW basis, and HEVs reduce their percentage contribution compared to mileage (Figure 3b) as they have higher efficiency than ICE vehicles (see data in the appendix).
The WtW GHG emissions divided per technology are shown in Figure 5.
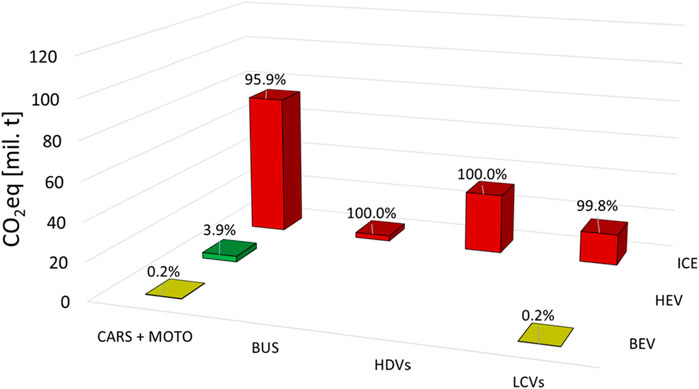
Figure 5. CO2eq WtW emissions per technology for year 2022.
The total amount of CO2eq emitted is up to 128 million tons, approximately 20% more than TtW. BEVs impact 0.2% both in cars and LCVs.
The bottom-up approach can be validated by comparing it with the fuels (diesel, gasoline, LPG, and NG) sold in Italy, as recorded by the MITE (Ntziachristos and Samaras, 2024) over the years, while electricity consumption for electric vehicles is available from MASE (Ministero dell’ambiente e della sicurezza energetica MASE, 2022). This comparison is shown in Table 2.
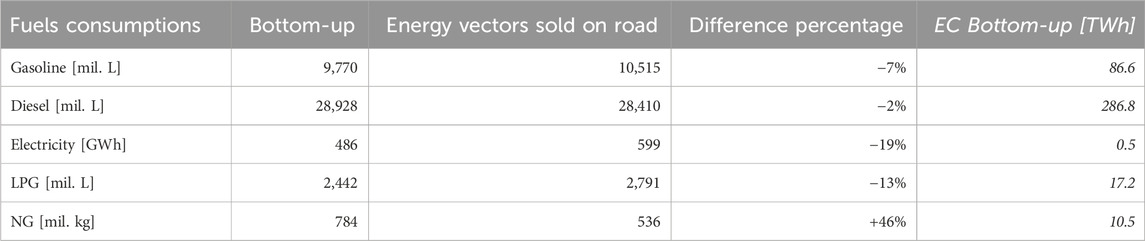
Table 2. Comparison of the bottom-up model estimates and energy vectors sold on road (Il sole 24 ore, 2023; Ministero dell’ambiente e della sicurezza energetica MASE, 2022).
Of the total energy demand in 2022 (401.6 TWh), diesel fuel is 71.4%, and gasoline 21.6%. Lower shares are provided by LPG and NG (respectively 4.3% and 3.6%); while the contribution of electricity is negligible. Only 9.3 TWh of gasoline are used for fueling HEVs.
A discrepancy of −7% for gasoline and −2% for diesel was observed between the volume of fuel sold and consumption estimates from the bottom-up approach. These values are robust, given the large number of liters considered. The bottom-up calculation for NG shows a 46% higher estimation than the amount sold on the road. This discrepancy is likely attributable to the sudden increase in NG prices in 2022. The unexpected and unpredictable nature of this variable led to a decrease in travel for many NG vehicles (both personal and commercial) in response to the gas crisis.
Calibrating the demand based on this specific event may not be the most appropriate choice for two reasons: the 2022 demand serves as the foundation for predictions up to 2030, and the NG market crisis was born from tensions between Russia and Europe due to the Ukraine conflict, despite the ample availability of NG resources worldwide. Therefore, once the crisis is resolved, it is anticipated that all NG vehicles will resume travel as usual, and the demand should readjust to expected values. The bottom-up approach also underestimates the electric consumption of vehicles due to a combination of anticipated errors. Improvements are needed in the specific consumption and emissions used for hybrid vehicles to better account for PHEVs. The energy consumption of PHEVs depends significantly on individual user behavior, as users have the freedom to decide how much they rely on electric or combustion modes, considerably varying the specific consumption.
In 2022, PHEVs surpassed BEVs in terms of usage, highlighting the impact that a flawed characterization of PHEVs can have on the presented results (Ministero dell’ambiente e della sicurezza energetica MASE, 2022). Additionally, it should be noted that the accuracy of the amount of electricity sold on the road may be compromised due to the proliferation of private recharge stations at people’s homes, making accurate counting challenging and introducing inherent errors.
However, despite the notable gap, the authors believe that it does not compromise the robustness of the estimates developed in the assumed scenarios.
2.2 2030 scenarios fleet demand and composition
The two tendential scenarios have been developed for the period spanning from 2023 to 2030. These scenarios take into account the evolution of demand, potential modal shifts, and technological advancements within the transportation sector. Given the uncertainty surrounding key socio-economic variables and consumer behaviors, post-pandemic effects, and geopolitical crises such as the Ukraine war and the Middle East crisis, it was necessary to explore extreme scenarios.
The High Decarbo scenario envisages more aggressive measures to mitigate travel growth (avoid the travel), transitioning toward low-carbon energy modes (shift the travel from road to other modes like train), and improving vehicles’ technology and efficiency (improve the travel).
A summary on the effects of evolution of demand, avoid, and shift policies on the total fleet mileage for both autos and freight transport in Italy is presented in Table 3 below. The renewed percentages of fleet due to the improved maneuvers are also included. A detailed discussion on the hypotheses made for both scenarios is provided by Ntziachristos and Samaras (2024). The data for buses and motorcycles have been neglected due to their much lower impact than cars in the passenger sector and to enhance the readability of the table.
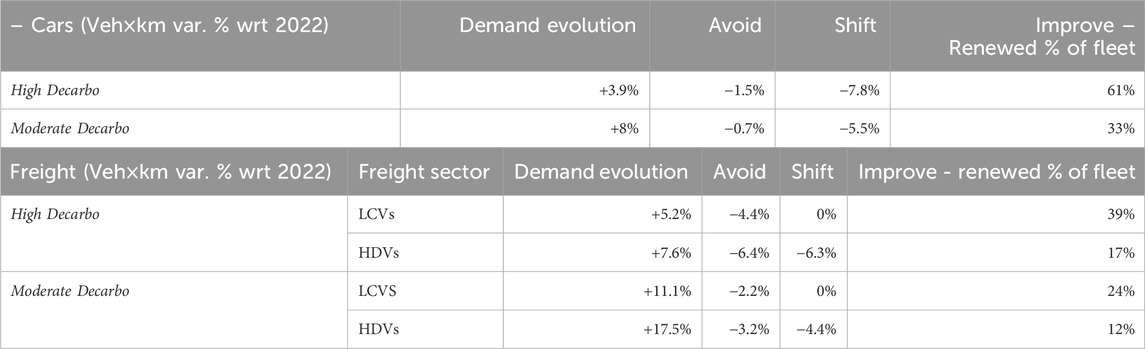
Table 3. Percentage variation of fleet mileage in 2030 compared to 2022 for auto (a) and freight (b), and renewal impact.
The demand evolution follows the more or less optimistic trends evidenced in the last decades. In both scenarios, new registrations across all vehicle categories include BEVs, HEVs, fuel cell electric vehicles (FCEVs), and hydrogen internal combustion engine vehicles (HICEV). However, the High Decarbo hypothesis deliberately prioritizes replacing older vehicles with newer and cleaner ones, thereby aiming to accelerate the transition to a more sustainable transportation system. The renewal process begins with the oldest vehicles, such as those classified as EURO 0, and gradually progresses to newer models. Once all EURO 0 vehicles are replaced, the renewal process extends to EURO 1 vehicles, and so forth, until the desired renewal rate is achieved. It is important to note that while this substitution hypothesis may occur with low probability, especially considering that EURO 4 and EURO 5 vehicles often have higher substitution rates with new vehicles, it represents the most favorable scenario in terms of both decarbonization impact and reduction of road traffic-related air pollution. EURO 0 and EURO 1 vehicles contribute significantly to air pollution, making their replacement crucial for improving air quality and reducing emissions.
The fleet modernization and higher penetration rates of low-emissive, highly efficient vehicles lead to the technological fleet composition reported in Figure 6.
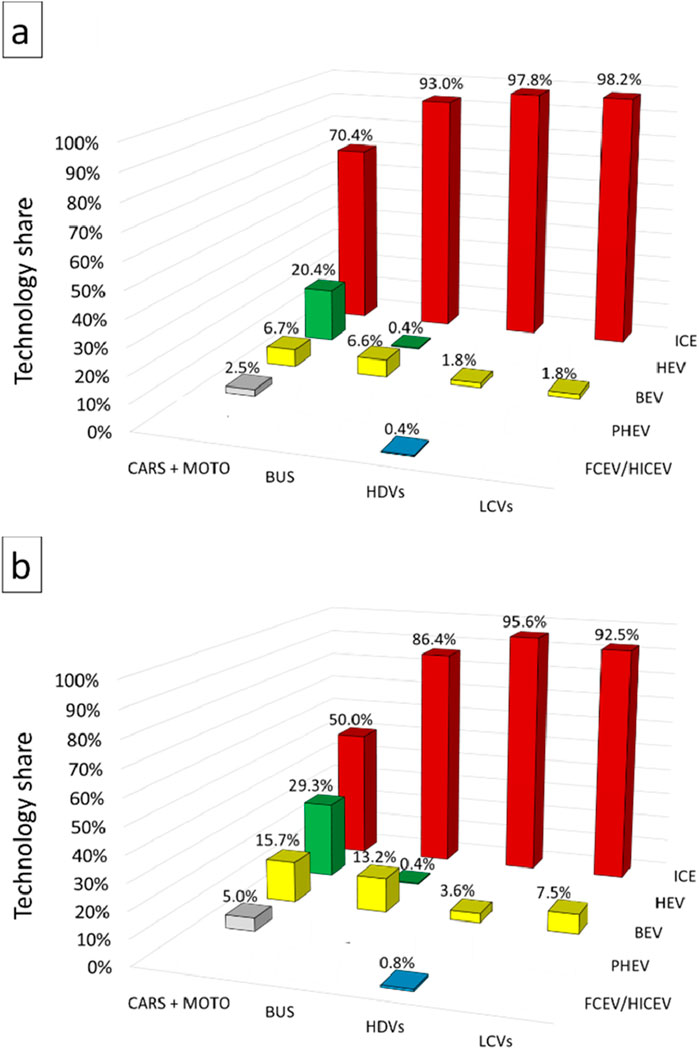
Figure 6. Technological composition of the 2030 fleets for the Moderate Decarbo scenario (a) and the High Decarbo scenario (b).
The electrification in the High Decarbo scenario is much more widespread. The HEVs cover 29.3% of the car demand, with the BEVs at 15.7% and PHEVs at 5.0%. Only the remaining 50% is covered by ICEs. An important share of BEVs is also hypothesized for buses and freight. A small hydrogen share has been introduced (0.8%) on long-haul freight vehicles. Lower percentages of such technologies are introduced in the Moderate Decarbo scenario. It is important to underline that a small part of the ICEV demand is covered by biofuels.
3 Results and discussion of 2030 scenarios
In the following section, the 2030 tendential scenarios will be discussed, and the 2030 trend-breaking scenarios will be revealed.
3.1 2030 tendential scenarios
In Figures 7–9, the results in terms of mobility demand (vehicles×km) and the corresponding equivalent GHG emission (CO2eq in millions of tons) are reported for 2022 and 2030 tendential scenarios and compared to the 2005 ones.
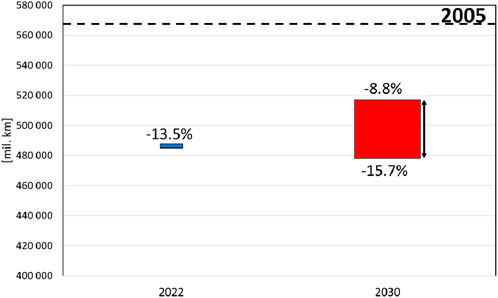
Figure 7. Total 2022–2030 scenarios road transport mileage trend compared to 2005 value (black dotted line).
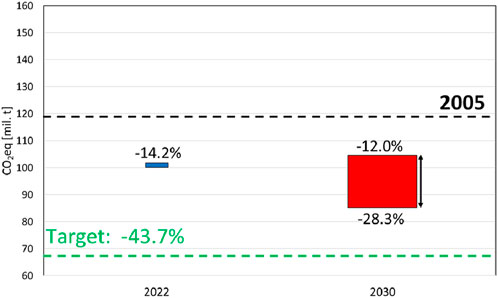
Figure 8. Total 2022–2030 scenarios road transport TtW GHG emissions compared to 2005 ones (black dotted line). The green dotted line represents the Fit for 55 target.
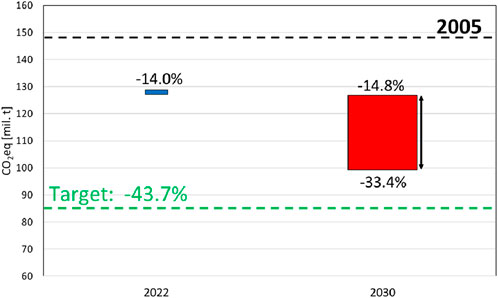
Figure 9. Total 2022–2030 tendential scenarios road transport WtW GHG emissions compared to 2005 ones. The green dotted line represents the Fit for 55 target.
In 2022, the mileage of the vehicle fleet was lower than that of 2005, with a reduction of 13.5%. However, there was a higher TtW reduction in GHG emissions, namely, 14.2%, attributed to the fleet modernization and the initial adoption of more efficient BEVs and HEVs that account for about 5% of the car share (Figure 3). The 2030 Moderate Decarbo scenario shows a road transport demand slightly below that of 2005. Nevertheless, significant fleet renewal and an increased presence of BEV/HEV vehicles are expected to yield a 12% reduction in TtW GHG emissions (upper bound of the 2030 histogram in Figure 8). The projected decrease in CO2eq emissions falls short of the ambitious target outlined in the Fit for 55 package (aiming for a 43.7% reduction in GHG emissions by 2030 compared to 2005). Forecasts for the High Decarbo scenario suggest a considerable improvement, with a more than two-fold GHG emission reduction compared to the Moderate Decarbo scenario, even if it is still below the Fit for 55 target. The reduction in transport demand (−15.7%), combined with the highest renewal rate and increased penetration of BEV/HEV vehicles in the market, may result in a 28.3% reduction in CO2eq emissions (lower bound of the 2030 histogram in Figure 8). This result agrees with other research suggesting that the EU will not meet its 2030 target (Cardama et al., 2021) and achieving such a goal requires the implementation of the most radical policies and changes.
The WtW analysis provides several key insights. In the 2022 scenarios, GHG emission reductions are slightly lower than TtW due to the inclusion of BEV cars. While BEVs do not contribute to TtW emissions, they do contribute to WtW emissions. The small share of BEVs results in a minimal difference of only 0.2%. However, the situation changes significantly in the 2030 scenarios for two main reasons. First, the expected improvements in Italy’s electric mix will lower WtT emissions per unit of energy produced, helping to offset the impact of the higher BEV share on WtW emissions (PNIEC, 2023). Second, biofuels play a key role, driving much of the improved results compared to TtW emissions. In the High decarbo scenario, emissions are reduced by 33.4%, while the Moderate decarbo scenario sees a 14.8% reduction. These results exceed the TtW reductions of 5.1% and 2.8%, respectively. The greater difference in the High decarbo scenario is largely due to a higher share of biofuels. Another interesting aspect would be to better understand the impact of HEVs and BEVs on the achieved reductions, as illustrated in Figure 10.
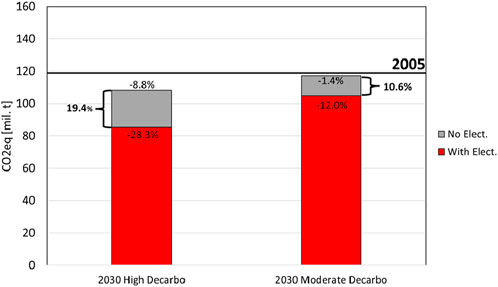
Figure 10. Electrification effect on TtW CO2eq reduction in the 2030 tendential scenarios.
The No Elect. histograms in Figure 10 refer to variants of High and Moderate Decarbo scenarios in which the total demands are equal to the ones shown in Figure 7, but the electrification share has been kept constant at 2022 levels. Without the electrification, the percentage reductions wrt to 2005 would be 8.8% and 1.4%. The introduction of the hypothesized share of HEVs, PHEVs, and BEVs allows further reducing CO2eq emissions by 23 million tons (achieving a reduction of 28.3%) in the High Decarbo scenario and by 12.5 million tons (increasing the percentage reduction up to 12.0%) in the Moderate Decarbo scenario. The respective contributions of HEVs and BEVs to these specific gains are reported for both scenarios in Figure 11. For better readability, PHEVs have been incorporated into the BEV category due to their low share and, ideally, behavior that is more like BEVs than HEVs.
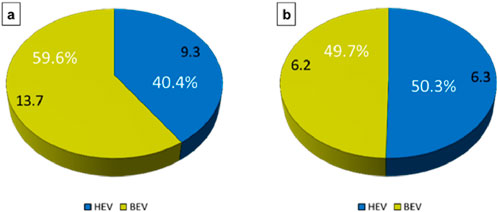
Figure 11. HEV- and BEV-specific contributions to the TtW CO2eq reduction due to electrification in the High (a) and Moderate (b) Decarbo scenarios.
The TtW HEV impact on CO2eq reduction is very close to the BEV one. In the Moderate Decarbo scenario, their contribution is equally distributed (49.7% and 50.3%) against an increase in HEV cars demand of 15% and a BEV demand of 6.5% among cars, 1.3% among freight, and 6.6% among buses, compared to 2022. A higher difference is found in the High Decarbo scenario due to a deeper penetration of BEV vehicles; 40.4% reduction comes from HEVs against an increase of 22% in the cars demand, and 59.6% from BEVs with an increase in demand of 16.5% among cars, 5.5% among freight, and 13.2% among buses. The HEVs’ effectiveness in abating emissions is remarkable, while also being cheaper and more suitable for everyday use because they do not require electric charging stations and have a longer driving range. As the actual Italian shares demonstrate (in 2021, BEV cars represented 0.3% and HEV cars represented 2.6% of the total demand (ACEA, 2023)), increasing HEVs might be easier than enhancing BEVs across all categories, and the results achieved on net TtW emissions can be equal.
Moreover, the HEVs provide even better results in WtW than BEVs due to the electricity production chain being less efficient than the gasoline production chain. In Figure 12, the same analysis is shown in a WtW optic.
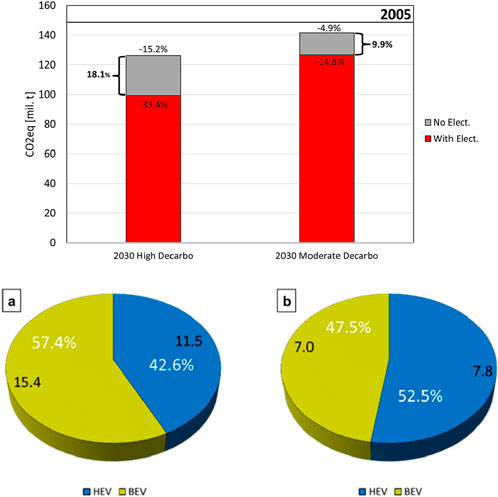
Figure 12. Electrification effect on WtW CO2eq reduction, and BEV and HEV contributions in the 2030 High (a) and Moderate (b) Decarbo tendential scenarios.
For the reasons explained above, the percentage reductions achieved by electrification are lower than the TtW ones. In fact, in the High Decarbo scenario, electrification reduces approximately 27 million tons of CO2eq (an 18.1% reduction) while, in the Moderate Decarbo scenario, it is responsible for abating 15 million tons (a 9.9% reduction). In the Moderate Decarbo scenario, HEVs impact more than BEVs (52.5% versus 47.5%) on the reductions achieved.
It is also important to underline the different impacts of the passenger and freight sectors on the results. The 2030 predictions underline a similar share in mileage (80% for passengers, 20% for freight) as 2022, but freight contributes almost half of the total GHG emissions, as shown in Figure 13.
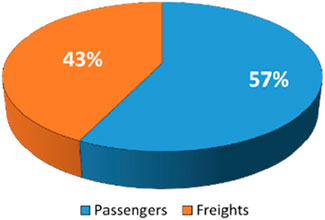
Figure 13. Passenger and freight sector impact on GHG emissions for the 2030 tendential scenarios.
This result highlights that the freight sector is particularly hard to abate due to a minor share of electrification compared to the passenger sector, confirming previous research findings (Carrara and Longden, 2017; Nicolaides et al., 2017; McKinnon, 2018).
3.2 2030 trend-breaking scenarios
In the trend-breaking scenarios, the available biofuel quantities are much higher than the tendential ones, resulting in different plateaus in the energy demand and replaceable fossil fuels. The focus has been on the reduction of the environmental impact of the heavy-duty (HD) sector. HVO is used to replace diesel in the HD sector for EURO VI vehicles, and the remaining quantities are assigned to diesel EURO 6 passenger cars. CBM is used to replace CNG in LCVs, and the remaining quantities are assigned to the whole vehicle fleet.
In the Moderate Decarbo scenario, HVO almost entirely substitutes for diesel in the HD Euro VI fleet; only 8% of the category’s demand will not be satisfied. The CBM fulfills the demand of the entire CNG fleet. In the high decarbonization scenario, CBM replaces CNG in the entire vehicle fleet, and HVO quantity can entirely replace diesel for HD Euro VI vehicles and 20% of the car demand. The same quantities of biofuels better satisfy the High Decarbo scenario demand because it is lower in vehicles×km terms. The overproduction of CBM could be positively utilized for other ends. The improvements in terms of CO2eq WtW are shown in Figure 14. The green band, labeled MaxBio, refers to the trend-breaking scenarios.
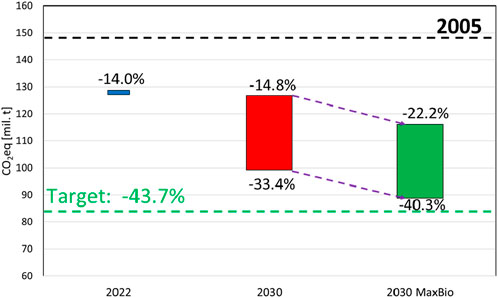
Figure 14. WtW analysis global results: Tendential scenarios and trend-breaking scenarios.
The results recorded by the WtW analysis for the trend-breaking scenarios are very encouraging. The Moderate decarbo scenario’s GHG emissions reduction improves from 14.8% to 22.2%, as the High decarbo scenario goes from a 33.4% reduction to a 40.3%, getting close to the EU target.
Figure 15 shows that the chosen strategy has affected the freight sector, with its contribution to the global GHG emissions moving from 43% to 34%.
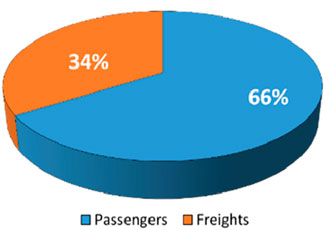
Figure 15. WtW passenger and freight sectors impact on GHG emissions for the 2030 scenarios.
The results achieved by the use of HVO and CBM show the high potential that biofuels might demonstrate if they were more widely distributed. The advantages would also be economic because there is no need to modify the vehicle fleet for a higher penetration of electric technology, and the strong European know-how on ICEs would be maintained. Moreover, the high amount of CBM available is not completely exploited. Retrofitting diesel vehicles to be fueled with CNG and promoting the registration of new CNG vehicles would be an interesting policy to take advantage of CBM in 2030. Other policy proposals include increasing mandatory biofuel quotas within and beyond 2030, promoting public investment to improve biofuel production and distribution infrastructure across the country, introducing fiscal incentives for sustainable biofuel production, and reducing fuel excise taxes on certified sustainable biofuels to encourage their uptake within the vehicle fleet.
The strong impact of biofuels on the WtW analysis is negligible from a TtW analysis, pointing attention to the FitFor55 objectives. Should European regulations adapt to reconsider the limits imposed in 2030?
4 Conclusion
This study proposes feasible forecasts to 2030 to evaluate the potential TtW and WtW reduction of GHG emissions provided by the Italian road transportation sector, which contributes approximately 90% of GHG emissions in the overall transport sector. The objective of the research presented in this article is to assess if the strategies outlined by the Italian government for the upcoming years enable the achievement of GHG emissions reduction targets set in the EU Fit for 55 package, and to propose a complementary path to get close to it. Road transportation energy consumption and GHG emissions were calculated for 2005 (the year of comparison according to a recent revision of the effort-sharing regulation (European parliament, 2022), 2022, and 2030 (future scenario). Specifically for 2030, the avoid-shift-improve (ASI) framework was adopted to build two scenarios, namely, High Decarbo and Moderate Decarbo. Both scenarios were designed to define a sufficiently wide range of possible evolutions of the road transportation system in a deep uncertainty context. Two variants each were hypothesized: the tendential scenarios were defined taking into account only the interventions already decided and scheduled for the next few years by the Italian government, but no assumption has been made on further policies to be promoted, except for a slight increase of prescribed biofuel quantities in the High Decarbo scenario. The trend-breaking scenarios were defined considering a very optimistic but indeed realistic spread of biofuels to achieve the GHG emissions reduction of 43.7% compared to 2005.
Following the Moderate decarbo hypothesis, the reduction in CO2 equivalent emissions might be restricted to only 12% for TtW and 14.8% for WtW, significantly falling short of the target. In the High decarbo scenario, with increased adoption rates of measures and policies aimed at mitigating the environmental impact of road transportation, a potential reduction of 28.3% for TtW and 33.4% for WtW emissions could be achieved, coming closer but still falling short of the EU target. The WtW results highlight the significant potential of biofuels in diminishing the environmental footprint of the road fleet. Their potentiality has been deepened with the trend-breaking scenarios, which improve the scenario results, achieving −22.2% GHG emissions for the Moderate Decarbo and −40.3% for the High Decarbo scenario, getting very close to the proposed objective from a WtW point of view.
The main takeaway is that utilizing various technologies and policies in a smart and optimized manner appears to be the solution to achieving both the current and future EU targets. Focusing on the Italian situation, this study demonstrates that it is not necessary to invest in a single technology, potentially creating unrealistic scenarios for which countries and citizens may not be prepared. Several measures can be taken. It is important to promote policies aimed at encouraging reduced mobility, such as increasing smart working or shared mobility, as well as promoting rail transport and the use of public transportation. At the same time, it is crucial to support the development of different technologies. The electrification is certainly a strong lever, granting a 19.4% and 10.6% emissions reduction for the High and Moderate scenarios from a TtW standpoint. The HEVs spreading in the passenger sector can be as impactful as BEVs while being easier to promote for their undeniable advantages in everyday use. However, this alone is not sufficient; biofuels represent a complementary and viable solution that should be pursued to get closer to the target from a broader WtW perspective. The generic findings of this work can naturally prove useful for other EU member states as well.
The Italian road transportation system has not embarked on a trajectory that ensures the reaching of European objectives, regardless of the plausible evolution the system may undergo in the coming years. Demand trends are on the rise, and the electrification of the sector and the mandated biofuels share for 2030 are not sufficient. There is a need for continuous monitoring to assess the actual decarbonization trajectory and to consistently adjust policies accordingly by promoting good habits and strategic technologies (like electrification and biofuels spreading) through realistically achievable pathways.
Future research should aim to formulate policy pathways that incorporate even more innovative elements and to hypothesize scenarios up to 2050, when the EU is willing to reach carbon neutrality.
Data availability statement
The raw data supporting the conclusions of this article will be made available by the authors, without undue reservation.
Author contributions
DDD: methodology, investigation, writing – review and editing, visualization, formal analysis, writing – original draft, data curation. CB: supervision, writing – review and editing, conceptualization, methodology. IH: methodology, data curation, investigation, writing – review and editing, formal analysis. MP: writing – review and editing, methodology, formal analysis, investigation, data curation. AC: methodology, conceptualization, supervision, writing – review and editing. EC: conceptualization, supervision, methodology, writing – review and editing.
Funding
The author(s) declare that financial support was received for the research and/or publication of this article. This project has received funding and support from the Italian Transport National Cluster (CNT) within the project PATH TO 2030: Possibili traiettorie del trasporto su strada per il raggiungimento degli obiettivi del pacchetto climatico EU Fit for 55.
Conflict of interest
The authors declare that the research was conducted in the absence of any commercial or financial relationships that could be construed as a potential conflict of interest.
The author(s) declared that they were an editorial board member of Frontiers, at the time of submission. This had no impact on the peer review process and the final decision.
Generative AI statement
The author(s) declare that no Generative AI was used in the creation of this manuscript.
Publisher’s note
All claims expressed in this article are solely those of the authors and do not necessarily represent those of their affiliated organizations, or those of the publisher, the editors and the reviewers. Any product that may be evaluated in this article, or claim that may be made by its manufacturer, is not guaranteed or endorsed by the publisher.
Supplementary material
The Supplementary Material for this article can be found online at: https://www.frontiersin.org/articles/10.3389/ffutr.2025.1644106/full#supplementary-material
References
ACEA (2023). Vehicles in use Europe 2023, January 2023, european automobile manufacturers’ association (ACEA).
Achariyaviriya, W., Wongsapai, W., Rinchumphu, D., Tippayawong, N., Yaibuathet Tippayawong, K., and Suttakul, P. (2024). A comparative study of vehicle powertrain efficiency: data-driven analyzing energy consumption and environmental impact. Transp. Eng. 18, 100286. doi:10.1016/j.treng.2024.100286
Al-Ogaili, A. S., Ramasamy, A., Hashim, T. J. T., Al-Masri, A. N., Hoon, Y., Jebur, M. N., et al. (2020). Estimation of the energy consumption of battery driven electric buses by integrating digital elevation and longitudinal dynamic models: malaysia as a case study. Appl. Energy 280, 115873. doi:10.1016/j.apenergy.2020.115873
Arora, S., Abkenar, A. T., Jayasinghe, S. G., and Tammi, K. (2021). Chapter 1—Heavy-duty electric vehicles and society. Oxford, UK: Butterworth-Heinemann.
Associazione Nazionale Filiera Industria Automobilistica (2024). Passenger cars database. Available online at: https://www.anfia.it/it/automobile-in-cifre/statistiche-italia/parco-circolante.
BIKE (2021). BIKE - Biofuels production at low-iluc risk for European sustainable bioeconomy, overview on biofuels production facilities and technologies in Europe. Available online at: https://www.bike-biofuels.eu/wp-content/uploads/2021/09/20210914_BIKE_D3.1_4.0_REC.pdf.
Cardama, M., Cortez, A., Cruz, N., Enriquez, A., Hosek, E., Peet, K., et al. (2021). SLOCAT transport and climate change global status report: tracking trends in a time of change: the need for radical action towards sustainable transport decarbonisation.
Carrara, S., and Longden, T. (2017). Freight futures: the potential impact of road freight on climate policy. Transp. Res. Part D Transp. Environ. 55, 359–372. doi:10.1016/j.trd.2016.10.007
CDN (2024). Smart mobility report 2024. Available online at: https://cdn.rinnovabili.it/wp-content/uploads/2024/10/SMR_Short-Report-2024.pdf.
Cerruti, G., Chiola, M., Bianco, V., and Scarpa, F. (2023). Impact of electric cars deployment on the Italian energy system. Energy Clim. Change 4, 100095. doi:10.1016/j.egycc.2023.100095
Danielis, R., Scorrano, M., and Giansoldati, M. (2021). Decarbonising transport in Europe: trends, goals, policies and passenger car scenarios. Res. Transp. Econ. 91, 101068. doi:10.1016/j.retrec.2021.101068
de Blas, I., Mediavilla, M., Capellán-Pérez, I., and Duce, C. (2020). The limits of transport decarbonization under the current growth paradigm. Energy Strategy Rev. 32, 100543. doi:10.1016/j.esr.2020.100543
Doulgeris, S., Toumasatos, Z., Prati, M. V., Beatrice, C., and Samaras, Z. (2021). Assessment and design of real world driving cycles targeted to the calibration of vehicles with electrified powertrain. Int. J. Engine Res. 22 (12), 3503–3518. doi:10.1177/14680874211038729
European Commission (2021). Commission staff working document – impact assessment accompanying the document proposal for a REGULATION OF THE EUROPEAN PARLIAMENT AND OF THE COUNCIL amending regulation (EU) 2019/631 as regards strengthening the CO2 emission performance standards for new passenger cars and new light commercial vehicles in line with the Union’s increased climate ambition. Available online at: https://eur-lex.europa.eu/legal-content/EN/TXT/?uri=celex:52021SC0613.
European parliament (2022). Revising the effort-sharing regulation for 2021-2030: 'fit for 55' package. Available online at: https://www.europarl.europa.eu/thinktank/it/document/EPRS_BRI(2021)698812.
FETRANSP (2019b). Istituto superiore per la protezione e la ricerca ambientale. Available online at: https://fetransp.isprambiente.it/#/.
Grzelak, P., and Taubert, S. (2021). Consumption of gasoline in vehicles equipped with an LPG retrofit system in real driving conditions. Open Eng. 11 (1), 463–469. doi:10.1515/eng-2021-0044
Henke, I., Cartenì, A., Beatrice, C., Di Domenico, D., Marzano, V., and Maria Patella, S. (2024). Fit for 2030? Possible scenarios of road transport demand, energy consumption and greenhouse gas emissions for Italy. Transp. Policy 159, 67–82. doi:10.1016/j.tranpol.2024.10.002
Huss, A., and Weingerl, P. (2020). “JEC tank-to-wheels report v5: passenger cars,” in EUR 30270 EN. Editors H. Maas, C. Herudek, J. Wind, B. Hollweck, L. De Prada, and S. Deix (Luxembourg: Publications Office of the European Union). doi:10.2760/557004JRC117560
Il sole 24 ore (2023). The revolution of sustainable mobility starts from the motorways. Safe, digital, decarbonised. Available online at: https://libroverde.autostrade.it/en/.
ISFORT (2022). Istituto Superiore di Formazione e Ricerca per i Trasporti (ISFORT). Available online at: https://www.isfort.it/2021/11/12/18-rapporto-audimob-sulla-mobilita-degli-italiani/.
ISTAT (2011). Commuting matrix for work or study purposes referring to the resident population detected at the 15th general population census. Available online at: https://www.istat.it/it/archivio/139381.
Istituto superiore per la protezione e la ricerca ambientale (2021). Italian emission inventory 1990-2019: informative inventory report 2021. Available online at: https://www.isprambiente.gov.it/files2021/pubblicazioni/rapporti/rapp-342-2021.pdf.
Kucukoglu, I., Dewil, R., and Cattrysse, D. (2021). The electric vehicle routing problem and its variations: a literature review. Comput. Ind. Eng. 161, 107650. doi:10.1016/j.cie.2021.107650
Kühlwein, J. (2016). Driving resistances of lightduty vehicles in Europe: present situation, trends, and scenarios for 2025. Berlin, Germany: The international council of clean transportation ICCT. Available online at: https://theicct.org/publication/driving-resistances-of-light-duty-vehicles-in-europe-present-situation-trends-and-scenarios-for-2025/.
Liimatainen, H., van Vliet, O., and Aplyn, D. (2019). The potential of electric trucks – an international commodity-level analysis. Appl. Energy 236, 804–814. doi:10.1016/j.apenergy.2018.12.017
Mamarikas, S., Doulgeris, S., Samaras, Z., and Ntziachristos, L. (2022). Traffic impacts on energy consumption of electric and conventional vehicles. Transp. Res. Part D Transp. Environ. 105, 103231. doi:10.1016/j.trd.2022.103231
María de las Nieves Camacho, Jurburg, D., and Tanco, M. (2022). Hydrogen fuel cell heavy-duty trucks: review of main research topics. Int. J. Hydrogen Energy 47 (68), 29505–29525. doi:10.1016/j.ijhydene.2022.06.271
McKinnon, A. (2018). Decarbonizing logistics: distributing goods in a low carbon world. London, United kingdom: Kogan Page Publishers.
MIMS (2022). Osservatorio sulle tendenze della Mobilità di passeggeri e merci. Available online at: https://www.mit.gov.it/nfsmitgov/files/media/notizia/2022-07/REPORT_2trimestre2022.pdf.
Ministero dell’ambiente e della sicurezza energetica (MASE) (2022). La situazione energetica nazionale nel 2022. Available online at: https://www.mase.gov.it/notizie/energia-mase-pubblica-la-relazione-sulla-situazione-energetica-nazionale-2022#:∼:text=Tale%20disponibilit%C3%A0%20energetica%20lorda%20nel,0%2C8%25%20da%20rifiuti.
Ministero della Transizione Ecologica (2022). Consumi petroliferi 2022 and 2005. Available online at: https://dgsaie.mise.gov.it/consumi-petroliferi.
Mogi, Y., Oikawa, M., Kichima, T., Horiguchi, M., Goma, K., Takagi, Y., et al. (2022). Effect of high compression ratio on improving thermal efficiency and NOx formation in jet plume controlled direct-injection near-zero emission hydrogen engines. Int. J. Hydrogen Energy 47 (73), 31459–31467. ISSN 0360-3199. doi:10.1016/j.ijhydene.2022.07.047
Nicolaides, D., Cebon, D., and Miles, J. (2017). Prospects for electrification of road freight. IEEE Syst. J. 12 (2), 1838–1849. doi:10.1109/jsyst.2017.2691408
Noussan, M., Negro, V., Prussi, M., and Chiaramonti, D. (2024). The potential role of biomethane for the decarbonization of transport: an analysis of 2030 scenarios in Italy. Appl. Energy 355, 122322. doi:10.1016/j.apenergy.2023.122322
Ntziachristos, L., and Samaras, Z. (2024). EMEP/EEA air pollutant emission inventory guidebook 2023 – update 2024. Copenhagen, Denmark: European Environment Agency. Available online at: https://copert.emisia.com/copert/methodology/.
Orecchini, F., Santiangeli, A., Zuccari, F., Ortenzi, F., Genovese, A., Spazzafumo, G., et al. (2018). Energy consumption of a last generation full hybrid vehicle compared with a conventional vehicle in real drive conditions. Energy Procedia 148, 289–296. doi:10.1016/j.egypro.2018.08.080
Pietzcker, R. C., Longden, T., Chen, W., Fu, S., Kriegler, E., Kyle, P., et al. (2014). Long-term transport energy demand and climate policy: alternative visions on transport decarbonization in energy-economy models. Energy 64, 95–108. doi:10.1016/j.energy.2013.08.059
PNIEC (2023). Piano Nazionale Integrato per l’Energia e il Clima (PNIEC). Available online at: https://www.mase.gov.it/sites/default/files/PNIEC_2023.pdf.
Prati, M. V., Costagliola, M. A., Giuzio, R., Beatrice, C., and Corsetti, C. (2021). Emissions and energy consumption of a plug-in hybrid passenger car in real driving emission (RDE) test. Transp. Eng. 4, 100069. doi:10.1016/j.treng.2021.100069
Prussi, M., Yugo, M., De Prada, L., Padella, M., and Edwards, R. (2020). JEC well-to-wheels report v5, EUR 30284 EN. Luxembourg: Publications Office of the European Union.
Ragon, P. L., and Rodríguez, F. (2021). CO2 emissions from trucks in the EU: an analysis of the heavy-duty CO2 standards baseline data.
Rottoli, M., Dirnaichner, A., Pietzcker, R., Schreyer, F., and Luderer, G. (2021). Alternative electrification pathways for light-duty vehicles in the European transport sector. Transp. Res. Part D Transp. Environ. 99, 103005. doi:10.1016/j.trd.2021.103005
Soam, S., and Hillman, K. (2019). Factors influencing the environmental sustainability and growth of hydrotreated vegetable oil (HVO) in Sweden. Bioresour. Technol. Rep. 7, 100244. doi:10.1016/j.biteb.2019.100244
Sorrentino, M., Rizzo, G., and Sorrentino, L. (2014). A study aimed at assessing the potential impact of vehicle electrification on grid infrastructure and road-traffic green house emissions. Appl. Energy 120, 31–40. doi:10.1016/j.apenergy.2014.01.040
Wang, L., Nian, V., Li, H., and Yuan, J. (2021). Impacts of electric vehicle deployment on the electricity sector in a highly urbanised environment. J. Clean. Prod. 295, 126386. doi:10.1016/j.jclepro.2021.126386
Glossary
ASI Avoid-shift-improve
BEV Battery electric vehicles
CBM Compressed bio methane
CNG Compressed natural gas
CO2eq Equivalent CO2
EC Energy consumption
ESR Effort sharing regulation
ETS Emission trading system
FAME Fatty acid methyl ester
FCD Floating car data
FCEV Fuel cell electric vehicle
GHG Greenhouse gas
HD Heavy duty
HDV Heavy-duty vehicle
HEV Hybrid electric vehicle
HICEV Hydrogen internal combustion engine vehicle
HVO Hydrotreated vegetable oil
ICE Internal combustion engine
ICEV Internal combustion engine vehicle
LCV Light commercial vehicle
LDV Light-duty vehicles
LHV Lower heating value
LNG Liquid natural gas
LPG Liquefied petroleum gas
NG Natural gas
PHEV Plug-in hybrid electric vehicle
RDE Real driving emissions
TtW Tank to wheel
WLTP Worldwide harmonized light-duty vehicles test procedure
WtT Well to tank
WtW Well-to-wheel
Keywords: road transport decarbonization, paths to 2030, green mobility, biofuels, sustainable transportation
Citation: Di Domenico D, Beatrice C, Henke I, Picone M, Cartenì A and Cascetta E (2025) Scenarios of fuel vector trajectories in the Italian road vehicle fleet to 2030 and their impacts on EU GHG reduction targets. Front. Future Transp. 6:1644106. doi: 10.3389/ffutr.2025.1644106
Received: 09 June 2025; Accepted: 08 July 2025;
Published: 01 August 2025.
Edited by:
Roberto Finesso, Polytechnic University of Turin, ItalyReviewed by:
Maksymilian Mądziel, Rzeszów University of Technology, PolandFrancesca Bruno, University of Salerno, Italy
Copyright © 2025 Di Domenico, Beatrice, Henke, Picone, Cartenì and Cascetta. This is an open-access article distributed under the terms of the Creative Commons Attribution License (CC BY). The use, distribution or reproduction in other forums is permitted, provided the original author(s) and the copyright owner(s) are credited and that the original publication in this journal is cited, in accordance with accepted academic practice. No use, distribution or reproduction is permitted which does not comply with these terms.
*Correspondence: Davide Di Domenico, ZGF2aWRlLmRpZG9tZW5pY29Ac3RlbXMuY25yLml0