 Guolian Kang1 Guimin Gao1 Sanjay Shete2 David T. Redden1 Bao-Li Chang3 Timothy R. Rebbeck3
 Jill S. Barnholtz-Sloan4 Nicholas M. Pajewski1
 David B. Allison1*
- 1 Section on Statistical Genetics, Department of Biostatistics, The University of Alabama at Birmingham, Birmingham, AL, USA
- 2 Department of Epidemiology, M. D. Anderson Cancer Center, University of Texas, Houston, TX, USA
- 3 Department of Biostatistics and Epidemiology, School of Medicine, University of Pennsylvania, Philadelphia, PA, USA
- 4 Case Comprehensive Cancer Center, Case Western Reserve University, Cleveland, OH, USA
As genome-wide association studies expand beyond populations of European ancestry, the role of admixture will become increasingly important in the continued discovery and fine-mapping of variation influencing complex traits. Although admixture is commonly viewed as a confounding influence in association studies, approaches such as admixture mapping have demonstrated its ability to highlight disease susceptibility regions of the genome. In this study, we illustrate a powerful two-stage testing strategy designed to uncover trait-associated single nucleotide polymorphisms in the presence of ancestral allele frequency differentiation. In the first stage, we conduct an association scan by using predicted genotypic values based on regional admixture estimates. We then select a subset of promising markers for inclusion in a second-stage analysis, where association is tested between the observed genotype and the phenotype conditional on the predicted genotype. We prove that, under the null hypothesis, the test statistics used in each stage are orthogonal and asymptotically independent. Using simulated data designed to mimic African-American populations in the case of a quantitative trait, we show that our two-stage procedure maintains appropriate control of the family wise error rate and has higher power under realistic effect sizes than the one-stage testing procedure in which all markers are tested for association simultaneously with control of admixture. We apply the proposed procedure to a study of height in 201 African-Americans genotyped at 108 ancestry informative markers. The two-stage procedure identified two statistically significant markers rs1985080 (PTHB1/BBS9) and rs952718 (ABCA12). PTHB1/BBS9 is downregulated by parathyroid hormone in osteoblastic cells and is thought to be involved in parathyroid hormone action in bones and may play a role in height. ABCA12 is a member of the superfamily of ATP binding cassette transporters and its potential involvement in height is unclear.
Introduction
One of the major focuses of current genomics research is the expansion of association studies beyond populations of European and Asian descent, including African populations and admixed populations such as African-Americans and Hispanics. Although these investigations carry several potential pitfalls such as greater haplotype diversity and lower levels of linkage disequilibrium (LD), one of the most well-known issues is the potential confounding influence of population stratification and admixture (Marchini et al., 2004; Smith et al., 2004; Teo et al., 2010). However, the existence of these phenomena also presents an opportunity, as several recent studies have demonstrated that genetic ancestry need not be viewed as a nuisance quantity. For example, within the context of autoimmune diseases, Richman et al. (2010) illustrated a role for European population substructure across the northwest to southeast cline with endophenotypes of systemic lupus erythematosus. Similarly, Hughes et al. (2008) validated the role of the HLA-DRB1 shared epitope within African-Americans with rheumatoid arthritis, suggesting an inheritance through admixture with European populations.
Earlier investigators have recognized the value of considering admixture to highlight disease susceptibility regions in the genome, spawning the approach of admixture mapping or mapping by admixture LD (Patterson et al., 2004; Freedman et al., 2006). The basic premise of these approaches is that individuals from admixed populations would have a greater probability of inheriting risk alleles from the ancestral population that carries more of such alleles. The initial appeal of admixture mapping was the potential savings in genotyping costs because the genome could be covered with a few thousand markers with reasonable resolution. However, with the rapid cost decrease for platforms assaying potentially millions of single nucleotide polymorphisms (SNPs), the initial appeal of admixture mapping has dwindled. Here we offer a new insight that there is benefit to considering the admixture mapping paradigm within genome-wide association (GWA) studies of admixed populations using high-density genotyping arrays.
A major challenge in GWA studies is to balance the control of type I and type II errors. If no adjustment for multiple-testing is used, with hundreds of thousands to millions of tests, the number (and proportion) of false-positives among the results declared significant is likely to be enormous. In contrast, if the Bonferroni correction [or any other method that controls the family wise type I error rate (FWER)] is used, power may be reduced excessively and too many type II errors (false-negatives) may be made (Kang et al., 2009). If there were a way to reduce the number of null hypotheses tested without discarding too many markers that are truly in LD with causative loci, then power could be improved dramatically. With this in mind, several authors have considered various two-stage testing paradigms (Evans et al., 2006; Laird and Lange, 2006; Skol et al., 2006; Wang et al., 2006; Ionita-Laza et al., 2007). Within the context of family based association studies, these approaches entail partitioning the available data into two orthogonal components. The between-family component is used to provide an initial relative ranking of the markers, then using the within-family component to provide a second-stage test of association. Ideally, such two-stage testing paradigms (a) should not require family data, (b) should be robust to confounding by non-random mating (including admixture), (c) should offer strong control of the FWER, and (d) should not arbitrarily split the available data and suffer the attendant loss in power (Allison and Coffey, 2002).
Our intent here is to illustrate that other sources of information, such as admixture, can be used to provide an orthogonal data partition and hence a two-stage testing opportunity satisfying the features listed above. In our method, we divide the association analysis for an admixed population into two parts, one of which tests the association between the phenotype and a predicted genotype based on regional admixture estimates. We then select a subset of promising markers for the second-stage analysis where we test the association between the observed genotype and the phenotype conditional on the predicted genotypes. Because the test statistics used in each stage of the procedure are orthogonal and asymptotically independent under the null hypothesis (see the proof in Appendix), this two-stage procedure maintains appropriate control of the FWER whether or not confounding by admixture exists. As a proof of concept for our new approach, we compare our proposed procedure through simulation to a one-stage procedure in the case of association mapping in an admixed population. We conclude with an illustration of the proposed method within a study of height in African-Americans using ancestry informative markers.
Methods
We consider the situation of j = 1, 2, …, J ancestry informative SNP markers and i = 1, 2, …, N individuals. We denote Gi,j as the observed genotypic value for the ith individual at the jth SNP. For simplicity, we assume that the admixed population sample arises from two ancestral populations (generically labeled as populations A and B). Let Ai,j denote a regional admixture estimate, that is, the estimated expected number of alleles inherited from ancestral population A at the jth SNP for the ith individual. Finally, let Yi denote the observed phenotype for the ith individual.
One-Stage Testing Procedure
A standard flexible approach for association testing while controlling for admixture is regression within the generalized linear model (GLM) framework, which directly allows for quantitative, binary, ordinal, and time to event (survival) phenotypic distributions through the choice of an appropriate link function (g) (McCullagh and Nelder, 1989; Freedman et al., 2006; Redden et al., 2006; Zhu and Cooper, 2007). This involves a regression model for the jth SNP that assumes that the expected phenotypic value takes the form,

where Ai, j= 2ωi,2(j) + ωi,1(j), ωi,1(j) (ωi,2(j)) are the probabilities that individual i has one (two) allele(s) at the jth marker from ancestral population A, and g−1(·) denotes the inverse link function (Redden et al., 2006; Tiwari et al., 2008). For ease of exposition, we will assume the situation of a quantitative trait, taking g(·) to be the identity link function and introducing residual error terms εi,j each independently distributed  To estimate the admixture proportions Ai,j, we utilize the Hidden Markov Model approach implemented in Ancestrymap (Patterson et al., 2004), although a number of alternative estimation approaches exist and could be readily substituted (Sankararaman et al., 2008; Price et al., 2009). In order to control for multiple-testing, we employ a Bonferroni correction, testing the significance of γ1 for each SNP at a significance level of α/J. This controls the FWER at the desired upper bound of α. Though we focus on control of the FWER here, one could analogously look at control of other error rates, such as the false discovery rate (Benjamini and Hochberg, 1995, 2000; Storey, 2002).
Proposed Two-Stage Testing Procedure
Our proposed two-stage method is predicated on the realization that an association analysis incorporating the ancestry estimate can be divided into two aspects. First, we fit a model using the conditional expectation of genotype, where the expectation is now taken relative to regional admixture estimates for the particular SNP. The second-stage then tests the association of a subset of promising markers based on the first stage screen, where association is now tested conditioned on the conditional genotypic expectation. We prove the orthogonality of the two test statistics used in each stage under the null hypothesis in Appendix, and use simulation to illustrate that the two statistics may be correlated under the alternative hypothesis in the case of admixed populations.
Stage 1: We regress the observed genotypic value (Gi,j) at each marker on the estimated average number (Ai,j) of population A-ancestry alleles

where ei,j represents residual error terms. This equation is then used to obtain a predicted genotypic value 
We then consider a regression of the quantitative trait on the predicted genotypes as

where τi,j are independently distributed  We test the significance of α1 at each marker on the basis of Eq. 2 and select the top q markers for testing in the second-stage. We denote the selected subset of markers here as Φ. Approaches to selecting q will be discussed below.
Stage 2: In the second-stage, we consider a linear regression for the quantitative trait by using the observed genotype as,

where ϑi,j are independently distributed  We test the significance of
  at each of the “q” selected markers from stage 1 on the basis of Eq. 3 at a significance level of α/q, where α is the overall significance level. The use of only q in the denominator of the Bonferroni correction is justified by the orthogonality and asymptotic independence under the null hypothesis proved in Appendix (Van Steen et al., 2005; Zheng et al., 2007).
Simulation Design
To evaluate the frequency characteristics of our proposed procedure, we simulated an admixed population sample by using Ancestrymap. We utilized parameter settings designed to mimic an African-American population (Patterson et al., 2004). The average proportion of alleles inherited from the European ancestral population was set at 1/6, with the number of chromosomal exchanges per Morgan between ancestral segments of the genome since the mixing event set as 10. For the simulations under the alternative hypothesis, we randomly set one marker as a disease marker by setting the “risksim” parameter in Ancestrymap (rel8500) (ψ1) to a value other than 1, where ψ1 is the increased risk for disease due to carrying one population A-ancestry allele at the disease marker (Patterson et al., 2004).
We simulated a quantitative trait by using the equation (Redden et al., 2006)

where εi is assumed to have a standard normal distribution. s denotes the overall effect of admixture on the trait, while t denotes the mean genotypic effect on the trait. We use simulation to illustrate the correlations of the test statistics in our two-stage procedure under the null and alternative hypotheses. We simulated 200 data sets each with 400 cases and 400 controls genotyped at the 1805 ancestry informative SNPs with one disease-predisposing allele. We then randomly selected one marker and simulated a continuous trait using Eq. 4 above with s set to be 0, 0.1, and 0.3 and t set equal to 0, 0.2, and 0.4 at the selected marker.
FWER Evaluation
We estimated the FWER as the proportion of replicates in which at least one non-disease-associated SNP was found to be significantly associated with the disease, under two situations: (1) under the null hypothesis that there is no SNP associated with the trait with and without confounding association by admixture and (2) under the non-complete null hypothesis, in which some ancestry SNPs are associated with the trait and the associations are confounded by admixture between these ancestry SNPs and the trait. It is possible to get false-positive results at ancestry SNPs that are not associated with the trait.
To evaluate the FWER under the complete null hypothesis under situation 1, we first simulated 200 cases and 200 controls at 1805 ancestry SNPs under the complete null hypothesis using Ancestrymap. Then, we randomly selected one marker and simulated the phenotype by using Eq. 4 with s = 0, 0.1, and 0.3 at the selected marker and t = 0, where the non-zero value of s was chosen to ensure that the phenotype variability explained by admixture was less than 3% (the average value of this value from our simulated data can be found in Table A1 in the Appendix). The FWER was estimated as the proportion of replicates that identified any one of 1805 ancestry SNPs as significant.
To evaluate the FWER under the non-complete null hypothesis (situation 2), we first simulated 200 (400) cases and 200 (400) controls with one preset disease-associated ancestry SNP by using the software Ancestrymap. Then, we simulated the phenotype by using Eq. 4 with s = 0, 0.1, and 0.3 and t = 0.2, 0.4, and 0.6, respectively, where the non-zero value of s was chosen to ensure that the phenotype variability explained by admixture was less than 3% (the average value of this value from our simulated data can be found in Table A2 in the Appendix). The FWER was estimated by the proportion of replicates where any one of the remaining ancestry SNPs was identified as being significant after the ancestry SNPs located at the same chromosome with the disease-associated ancestry SNP were removed from consideration.
Power Evaluation
To estimate the power of the two-stage procedure, we first simulated 200 (400) cases and 200 (400) controls with 1805 ancestry SNPs and randomly chose 1 of the 1805 ancestry SNPs located at chromosome 1 as a specific disease-associated ancestry SNP at which a population A-ancestry allele confers 2.4 multiplicative increased risk, where the multiplicative increased risk was chosen to ensure a high power under the scaled sample sizes. Then, we simulated the phenotype by using Eq. 4 with s = 0, 0.1, and 0.3 and t = 0.2, 0.4, and 0.6, respectively, where G in Eq. 4 is the genotype for the specific disease-associated ancestry SNP we chose above. For the estimation of power, we estimated the power level as the proportion of replicates where the specific disease-associated ancestry SNP at chromosome 1 was successfully identified.
Simulation Results
Correlation Evaluations between Two Test Statistics Under the Alternative Hypothesis
Table 1 and Figures A1 and A2 in the Appendix show that these two test statistics were not correlated under the null and were correlated under the alternative hypothesis based on 200 datasets each with 800 individuals whether confounding by admixture existed or not. The level of correlations seems to increase as the effects of both genotype and the ancestry estimate on the trait increase. The correlations of two test statistics in the two-stage procedure under the alternative hypothesis further support the conclusion that our two-stage procedure has higher power than the one-stage procedure (see below).
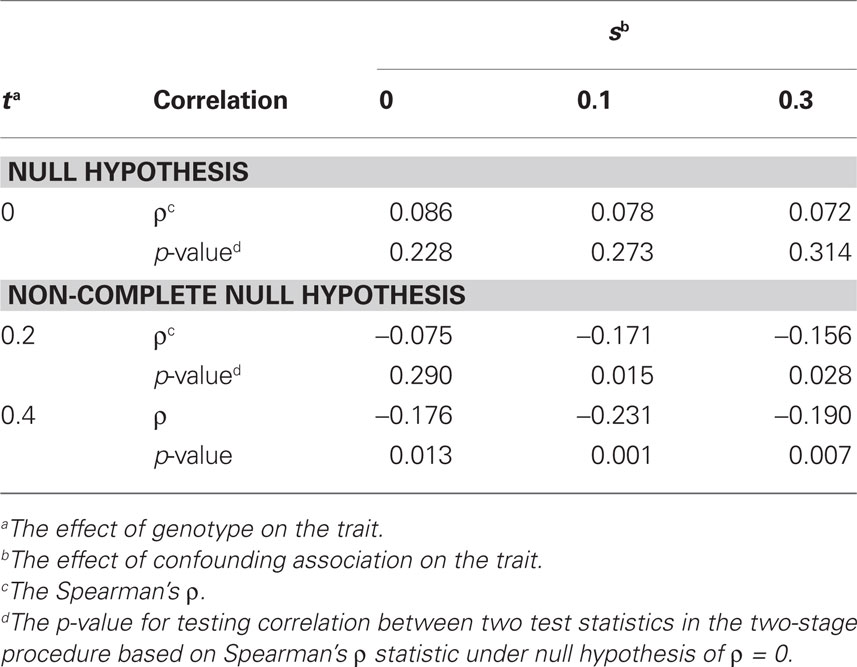
Table 1. Correlation evaluations of two test statistics in stage 1 and stage 2 for our two-stage procedure.
FWER Evaluation
Because the test statistics in each stage of our two-stage procedure are asymptotically independent under the null hypothesis, the FWER of our two-stage procedure should theoretically be controlled (Kang et al., 2009). We therefore next evaluated whether our two-stage procedure could effectively control the FWER by the preset limited sample size.
Figures 1 and 2A,B plot the estimated FWERs versus the ratio of the number of ancestry SNPs selected in the first stage (q) to the number of total SNPs (h) under the complete null hypothesis for a quantitative trait with and without association confounding by admixture based on 200 replicates. Figures 2A,B are for s = 0.1 and 0.3, respectively (confounding by admixture). These figures illustrate that both the one-stage procedure and our two-stage procedure provide adequate control of the FWER.
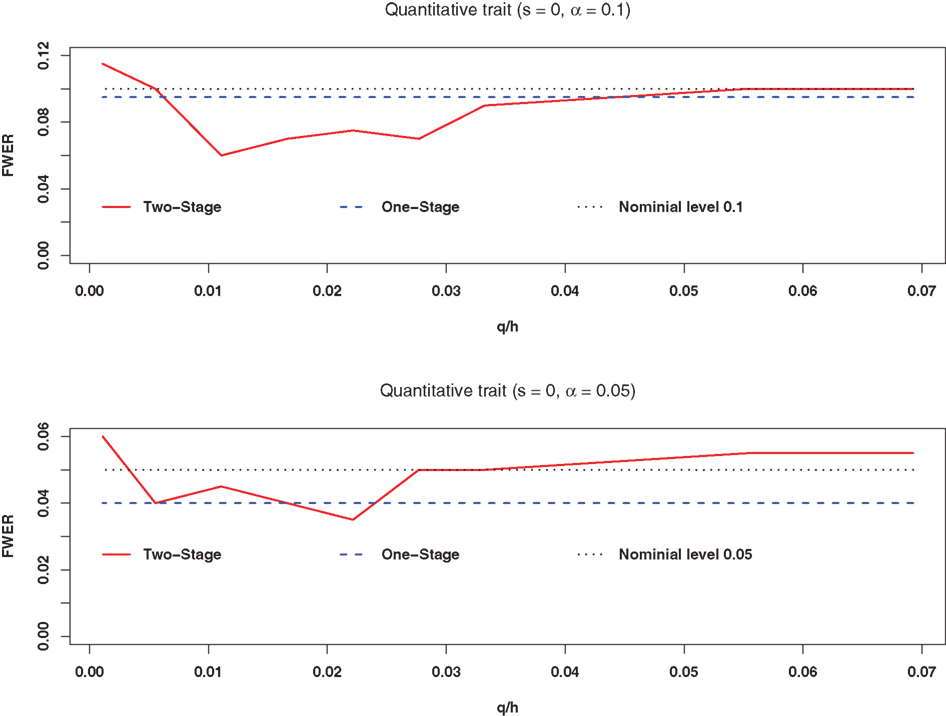
Figure 1. The estimated FWER of the two-stage procedure without confounding association by admixture at significance levels of 0. 1 and 0.05 (200 replicates). The red solid line represents the estimated FWER with the two-stage procedure of structured association tests; the blue dashed line represents the estimated FWER with the one-stage procedure of structured association tests; the black dotted line represents the nominal level; q is the number of SNPs selected in the first stage; and h is the number of total SNPs.
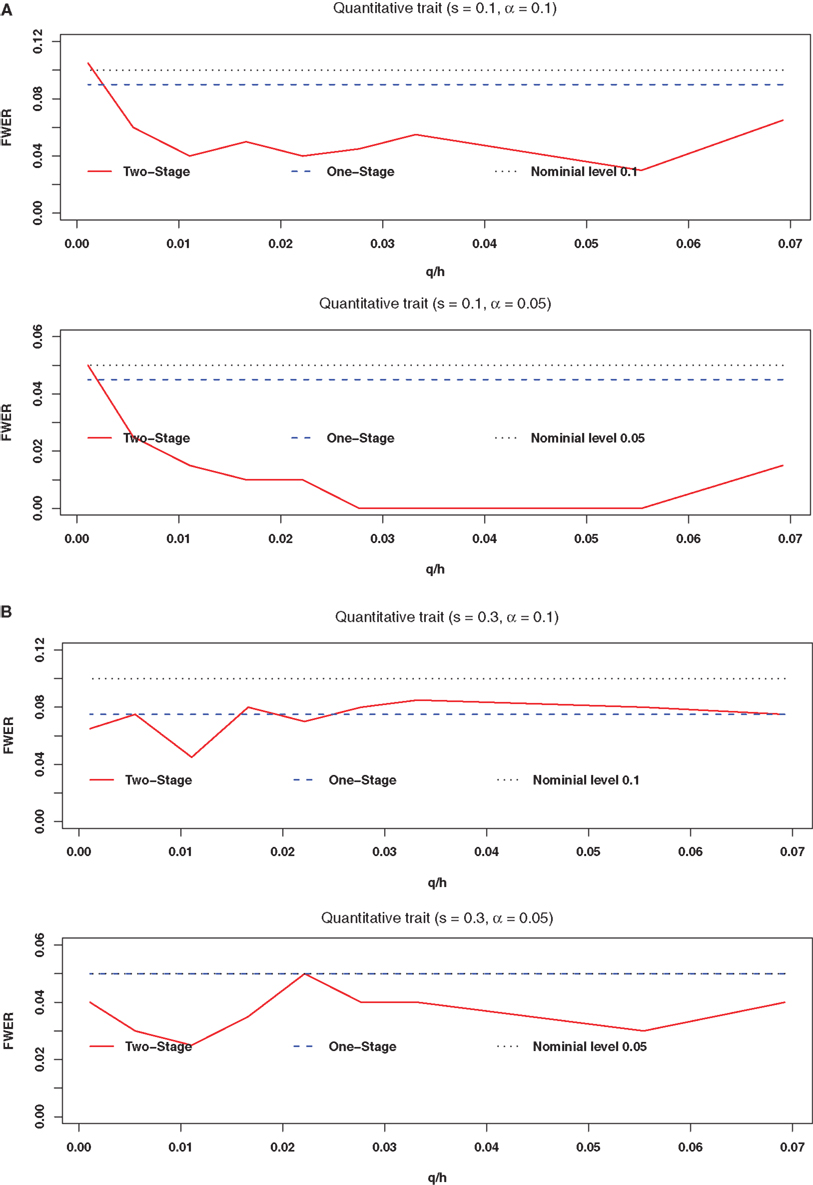
Figure 2. The estimated FWER of the two-stage procedure with confounding association by admixture at significance levels of 0. 1 and 0.05 (200 replicates). (A) Is for s = 0.1 and (B) is for s = 0.3. The red solid line represents the estimated FWER with the two-stage procedure of structured association tests; the blue dashed line represents the estimated FWER with the one-stage procedure of structured association tests; the black dotted line represents the nominal level; q is the number of SNPs selected in the first stage; and h is the number of total SNPs.
For the non-complete null hypothesis, refer to the columns labeled FWER in Tables 2 and 3. As shown in these two tables, all the estimated FWERs were close to the nominal values of 0.1 and 0.05. Therefore, our two-stage procedure conserved good control of the FWER. On the other hand, we also found that our two-stage procedure still had a conservative FWER when q/h was close to 0 under the alternative hypothesis.
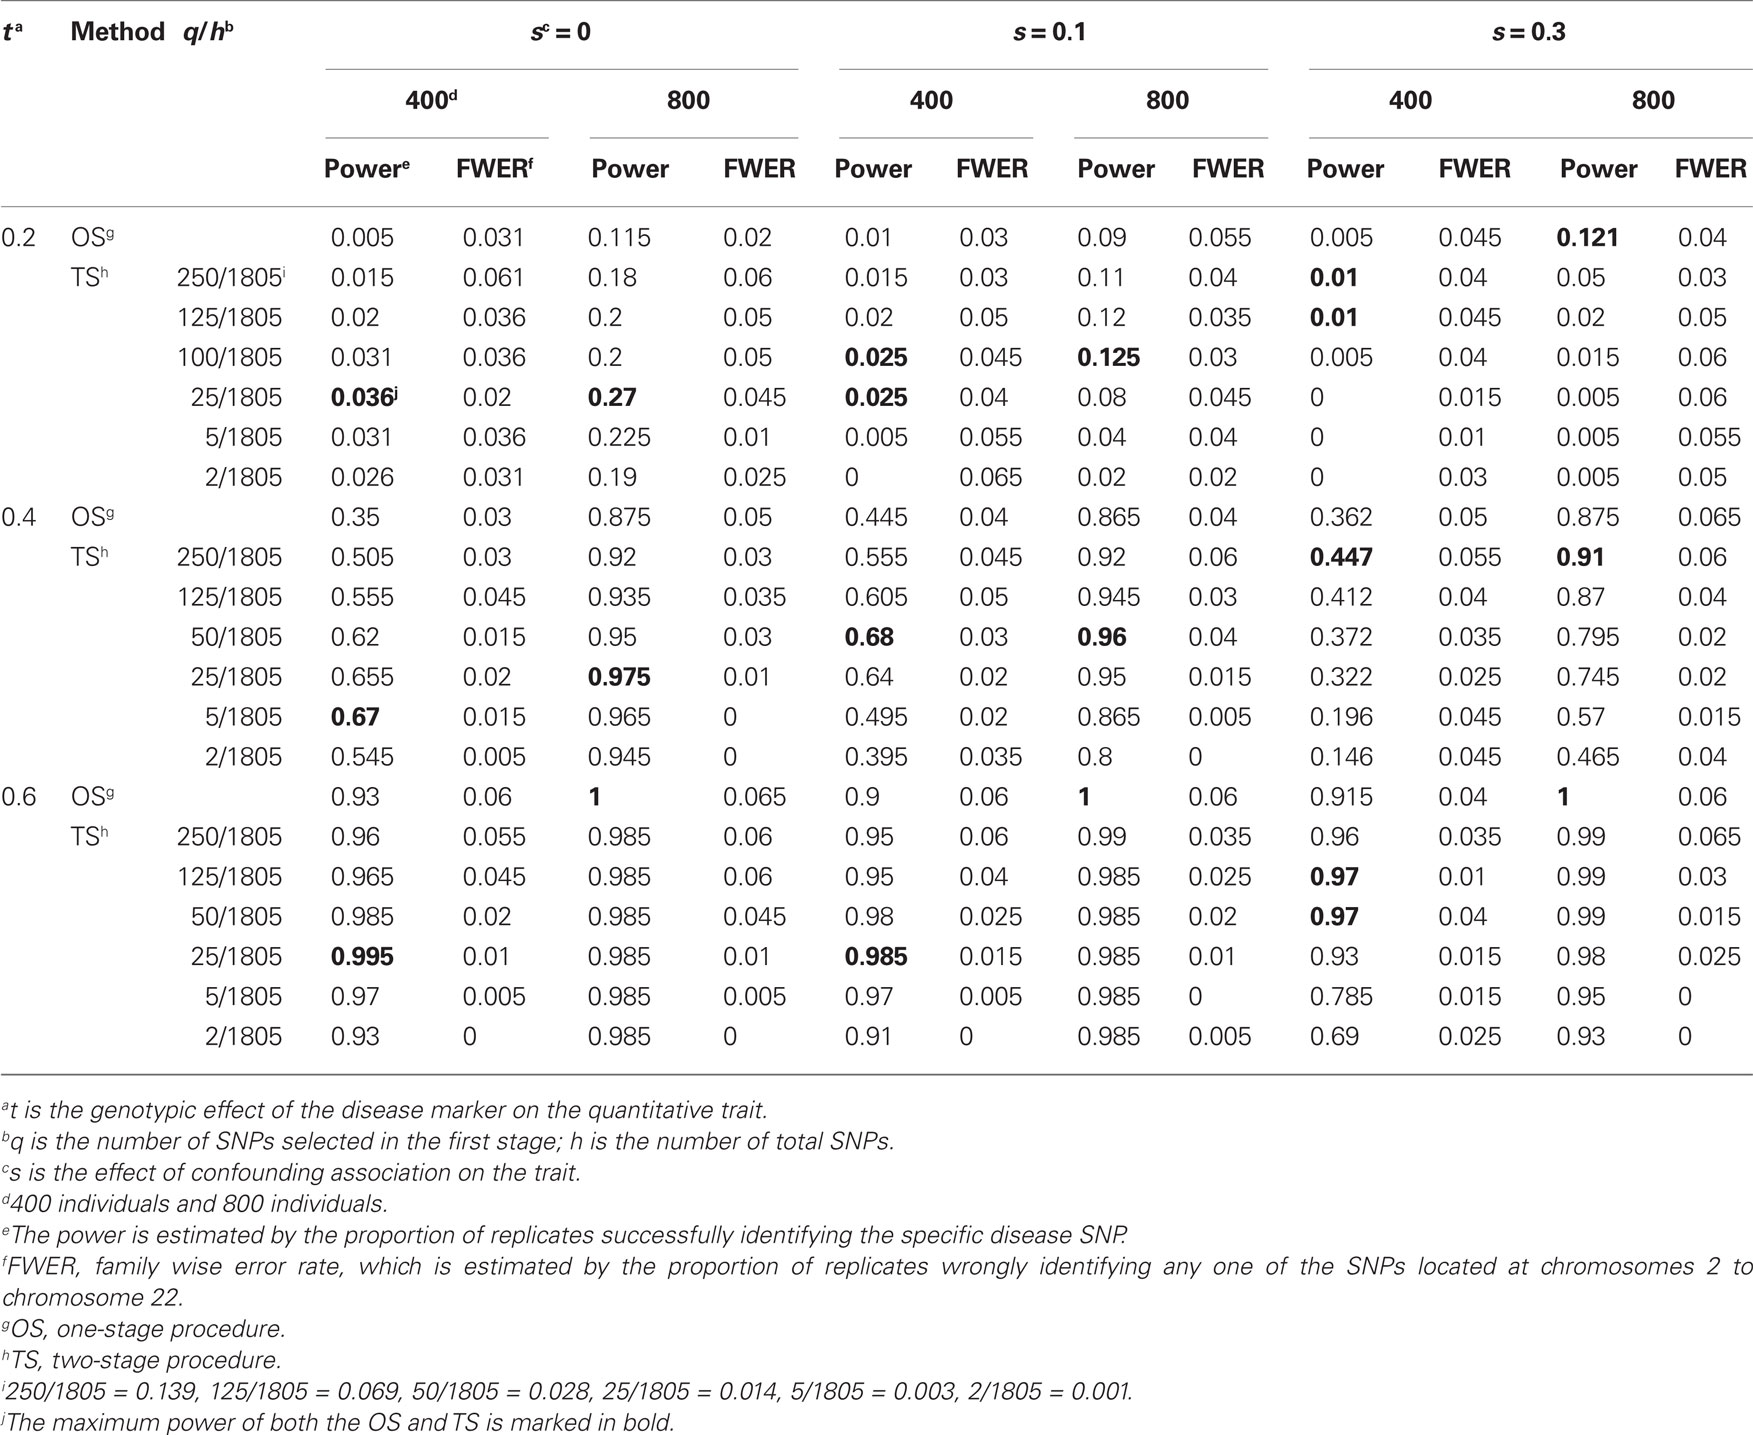
Table 2. Empirical power and FWER of the two-stage procedure at a significance level of 0.05 (200 replicates).
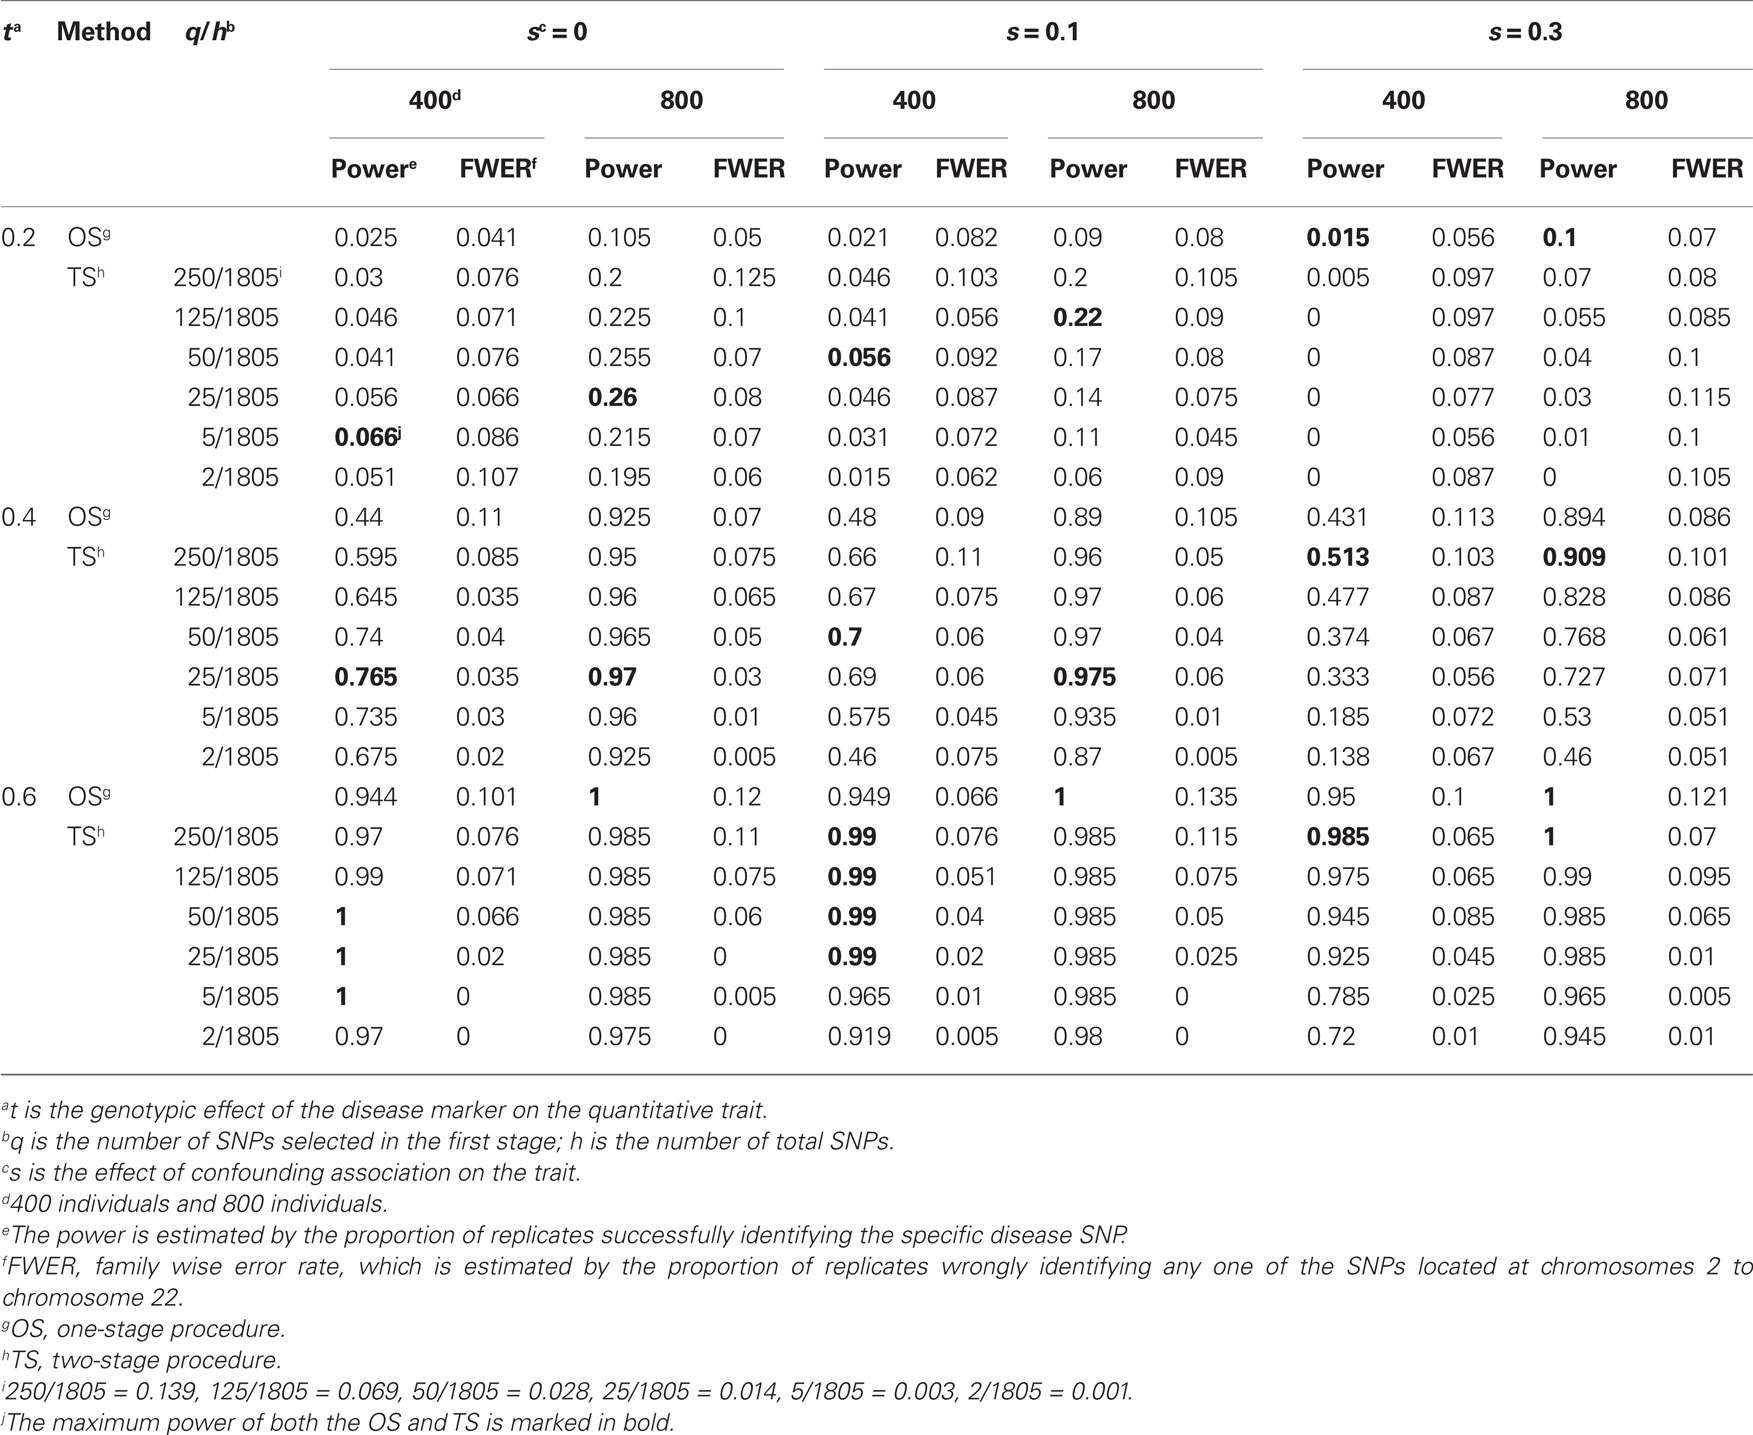
Table 3. Empirical power and FWER of the two-stage procedure at a significance level of 0.1 (200 replicates).
Power Comparisons
We compared the power of our two-stage procedure with that of the one-stage procedure described above for a quantitative trait. Tables 2 and 3 and Tables A4 and A5 in the Appendix present the empirical power of the two-stage procedure for simulated 200 replicates at significance levels of 0.05 and 0.1, respectively. From these two tables we found that (1) the two-stage procedure generally had higher power than the one-stage procedure; (2) the maximum power of the two-stage procedure was significantly higher than that of the one-stage procedure when there was no or a small or moderate association confounded by admixture and there was a small or moderate true association between disease and marker; (3) as the effect size of association confounded by admixture increased, the power of the two-stage procedure decreased [for example, when t = 0.4, s = 0, 0.1 and 0.3, α = 0.05, and n = 400, the difference between the maximum value of the power of the two-stage procedure and that of the one-stage procedure was about 32% (0.67 versus 0.35), 23.5% (0.68 versus 0.445), and 8.5% (0.362 versus 0.447), respectively]; and (4) the selection of q affected the power of our two-stage procedure. As it approaches 1, the power of the two-stage procedure was higher than and close to that of the one-stage procedure. But the selection of q is correlated with the effect sizes of true association and confounding association by admixture. The optimal number of q is approximately 3% (≈50/1805) for all s and t.
In addition, we also noticed that as the effect size of the true association between the trait and the marker increased, the effect of association confounded by admixture on the power first increased and then decreased; but as the sample size increased, the effect of association confounded by admixture on the power decreased. For example, for α = 0.05, the difference in the maximum value of the power for s = 0 and 0.3 increased first from 2.6% (=0.036 − 0.01) to 22.3.5% (=0.67 − 0.447) and then decreased to 2.5% (=0.995 − 0.97) when n = 400. However, when n = 800, the above three values were from 15.3% (=0.27 − 0.121) to 6.5% (=0.975 − 0.91) to 0% (=1 − 1).
Furthermore, it was interesting that under the non-complete null hypothesis our two-stage procedure could have higher power with lower FWER if we chose fewer markers from stage 1 for stage 2 analysis compared with the one-stage procedure, especially when there was moderate or large true association between the trait and the marker. This happens because under the non-complete null hypothesis, if we choose fewer promising markers in stage 1 for stage 2 analysis, there is a smaller chance of the false-positives occurring with nearly no effect on true-positives.
Application to Height in African-Americans
To evaluate the performance of our new two-stage procedure, we applied it to a real data set investigating the association of 108 ancestry informative markers with height in a sample of 201 African-Americans. Detailed information on the 108 ancestry markers can be found in Table A3 in the Appendix. Participants were part of an ongoing case–control study of genetic risk factors for prostate cancer conducted by investigators at the University of Pennsylvania (Zeigler-Johnson et al., 2004; Stefflova et al., 2009). Height was based on self-report of the subject’s tallest height ever reached in inches. Genetic map positions for all markers were evaluated by using a program developed by McKeigue (2006).
For the purpose of comparison, we first conducted a linear regression evaluating the association between height and each SNP. We employed two methods to account for the confounding influence of admixture; Genomic Control (Devlin and Roeder, 1999) and principal components analysis (Price et al., 2006). The genomic control inflation factor was calculated by dividing the median of the test statistics for all SNPs by 0.456. We also conducted one-stage analysis as described before. No SNP was found to be statistically significant at an overall nominal level of 0.05 (0.05/108 for each SNP) by the above three methods. Finally, we conducted our two-stage analysis. On the basis of our simulation results above, we selected the top three SNPs (≈108 × 0.03) in stage 1 and tested these three SNPs in stage 2 at an overall nominal level of 0.05 (0.05/3 for each SNP; see Methods). Table 4 shows the association results at a preset nominal level of 0.05 using our proposed two-stage testing procedure. We found that the two-stage procedure identified two statistically significant ancestry markers (rs952718 and rs1985080) associated with height after controlling for association confounded by admixture.
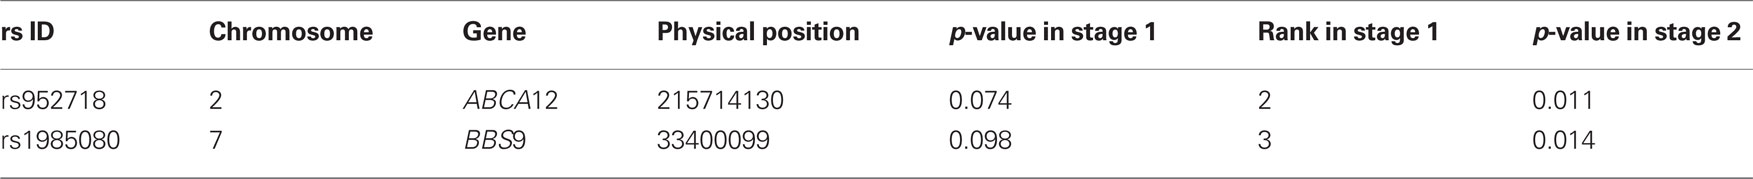
Table 4. The association results of ancestry informative markers with height at a nominal level of 0.05 by the two-stage procedure.
Discussion
In this study, we have introduced a new two-stage procedure for association mapping in admixed populations. Our simulations indicate that the two-stage procedure had significantly higher power compared with a one-stage procedure and adequately controlled the FWER whether or not the admixture confounded the true association between genotype and trait. Because the performance of our two-stage method depends on the selection of the number of the top markers, we recommend that the top 3% markers be selected in stage 1 for stage 2 analysis in practice. In our real data example, using the one-stage procedure and the other two methods, we found no significant associations; however the two-stage procedure found two ancestry informative SNPs, rs1985080 (PTHB1/BBS9) and rs952718 (ABCA12), to be significantly associated with height in African-Americans. PTHB1/BBS9 (parathyroid hormone-responsive B1) is downregulated by parathyroid hormone in osteoblastic cells and is thought to be involved in parathyroid hormone action in bones and may play a role in height (Adams et al., 1999). ABCA12 [ATP-binding cassette (ABC), sub-family A (ABC1), member 12] is a member of the superfamily of ABC transporters (Annilo et al., 2002). ABCA12 is a major causative gene for non-bullous congenital ichthyosiform erythroderma (Sakai et al., 2009), but its role in determining height merits further study.
Certain limitations of our proposed method deserve consideration. From empirical data across a range of traits and species, it has been suggested that most genetic variance is additive, which accounts for over half, and often close to 100%, of the total genetic variance (Hill et al., 2008). Thus, in our analysis we focused on the situation of additive genetic effects. If the underlying disease model follows a different mode of inheritance, then the proposed procedure will lose power. However, the proposed models can be straightforwardly adjusted to conduct a 2° of freedom genotypic test, which is robust to the underlying mode of inheritance. In addition, we only carried a subset of promising markers into a second-stage association analysis. Within the context of two-stage family based testing procedures, Ionita-Laza et al. (2007) have suggested that it may be more powerful to test all markers at the second-stage, weighting according to the first stage results. Thus, a point for future research will be to investigate how to optimally conduct two-stage testing procedures based on admixture information.
In addition, our approach is not intended to be used nor is it likely to be useful in all situations. When the correlation between admixture and the observed genotypes is zero, as will happen in regions of the genome that display little to no allele frequency differentiation across populations (or could occur in completely panmictic populations over many generations with no selection, no segregation distortion, and so on), the two-stage approach we propose will have no value. In situations in which the correlation between the adjusted genotypes and the observed genotypes is 1.0, there would also be no value in our two-stage approach because there will be perfect collinearity. Somewhere between zero and one must lie an optimum, and finding that optimum for different circumstances can be a topic for future research.
Web Resources
R programs implementing the proposed methods can be downloaded from http://www.soph.uab.edu/ssg/
Conflict of Interest Statement
The authors declare that the research was conducted in the absence of any commercial or financial relationships that could be construed as a potential conflict of interest.
Acknowledgments
We would like to thank Dr. Nicholas Patterson for his help with modifications of program Ancestrymap. This research was supported by grants R01-GM073766 and R01-GM077490 from the National Institute of General Medical Sciences and T32-HL072757 from the National Heart, Lung, and Blood Institute.
References
Adams, A. E., Rosenblatt, M., and Suva, L. J. (1999). Identification of a novel parathyroid hormone-responsive gene in human osteoblastic cells. Bone 24, 305–313.
Allison, D. B., and Coffey, C. S. (2002). Two-stage testing in microarray analysis: what is gained? J. Gerontol. A Biol. Sci. Med. Sci. 57, B189–B192.
Annilo, T., Shulenin, S., Chen, Z. Q., Arnould, I., Prades, C., Lemoine, C., Maintoux-Larois, C., Devaud, C., Dean, M., Denèfle, P., and Rosier, M. (2002). Identification and characterization of a novel ABCA subfamily member, ABCA12, located in the lamellar ichthyosis region on 2q34. Cytogenet. Genome Res. 98, 169–176.
Benjamini, Y., and Hochberg, Y. (1995). Controlling the false discovery rate: a practical and powerful approach to multiple testing. J. R. Stat. Soc. Series B Stat. Methodol. 85, 289–300.
Benjamini, Y., and Hochberg, Y. (2000). On the adaptive control of the false discovery fate in multiple testing with independent statistics. J. Educ. Behav. Stat. 25, 60–83.
Devlin, B., and Roeder, K. (1999). Genomic control for association studies. Biometrics 55, 997–1004.
Evans, D. M., Marchini, J., Morris, A. P., and Cardon, L. R. (2006). Two-stage two-locus models in genome-wide association. PLoS Genet. 2, e157. doi: 10.1371/journal.pgen.0020157
Freedman, M. L., Haiman, C. A., Patterson, N., McDonald, G. J., Tandon, A., Waliszewska, A., Penney, K., Steen, R. G., Ardlie, K., John, E. M., Oakley-Girvan, I., Whittemore, A. S., Cooney, K.A., Ingles, S. A., Altshuler, D., Henderson, B. E., and Reich, D. (2006). Admixture mapping identifies 8q24 as a prostate cancer risk locus in African-American men. Proc. Natl. Acad. Sci. U.S.A. 103, 14068–14073.
Hill, W. G., Goddard, M. E., and Visscher, P. M. (2008). Data and theory point to mainly additive genetic variance for complex traits. PLoS Genet. 4, e1000008. doi: 10.1371/journal.pgen.1000008
Hughes, L., Morrison, D., Kelley, J., Padilla, M., Vaughan, L., Westfall, A. O., Dwivedi, H., Mikuls, T. R., Holers, V. M., Parrish, L. A., Alarcón, G. S., Conn, D. L., Jonas, B. L., Callahan, L. F., Smith, E. A., Gilkeson, G. S., Howard, G., Moreland, L. W., Patterson, N., Reich, D. S., and Louis Bridges, Jr. (2008). The HLA-DRB1 shared epitope is associated with susceptibility to rheumatoid arthritis in African Americans through European genetic admixture. Arthritis Rheum. 58, 349–358.
Ionita-Laza, I., McQueen, M., Laird, N., and Lange, C. (2007). Genomewide weighted hypothesis testing in family-based association studies, with an application to a 100K scan. Am. J. Hum. Genet. 81, 607–614.
Kang, G. L., Ye, K. Y., Liu, N. J., Allison, D. B., and Gao, G. M. (2009). Weighted multiple hypothesis testing procedures. Stat. Appl. Genet. Mol. Biol. 8, 23.
Laird, N. M., and Lange, C. (2006). Family-based designs in the age of large-scale gene-association studies. Nat. Rev. Genet. 7, 385–394.
Marchini, J., Cardon, L., Phillips, M., and Donnelly, P. (2004). The effects of human population structure on large genetic association studies. Nat. Genet. 36, 512–517.
McCullagh, P., and Nelder, J. A. (1989). Generalized Linear Model, 2nd Edn. New York: Chapman & Hall/CRC Press.
McKeigue, P. (2006). Smoothing estimates of genetic map distance over short intervals. Available at: http://integrin.ucd.ie/cgi-bin/rs2cm.cgi (accessed July 5, 2010).
Patterson, N., Hattangadi, N., Lane, B., Lohmueller, K. E., Hafler, D. A., Oksenberg, J. R., Hauser, S. L., Smith, M. W., O’Brien, S. J., Altshuler, A., Daly, M. J., and David Reich, D. (2004). Methods for high-density admixture mapping of disease genes. Am. J. Hum. Genet. 74, 979–1000.
Price, A., Patterson, N., Plenge, R., Weinblatt, M., Shadick, N., Ruczinski, I., Beaty, T. H., Mathias, R., Reich, D., and Myers, S. (2006). Principal components analysis corrects for stratification in genome-wide association studies. Nat. Genet. 38, 904–909.
Price, A., Tandon, A., Patterson, N., Barnes, K. C., Rafaels, N., Ruczinski, I., Beaty, T. H., Mathias, R., Reich, D., and Myers, S. (2009). Sensitive detection of chromosomal segments of distinct ancestry in admixed populations. PLoS Genet. 5, e1000519. doi: 10.1371/journal.pgen.1000519
Redden, D. T., Divers, J., Vaughan, L. K., Tiwari, H. K., Beasley, T. M., Fernández, J. R., Kimberly, R. P., Feng, R., Padilla, M. A., Liu, N., Miller, M. B., and Allison, D. B. (2006). Regional admixture mapping and structured association testing: conceptual unification and an extensible general linear model. PLoS Genet. 2, e137. doi: 10.1371/journal.pgen.0020137
Richman, I. B., Chung, S. A., Taylor, K. E., Kosoy, R., Tian, C., Ortmann, W. A., Nititham, J., Lee, A. T., Rutman, S., Petri, M., Manzi, S., Behrens, T. W., Gregersen, P. K., Seldin, M. F., and Criswell, L. A. (2010). European population substructure correlates with systemic lupus erythematosus endophenotypes in North Americans of European descent. Genes Immun. 11, 515–521.
Sakai, K., Akiyama, M., Yanagi, T., McMillan, J. R., Suzuki, T., Tsukamoto, K., Sugiyama, H., Hatano, Y., Hayashitani, M., Takamori, K., Nakashima, K., and Shimizu, H. (2009). ABCA12 is a major causative gene for non-bullous congenital ichthyosiform erythroderma. J. Invest. Dermatol. 129, 2306–2309.
Sankararaman, S., Sridhar, S., Kimmel, G., and Halperin, E. (2008). Estimating local ancestry in admixed populations. Am. J. Hum. Genet. 82, 290–303.
Skol, A. D., Scott, L. J., Abecasis, G. R., and Boehnke, M. (2006). Joint analysis is more efficient than replication-based analysis for two-stage genome-wide association studies. Nat. Genet. 38, 209–213.
Smith, M. W., Patterson, N., Lautenberger, J. A., Truelove, A. L., McDonald, G. J., Waliszewska, A., Kessing, B. D., Malasky, M. J., Scafe, C., Le, E., De Jager, P. L., Mignault, A. A., Yi, Z., De The, G., Essex, M., Sankale, J. L., Moore, J. H., Poku, K., Phair, J. P., Goedert, J. J., Vlahov, D., Williams, S. M., Tishkoff, S.A., Winkler, C. A., and De La Vega, F. M. (2004). A high density admixture map for disease gene discovery in African Americans. Am. J. Hum. Genet. 74, 979–1000.
Stefflova, K., Dulik, M. C., Pai, A. A., Walker, A. H., Zeigler-Johnson, C. M., Gueye, S. M, Schurr, T. G., and Rebbeck, T. R. (2009). Evaluation of group genetic ancestry of populations from Philadelphia and Dakar in the context of sex-biased admixture in the Americas. PLoS ONE 4, e7842. doi: 10.1371/journal.pone.0007842
Storey, J. D. (2002). A direct approach to false discovery rates. J. R. Stat. Soc. Series B Stat. Methodol. 64, 479–498.
Teo, Y., Small, K., and Kwiatkowski, D. (2010). Methodological challenges of genome-wide association analysis in Africa. Nat. Rev. Genet. 11. 149–160.
Tiwari, H. K., Barnholtz-Sloan, J., Wineinger, N., Padilla, M. A., Vaughan, L. K., and Allison, D. B. (2008). Review and evaluation of methods correcting for population stratification with a focus on underlying statistical principles. Hum. Hered. 66, 67–86.
Van Steen, K., McQueen, M., Herbert, A., Raby, B., Lyon, H., DeMeo, D. L., Murphy, L., Su, J., Datta, S., Rosenow, C., Christman, M., Silverman, E. K., Laird, N. M., Weiss, S. T., and Lange, C. (2005). Genomic screening and replication using the same data set in family-based association testing. Nat. Genet. 37, 683–691.
Wang, H., Thomas, D. C., Pe’er, I., and Stram, D. O. (2006). Optimal two-stage genotyping designs for genome-wide association scans. Genet. Epidemiol. 30, 356–368.
Zeigler-Johnson, C., Friebel, T., Walker, A. H., Wang, Y., Spangler, E., Panossian, S., Patacsil, M., Aplenc, R., Wein, A. J., Malkowicz, S. B., and Rebbeck, T. R. (2004). CYP3A4, CYP3A5, and CYP3A43 genotypes and haplotypes in the etiology and severity of prostate cancer. Cancer Res. 64, 8461–8467.
Zheng, G., Song, K., and Elston, R. C. (2007). Adaptive two-stage analysis of genetic association in case-control designs. Hum. Hered. 63, 175–186.
Keywords: two-stage, structured association testing, admixture mapping, regional admixture estimate, genome-wide association studies
Citation: Kang G, Gao G, Shete S, Redden DT, Chang B-L, Rebbeck TR, Barnholtz-Sloan JS, Pajewski NM, Allison DB (2011) Capitalizing on admixture in genome-wide association studies: a two-stage testing procedure and application to height in African-Americans. Front. Gene. 2:11. doi: 10.3389/fgene.2011.00011
Received: 18 December 2010;
Paper pending published: 15 January 2011;
Accepted: 21 February 2011;
Published online: 10 March 2011.
Edited by:
Dongxiao Zhu, University of New Orleans, USAReviewed by:
Dongxiao Zhu, University of New Orleans, USAHua Li, Stowers Institute for Medical Research, USA
Copyright: © 2011 Kang, Gao, Shete, Redden, Chang, Rebbeck, Barnholtz-Sloan, Pajewski, Allison. This is an open-access article subject to an exclusive license agreement between the authors and Frontiers Media SA, which permits unrestricted use, distribution, and reproduction in any medium, provided the original authors and source are credited.
*Correspondence: David B. Allison, Section on Statistical Genetics, Department of Biostatistics, The University of Alabama at Birmingham, Birmingham, AL 35294, USA. e-mail:ZGFsbGlzb25AbXMuc29waC51YWIuZWR1