 Maggie L. Chow1
 Mary E. Winn2,3 Hai-Ri Li4 Craig April5
 Anthony Wynshaw-Boris6
 Jian-Bing Fan5 Xiang-Dong Fu4 Eric Courchesne1
 Nicholas J. Schork3*
- 1 Department of Neuroscience, UC San Diego Autism Center of Excellence, School of Medicine, National Institutes of Health, University of California San Diego, La Jolla, CA, USA
- 2 Scripps Genomic Medicine, The Scripps Translational Sciences Institute, The Scripps Research Institute, La Jolla, CA, USA
- 3 Graduate Program in Biomedical Sciences, Department of Medicine, University of California at San Diego, La Jolla, CA, USA
- 4 Department of Cellular and Molecular Medicine, School of Medicine, University of California San Diego, La Jolla, CA, USA
- 5 Illumina Inc., San Diego, CA, USA
- 6 Division of Medical Genetics, Department of Pediatrics, School of Medicine, Institute of Human Genetics, University of California San Francisco, San Francisco, CA, USA
Available statistical preprocessing or quality control analysis tools for gene expression microarray datasets are known to greatly affect downstream data analysis, especially when degraded samples, unique tissue samples, or novel expression assays are used. It is therefore important to assess the validity and impact of the assumptions built in to preprocessing schemes for a dataset. We developed and assessed a data preprocessing strategy for use with the Illumina DASL-based gene expression assay with partially degraded postmortem prefrontal cortex samples. The samples were obtained from individuals with autism as part of an investigation of the pathogenic factors contributing to autism. Using statistical analysis methods and metrics such as those associated with multivariate distance matrix regression and mean inter-array correlation, we developed a DASL-based assay gene expression preprocessing pipeline to accommodate and detect problems with microarray-based gene expression values obtained with degraded brain samples. Key steps in the pipeline included outlier exclusion, data transformation and normalization, and batch effect and covariate corrections. Our goal was to produce a clean dataset for subsequent downstream differential expression analysis. We ultimately settled on available transformation and normalization algorithms in the R/Bioconductor package lumi based on an assessment of their use in various combinations. A log2-transformed, quantile-normalized, and batch and seizure-corrected procedure was likely the most appropriate for our data. We empirically tested different components of our proposed preprocessing strategy and believe that our results suggest that a preprocessing strategy that effectively identifies outliers, normalizes the data, and corrects for batch effects can be applied to all studies, even those pursued with degraded samples.
Introduction
Great strides have been made in the development of gene expression profiling technologies that can accommodate partially degraded mRNA samples (Fan et al., 2004; April et al., 2009). These technologies are especially useful in assaying gene expression levels from unique tissue sources, such as the brain, where the conditions for the preservation of mRNA quality are not typically ideal (Mirnics and Pevsner, 2004). Gene expression assays that can accommodate the often degraded or partially degraded mRNA obtained from the brain could help identify molecular mechanisms underlying neuropsychiatric disorders, especially those that cannot be studied with animal models (Horváth et al., 2010). However, as relevant and sophisticated as gene expression assays that can accommodate partially degraded mRNA may, the application of these assays also requires appropriate methods for handling and preprocessing the information resulting from the assay in order to make sure the samples have been assayed properly with minimal residual effects of the degraded RNA.
While many gene expression assay preprocessing transformation and normalization procedures exist, such as those implemented in the available and widely used software package Bioconductor (Gentleman et al., 2004), most procedures differ in the way they remove systemic variance and prepare datasets for downstream processing (Lim et al., 2007; Schmid et al., 2010). For example, batch effects and issues of antemortem conditions documented by medical records that are often associated with the analysis of brain samples are not routinely accommodated by available methods (Johnson et al., 2007), but can be dealt with in a variety of ways. It is therefore important to compare and evaluate the utility of the various methods (Gold et al., 2005). Such comparisons can be achieved by considering resulting tests of associations between the processed expression data and other variables of interest, such as batch or level of sample degradation, using analysis of variance (ANOVA)-based techniques such as multivariate distance matrix regression (MDMR; Zapala and Schork, 2006).
We assessed the potential effects of different preprocessing strategies on single-channel postmortem brain gene expression data obtained with the Illumina DASL-based assay. The study that motivated our development of a preprocessing strategy involved exploring gene expression differences between autistic and normal individuals as part of an ongoing study of autism pathology. To achieve this, we considered the use of MDMR in combination with a number of standard gene expression level transformation and normalization measures to quantify the effect of defined preprocessing steps on a data set resulting from a DASL-based assay and partially degraded brain samples. The transformation and normalization measures we considered were those implemented in the R/Bioconductor package lumi (Du et al., 2008). We also considered the utility of Bayesian approaches to correct for batch effects (Johnson et al., 2007). Our results suggest that a preprocessing strategy that effectively identifies outliers, normalizes the data, and corrects for batch effects can be fashioned for gene expression assays designed to accommodate degraded samples.
Overview of Preprocessing Strategy
The strategy that we developed for objectively assessing outliers, normalization, and batch effects can be described in a series of steps. Before providing the results of each individual step, we offer a brief overview of the main elements of these steps (Figure 1). Essentially, raw intensity data without normalization or background subtraction was output from GenomeStudio software for the 57 total samples that we collected (see Materials and Methods), and quality control and outlier removal analyses were performed. Following these steps, transformation and normalization were performed by R/Bioconductor package lumi (Du et al., 2008). Then, to remove batch effects, we used the ComBat algorithm (Johnson et al., 2007). We leveraged MDMR analysis to probabilistically assess the effect of each step on the removal of systematic variation from the samples.
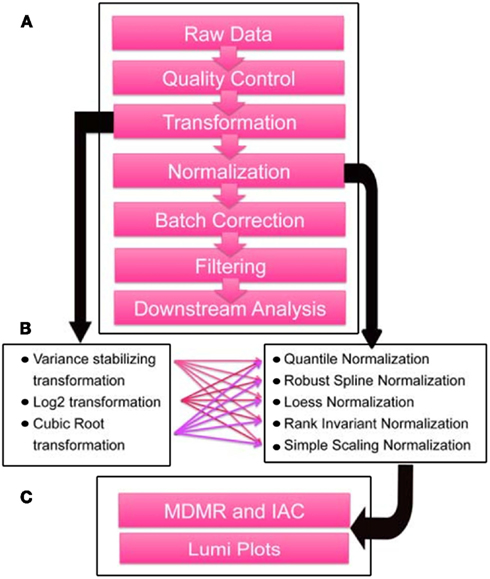
Figure 1. Data preprocessing steps and quality assessment scheme. (A) Flowchart depicting preprocessing steps taken for microarray data generated by DASL-based profiling of 33 frozen tissue samples passing quality control from male autistic and control cases in Chow et al. (in review). (B) Transformation and normalization algorithms in the R/Bioconductor package Lumi (Du et al., 2007) tested in combination in the sequence depicted in A. (C) Lumi plots, mean inter-array correlations (IAC), and multivariate distance matrix regression (MDMR; Zapala and Schork, 2006) were used as metrics to assess and quantify the effect of outlier removal and preprocessing steps. Downstream analyses include differential expression, coexpression, and gene set enrichment analyses.
Normalization and transformation
We examined the effect of different transformation and normalization method combinations in the Bioconductor package lumi (Du et al., 2008) on our dataset. These combinations are depicted in Figure 1B (e.g., log2–Loess, cubic root–rank invariant, etc.). Mean inter-array correlation (IAC) and lumi visualization plots were used as preliminary outcome measures to compare them. These correlations are a measure of the efficacy of normalization steps in removing systemic error from the dataset.
Batch correction
In addition to standard transformation and normalization procedures, it was necessary to consider batch and covariate correction procedures. First, since the frozen tissue samples were processed in two separate batches, samples within the same batch tended to group together, creating a possible confounding effect for downstream analyses. Furthermore, since epileptiform abnormalities are present in as many as 5–44% of children with autism (Tuchman and Rapin, 2002), it was important to account for the variance attributable to seizures noted by medical records in cases assayed (Table S1 in Supplementary Material) since we wanted to focus on differences due to autism pathology, not seizure-related activity.
Batch correction and adjustment for seizures as a covariate was performed using ComBat, which applied an empirical Bayes method (Johnson et al., 2007) to the dataset. Although batch correction techniques other than ComBat (Johnson et al., 2007) are available, Combat has been shown to outperform some other algorithms, particularly for small sample sets (Chen et al., 2011). MDMR and mean IAC were again used to gage the effectiveness of this stage of processing (Table 3).
Materials and Methods
Frozen and Formalin-Fixed Postmortem Human Brain Samples for Gene Expression Profiling
Fifty-seven frozen blocks of fresh frozen brain tissue from the prefrontal cortex of control and autistic male and female cases were obtained from the Harvard Brain and Tissue Resource Center (United States Public Health Service) and from the University of Miami/University of Maryland Brain and Tissue Bank (National Institute of Child Health and Human Development; Table S1 in Supplementary Material).
Diagnostic criteria of autistic disorder was verified for all autistic cases by review of psychological and medical records, including the Autism Diagnostic Interview-Revised (ADI-R; Lord et al., 1994), and the Autism Diagnostic Observation Schedule (ADOS; Lord et al., 2000) by a psychologist with extensive diagnostic experience with autism (CCB; Table S1 in Supplementary Material). Seizure incidence of autistic cases was also assessed through case records.
Brain Sample Collection
Due to documented variability of gene expression in neighboring brain areas (Rehen et al., 2005; Lein et al., 2007), it is of extreme importance that the blocks of tissue chosen for gene expression profiling are from comparable regions between cases. Anatomical landmarks were identified as consistently as possible for dissection across cases with the goal of obtaining a set of highly controlled, comparable tissue for brain gene expression profiling. When available, tissue from the superior frontal gyrus of the dorsal lateral prefrontal cortex (DLPFC) was dissected in each case. When this area was not available, we sampled from the middle frontal gyrus.
RNA Extraction from Tissues
Extraction of total RNA from 5–10 mg of frozen tissue from both gray and white matter, with as many layers of cortex as possible, was performed using MELT® kit from Ambion according to manufacturer’s instructions1. Select RNA samples were analyzed with BioAnalyzer® (Agilent) according to the manufacturer’s protocol for quality control and quantification, and available RNA integrity numbers (RIN) from three RNA quality assessments are reported in Table S1 in Supplementary Material. Because RNA quality was not expected to be a good predictor of array quality (Abramovitz et al., 2008), all samples regardless of RIN were assayed. Whole RNA from remaining samples was quantified using a NanoDrop® spectrophotometer.
DASL Labeling, Hybridization, and Scanning
Total RNA from frozen samples underwent cDNA synthesis, and cDNA-mediated annealing, selection, and ligation (DASL)-based labeling, hybridization to Illumina HumanRef8 v3 and scanning on two separate occasions as described previously (April et al., 2009). Both biological and technical replicates were included for quality control. Using biotinylated random primers and oligo-dT, 200 ng RNA was converted to cDNA. The biotinylated cDNA was then immobilized to a streptavidin-coated solid support, and annealed with a pool of gene-specific oligonucleotides. Following extension and ligation, the ligated oligonucleotides were PCR amplified with a biotinylated and a fluorophore-labeled universal primer, and captured using streptavidin paramagnetic beads. Finally, the single-stranded PCR products were eluted and hybridized to the BeadChips at 58°C for 16 h. A BeadArray Reader was used to scan array images and extract fluorescence intensities, and all data were uploaded into GenomeStudio software without normalization or background subtraction for quality control and processing. All raw data is available on the NCBI Gene Expression Omnibus under accession number GSE284752. Array chip and position of each sample are detailed in Table S2 in Supplementary Material.
Exclusion Criteria for DASL-Processed Frozen Samples
Exclusion criteria are outlined in detail in the results section. The lumi package in Bioconductor (Du et al., 2008), MDMR, and mean IAC were used as unbiased statistical metrics and visualization techniques for quality control of the outlier exclusion process. The final dataset consists of high quality arrays of 33 male ASD and control cases. All outliers were removed before transformation, normalization, and batch correction procedures.
Data Preprocessing
For data preprocessing and normalization, we aimed to identify a workflow that would: (1) maximize mean IAC across the dataset (Oldham et al., 2008); (2) remove known confounds from the dataset; and (3) prepare the data for downstream processing (e.g., differential expression and enrichment analysis).
Average clustering with Euclidean distances, scatterplots, distribution histograms, correlation measures, and boxplots were used to visualize the data before and after processing steps. For details on the implementation of the transformation and normalization techniques we used, see (Du et al., 2007, 2008; Lin et al., 2008). Mean IACs (Oldham et al., 2008) were used as a basis to identify reasonable processing candidates at each step for further investigation.
Transformation procedures
Transformation methods involving the log2, variance stabilizing transformation (VST; Lin et al., 2008), and cubic root were implemented using the lumi package (Du et al., 2008) before data normalization.
Normalization procedures
Robust spline normalization (RSN), simple scaling normalization (SSN), quantile normalization, variance stabilizing normalization (VSN), Loess, and Rank Invariant normalization methods were tested in conjunction with the above transformation procedures (Du et al., 2008; Lin et al., 2008).
Batch correction procedures
The software suite Combat (Johnson et al., 2007) was used to remove the variance attributed to batch effect, since sets of our frozen samples were processed at different times on the DASL platform. In addition, we also attempted to remove the confounding effects of seizures in our dataset, since many individuals with autism have comorbid seizure incidence. MDMR was used to assess the efficacy of the correction methods as described below.
Multivariate distance matrix regression
To assess the variance within the dataset attributable to a set of additional or ancillary variables before and after manipulating and preprocessing the expression assay results (e.g., batch correction), MDMR (Zapala and Schork, 2006) with 1000 permutations was applied to the Euclidean distance matrices constructed from the expression values between each sample3. Variables of interest that were tested for association with the expression profiles (reflected in distance matrices) included batch, diagnosis, age, and seizure incidence of cases from which we sampled. We leveraged both single independent variable and multiple independent MDMR results.
Multivariate distance matrix regression (Zapala and Schork, 2006) is a statistical method that considers variation in the degree of pairwise similarity among individuals based on multivariate profiles or data collected on those individuals. MDMR tests the hypothesis that a measure variable (e.g., diagnosis) “explains” variation in the similarities/dissimilarities exhibited by the individuals. It requires two main inputs: (1) a distance matrix quantifying distances (i.e., differences or lack of similarity) between gene expression profiles of the samples in the study; and (2) additional variables, such as diagnosis, age, sex, etc., which are considered independent variables. The method uses these additional variables to determine how much variation in the similarities among the individuals can be explained by these variables. It essentially works in a manner analogous to regression analysis, but accounts for dependencies in the data, and can produce estimates of variance explained as is both single independent and multiple independent variable regression models. The single independent variable regression results consider the predictive value each of the independent variables separately, while the multiple regression model considers all the independent variables entered cumulatively. In the current manuscript, we use MDMR as a method to assess the variance attributable ‘to, e.g., batch, age, gender, etc.’
The final transformed, normalized, and batch and covariate-corrected dataset is available on the NCBI Gene Expression Omnibus accession # GSE28475 (see text footnote 2). qPCR validation of selected genes was performed (Figure S27 in Supplementary Material).
Results
Outlier Detection and Exclusion
An initial step in microarray-based gene expression assay data processing involves identifying and removing outlying individuals whose assay results exhibit marked, and likely artifactual, deviation from the other assay results. Since normalization procedures depend on biological variability within the dataset examined and assume that most genes are not differentially expressed, normalizing experimental samples with outliers that create artificial variation in a dataset could potentially confound analyses after the preprocessing is complete. In addition, most normalization procedures assume that most of the genes in a dataset are not differentially expressed across experimental conditions, so artificial variance induced by outliers can have an amplified effect on downstream analyses.
As noted, our data set was based on brain tissue samples from 57 autistic and control cases, and were labeled by a sample number (numbers 1–74), biological replicate letter (a, b, or c), and technical replicate number (rep 1 or rep 2). We refer to this labeling in order to describe the results of the outlier analyses. These brain samples were subjected to DASL-based expression array analysis. Assay results were then analyzed using criteria and analysis steps outlined above and detailed below for outlier detection and exclusion in the presence of potential batch effects:
(1) As a first pass, a sample had to yield 14000 detectable genes out of over 18000 (77%) genes detectable at a threshold of p < 0.05 as a first pass. Samples 15B, 20A, 46A, 49A, 50A, 61B, 64B, 69A, 70B, and 74C did not meet this criterion (Figure S1 in Supplementary Material).
(2) Samples were required to pass the outlier detection methods (based on distance to the “center” of a reference sample; Du et al., 2008) as implemented in the lumi package in R, both before and after basic transformation and normalization procedures (log2 transform, quantile normalization). This criterion is based on the assumption of the gross homogeneity of the samples. 70B, 69A, 64B, 20A, 32C, 15B, 46A, 31A, 50A, 61B, 74C, and 49A did not meet this criterion (Figures S2 and S3 in Supplementary Material).
(3) Visual inspection of the samples was also used, whereby each sample was required to show boxplot distributions comparable to the remainder of the samples (Figure S4 in Supplementary Material). We found that often samples that did not meet the criterion concerning detected probes described in (1) showed an interquartile range different from the other cases. Samples 20A, 31A, 32C, 45B, 49A, 50A, 61B, 64B, 69A, 70B did not meet this criterion.
(4) Pairwise comparisons using scatterplots, histograms, and correlation coefficients were then used to examine the samples that were not removed both before and after transformation and normalization. Individual samples emerging from the scatter plots and histograms pre and post transformation and normalization that skewed the data were removed from the analysis. Samples 21C, 46A, 51B, 52A did not meet these criteria (see Figures S5 and S6 in Supplementary Material).
(5) Only eight female autistic and control cases passed the quality control measures in steps 1–4. Since this was an extremely small sample, not well age-matched with control samples, and it is hypothesized that pathogenic mechanisms differ between male and female autistic cases (Bloss and Courchesne, 2007), we decided to remove these cases from the differential expression analysis between autistic male and control male cases. These cases included 7A, 7B, 14A, 17A, 24A, 47A, 54B, 56A, and 60A.
(6) After removal of outliers and unduly influential samples in step 1–5, we tested for and detected severe batch effects (Figure S7 in Supplementary Material). Samples 1–8 were processed as one batch, while the remainder was processed in a second batch. From the cluster dendrogram, it was obvious that samples in each batch tended to cluster together (Figure S7 in Supplementary Material). In fact, the “distance from center” method implemented in the lumi analysis package detected the samples from the first batch as outliers relative to the second batch. We thus considered the use of the batch correction algorithms implemented in the ComBat (Johnson et al., 2007) after transformation and normalization (Figures S8–S10 in Supplementary Material). Details of our batch correction analyses are described in processing steps 7–9 below.
(7) After batch correction and outlier removal, we applied the outlier detection methods employed by Oldham et al. (2008) to ensure that excluding the arrays in steps 1–5 indeed increased mean IAC. This statistic is defined as the Pearson correlation coefficient of the expression levels of all available probes for a pair of microarrays, averaged across all arrays. Figure S11 and S12 in Supplementary Material, and Table 1 show that the mean IAC from before and after outlier removal increased from 0.775 to 0.911 after outlier removal, and to 0.952 after all data preprocessing steps, suggesting that preprocessing steps did result in a data set that did not harbor obvious, statistically meaningful outliers.
(8) To ensure that borderline samples (e.g., 48, 57, 33B) were in fact not outliers, differential expression analysis including and excluding these cases was run iteratively to check that they did not strongly affect differential expression and enrichment analysis results. Differential expression analysis comparing autistic and control cases was run by an ANOVA-based method in BRB-ArrayTools (http://linus.nci.nih.gov/BRB-ArrayTools.html). Genes passing a threshold of p < 0.05 were further subjected to enrichment analysis in the MetaCore software suite (MetaCore from GeneGO Inc.). The results of these analyses are reported elsewhere and suggest that no samples were unduly influential, and hence likely to be artifactual, in the analyses (Chow et al., in review).
(9) Finally, to ensure that no variation attributable to artifact or noise was introduced to the dataset following outlier removal, transformation, normalization, and batch correction, MDMR analysis was performed (Table 2). No significant effects of measures and parameters associated with the samples were observed that would indicate the presence of outliers and batch effects. Thus, the final set of samples included 33 high quality male autistic and control samples of 57 originally assayed samples.
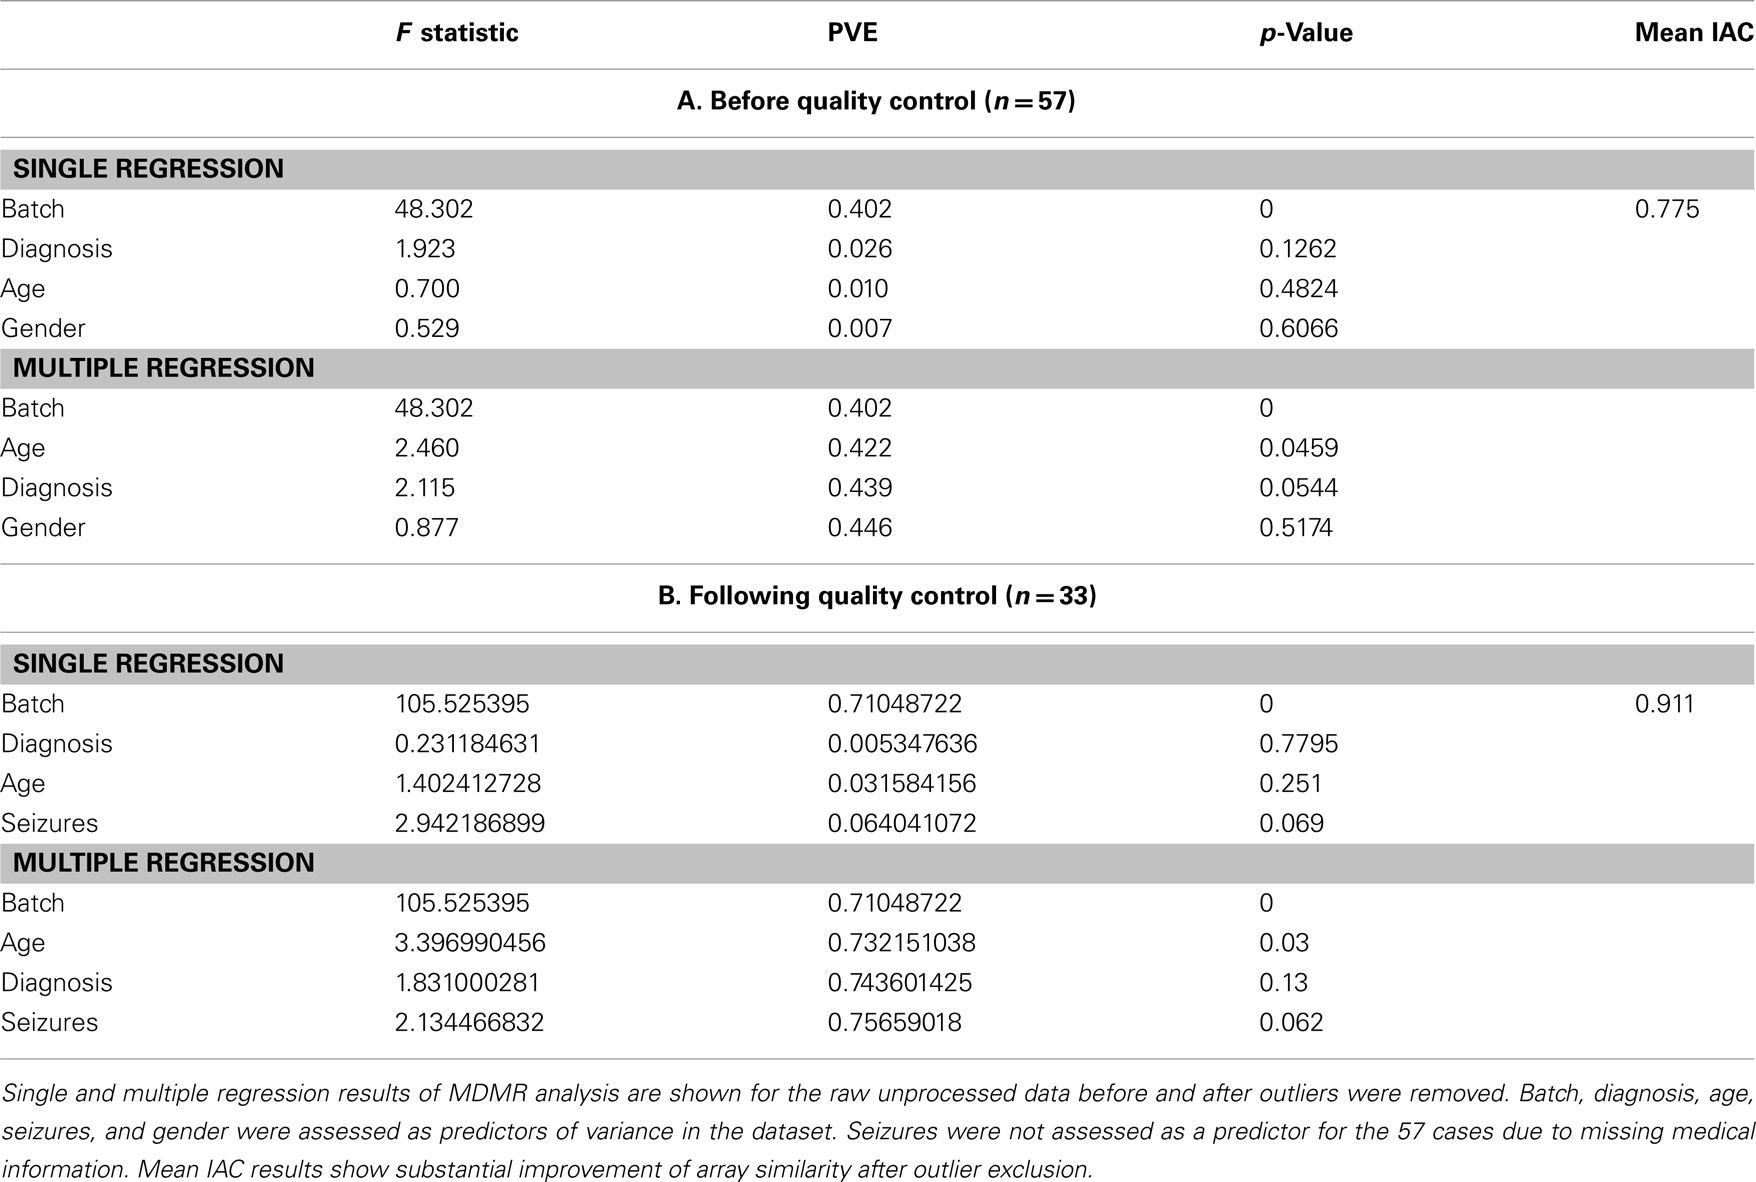
Table 1. MDMR and mean IAC results preceding (A) and following (B) quality control.
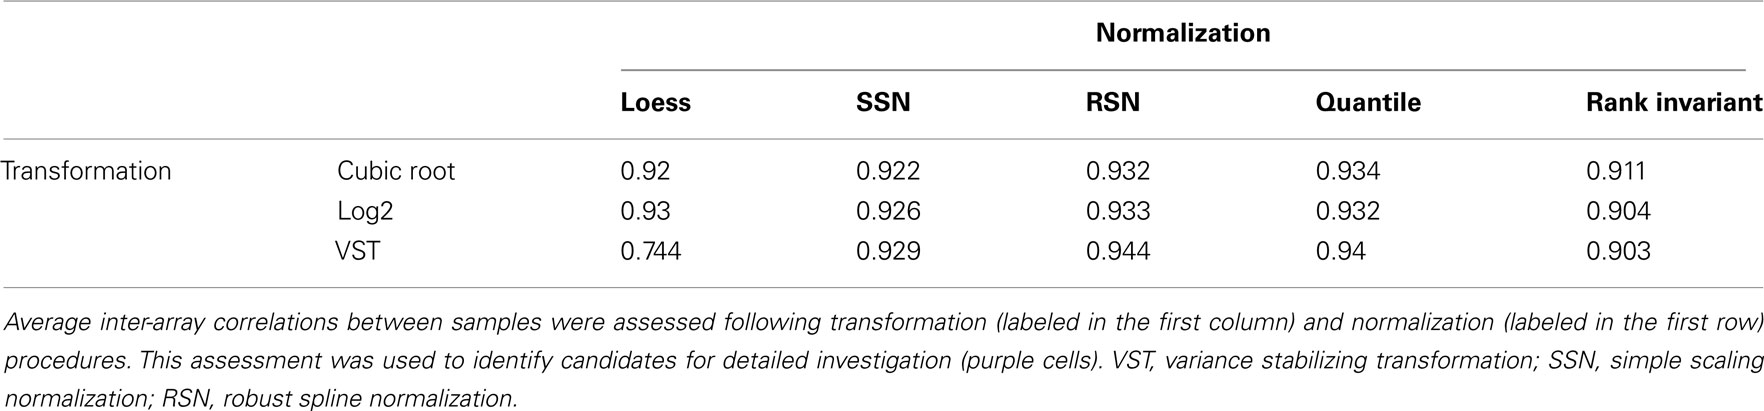
Table 2. Mean IAC of dataset following transformation and normalization in lumi.
Normalization and transformation
Fifteen combinations of normalization and transformation methods were tested (Figure 1B). Plots of the genome-wide data before transformation and normalization procedures are shown in Figures S13–S15 in Supplementary Material, and plots after transformation and normalization are shown in Figures S16–S24 in Supplementary Material.
Of the 15 combinations tested (Table 2), four were chosen for further analysis. Log2 transformation of the resulting assay data was chosen for further investigation based on convention and high mean IAC, and VST transformation was chosen based on high mean IAC (Table 2). RSN and quantile normalization for each of these transformation methods yielded the highest mean IACs and so were further investigated. Slight differences in data distribution were evident between these four techniques (Figure 2; Figures S18 and 21 in Supplementary Material). These differences are important due to assumptions of normality that must be met for downstream preprocessing and analyses (Giles, 2003; Zapala and Schork, 2006; Johnson et al., 2007).

Figure 2. Use of lumi plots to visualize correlations between samples in two batches. Histograms, scatter plots, and correlations statistics are plotted for samples 1 and 48 (A/B = biological replicate; rep = technical replicate), which were processed in two separate batches. These two batches showed substantial batch effects (Figure S7 in Supplementary Material). Figure shows the effect of transformation (log2 and VST shown here) and normalization (quantile and RSN shown here), and batch correction on the similarity between these samples. Green boxes show differences in the frequency distribution following transformation and normalization steps. Pink boxes show increasing correlation following transformation and normalization steps as well as the batch correction step.
Qualitatively, log2-transformed expression values showed a more normal distribution, while VST-transformed values showed a distribution skewed to lower intensity values (Figure 2 and Figures S18 in Supplementary Material). Correlations between arrays were slightly higher in the log2/quantile combination, but more genes were detected as differentially up/down regulated between technical replicates in this combination.
We again used MDMR to check the predictors of variance in these preprocessed datasets. Comparing multiple regression MDMR results after quality control (Table 1) and after transformation and normalization but before batch correction (Table 3), we see that cumulative percentage of variance explained (PVE) using batch, age, diagnosis, and seizures as predictors could predict 75.6% of variance before preprocessing, but only ∼35% after preprocessing. Batch effects were still the primary predictor of variance in the dataset. Furthermore, the importance of seizures as a predictor of variance increased following all four preprocessing strategies, which necessitated implementing other statistical strategies to ensure that seizure incidence was not a confounding variable for differential expression analysis by diagnosis. Nonetheless, the variance predicted by the main variable of interest, diagnosis, did not appear to be affected by any of the four preprocessing techniques. In fact, following transformation and normalization, each of the four strategies appeared to yield similar PVEs for each of the four variables queried.
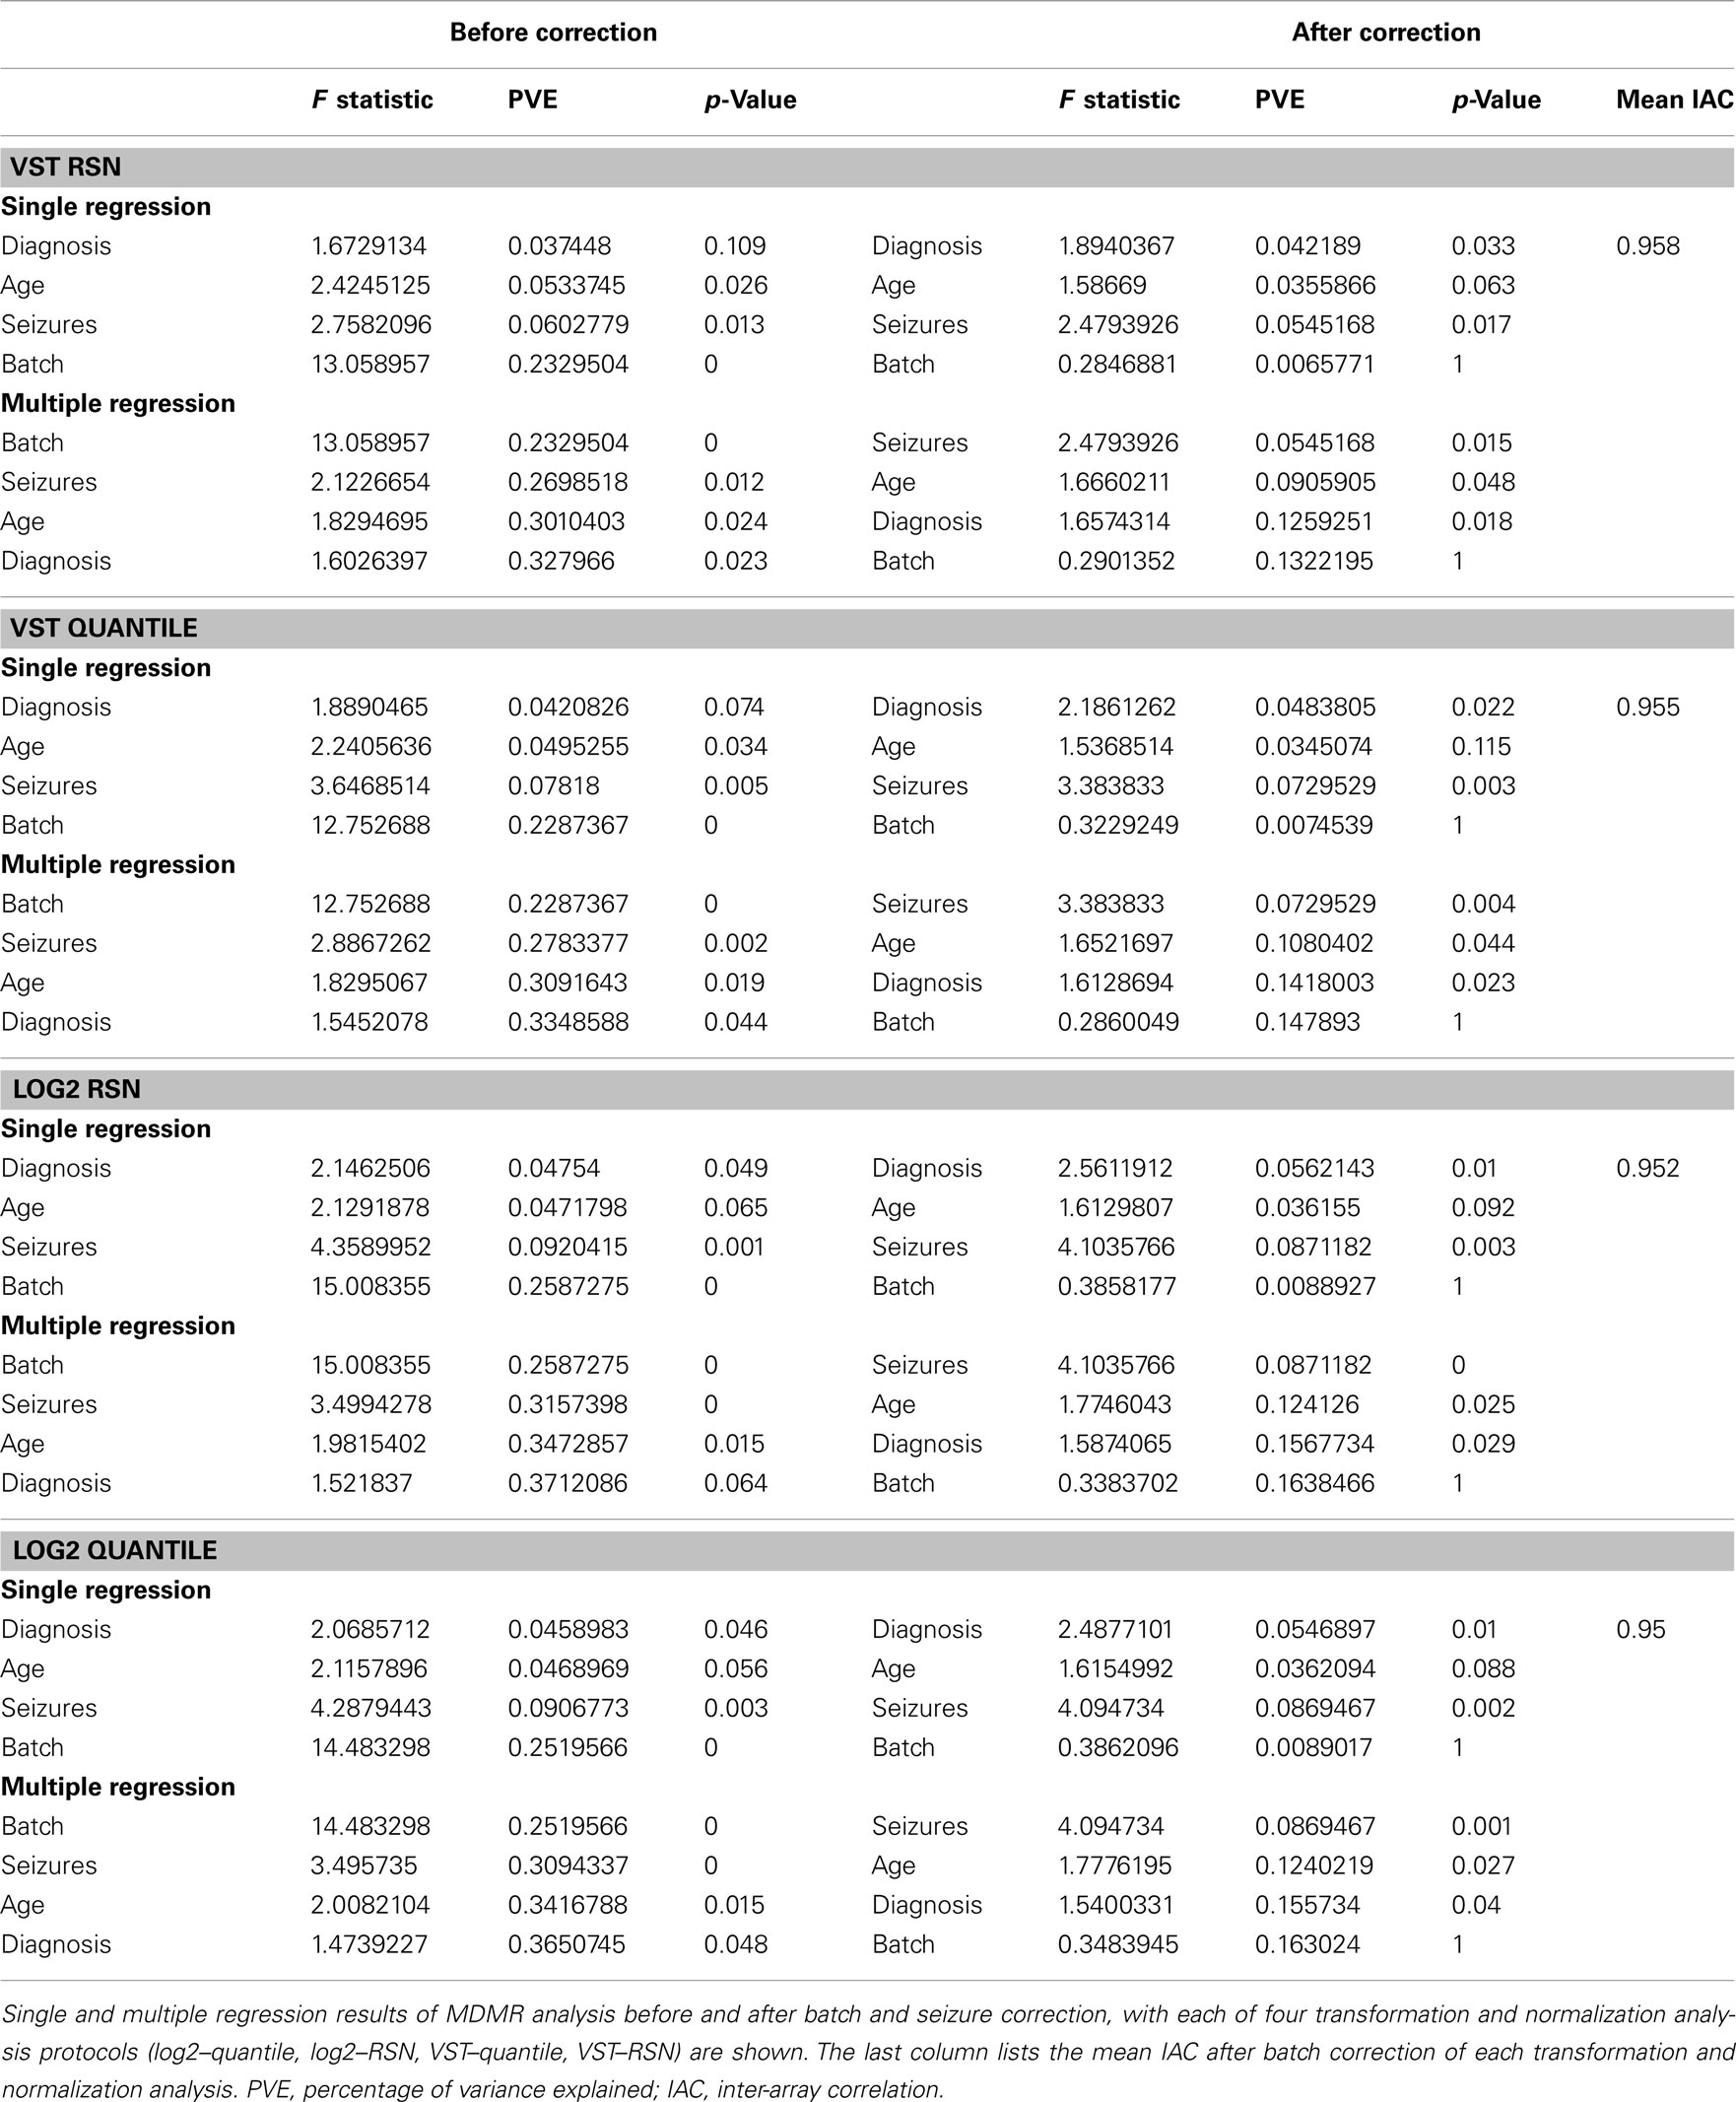
Table 3. Multivariate distance matrix regression and mean IAC of preprocessing techniques before and after batch and seizure correction.
Batch correction
Substantial batch effects could be observed through hierarchical clustering by average linkage (Figure S7 in Supplementary Material). Batch correction and adjustment for seizures as a covariate was performed using ComBat on the four pipeline protocols highlighted in Table 2 (Johnson et al., 2007).
Batch correction by ComBat decreased the percentage of variation that could be attributable to batch from ∼25% after transformation and normalization to less than 1% in each of the four pipeline pathways. Scatterplots and IAC calculations indeed showed higher correlation between samples in two separate batches after correction (Figure 2; Figures S25 and 26 in Supplementary Material; Table 3). After the correction step, seizures became the most important predictor of variance in the dataset, but the PVE remained similar before and after correction. These results suggested that the use of Combat and appropriate preprocessing can effectively eliminate the potential for artifactual associations between gene expression levels and important covariates.
Based on these results with ComBat and the combination of factors listed above, including the intensity distribution, MDMR analysis, and IACs, we chose the log2–quantile method for our DASL-based brain gene expression dataset. Following these steps, the dataset was ready for probe-based filtering and differential expression analysis in BRB Array Tools, followed by enrichment analysis in the MetaCore software suite (Chow et al., in review).
Discussion
We have described a DASL assay-based gene expression preprocessing analysis and quality control strategy meant to accommodate problems associated with the use of degraded brain samples. The motivation for developing this strategy was to investigate aberrant molecular pathways in the brains of individuals with autism (Chow et al., in review). Preprocessing strategies have important downstream consequences, and should therefore be vetted appropriately. We exploited statistical methods such as MDMR (Zapala and Schork, 2006), the algorithms and procedures described in the lumi analysis package (Du et al., 2008), and mean IAC analysis (Oldham et al., 2008) to quantify and visualize the effects of each of our proposed preprocessing steps. Ultimately, it is crucially important to remove systemic error in microarray-based gene expression studies, so as not to unduly influence inferences made in such studies. The main goal of our preprocessing technique was to produce a clean dataset suitable for downstream differential expression analyses using statistical measures to quantify and visualize the effects of each preprocessing step. An alternate statistical modeling strategy may also be applied to adjust for batch effects and other confounding variables.
Our analysis suggests that not all bioinformatics and biostatistical pre- and post-processing techniques will generate reliable results from brain gene expression datasets, when degraded samples are considered and the DASL assay is used. This is consistent with previous reports that consider general microarray-based gene expression studies (Lim et al., 2007; Schmid et al., 2010). For example, the transformation methods resulting in the highest inter-array gene expression profile correlations and that are historically used for expression microarray preprocessing all yielded varying results as assessed by the use of MDMR and mean IAC analyses. Our decision to ultimately transform and normalize our dataset by the log2–quantile method, followed by batch and covariate correction analyses, was based on careful consideration of whether a removal of potentially artifactual variation across the expression profiles of the samples could be achieved and quantified. The results of the analyses comparing autistic and control brains involving the samples processed in this report are described elsewhere (Chow et al., in review).
In order to assess the effects of autism diagnosis on brain gene expression, while controlling for important covariates such as gender and age, it was necessary to remove the systematic variance introduced by experimental data handling factors. Furthermore, if autism-specific mechanisms are to be uncovered, the effect of medications, lifestyle, comorbid conditions, and other confounding variables on brain gene expression must be accommodated and controlled for (Horváth et al., 2010). As noted, we attempted to remove seizure-specific variance through the use of the algorithm implement in ComBat (Johnson et al., 2007) since it was a primary confounding variable to diagnostic differences between cases. Despite the sophistication of these statistical techniques and their potential to control for effects such as seizure when considering the effects of autism on brain gene expression, care should be taken to select postmortem cases and samples for gene expression studies without such confounding conditions. It is possible that overuse of batch effect correction and normalization techniques can modify variance in the dataset and thus confound biological results. Thus, although we have developed a procedure for objectively removing outliers, normalizing data, and removing batch effects from DASL chip-based gene expression on degraded brain samples, it is no substitute for good study design and appropriate collection, storage and maintenance of samples.
Conflict of Interest Statement
Dr. Jian-Bing Fan and Dr. Craig April declare stock and employment interest in Illumina, Inc.
Acknowledgments
This research was supported by funds from Cure Autism Now, the Simons Foundation, The Peter Emch Family Foundation, and the UCSD-NIH Autism Center of Excellence (P50-MH081755) awarded to EC. NJS and MEW are supported in part by the following research grants: U19 AG023122-05; R01 MH078151-03; N01 MH22005; U01 DA024417-01; R01 AG030474-02; N01 MH022005; R01 HL089655-02; R01 MH080134-03; U54 CA143906-01; UL1 RR025774-03 as well as the Price Foundation and Scripps Genomic Medicine. We send our appreciation to all parents who made the difficult choice to support brain research through the donation of brain tissue from their loved ones. Tissue for this study was provided by the National Institute of Child Health and Human Development Brain and Tissue Bank for Developmental Disorders (Baltimore, MD) under contracts N01-HD-4-3368 and N01-HD-4-3383, the Brain and Tissue Bank for Developmental Disorders (Miami, FL), Autism Tissue Program (Princeton, NJ) and Harvard Brain Tissue Resource Center (Belmont, MA). We thank Dr. Ronald Zielke at the National Institute of Child Health and Human Development Brain and Tissue Bank for Developmental Disorders and Dr. Jane Pickett at the Autism Tissue Program for facilitation of tissue acquisition and Dr. Joeseph Buckwalter, Dr. Cynthia Schumann, Robert Johnson, and Robert Vigorito for help in tissue dissection and collection. We also thank Dr. Brandy Klotzle, Dr. Gary Hardiman, and James Sprague for microarray processing.
Supplementary Material
The Supplementary Material for this article can be found online at http://www.frontiersin.org/Statistical_Genetics_and_Methodology/10.3389/fgene.2012.00011/abstract
Footnotes
References
Abramovitz, M., Ordanic-Kodani, M., Wang, Y., Li, Z., Catzavelos, C., Bouzyk, M., Sledge, G. W. Jr., Moreno, C. S., and Leyland-Jones, B. (2008). Optimization optimization of RNA extraction from FFPE tissues for expression profiling in the DASL assay. BioTechniques 44, 417–423.
April, C., Klotzle, B., Royce, T., Wickham-Garcia, E., Boyaniwsky, T., Izzo, J., Cox, D., Jones, W., Rubio, R., Holton, K., Matulonis, U., Quackenbush, J., and Fan, J. B. (2009). Whole-genome gene expression profiling of formalin-fixed, paraffin-embedded tissue samples. PLoS ONE 4, e8162. doi:10.1371/journal.pone.0008162
Bloss, C. S., and Courchesne, E. (2007). MRI neuroanatomy in young girls with autism: a preliminary study. J. Am. Acad. Child Adolesc. Psychiatry 46, 515–23.
Chen, C., Grennan, K., Badner, J., Zhang, D., Gershon, E., Jin, L., and Liu, C. (2011). Removing batch effects in analysis of expression microarray data: an evaluation of six batch adjustment methods. PLoS ONE 6, e17238. doi:10.1371/journal.pone.0017238
Du, P., Kibbe, W. A., and Lin, S. M. (2007). nuID: a universal naming scheme of oligonucleotides for Illumina, affymetrix, and other microarrays. Biol. Direct 2, 16.
Du, P., Kibbe, W. A., and Lin, S. M. (2008). Lumi: a pipeline for processing Illumina microarray. Bioinformatics 24, 1547–1548.
Fan, J.-B., Yeakley, J. M., Bibikova, M., Chudin, E., Wickham, E., Chen, J., Doucet, D., Rigault, P., Zhang, B., Shen, R., McBride, C., Li, H. R., Fu, X. D., Oliphant, A., Barker, D. L., and Chee, M. S. (2004). A versatile assay for high-throughput gene expression profiling on universal array matrices. Genome Res. 14, 878–885.
Gentleman, R. C., Carey, V. J., Bates, D. M., Bolstad, B., Dettling, M., Dudoit, S., Ellis, B., Gautier, L., Ge, Y., Gentry, J., Hornik, K., Hothorn, T., Huber, W., Iacus, S., Irizarry, R., Leisch, F., Li, C., Maechler, M., Rossini, A. J., Sawitzki, G., Smith, C., Smyth, G., Tierney, L., Yang, J. Y., and Zhang, J. (2004). Bioconductor: open software development for computational biology and bioinformatics. Genome Biol. 5, R80.
Giles, P. J. (2003). Normality of oligonucleotide microarray data and implications for parametric statistical analyses. Bioinformatics 19, 2254–2262.
Gold, D. L., Wang, J., and Coombes, K. R. (2005). Inter-gene correlation on oligonucleotide arrays: how much does normalization matter? Am. J. Pharmacogenomics 5, 271–279.
Horváth, S., Janka, Z., and Mirnics, K. (2010). Analyzing Schizophrenia by DNA Microarrays. Biol. Psychiatry 69, 157–162.
Johnson, W. E., Li, C., and Rabinovic, A. (2007). Adjusting batch effects in microarray expression data using empirical Bayes methods. Biostatistics 8, 118–127.
Lein, E. S., Hawrylycz, M. J., Ao, N., Ayres, M., Bensinger, A., Bernard, A., Boe, A. F., Boguski, M. S., Brockway, K. S., Byrnes, E. J., Chen, L., Chen, L., Chen, T. M., Chin, M. C., Chong, J., Crook, B. E., Czaplinska, A., Dang, C. N., Datta, S., Dee, N. R., Desaki, A. L., Desta, T., Diep, E., Dolbeare, T. A., Donelan, M. J., Dong, H. W., Dougherty, J. G., Duncan, B. J., Ebbert, A. J., Eichele, G., Estin, L. K., Faber, C., Facer, B. A., Fields, R., Fischer, S. R., Fliss, T. P., Frensley, C., Gates, S. N., Glattfelder, K. J., Halverson, K. R., Hart, M. R., Hohmann, J. G., Howell, M. P., Jeung, D. P., Johnson, R. A., Karr, P. T., Kawal, R., Kidney, J. M., Knapik, R. H., Kuan, C. L., Lake, J. H., Laramee, A. R., Larsen, K. D., Lau, C., Lemon, T. A., Liang, A. J., Liu, Y., Luong, L. T., Michaels, J., Morgan, J. J., Morgan, R. J., Mortrud, M. T., Mosqueda, N. F., Ng, L. L., Ng, R., Orta, G. J., Overly, C. C., Pak, T. H., Parry, S. E., Pathak, S. D., Pearson, O. C., Puchalski, R. B., Riley, Z. L., Rockett, H. R., Rowland, S. A., Royall, J. J., Ruiz, M. J., Sarno, N. R., Schaffnit, K., Shapovalova, N. V., Sivisay, T., Slaughterbeck, C. R., Smith, S. C., Smith, K. A., Smith, B. I., Sodt, A. J., Stewart, N. N., Stumpf, K. R., Sunkin, S. M., Sutram, M., Tam, A., Teemer, C. D., Thaller, C., Thompson, C. L., Varnam, L. R., Visel, A., Whitlock, R. M., Wohnoutka, P. E., Wolkey, C. K., Wong, V. Y., Wood, M., Yaylaoglu, M. B., Young, R. C., Youngstrom, B. L., Yuan, X. F., Zhang, B., Zwingman, T. A., and Jones, A. R. (2007). Genome-wide atlas of gene expression in the adult mouse brain. Nature 445, 168–176.
Lim, W. K., Wang, K., Lefebvre, C., and Califano, A. (2007). Comparative analysis of microarray normalization procedures: effects on reverse engineering gene networks. Bioinformatics 23, i282–i288.
Lin, S. M., Du, P., Huber, W., and Kibbe, W. A. (2008). Model-based variance-stabilizing transformation for Illumina microarray data. Nucleic Acids Res. 36, e11.
Lord, C., Risi, S., Lambrecht, L., Cook, E. H. Jr., Leventhal, B. L., DiLavore, P. C., Pickles, A., and Rutter, M. (2000). The autism diagnostic observation schedule-generic: a standard measure of social and communication deficits associated with the spectrum of autism. J. Autism Dev. Disord. 30, 205–223.
Lord, C., Rutter, M., and Couteur, A. (1994). Autism diagnostic interview-revised: a revised version of a diagnostic interview for caregivers of individuals with possible pervasive developmental disorders. J. Autism Dev. Disord. 24, 659–685.
Mirnics, K., and Pevsner, J. (2004). Progress in the use of microarray technology to study the neurobiology of disease. Nat. Neurosci. 7, 434–439.
Oldham, M. C., Konopka, G., Iwamoto, K., Langfelder, P., Kato, T., Horvath, S., and Geschwind, D. H. (2008). Functional organization of the transcriptome in human brain. Nat. Neurosci. 11, 1271–1282.
Rehen, S. K., Yung, Y. C., McCreight, M. P., Kaushal, D., Yang, A. H., Almeida, B. S. V., Kingsbury, M. A., Cabral, K. M. S., McConnell, M. J., Anliker, B., Fontanoz, M., and Chun, J. (2005). Constitutional aneuploidy in the normal human brain. J. Neurosci. 25, 2176–2180.
Schmid, R., Baum, P., Ittrich, C., Fundel-Clemens, K., Huber, W., Brors, B., Eils, R., Weith, A., Mennerich, D., and Quast, K. (2010). Comparison of normalization methods for Illumina BeadChip HumanHT-12 v3. BMC Genomics 11, 349. doi:10.1186/1471-2164-11-349
Keywords: gene expression, microarray, data preprocessing, quality control
Citation: Chow ML, Winn ME, Li H-R, April C, Wynshaw-Boris A, Fan J-B, Fu X-D, Courchesne E and Schork NJ (2012) Preprocessing and quality control strategies for Illumina DASL assay-based brain gene expression studies with semi-degraded samples. Front. Gene. 3:11. doi: 10.3389/fgene.2012.00011
Received: 09 December 2011;
Paper pending published: 01 January 2012;
Accepted: 19 January 2012;
Published online: 24 February 2012.
Edited by:
Frank Emmert-Streib, Queen’s University Belfast, UKCopyright: © 2012 Chow, Winn, Li, April, Wynshaw-Boris, Fan, Fu, Courchesne and Schork. This is an open-access article distributed under the terms of the Creative Commons Attribution Non Commercial License, which permits non-commercial use, distribution, and reproduction in other forums, provided the original authors and source are credited.
*Correspondence: Nicholas J. Schork, The Scripps Research Institute, 3344 North Torrey Pines Court, Room 306, La Jolla, CA 92037, USA. e-mail:bnNjaG9ya0BzY3JpcHBzLmVkdQ==