 Peter C. Lai
 Chiquito J. Crasto*
- Division of Research, Department of Genetics, University of Alabama at Birmingham, Birmingham, AL, USA
Olfactory receptors (ORs) are a type of GTP-binding protein-coupled receptor (GPCR). These receptors are responsible for mediating the sense of smell through their interaction with odor ligands. OR-odorant interactions marks the first step in the process that leads to olfaction. Computational studies on model OR structures can generate focused and novel hypotheses for further bench investigation by providing a view of these interactions at the molecular level beyond inferences that are drawn merely from static docking. Here we have shown the specific advantages of simulating the dynamic environment associated with OR-odorant interactions. We present a rigorous protocol which ranges from the creation of a computationally derived model of an olfactory receptor to simulating the interactions between an OR and an odorant molecule. Given the ubiquitous occurrence of GPCRs in the membranes of cells, we anticipate that our OR-developed methodology will serve as a model for the computational structural biology of all GPCRs.
1. Introduction
G(TP-binding) protein-coupled receptors (GPCRs) are a superfamily of membrane-bound proteins that enable cells to interact with the external extracellular environment. At the cellular level, they allow cells to communicate with each other and to respond to environmental changes (Hamm, 1998). At the physiological level, they also provide the basic mechanisms responsible for peripheral sensory modalities such as odor, taste, vision, and pain (Buck and Axel, 1991; Dong et al., 2001). Among such receptors, olfactory receptors (ORs) comprise the largest number of individual proteins in the family of GPCRs and constitute the majority of GPCR diversity found in mammalian genomes (Glusman et al., 2001; Zozulya et al., 2001; Gilad and Lancet, 2003; Niimura and Nei, 2003). Therefore, ORs make good model systems for developing techniques applicable across the entire GPCR proteome.
The binding of various exogenous small molecules to olfactory receptors is believed to trigger conformational changes in the protein that induce signal transduction leading to olfaction. These presumed interactions (or the lack thereof) also have clinical implications. Olfactory dysfunction at a younger age are often predictors of certain neurodegenerative disorders (Elian, 1991; Murofushi et al., 1991; Westervelt et al., 1997; Mesholam et al., 1998).
Unlike many other GPCRs however, an individual olfactory receptor may be activated by many different odorants and the same odorant molecule may activate many different ORs (Malnic et al., 1999). The study of the intermolecular interactions between the set of odorants and the ORs in which they activate is crucial to understanding the basis for such promiscuous molecular discrimination.
Molecular dynamics techniques have been used to study ligand-GPCR interactions in opsins (LemaÎtre et al., 2005), cholecystokinin-1 receptor (Hénin et al., 2006), β2-adrenergic receptor (Huber et al., 2008; Niesen et al., 2011; Vanni et al., 2011), and even computationally derived opioid receptor models (Zhang et al., 2005). We published the first molecular dynamics study for rat OR I7 (Lai et al., 2005). ORs must be modeled prior to performing any in silico simulations because experimentally determined structures of the proteins do not yet exist. Because ligand binding and interaction with receptors physically and physiologically occurs in the context of thermodynamically regulated motion, going beyond “static” models and docking is essential to studying these interactions. Continuing advances in the availability of computational resources allows all-atom simulations to be conducted at hundreds of nanosecond scale using affordable amounts of computer time.
We introduce here a computational protocol which we have developed for an experimentally characterized human olfactory receptor hOR 17-209 (aliases hOR17-8; OR1G1; GENBANK Accession Number AAF37317.1; Matarazzo et al., 2002), that can be easily extended to (at least) Class A (rhodopsin-like) GPCRs. This methodology includes: creation of a computational model of an olfactory receptors, computational binding of an odorant ligand into the binding region of the receptor, creating the membrane environment of the olfactory receptor and simulating the OR-odorant interactions using molecular dynamics methods. Figure 1 gives a flow diagram of the procedure.
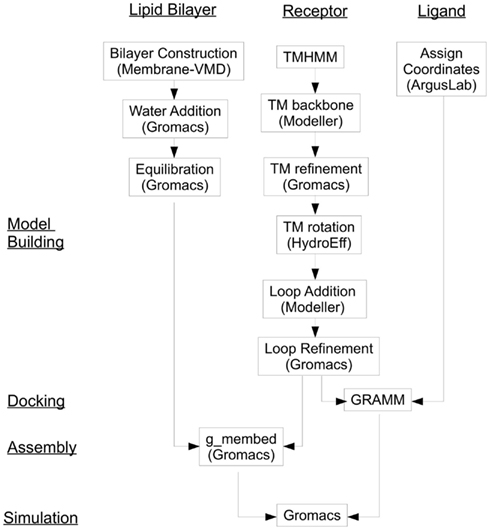
Figure 1. OR and GPCR end-to-end modeling and simulation flow diagram.
2. Methods
2.1. Model Construction and Parameterization
2.1.1. Secondary structure prediction
The current state-of-the-art transmembrane region (TM) prediction algorithms incorporate the use of Hidden Markov Models (HMMs). The following HMM-based TM predictors are publicly available: TMHMM1 (Krogh et al., 2001) and HMMTOP2 (Tusnady and Simon, 2001), and have been identified to be the best predictors over ten other programs (Möller et al., 2001). The final assignments of helical structure to the primary receptor amino acid sequence are based on the outputs of TMHMM, there being no significant differences in the transmembrane predictions between TMHMM and HMMTOP. Figure 2 shows the selected predicted TM sequences in hOR 17-209. A defining feature of ORs and other rhodopsin-like GPCRs is the universally conserved E/DRY motif at the intracellular side of TM3 which known to participate in G-protein interaction during the beginning of the signal transduction sequence following ligand binding (Rovati et al., 2007). The TM prediction correctly places the middle of this motif (MAYDCY in hOR17-209) at the intracellular interface.
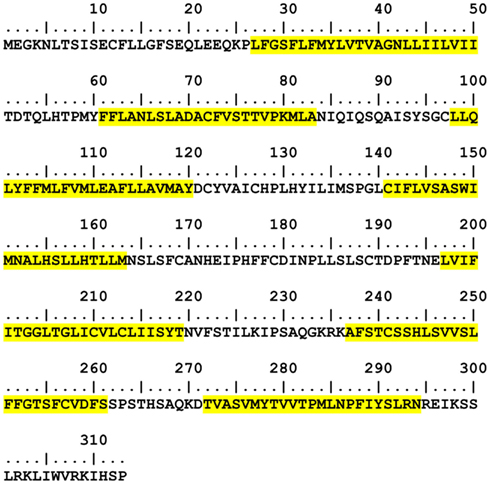
Figure 2. hOR17-209 TM prediction results from TMHMM. Predicted locations and lengths of transmembrane helices are highlighted in yellow. The non-highlighted regions are modeled as free-standing loops.
2.1.2. Structural alignment and coordinate assignment
Once the TM regions have been determined, initial atomic coordinates of the resulting helices are assigned through the use of Modeler3 (Eswar et al., 2006). As ORs are classified as rhodopsin-like GPCRs, the bovine rhodopsin template is used (PDB: 1U19) in order to establish the positioning of the helices in the helical bundle (Singer, 2000). However, since hOR17-209 only shares 50% sequence (with many ORs showing even less) similarity with rhodopsin (Matarazzo et al., 2005), a simple sequential alignment cannot be performed. Furthermore, ORs sequences have long been predicted to have shorter TM regions and longer extra- and intracellular loops compared to rhodopsin (Otaki and Firestein, 2001). Finally, to avoid biasing the modeled TMs with rhodopsin-centric features, such as the orthogonal intracellular helix found in TM 7 in rhodopsin, which does not appear to be in ORs, a positional structural alignment based on the previously performed TM prediction is conducted. The centers of masses of the predicted TM regions are aligned to the center of mass of each resolved TM in the rhodopsin model. This ensures that the continuous helicity of each TM is kept intact in the resulting receptor model as well. Figure 3 shows the alignment of hOR17-209 with the rhodopsin template to be input into Modeler.
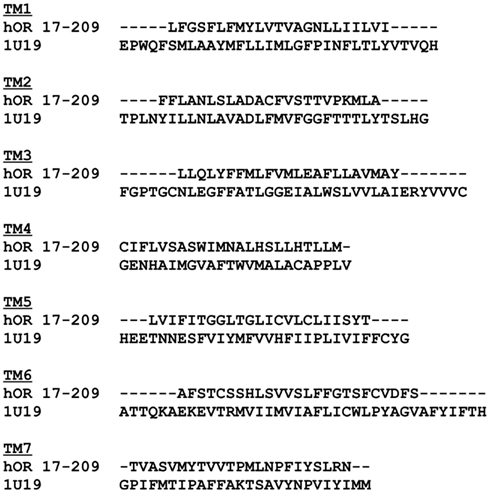
Figure 3. hOR17-209 TM prediction results and structural alignments against the TMs in Bovine Rhodopsin (PDB: 1U19).
By default, Modeler passes generated structures through a series of simulated annealing stages which will tend to denature the TMs if position restraints are not used. Because restrained all-atom molecular dynamics in a suitable solvent environment will be used to refine the model later, and Modeler is only intended to be used here to assign the TM positions, automodel.make(exit_stage = 2) is used to ensure that only the initial coordinates are generated without further pertubation of the TMs. At this point, the individual TMs retain all of the rhodopsin-specific characteristics, which need to be removed. Earlier modeling protocols, such as Singer’s (2000), began with constructing canonical helics, but Modeler is useful for easily maintaining the correct helical bundle assembly tertiary structure. The goal of this alignment is to preliminarily identify inter-helical distances and angles, without committing structure specific artifacts of rhodopsin to eventual computational OR model.
2.1.3. TM refinement and minimization
The initial TM structures produced by Modeler (as described above) are the result of overlaying the existing positions of the backbone/alpha-carbon atoms of rhodopsin and substituting the side-chains with those found in the olfactory receptor TM sequences through extrapolation. The GROMACS 4.54 (Hess et al., 2008) molecular dynamics package is next used to refine the initial TM structures so that the side-chains can be relaxed and any remaining rhodopsin-specific features are compensated for (such as the proline-induced “kink” in TM6 that does not occur in ORs). The TM is first parameterized with neutral termini using a cross-term energy correction map (CMAP) dihedral-corrected CHARMM27 force field (and 1 charge group per atom), then solvated in a 3-point model (TIPS3P) water box. Distance restraints are applied between the backbone O and i + 4 backbone N, with r0 = 0.28 nm, r1 = 0.30 nm and r2 = 0.31 nm. The restraint force constant used is the default 1000 kJ/mol/nm2. This enforces the canonical hydrogen bonding distances found in α-helices (Arora and Jayaram, 1996). Steepest-descent energy minimization conducted with a convergence tolerance of 102 kJ/mol/nm for each TM. The waters are removed once the TM secondary structures have been minimized.
2.1.4. TM rotation
Because only a structural and not sequential alignment was used to construct the TMs where the center of masses of the TMs in the rhodopsin template were used, the matter of hydrophobic packing of the helical bundle needs to be addressed. The secondary structure alignment does not guarantee that the hydrophobic moment of each TM along its long-axis is oriented in the correct direction as observed in GPCRs. The Hydro-Eff® tool5 is used to calculate a consensus aggregate hydrophobic moment Θθ for each TM according to the following equation:
where μθ is the point hydrophobicity of the residue found at the angle θ when the sequence of the TM is projected onto a helical wheel (Crasto, 2010). The sequences input into Hydro-Eff® consists of the majority of each TM, but the two residues closest to both ends of each TM sequence are to be omitted when determining the hydrophobicity moment using Hydro-Eff®, as they tend to exhibit a more dynamic conformation from their proximity to the TM-loop interface, and a different residue-per-turn count can alter their positions on the idealized helical wheel used in the calculation.
The TM is rotated along its median long-axis as determined from the center of the helix to orient the residue-angle representing the minimum or maximum hydrophobicity so it is pointed in the correct direction; the residue representing the lowest hydrophobic moment is directed toward the hydrophilic center of the bundle. The TMs are rotated through vector manipulation using the VMD computational modeling and visualization software6 (Humphrey et al., 1996) so that they meet the vector directions determined through Hydro-Eff.
2.1.5. Loop addition
After the TMs have been rotated, the intracellular and extracellular loops are added. The much longer loops do not align well to the much shorter loops in rhodopsin, so the loops are modeled by excising everything from the rhodopsin templates except the N- and C-termini, and “gapping out” the Modeler alignments accordingly.
Again, automodel.make(exit_stage = 2) is used to ensure that only the initial coordinates are generated, since the TM regions have been semi-finalized previously. This typically results in long-dangling or discontinuous loop regions.
The entire molecule is reparameterized in GROMACS in preparation for another round of energy minimization. The N- and C-termini are parameterized to be charged. It is here that the conserved disulfide bridge observed in GPCRs between the first and second extracellular loops (EL1-EL2; Fredriksson et al., 2003) is parameterized. For hOR17-209, this disulfide bridge appears between CYS 97 and CYS 179. All TM alpha carbons are frozen while the entire receptor is now minimized in another TIPS3P box with the appropriate counterions added. This ensures that the existing helicity remains intact but allows side-chains and loops to relax. Using large cutoffs (up to 10 nm depending on the distance between the dangling loop end and the TM to which it needs to be connected) allows the bonds to resolve and reconnect the loops to the TMs.
During the reparameterization, the protonation states of any histidine residues are resolved by visually estimating their solvent accessibility or inter-helical contact distances, and also considering the presence of any π-stacking in the TMs (Schlegel et al., 2005). When the individual TMs are being minimized and refined, π-stacking is first evaluated as the only histidine interactions during that stage are intrahelical; the nitrogen pair that is protonated is selected randomly. After helix-rotation, the TM histidine nitrogens closest to the center of the binding pocket are protonated. Loop histidines are usually randomly selected to be protonated. In the case of histidines in OR 17-209, all epsilon nitrogens were protonated.
2.1.6. Membrane bilayer construction
Next, an appropriate lipid bilayer and solvent system for running the all-atom simulation reflecting a fully dynamic membrane have to be constructed. A 1-palmitoyl-2-oleoyl-sn-glycero-3-phosphatidylcholine (POPC) bilayer is appropriate for simulating mammalian cell membrane systems. Such a bilayer can be constructed using the Membrane plugin distributed with VMD. An initial bilayer area of approximately 9.5 nm × 9.5 nm allows the receptor to fit with sufficient buffer zones to alleviate any artifacts from periodic boundary condition (PBC). Adding enough TIPS3P water to the top and bottom of the bilayer to result in an initial 12 nm box height is sufficient to solvate the intra- and extracellular loops and to shield them from their PBC images. A single POPC molecule is parameterized using a CHARMM36 force field conversion for GROMACS7. The resulting system, which consists of around 238 lipids is then equilibrated for at least 50 ns at 310K and 1 atm under NPT ensemble with anisotropic pressure coupling or until the area per lipid converges close to the consensus value of around 63–65 Å per headgroup (Klauda et al., 2010). The GROMACS molecular dynamics parameters are discussed below. The area per lipid calculations are done using GridMAT-MD8 (Allen et al., 2009). Another metric for confirming that equilibrium has been reached in the bilayer is to wait until the moving averages of the box dimensions (box-x/y and box-z) have stabilized (the initial box quickly compresses under pressure as the long acyl chains adopt relaxed conformations at temperature). Once the bilayer is equilibrated, the resulting coordinates can subsequently used for any other rhodopsin-like GPCR simulation without having to construct it again.
2.1.7. Ligand construction
Atom coordinates for various ligand structures were constructed using ArgusLab9. They are parameterized using a conversion of the CHARMM36 Generalized Force field (CGenFF; Vanommeslaeghe et al., 2010) to GROMACS. Because the ligand-receptor interaction is intermolecular, there is good interoperability between the protein/lipid/water system using CHARMM27/36 and the ligand using CGenFF as intermolecular interactions between the atoms of both parameter sets have not changed.
2.2. Docking
Because subsequent molecular dynamics techniques will be used to explore the receptor-ligand interaction and conformation domain, a low-resolution and low-intensity solvent accessible and volume-fitting search can be used to select an initial docked position for the ligand using a tool such as a GRAMM10 (Vakser, 1996). We have observed that removing the loops prior to docking allows the program to perform a better search of the solvent accessible spaces within the inter-helical bundle.
The docking results are screened visually (using a visualization program such as VMD, excluding non-physiological results, such as all intracellular docking conformations and ligands that are associating with loops but far away from the TM bundle. Simulation candidates are then chosen from the largest conformation clusters. Figure 4 shows hOR17-209 with the primary cluster of its docked activating ligand, isoamyl acetate, situated between TMs 1, 2, 3, and 7. A single conformation close to the center of mass of the cluster is selected for subsequent molecular dynamics simulation.
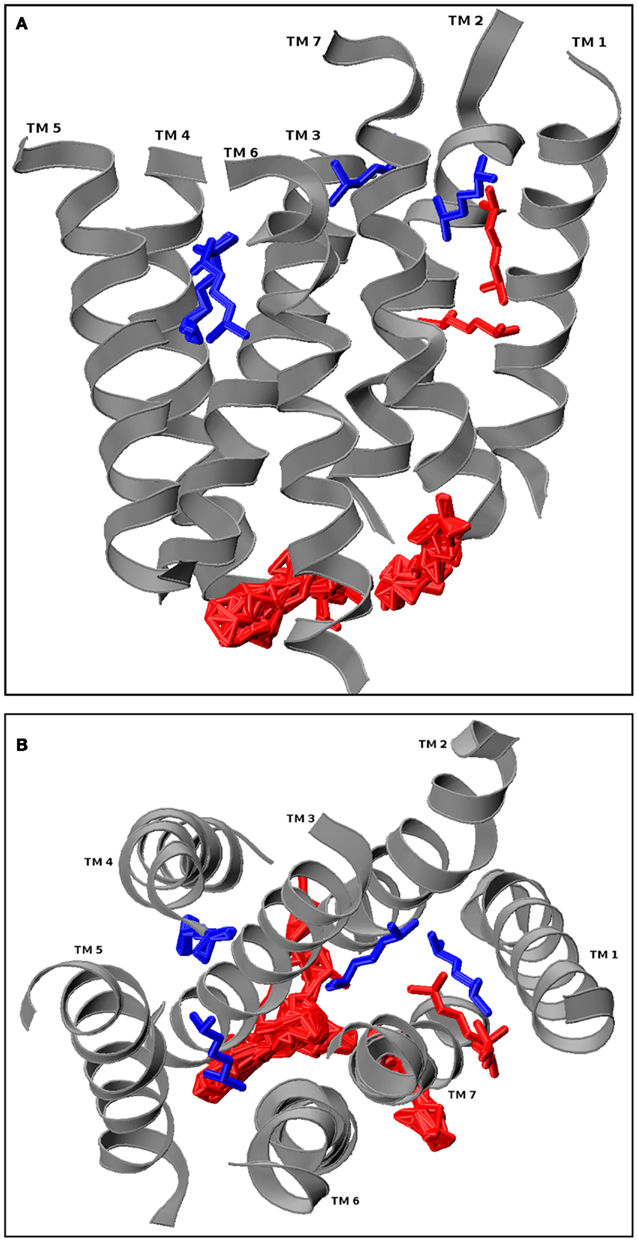
Figure 4. hOR17-209 docked with its activating ligand, isopentyl acetate using GRAMM. The loops from the receptor model were removed prior to docking, and GRAMM was configured to provide 100 docked conformations. The physiologically relevant (extracellular and within the hydrophilic core) clusters are shown in blue and the discarded conformations are shown in red. One conformation from the blue cluster is selected for molecular dynamics simulation. (A) Longitudinal view. (B) Extracellular cross-section view.
2.3. Receptor-membrane Integration
The entire minimized receptor structure is rotated and translated into an appropriate position within the equilibrated membrane bilayer. Either the GROMACS editconf tool or VMD can be used to do this. Because the length of the TMs are close to the thickness of the bilayer the resulting placement of the receptor within the bilayer is fairly symmetrical along the long-axis of the TM (z-axis), so there is no special consideration necessary to determine any z-axis offset between the protein and the bilayer, as compared to other membrane proteins (Ulmschneider et al., 2006). The receptor is oriented to the lipid’s z-axis to maximize the exposure of TMs to the lipid environment. This can be done using the editconf tool in Gromacs. It aligns the center of mass of the TM bundle to the Z-axis and then to center the TM bundle in the x/y plane. Any inaccuracies will be resolved by lipid bilayer repacking during equilibration.
After the bilayer coordinates are appended to the transformed receptor coordinates, g_membed (Wolf et al., 2010) is used to embed the protein into the bilayer, which will remove overlapping lipids and water molecules, as well as perform a short MD run to restore the protein dimensions back to unity scale and repack the lipids. g_membed can be adjusted so that the number of lipids removed is kept at a minimum, in particular by using the -zinit option, which stretches the initial z-axis length of the protein so long loops can clear the membrane region. In the case of hOR17-209, we have applied a -zinit factor of 1.1, stretching the initial z-axis of the protein by 10%, which resulted in the lowest number of lipids removed as compared to the default factor of 1.0 or a increased factor of 1.2. For the hOR 17-209 case, the resulting complex system revolves around the receptor, 230 lipids, 21468 waters, 2 sodium counterions, and 1 isoamyl acetate ligand, totaling 100199 particles per periodic cell.
2.4. Molecular Dynamics
The receptor-lipid-water complex, with or without the ligand is further equilibrated. The addition of ligands may require that the counterions be adjusted and the entire complex needs to be energy minimized again with the TM alpha carbons frozen. The g_membed tool has already performed some lipid repacking, so a shorter equilibration run of 10 ns is sufficient to allow for resetting the thermostat (resulting from any modifications to the complex system such as adding or removing atoms) and further packing refinement. Final area per lipid calculations can also be conducted to ensure equilibrium has been reached. Position restraints are applied to the TM alpha carbons with a force constant of 1000–10000 kJ/mol/nm in each direction to preserve the helical bundle and allow the lipids to pack around it. The ligand is similarly restrained during this equilibration which is carried out at 310K and 1 atm in NPT ensemble with the choice of thermostat and barostat determined by a combination that will not lead to divergence, such as velocity rescaling (V-rescale) thermostats and Berendsen pressure coupling. For CHARMM force fields operating in GROMACS, the appropriate cutoffs while using Partial Mesh Ewald (PME) electrostatics are: rlist = 1.2, rcoulomb = 1.2, rvdw = 1.2, vdwtype = switch, rvdw_switch = 0.8. The default PME order of 4 and fourierspacing of 0.16 are kept. The pressure coupling mode is set to semi-isotropic due to the asymmetry of the lipid bilayer-solvent box. The lipid, protein, and solvent (or solvent + lipid) are thermodynamically un-coupled from each other to avoid the “cold solvent, hot solute” problem (Lingenheil et al., 2008; Mor et al., 2008).
Using GROMACS necessitates center of mass motion (COM) “corrections,” particularly while employing periodic boundary conditions. It is typical to use COM correction on the entire system in a globular protein-solvent system. While the use of separate centers of masses between the protein-lipid complex and the solvent mass (COM = protein_lipid solvent) may prevent bilayer “tearing,” where the solvent layer separates from the lipid layer on the xy-plane, this has not been observed to happen with ORs, possibly because the loops are long enough to stabilize the lipid-water interface. In GPCRs with longer helices, extensions past the membrane region should also perform a similar stabilization role. It preferable to avoid the introduction of artificial corrections which may lead to artifacts, so COM can be set to System for OR simulations.
In production MD, the checkpoint file, which contains the atom velocities and system state from the end of the equilibration is used as input and the restraints are removed. The Nose-Hoover thermostat and Parinello-Raman barostat are used. Production simulation runs can configured to run between 1 to over 10 or more nanoseconds.
3. Results
Matarazzo et al. (2005) experimentally showed that human olfactory receptor hOR 17-209 (OR1G1) is activated by mix of esters, including a strong response to 3-methylbut-1-yl ethanoate (isoamyl acetate). A model of hOR 1109 was created using ArgusLab and inserted into a 238 molecule POPC bilayer according to the methods described. A high scoring docked conformation from GRAMM was selected for further molecular dynamics study. The initial placement of the ligand is the central blue one shown in Figure 4, where it is positioned between TMs 1, 2, 3, and 7.
Ten ns of production MD was performed after the 10-ns of post-docking restrained equilibration; thus the loops underwent a total of 20 ns unstrained MD. An unbound receptor also underwent 10 ns of production MD. Figure 5 depicts a top and side view of the hydrated hOR17-209 isoamylacetate system with surrounding lipid bilayer. Figure 6 shows the energy convergence of the two systems. Compared to the equilibration portion of the simulation, the energies of both the ligand-bound and unbound simulations show a marked decrease in total drift. For example, in the ligand-bound system, the total energy drift during equilibration was −2291 kJ/mol, but across the entire production simulation of the second 10 ns, the drift was reduced to −790 kJ/mol. When the energy drift is measured across the final 5 ns of the simulation the energy drift drops to −194 kJ/mol. This evidence suggests the energy of the system stabilizes through the entire production portion of the simulation.
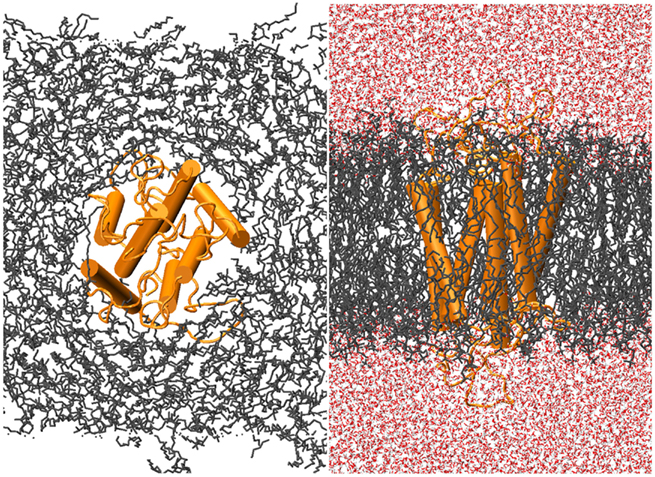
Figure 5. hOR17-209 is embedded into the lipid bilayer-solvent complex with g_membed. The receptor, lipids, and waters are colored orange, gray, and red, respectively.
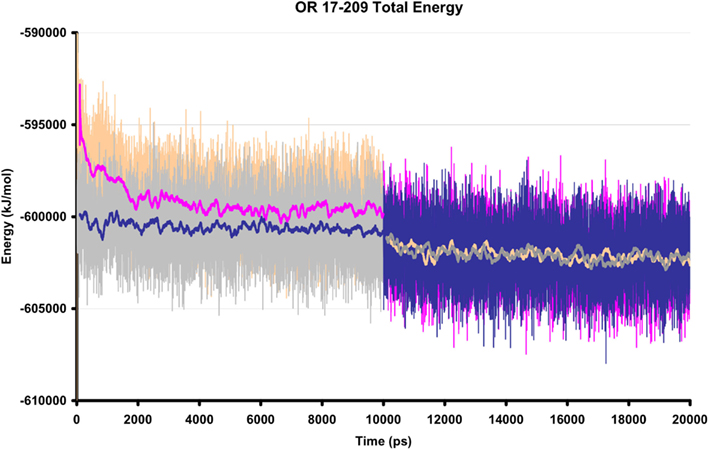
Figure 6. The total energy of two hOR 17-209 simulation systems, with and without docked ligand. The orange/pink regions show the total energy of the ligand-bound system and the gray/blue regions reflect the total energy of the unbound system during equilibration (first 10 ns) and production MD (final 10 ns). The solid lines are 200 ps moving averages. During production MD, no significant fluctuations are observed in the energy profiles.
The primary behavior of note throughout the trajectory is the migration of the ligand from its starting position and crossing over into another binding region bounded by TMs 3-6. The ligand sampled this space for approximately 2 ns after which it returned to settle in the region bounded by TMs 1, 2, and 7 for the remainder of the simulation. The transition period between the two conformation clusters is very rapid, on the order of 100 ps. Such “exit events” were observed in earlier, more primitive simulations with the I7 olfactory receptor (Lai et al., 2005).
A minimum-distance contacts analysis was performed of the trajectory of the bound receptor. This measurement selects a side-chain atom in the receptor which satisfies the closest distance between the carbonyl oxygen of the ligand with the receptor around a 6-Å maximum radius of the carbonyl at every timestep of the simulation as a “contact” during that timestep. The average “contact” distance between the carbonyl oxygen and a heavy atom of the receptor was 3.7 Å, and the minimum “contact” distance was 2.6 Å. Each contact corresponding to a residue made along the trajectory was tabulated. This allows a quantitative observation of the number of interacting residues which are closest to the ligand during the simulation. The top “contacts” and their contact counts per residue are found in Table 1. Graphically, the “contact” frequency can be illustrated in the receptor by the size of the residue representation in Figure 7. This figure further illustrates the sampling of the two clusters of binding conformations between isoamyl acetate and hOR 17-209. While the majority of interactions appears to be relatively non-polar, of some interest is some interactions in the “second” binding pocket which are with residues in the long EL2 extracellular loop that is forced to “dip” into the region bounded by TMs 3-7 due to the conserved disulfide bridge. While there are no explicit ionic residues with which the ligand interacts, there are still some slightly polar residues which may be involved: N182 and T279 enter within long-range electrostatic distance of the ligand carbonyl group when the ligand samples that region. The phenylalanine and other non-polar residues on both boundaries of the binding regions may help serve to stabilize the hydrocarbon tail of the odorant through Van der Waals interactions.

Table 1. Number of times a side-chain atom from the listed residue has been the minimum-distance from the carbonyl oxygen of isoamyl acetate, as compared to all other receptor atoms, during the simulation.
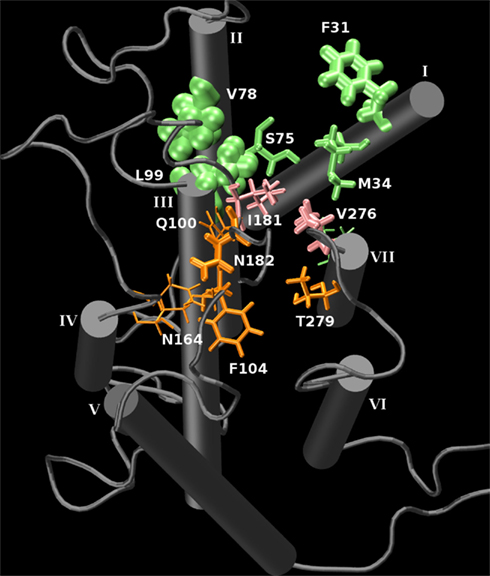
Figure 7. A graphical representation of the interaction frequency between the carbonyl oxygen of isoamyl acetate and hOR 17-209 through 10 ns of MD. Green represents the primary binding pocket and orange represents a second binding pocket which is sampled by the ligand for 2 ns. Pink residues line the saddle point between the two regions. The larger the residue’s appearance, the higher the interaction frequency. The N- and C-termini were removed for clarity.
Data captured from molecular dynamics simulations can help to develop mechanistic explanations for ligand binding, recognition, and receptor activation supported by experimental observations; as well as assist in focusing testable hypotheses and variable options for the further experimental study of particular ORs and GPCRs.
4. Discussion
We have developed a comprehensive modeling and advanced simulation protocol designed to study olfactory receptor-odor interactions which is also fully applicable to other class A GPCRs. Despite a significant lack of sequence similarity to rhodopsin, olfactory receptors and other rhodopsin-like GPCRs all share the following features: seven α-helix transmembrane regions arranged in a distinct barrel shaped tertiary structure with solvent accessible hydrophilic core and the E/DRY G-protein interaction motif at the intracellular loop interface of TM 3. In this section, the various choices of methodology throughout the simulation pipeline is rationalized.
The lack of experimentally resolved structures for all but three GPCRs leads to the requirement of modeling our receptors using rhodopsin as the template. The use of bovine rhodopsin as a template is sufficient for the purposes of assigning the initial helix structures and assembling the TM bundle. While the more recently resolved GPCR structures such as the β2-adrenergic or adenosine A2A receptors can also be used as co-templates (Tebben and Schnur, 2010), it should be noted that these latter structures were refined with the substantial use of molecular replacement methods using rhodopsin as a structural template for resolving the areas lacking sufficient original electron-density detail from the X-ray diffraction studies performed on their crystal structures (Jaakola et al., 2008; Warne et al., 2008). We have previously observed (Lai et al., 2005) that even the construction of idealized canonical helices arranged along a low-resolution (>6 Å) electron-diffraction map of rhodopsin (Singer, 2000) is well matched against much higher resolution rhodopsin X-ray structures. Using Modeler with a high-resolution rhodopsin template is an easier way to generate the α-helix structures and inter-helix positioning information.
Since the construction of the helices themselves are not dependent on the sequence alignment to rhodopsin (or other GPCR template), but rather, the spatial-structure alignment as shown in Figure 3, the resulting helices may not be oriented to satisfy the hydrophobic interaction with the side of the helix that will eventually be in contact with the lipid bilayer. Thus, the helix must be rotated around its long-axis to satisfy this requirement. To determine the correct hydrophobic moment on which to base this rotation, we developed a tool called Hydro-Eff. Hydro-Eff requires minimal computational resources to calculate the correct helix orientation. The Hydro-Eff system has been validated with the known structures of bovine rhodopsin, β2-adrenergic, and adenosine A2A receptors (Crasto, 2010). Hydro-Eff correctly determines the orientation angle of each TM in all three characterized structures, when the first and last two residues at the ends of each predicted TMs are omitted from the Θθ calculations. Since Hydro-Eff starts with an idealized matrix, the positioning of the residues at the helix-loop junctions do not meet idealized helical distance and angle restraints.
Other than the conserved cysteine bridge located between the end of EL1 and middle of EL2, loop structure and behavior among GPCRs appear to be diverse, even among the three known GPCR structures. Through all stages of the workflow, from model refinement to final equilibration, the loop regions not predicted to be involved in TM structure are allowed to move freely in explicit solvent and adopt their preferred conformations in a physiologically relevant thermodynamic ensemble. This continuous sampling enables the assessment of potential ligand-loop interactions regardless of initial loop conformation.
A CHARMM-based force field in conjunction with the GROMACS 4.5 molecular dynamics package were used at different stages of the described protocol that called for energy minimization, geometry optimization, and full dynamics simulation. CHARMM22/27/36 supports lipids and proteins; CHARMM27 with CMAP dihedral angle corrections are also appropriate for “helix-heavy” structures such as GPCRs. CHARMM36 lipids have been revised to not require the extra use of surface tension parameterization. CGenFF, the general force field designed for drug-like molecules, is appropriate for use in parameterizing the small molecules interacting with the receptor. Because the intermolecular interactions are derived from CHARMM22/27/36, no coupling corrections are needed when interoperating with CHARMM22 proteins and CHARMM36 lipids; the only differences are with intramolecular 1-4 Van der Waals interactions. GROMACS 4.5 has incorporated explicit support for CHARMM-specific parameters, such as multiple dihedral types. The conversion of CHARMM.prm files to GROMACS.itp files are straightforward. In addition, GROMACS supports the CHARMM variant of TIP3P water, TIPS3P, which recognizes additional Van der Waals interactions involving hydrogens and affects bilayer simulations with CHARMM lipids. Finally, GROMACS 4.5 was also selected for its good parallel performance across large computational clusters, the customizability of the simulation parameters, and its open-source license.
Molecular dynamics enables the ligand to explore the entire conformation space, both intra- and intermolecularly. Thus, there is no need to rely on a computationally intensive extensive search of ligand rotamer libraries along with intermolecular interaction energy surface searches. GRAMM is easy to setup, uses a unified atom model, does not require external charge assignments or tools (other than to create the initial ligand coordinates), and grid or sphere generation, but still provides a satisfactory solvent accessible space and volumetric search with the option to include electrostatic interaction terms. The downloadable version11 supports small molecule docking.
Table 1 illustrates the significant advantages of dynamic simulations of protein ligand interactions versus relying on the results of static docking. From static docking, i.e., following energy minimization of the OR-odor system surrounded by the bilayer and water molecules, we identified ten amino acid residues that were within 6 Å of any atom of the ligand. These are: VAL74, LEU99, GLN100, LEU101, PHE103, PHE104, PHE107, VAL276, THR279, and VAL280. These residues are from the TMs 1, 2, 3, and 7. The results of the dynamic simulations presented in Table 1 identify not only the residues that are likely to bind isoamyl acetate over the course of the simulation, but also quantify these interactions by determining the time spent in a 6-Å radius around the odorant. The residues in Table 1 are listed in decreasing order of the time spent in the vicinity of the odorant and form a more complete picture of the residues participating in binding and ligand interaction.
Conclusion
This study, with the methodological details presented here, can be considered the second in a four step process. The first step involves the functional experimental analysis of an olfactory receptor. The results of this analysis results in the identification of the odorant ligand that elicits an excitatory or inhibitory response from the olfactory receptor. However, mechanistically, this process remains a black box. It is left up to computational analysis to provide a mechanistic basis of this interaction. Our results we will hope will foster additional experimental analysis, for example, performing mutations of amino acid residues that we have shown are likely to interact with the odorant ligand. Validation of the hypotheses for OR-odorant interactions will lead to high throughput computational analysis which will resulting in our increased understanding of the first of several steps eventually leading to the perception of an odorant.
The study of GPCRs is hampered by the lack of detailed, experimentally determined structures. Olfactory receptors make good candidates for platforms on which to design GPCR modeling and simulation systems: they are incredibly diverse and their structure-function relationships affect their interaction with small molecule ligands responsible for the mammalian olfactory repertoire. The same sequence-to-structure molecular simulation techniques presented in this paper, which seek to extend model studies beyond a single docked ligand conformation to further elucidate what happens to the receptor before, during, and after ligand binding are applicable to other rhodopsin-like GPCRs.
Conflict of Interest Statement
The authors declare that the research was conducted in the absence of any commercial or financial relationships that could be construed as a potential conflict of interest.
Acknowledgments
The authors gratefully recognize the support for this work from grant 1R21DC011068 (National Institute on Deafness and Other Communication Disorders, National Institutes of Health).
Footnotes
- ^http://www.cbs.dtu.dk/services/TMHMM/
- ^http://www.enzim.hu/hmmtop
- ^http://salilab.org/modeller/
- ^http://www.gromacs.org
- ^http://bioinfo.genetics.uab.edu/hydro-eff.pl
- ^http://www.ks.uiuc.edu/Research/vmd
- ^http://www.gromacs.org/Downloads/User_contributions/Force_fields
- ^http://www.bevanlab.biochem.vt.edu/GridMAT-MD/
- ^http://www.arguslab.com/arguslab.com/ArgusLab.html
- ^http://vakser.bioinformatics.ku.edu/main/resources_gramm1.03.php
- ^http://vakser.bioinformatics.ku.edu/main/resources_gramm1.03.download.php
References
Allen, W. J., Lemkul, J. A., and Bevan, D. R. (2009). Gridmat-md: a grid-based membrane analysis tool for use with molecular dynamics. J. Comput. Chem. 30, 1952–1958.
Arora, N., and Jayaram, B. (1996). Strength of hydrogen bonds in α helices. J. Comput. Chem. 18, 1245–1252.
Buck, L., and Axel, R. (1991). A novel multigene family may encode odorant receptors: a molecular basis for odor recognition. Cell 65, 175–187.
Crasto, C. (2010). Hydrophobicity profiles in G protein-coupled receptor transmembrane helical domains. J. Receptor Ligand Channel Res. 3, 123–133.
Dong, X., Han, S. K., Zylka, M. J., Simon, M. I., and Anderson, D. J. (2001). A diverse family of GPCRs expressed in specific subsets of nociceptive sensory neurons. Cell 106, 619–632.
Elian, M. (1991). Olfactory impairment in motor neuron disease: a pilot study. J. Neurol. Neurosurg. Psychiatr. 54, 927–928.
Eswar, N., Marti-Renom, M. A., Webb, B., Madhusudhan, M. S., Eramian, D., Shen, M., Pieper, U., and Sali, A. (2006). Comparative protein structure modeling with modeller. Curr. Protoc. Bioinformatics 15, 5.6.1–5.6.30.
Fredriksson, R., Lagerström, M. C., Lundin, L.-G., and Schiöth, H. B. (2003). The G-protein-coupled receptors in the human genome form five main families. Phylogenetic analysis, paralogon groups, and fingerprints. Mol. Pharmacol. 63, 1256–1272.
Gilad, Y., and Lancet, D. (2003). Population differences in the human functional olfactory repertoire. Mol. Biol. Evol. 20, 307–314.
Glusman, G., Yanai, I., Rubin, I., and Lancet, D. (2001). The complete human olfactory subgenome. Genome Res. 11, 685–702.
Hénin, J., Maigret, B., Tarek, M., Escrieut, C., Fourmy, D., and Chipot, C. (2006). Probing a model of a gpcr/ligand complex in an explicit membrane environment: the human cholecystokinin-1 receptor. Biophys. J. 90, 1232–1240.
Hess, B., Kutzner, C., van der Spoel, D., and Lindahl, E. (2008). Gromacs 4: algorithms for highly efficient, load-balanced, and scalable molecular simulation. J. Chem. Theory Comput. 4, 435–447.
Huber, T., Menon, S., and Sakmar, T. P. (2008). Structural basis for ligand binding and specificity in adrenergic receptors: implications for GPCR-targeted drug discovery. Biochemistry 47, 11013–11023.
Humphrey, W., Dalke, A., and Schulten, K. (1996). VMD – visual molecular dynamics. J. Mol. Graph. 14, 33–38.
Jaakola, V. P., Griffith, M. T., Hanson, M. A., Cherezov, V., Chien, E. Y. T., Lane, J. R., Ijzerman, A. P., and Stevens, R. C. (2008). The 2.6 angstrom crystal structure of a human a2a adenosine receptor bound to an antagonist. Science 322, 1211–1217.
Klauda, J. B., Venable, R. M., Freites, J. A., O’Connor, J. W., Tobias, D. J., Mondragon-Ramirez, C., Vorobyov, I., MacKerell, A. D. Jr., and Pastor, R. W. (2010). Update of the CHARMM all-atom additive force field for lipids: validation on six lipid types. J. Phys. Chem. B 114, 7830–7843.
Krogh, A., Larsson, B., von Heijne, G., and Sonnhammer, E. L. L. (2001). Predicting transmembrane protein topology with a hidden Markov model: application to complete genomes. J. Mol. Biol. 305, 567–580.
Lai, P. C., Singer, M. S., and Crasto, C. J. (2005). Structural activation pathways from dynamic olfactory receptor-odorant interactions. Chem. Senses 30, 781–792.
LemaÎtre, V., Yeagle, P., and Watts, A. (2005). Molecular dynamics simulations of retinal in rhodopsin: from the dark-adapted state towards lumirhodopsin. Biochemistry 44, 12667–12680.
Lingenheil, M., Denschlag, R., Reichold, R., and Tavan, P. (2008). The hot-solvent/cold-solute problem revisited. J. Chem. Theory Comput. 4, 1293–1306.
Malnic, B., Hirono, J., Sato, T., and Buck, L. B. (1999). Combinatorial receptor codes for odors. Cell 96, 712–723.
Matarazzo, V., Clot-Faybesse, O., Marcet, B., Guiraudie-Capraz, G., Atanasova, B., Devauchelle, G., Cerutti, M., Etiévant, P., and Ronin, C. (2005). Functional characterization of two human olfactory receptors expressed in the baculovirus Sf9 insect cell system. Chem. Senses 30, 195–207.
Matarazzo, V., Zsürger, N., Guillemot, J. C., Clot-Faybesse, O., Botto, J. M., Dal Farra, C., Crowe, M., Demaille, J., Vincent, J. P., Mazella, J., and Ronin, C. (2002). Porcine odorant-binding protein selectively binds to a human olfactory receptor. Chem. Senses 27, 691–701.
Mesholam, R. I., Moberg, P. J., Mahr, R. N., and Doty, R. L. (1998). Olfaction in neurodegenerative disease: a meta-analysis of olfactory functioning in Alzheimer’s and Parkinson’s diseases. Arch. Neurol. 55, 85–90.
Möller, S., Croning, M. D. R., and Apweiler, R. (2001). Evaluation of methods for the prediction of membrane spanning regions. Bioinformatics 17, 646–653.
Mor, A., Ziv, G., and Levy, Y. (2008). Simulations of proteins with inhomogeneous degrees of freedom: the effect of thermostats. J. Comput. Chem. 29, 1992–1998.
Murofushi, T., Mizuno, M., Osanai, R., and Hayashida, T. (1991). Olfactory dysfunction in Parkinson’s disease. ORL J. Otorhinolaryngol. Relat. Spec. 53, 143–146.
Niesen, M. J. M., Bhattacharya, S., and Vaidehi, N. (2011). The role of conformational ensembles in ligand recognition in G-protein coupled receptors. J. Am. Chem. Soc. 133, 13197–13204.
Niimura, Y., and Nei, M. (2003). Evolution of olfactory receptor genes in the human genome. Proc. Natl. Acad. Sci. U.S.A. 100, 12235–12240.
Otaki, J. M., and Firestein, S. (2001). Length analyses of mammalian G-protein coupled receptors. J. Theor. Biol. 211, 315–327.
Rovati, G. E., Capra, V., and Neubig, R. R. (2007). The highly conserved dry motif of class a G protein-coupled receptors: beyond the ground state. Mol. Pharmacol. 71, 959–964.
Schlegel, B., Sippl, W., and Holtje, H. D. (2005). Molecular dynamics simulations of bovine rhodopsin: influence of protonation states and different membrane-mimicking environments. J. Mol. Model. 12, 49–64.
Singer, M. S. (2000). Analysis of the molecular basis for octanal interactions in the expressed rat 17 olfactory receptor. Chem. Senses 25, 155–165.
Tebben, A. J., and Schnur, D. M. (2010). Beyond rhodopsin: G protein-coupled receptor structure and modeling incorporating the beta2-adrenergic and adenosine a(2a) crystal structures. Methods Mol. Biol. 672, 359–386.
Tusnady, G. E., and Simon, I. (2001). The HMMTOP transmembrane topology prediction server. Bioinformatics 17, 849–850.
Ulmschneider, M. B., Sansom, M. S. P., and Di Nola, A. (2006). Evaluating tilt angles of membrane-associated helices: comparison of computational and NMR techniques. Biophys. J. 90, 1650–1660.
Vakser, I. A. (1996). Low-resolution docking: prediction of complexes for underdetermined structures. Biopolymers 39, 455–464.
Vanni, S., Neri, M., Tavernelli, I., and Rothlisberger, U. (2011). Predicting novel binding modes of agonists to β adrenergic receptors using all-atom molecular dynamics simulations. PLoS Comput. Biol. 7, e1001053. doi:10.1371/journal.pcbi.1001053
Vanommeslaeghe, K., Hatcher, E., Acharya, C., Kundu, S., Zhong, S., Shim, J., Darian, E., Guvench, O., Lopes, P., Vorobyov, I., and MacKerell, A. D. Jr. (2010). Charmm general force field: a force field for drug-like molecules compatible with the CHARMM all-atom additive biological force fields. J. Comput. Chem. 31, 671–690.
Warne, T., Serrano-Vega, M. J., Baker, J. G., Moukhametzianov, R., Edwards, P. C., Henderson, R., Leslie, A. G., Tate, C. G., and Schertler, G. F. (2008). Structure of a beta1-adrenergic G-protein-coupled receptor. Nature 454, 486–491.
Westervelt, H. J., McCaffrey, R. J., Cousins, J. P., Wagle, W. A., and Haase, R. F. (1997). Longitudinal analysis of olfactory deficits in HIV infection. Arch. Clin. Neuropsychol. 12, 5557–5565.
Wolf, M. G., Hoefling, M., Aponte-Santamaria, C., Grubmüller, H., and Groenhof, G. (2010). g_membed: Efficient insertion of a membrane protein into an equilibrated lipid bilayer with minimal perturbation. J. Comput. Chem. 31, 2169–2174.
Zhang, Y., Sham, Y. Y., Rajamani, R., Gao, J., and Portoghese, P. S. (2005). Homology modeling and molecular dynamics simulations of the mu opioid receptor in a membrane-aqueous system. Chembiochem 6, 853–859.
Keywords: GPCR, olfactory receptor, molecular dynamics, ligand binding, lipid bilayer, protein modeling
Citation: Lai PC and Crasto CJ (2012) Beyond modeling: all-atom olfactory receptor model simulations. Front. Gene. 3:61. doi: 10.3389/fgene.2012.00061
Received: 30 December 2011; Accepted: 30 March 2012;
Published online: 03 May 2012.
Edited by:
Fengfeng Zhou, Shenzhen Institutes of Advanced Technology, ChinaReviewed by:
Franca Fraternali, King’s College London, UKXiaoqin Huang, University of Kentucky, USA
Xiuru Li, The University of Georgia, USA
Copyright: © 2012 Lai and Crasto. This is an open-access article distributed under the terms of the Creative Commons Attribution Non Commercial License, which permits non-commercial use, distribution, and reproduction in other forums, provided the original authors and source are credited.
*Correspondence: Chiquito J. Crasto, Division of Research, Department of Genetics, University of Alabama at Birmingham, Kaul 752A, 1530 3RD Avenue South, Birmingham, AL 35294-1150, USA. e-mail:Y2hpcXVpdG9AdWFiLmVkdQ==