- 1 Institute of Statistical Science, Academia Sinica, Taipei, Taiwan
- 2 Department of Statistics, National Cheng-Chi University, Taipei, Taiwan
- 3 Institute of Biomedical Engineering, National Taiwan University, Taipei, Taiwan
Genetic/transcriptional regulatory interactions are shown to predict partial components of signaling pathways, which have been recognized as vital to complex human diseases. Both activator (A) and repressor (R) are known to coregulate their common target gene (T). Xu et al. (2002) proposed to model this coregulation by a fixed second order response surface (called the RS algorithm), in which T is a function of A, R, and AR. Unfortunately, the RS algorithm did not result in a sufficient number of genetic interactions (GIs) when it was applied to a group of 51 yeast genes in a pilot study. Thus, we propose a data-driven second order model (DDSOM), an approximation to the non-linear transcriptional interactions, to infer genetic and transcriptional regulatory interactions. For each triplet of genes of interest (A, R, and T), we regress the expression of T at time t + 1 on the expression of A, R, and AR at time t. Next, these well-fitted regression models (viewed as points in R3) are collected, and the center of these points is used to identify triples of genes having the A-R-T relationship or GIs. The DDSOM and RS algorithms are first compared on inferring transcriptional compensation interactions of a group of yeast genes in DNA synthesis and DNA repair using microarray gene expression data; the DDSOM algorithm results in higher modified true positive rate (about 75%) than that of the RS algorithm, checked against quantitative RT-polymerase chain reaction results. These validated GIs are reported, among which some coincide with certain interactions in DNA repair and genome instability pathways in yeast. This suggests that the DDSOM algorithm has potential to predict pathway components. Further, both algorithms are applied to predict transcriptional regulatory interactions of 63 yeast genes. Checked against the known transcriptional regulatory interactions queried from TRANSFAC, the proposed also performs better than the RS algorithm.
Introduction
Inferring networks of genetic interactions (GIs) from microarray data is one of the challenging tasks in the area of functional genomics. If the reconstruction is reliable, it will provide useful information relatively inexpensively. An inferred genetic network predicts how a given gene interacts with the other genes. A type of important GIs is synthetic sick or lethal interaction (SSL) in yeast (Hartman et al., 2001; Tong et al., 2001), which is defined as double mutations in genes resulting in sickness or lethality while each single mutation does not. Here predicting transcriptional compensation (TC; Kafri et al., 2005) and transcriptional diminishment (TD) interactions (Chuang et al., 2008; Shieh et al., 2008) from a pair of SSL genes is of interest. Given a SSL or paralog gene pair, following a gene’s loss, its partner gene’s expression increases; this phenomenon is known as TC. Quantitative RT-polymerase chain reaction (qRT-PCR) experiments (in Appendix) show that besides TC, in some cases following a gene’s absence, its partner gene’s expression decreased; we call this phenomenon TD. TC/TD interactions among a group of 51 yeast genes, involved in DNA synthesis and DNA repair, is of interest to our collaborator, and this motivates us to develop this algorithm.
Recently, GIs in yeast have been shown to be consistent with some components of existing DNA repair or genome instability pathways (Chuang et al., 2008; Shieh et al., 2008). Because GIs derived from yeast may be conserved in humans (Boone et al., 2007), predicted GIs in yeast may shed light on pathways of complex human diseases, such as cancer. It has been gradually elucidated that pathways, rather than individual genes, control tumorigenesis (Vogelstein and Kinzler, 2004). For instance, altered components of certain signal transduction pathways have been shown to be involved in colorectal, breast, and lung cancer (Wood et al., 2007; Ding et al., 2008), and these components may be potential therapeutic targets. Thus, inferring genetic networks, once successful, would have an impact on molecular medicine.
With the abundant sets of microarray gene expression data (MGED) now available, inferring genetic/transcriptional interactions has become feasible, and various approaches have been proposed. Most of the approaches may be classified into three classes: graphical models, discrete variable models, and continuous variable models. Due to space constraints, here we limit our review on continuous variable models that are directly relevant to the proposed; see Shieh et al. (2008) for reviews of models from other classes. The relationship of a target gene and its activator and repressor is known to be non-linear (Wray et al., 2003). However, for simplicity, Chen et al. (2005) used linear stochastic differential equation model to approximate these non-linear relationship, and Zhang and Horvath (2005) introduced “co-expression concept” to reconstruct gene networks. To approximate non-linear regulation of an activator and a repressor on their common target gene, Woolf and Wang (2000) applied some fuzzy functions using gene expression data, which included a standard heuristic process of fuzzification, decision making, and defuzzification. However, the idea of applying a fuzzy logic method to the area was novel. The RS algorithm in Xu et al. (2002) improved the fuzzy logic approach by using a continuous regulatory influence (Eq. 1 below) that had biological bearings.
Specifically, Xu et al. (2002) fitted triplets of activator, repressor, and target genes (A, R, T) into a fixed second order response surface as follows.
This RS approach captures the principle that the effect of A (R) is positive (negative) and the resulting expression level of the target gene falls in the interval [0, 1], provided that the expression level of both A and R are from [0, 1] (personal communication with Xu). This A-R-T response surface does depict the biological relationship of A, R, and T, in which a highly expressed activator and a lowly expressed repressor result in high-expression of their target gene, and the regulation is a continuous function of A and R. However, the surface in Eq. 1 is merely one of many surfaces which satisfy the aforementioned biological relationship of A, R, and T. Moreover, when we fitted the alpha data set in Spellman et al. (1998; NCBI GEO accession number: GSE 22) to infer GIs of interest, this response surface did not yield a sufficient amount of GIs. This suggests that the response surface which most triples of genes (GIs) are close to may vary with data sets, and this surface should be identified by a relevant data set. These motivate us to develop a data-driven approach, which is called data-driven second order model (DDSOM).
The proposed approach has been implemented on gene pairs that have indirect interactions such as TC. For ease of description, we use direct interaction activator-target (AT) and repressor-target (RT) to denote TD and TC, respectively. We propose that the GI patterns result from the majority of fitted second order models which describe a biological A, R, and T relationship. Namely, the mode surface results from well-fitted models, and those AT and RT gene pairs close to this mode surface will be used to predict TD and TC interactions, respectively. Furthermore, a time lag is incorporated in the model to describe a period required for a target gene to respond to the regulation of its activator and/or repressor. Note that this time lag in a predicted network also suggests the ordering of gene products (proteins) in DNA repair/genome instability pathways as shown in Section “Application 1: Genetic Networks of the 51 Yeast Genes Involved in DNA Synthesis and DNA Repair.”
Both the DDSOM and RS algorithm are applied to cDNA microarray data (Spellman et al., 1998) to infer TC/TD interactions of yeast genes involved in DNA synthesis and DNA repair. The prediction accuracies of these algorithms are checked against qRT-PCR experiment and compared. Importantly, some of the GIs predicted by DDSOM coincide with existing DNA repair pathway of yeast in the literature. This suggests that DDSOM can infer meaningful GIs, and it may be used to infer biochemical pathways as well. In addition, DDSOM has been compared to the RS algorithm using a microarray data set in Spellman et al. (1998) to predict transcriptional regulatory interactions (TIs) of 63 yeast genes, and their performances have been checked against the known TIs queried from TRANSFAC (Matys et al., 2003).
Materials and Methods
In this section, we introduce some data pre-processing methods and the proposed algorithm for inferring genetic networks. When A and R are highly correlated, the DDSOM algorithm is not applicable due to the collinearity problem. Thus these cases are excluded; see the flowchart in Figure1 for an outline of the DDSOM algorithm.
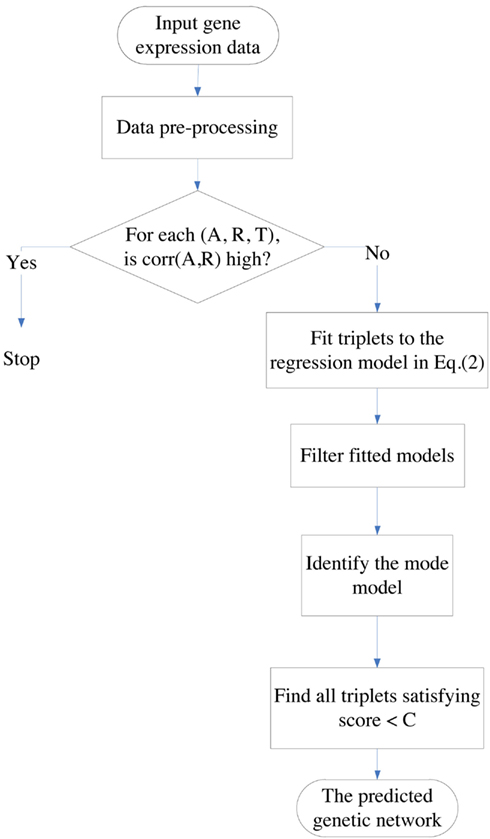
Figure 1. The flowchart of the DDSOM algorithm. Triplets in which A and R are not highly correlated are fitted to the second order model via regression to approximate the non-linear A-R-T relationship. A network is reconstructed by triplets which are close to the mode surface in terms of small Score values.
Gene Expression Data Sets
There are three sets of data synchronized by using alpha pheromone (the alpha data set) or temperature sensitive mutation (cdc15 and cdc28) in Spellman et al. (1998). However, some of the 51 genes of interest had high levels of missing data (50–100%) in cdc15 and cdc28 data sets. Imputation of those heavily missing data might be problematic, thus we used the alpha data set in which only one gene had about 20% missing data across time. Log ratios of red to green channel intensities of cDNA microarray were taken, where the red (green) channel intensities were gene expression (mRNA) levels of synchronized (non-synchronized) yeast cells. Let Ri(t) and Gi(t) be the red and green intensity of gene i at experiment t. The data used were normalized by Spellman et al. (1998) such that for a fixed i, namely For details, we refer to the yeast cell cycle project of the Stanford Genome database (http://genome-www.stanford.edu).
Data Imputation
To impute missing data, we applied the k-means clustering to 6056 genes, and treated each missing cell as the centroid of each cluster. Next, we grouped genes that had correlation, computed from other non-missing data, with the centroid across time (rT) greater than 0.7 into one cluster, where and For a fixed time t, each missing value of the centroid was imputed by the average of the top-10 or fewer (if fewer than 10 existed in the cluster) correlated genes.
Transformation
To compare the proposed DDSOM with the response surface algorithm (Xu et al., 2002), we transformed the log ratios of gene expression levels into the interval [0, 1].
One Cell Cycle Data Used
There may be more contamination in data near the beginning of the microarray experiment (right after the yeast cells have been washed by a buffer following treatment with the alpha-factor) and toward the end of the experiment (after one and half cell cycles, yeast cells may not be that synchronized). Since the proposed model is of order two, we used data from only one cell cycle whose expression curve is in general close to a parabola. Specifically, we used microarray data measured from the 21st to 77th minutes, which corresponded to the first and second peaks of gene expression curves for genes having clear cell cycle trends. We note that each microarray experiment in the alpha data set was done in 7 min apart, thus one cell cycle was about 56 min. Both one cell cycle set and the full (two cell cycle) set of alpha data were fitted in a pilot study. As expected, the one cell cycle set fitted the proposed model better than the full set in terms of better goodness-of-fit (higher R2).
Data-Driven A-R-T Models
To obtain the surface that the majority of triplets (A, R, T) satisfy, we first fitted each triplet to the following second order model via regression.
where 1 ≤ i ≤ n, β1 > 0, β2 < 0, and β3 are unknown parameters to be estimated from data. Note that this second order regression model is an approximation to the underlying non-linear interaction between A (R) and T (Chen et al., 2010). The lag-1 in time of Eq. 2 has the following biological bearings. Because MGED measure the concentration of mRNA, this time lag describes the period of time required by mRNAs of gene A(R) (assumed to be the same) to translate into protein a(r), then the protein a(r) activates (repress) its target gene T. An A-R-T relationship, with T expressing at a time behind A and R, is depicted by the three genes in Figure 2, in which the curves of R and T are roughly antisimilar (converse) to each other whereas T’s curve is roughly similar to A’s curve. A few RT-PCR confirmed TD and TC gene pairs also showed patterns similar to AT and RT in Figure 2, which justified this A-R-T model.
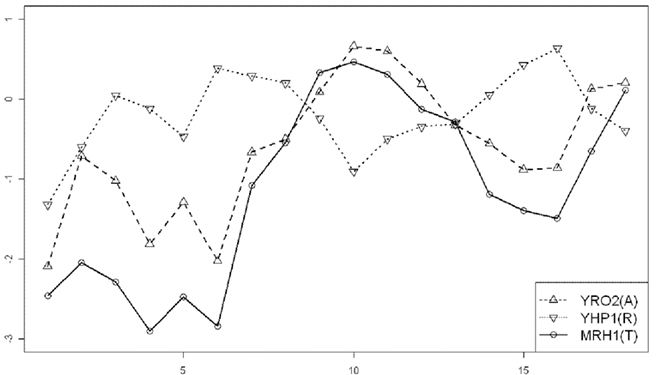
Figure 2. A graph that shows the relationship of activator-repressor-target displayed by three genes (YRO2–YHP1–MRH1) using time course microarray data of the alpha set. The x-axis is the time points, and the y-axis is log-transformed (base 2) gene expression levels of the triplet.
Next, we propose that the mode model (surface) should result from the majority (in geometry the center) of well-fitted models. Specific procedures are stated in the following.
The Mode Surface
For triplets in which the correlation of A and R is not too high (including most of cases in real world), e.g., less than 0.8, the proposed approach is applicable. Fitting one cell cycle microarray data, e.g., the 4th to the 12th time points, of each given triplet to the model in Eq. 2, we obtained in total n(n − 1)(n − 2) fitted models where i = 1, …, n(n − 1)(n − 2) and n was the number of genes. Among them, the goodness-of-fit criterion R2 > C1 and all p-values of ’s , for example C1 = 0.7 and C2 = 0.2, were used to select well-fitted models. Because this was an initial selection and all four estimates were required to be significant, we used a relaxed threshold, e.g., 0.20, for all p-values to include a sufficient amount of triplets. However, both thresholds in the criterion can be adjusted by users. For instance, when there are few triplets satisfying the criteria, one can loosen the threshold for C2 or both thresholds.
To gain insight into identifying the mode surface, we demonstrate a case in R3. Triplets of 51 genes involved in DNA synthesis and DNA repair in yeast were fitted to the model in Eq. 2, and all models with satisfying the criterion that R2 > 0.85 and p-values of for i = 1, 2, and 3 were kept. These 571 fitted models (denoted by +) and the models fitted by the RS algorithm using Eq. 1 (denoted by o) are plotted in Figure 3, in which the center of points (namely the mode surface) seems closer to the cluster of points (the majority of well-fitted models) than Xu’s model (denoted by o). This justifies our data-driven approach.
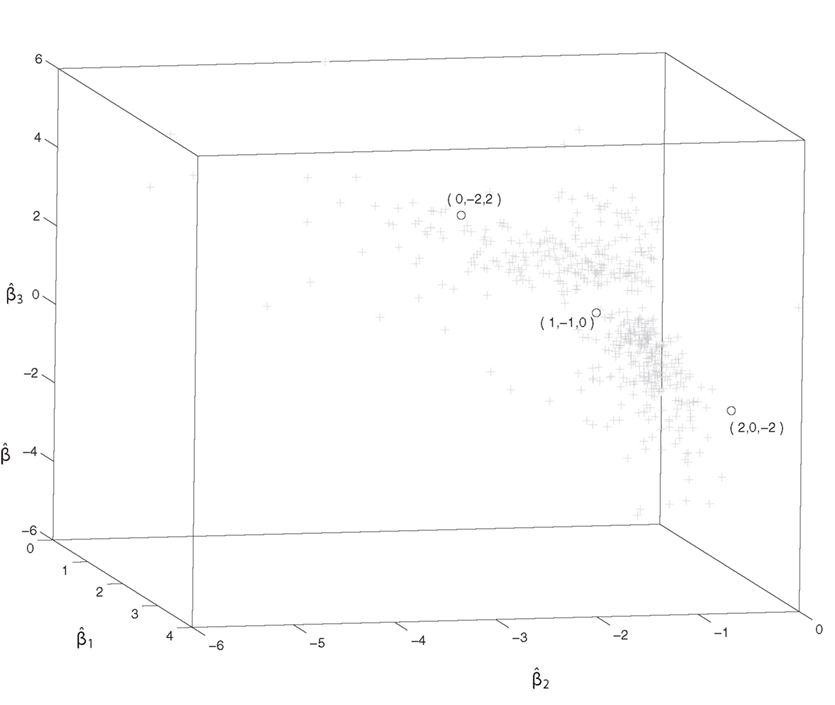
Figure 3. The estimated regression coefficients of models fitted well to Eq. 2 and the three surfaces of Xu’s model, denoted by + and o, respectively. This graph depicts that the surfaces of Xu’s model are far away from the center of the + cluster.
For all models (surfaces) that passed the goodness-of-fit criterion, Silverman’s rule was applied to identify the mode surface. Treating ’s as points in R4, we partitioned them by Silverman’s rule, which partitioned each coordinate proportional to the number of data and their noise (SE) for a fixed dimension d. Silverman’s rule identifies the mode (densest place) of a group of high dimensional points (Scott, 1992), and the formula to compute the partition number for each coordinate is
where si and IQRi denote the SE and interquantile range of data in coordinate i, and d is the dimension of the points. Note that the mode surface is determined by the majority of fitted models, which depend on gene expression profiles, thus this approach can be applied to any time course microarray data set.
Predicted Genetic Networks
After the mode surface is identified, some measures to select triplets close to the mode surface are applied. If a given triplet (A, R, T) fits the mode surface well, then the predicted target gene value should be close to the observed value T, and this would result in a small lack-of-fit score. This can be captured by the lack-of-fit score in Xu et al. (2002), which assumes the form
where is the average of Tt across all time points T0. If there is one or more outliers in the time course data of a gene, then its lack-of-fit score with and without the outlier(s) will deviate greatly. This rationale is depicted in the diagnostic function (Xu et al., 2002)
where LF(t) (A, R, T) denotes the lack-of-fit score of (A, R, T) with tth sample deleted. A large Diag(A, R, T) value also suggests the triplet may not fit the mode surface well. Therefore, a reasonable criterion for a triplet being close to the mode surface should be a function of LF(A, R, T) and Diag, but with an emphasis on LF(A, R, T). An overall measure of good fitting is the score function in Xu et al. (2002), where
This score is adopted in the DDSOM algorithm which outputs all triplets that satisfy Score < C, where C is a constant specified by users. Based on these triplets, a predicted gene network can be reconstructed.
Results
Application 1: Genetic Networks of the 51 Yeast Genes Involved in DNA Synthesis and DNA Repair
In this section, we apply DDSOM and the RS algorithm to infer GIs of 51 yeast genes involved in DNA synthesis and DNA repair (in Figure 3 of Tong et al., 2001). TC/TD interactions of these genes which are SSL to SGS1 or RAD27 are of interest, and the predicted interactions may shed light on the buffering mechanism of these genes in yeast cells at molecular level. SGS1 (RAD27) has homologs in human cells including WRN, BLM, and RECQ4 (FEN1 and ERCC5) genes. Mutations in these genes lead to cancer-predisposition syndromes, premature aging, and Cockayne syndrome (Tong et al., 2001, 2004; NCBI OMIM database).
Data in one cell cycle (the 4th to the 12th time points) of the alpha set (Spellman et al., 1998) of all 51 genes were fitted to DDSOM. Specifically, the model in Eq. 2 was fitted, and 544 quadruplets satisfied the criterion
These 544 quadruplets were partitioned by Silverman’s rule (Scott, 1992), 11 × 16 × 25 × 18, which led to the following mode surface
To infer novel TC/TD interactions, we set the Score in Eq. 5 to 0.30, which yielded 83 triplets. Of these 83 triplets, 21 pairs overlapped with the qRT-PCR experiments conducted by our collaborator; see qRT-PCT in Appendix for a description of the experiment. Let A → B denote that the expression of B decreases when A is mutant comparing to that of B when A is wild type in our collaborator’s qRT-PCR experiment (implying A and B have TD), and A ⊣ B denotes that the expression of B increases when A is mutant (implying A and B have TC). Note that the prediction A → C resulting from A → B and B → C as well as from A ⊣ B and B ⊣ C were also considered. Likewise, both A ⊣ B and B → C, and A → B and B ⊣ C led to A ⊣ C. We call these predictions A → B and A → C the first and second layer predictions, respectively. Counting the predictions of both layers together, 15 from 21 pairs were correctly predicted. Namely, the modified true positive rate (mTPR), the ratio of the correctly predicted interactions over the intersection of the predicted and the qRT-PCR results, equaled 15 out of 21 pairs (71%). A network of these 15 pairs of interactions is plotted in Figure 4. Note that if we only consider the first layer predictions, the mTPR is 77% (10 out of 13 pairs). Most p-values of these predicted TC and TD gene pairs are significant, among which seven (10) pairs are smaller than 0.05 (0.20). For a group of 70 genes, the CPU time of the DDSOM algorithm is about 38 min, using a PC with Pentium 3.0 GHz and RAM 1.0 GB.
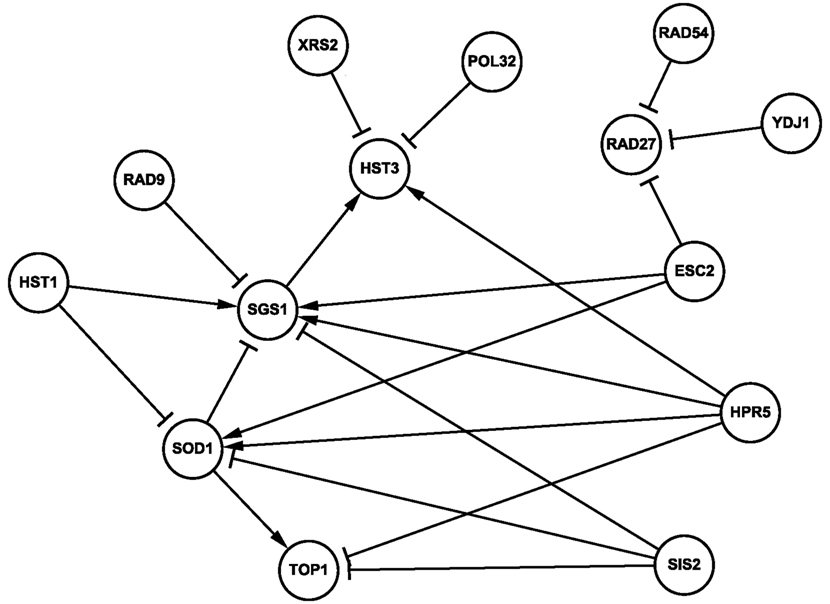
Figure 4. A genetic network inferred by the DDSOM algorithm using one cell cycle data from the alpha set. In particular, triplets with Score < 0.30 which were also intersected with qRT-PCR results are showed, where ⊣ (→) denotes TC (TD) interaction, respectively. Solid (dashed) lines are predicted correctly (incorrectly).
Data-driven second order model successfully predicted TC/TD interactions of SGS1 and RAD27 with genes involved in checkpoint arrest (e.g., RAD9), DNA repair (e.g., RAD9, RAD54), DNA replication (e.g., TOP1), and chromosome structure (e.g., ESC2). Among the 15 correctly predicted interactions, the following are consistent with existing pathways in literature queried from databases such as iHOP (Hoffman and Valencia, 2004). Rad9 and Sgs1 are found to interact genetically and possibly physically (Ooi et al., 2003). Cells lacking Sgs1 frequently arrest as large-budded cells with a single nucleus in the mother cell, or “stuck” between mother and daughter cells, which result in missegregation during mitosis (McVey et al., 2001; Lo et al., 2006). Esc2 and Sgs1 act in functionally distinct branches of the homologous recombination repair pathway in S. cerevisiae (Mankouri et al., 2009). SOD1 is a superoxide dismutase that prevents free-radical mediated DNA or protein damage while TOP1 relaxes negatively supercoiled DNA and releases torsion stress created by DNA transcription. RAD27 and RAD54 are SSL, and this pair is conserved in humans. Importantly, it was reported recently that RAD54B-deficient human colorectal cancer cells were killed by FEN1 (the human homolog of RAD27) silencing (McManus et al., 2009). In particular, SOD1 is involved in the removal of superoxide radical pathway, and SIS2 participates in pantothenate and coenzyme A biosynthesis pathway. The correctly predicted 15 pairs are as follows. ESC2 ⊣ RAD27, ESC2 → SGS1, ESC2 ⊣ SOD1, HPR5 → SOD1, HST1 ⊣ SOD1, HST1 ⊣ TOP1, POL32 ⊣ HST3, RAD9 ⊣ SGS1, RAD54 ⊣ RAD27, SOD1 ⊣ SGS1, SIS2 ⊣ SOD1, SOD1 → TOP1, SIS2 ⊣ TOP1, XRS2 ⊣ HST3, and YDJ1 ⊣ RAD27.
As a comparison, we also applied the RS algorithm in Xu et al. (2002) to these 51 genes, and the mTPR was about 53% (23 out of 43 pairs). These 23 predicted pairs were centered on RAD27, HST3, and TOP1. Note that we also fitted triplets of 51 genes to Eq. 2 with no time lag, which resulted in more predicted triplets than using Eq. 2 with a time lag. However, the TCs and TDs verified by RT-PCR experiments do require a time lag.
Application 2: Transcriptional Regulatory Network of 63 Yeast Genes
We further applied the DDSOM and the RS algorithm to 63 yeast genes, to infer their transcriptional regulatory network, which were checked by the TIs of these genes queried from TRANSFAC (Matys et al., 2003). Again, one cell cycle (the 4th to the 12th) gene expression data of the alpha set in Spellman et al. (1998) was used.
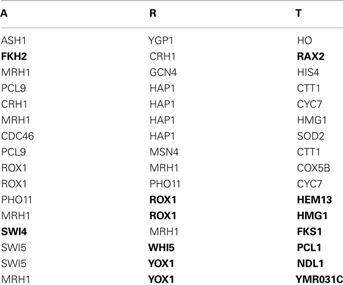
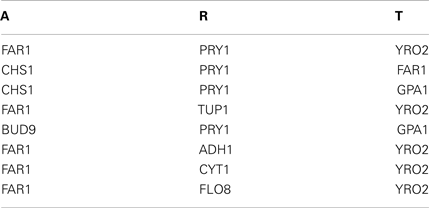
Similar to Section “Application 1: Genetic Networks of the 51 Yeast Genes Involved in DNA Synthesis and DNA Repair,” Silverman’s partition was applied in DDSOM; among the gene pairs which had Score < 0.3, 16 pairs overlapped with the known TIs from TRANSFAC, and seven pairs were predicted correctly. On the other hand, the RS algorithm predicted eight pairs with Score < 0.3, but none of them was overlapped with the known TIs. The transcriptional network reconstructed by all correctly predicted gene pairs is in Figure 5. The list of 63 genes and the predicted triplets (by DDSOM) which were intersected with known TIs are in Section “Application 2: The list of 63 Gene Names” in Appendix.
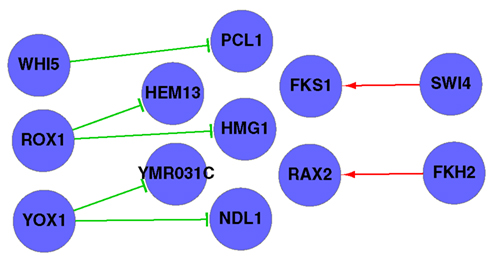
Figure 5. A transcriptional regulatory network predicted by the DDSOM algorithm using one cell cycle data from the alpha set. The network is reconstructed by all correctly predicted gene pairs checked against known transcriptional interactions from TRANSFAC. The sign → (⊣) denotes AT (RT) interaction.
Discussion
As shown in the two applications, the proposed DDSOM algorithm infers both genetic and transcriptional regulatory networks from time course gene expression data better than the RS algorithm. The resulting mode surface of DDSOM is identified by the majority of models fitted well by gene expression data, thus it can be applied to any data set. Importantly, some predicted TC/TD interactions are experimentally validated, and they are shown to coincide with certain components in existing pathways in the literature, which suggest that DDSOM can predict meaningful GIs, and has potential to infer partial components in biochemical pathways.
A Rule of Thumb for Applying DDSOM
When choosing the constants in the criterion R2 > C1 and p-values of four our experience suggests that users start with moderate values of C1 and C2 to include sufficient numbers of triplets, so Silverman’s partition can yield a mode surface with several A-R-T triplets nearby. Similarly, the constant for Score can be specified by users such that a few dozen to 100 or more triplets are predicted. For instance, criterion R2 > 0.8 and p-values of resulted in 1284 triplets, among which 85 triplets had Score < 0.3, and 6 out of 10 predicted TC/TDs were consistent with the qRT-PCR results; these GIs were centered on SGS1.
The CPU time of DDSOM is proportional to n3, thus reconstructing a network of 200 genes will take about 15 h using a PC with Pentium 3.0 GHz and RAM 1.0 GB. For a large network, e.g., the 4000 yeast GIs in Tong et al. (2004), one can use SSL interactions (e.g., links in Figure 3 of Tong et al., 2001) to partition them into a few smaller subgroups, which can be inferred separately but linked together via genes having SSL interactions in the final step. Although DDSOM can infer gene networks of interest with reasonable accuracy, there is still room for improvement. In molecular biology, multiple transcription factors and cofactors do regulate their targets cooperatively or synergistically. For instance, both Gcn4 and Gln3 are required to activate ARG4 (Harbison et al., 2004). The proposed approach is ready to capture regulations of A1 and A2 on T or A1, A2, and R2 on T. This may be applied to trigenic SSLs when more experimentally verified trigenic interactions are available. Furthermore, the model in Eq. 2 can be extended easily to capture co-regulations of transcription factors and microRNAs on their target genes. Recently, incorporating motif information, ChIP-chip, and microarray data, to predict transcriptional regulatory networks has been explored (Li and Zhan, 2008; Chuang et al., 2009). Nevertheless, integrating multiple types of data to predict GIs remains challenging. We leave this for future work.
Conflict of Interest Statement
The authors declare that the research was conducted in the absence of any commercial or financial relationships that could be construed as a potential conflict of interest.
Acknowledgments
We are indebted to Drs. Ting-Fang Wang and Dah-Yeou Huang at the Institute of Molecular Biology, Academia Sinica for providing the qRT-PCR results. We thank Dr. Ming-Yen Cheng for constructive discussion, and Chin-Yuan Guo, Jia-Hong Wu, and Ping-Heng Hsieh for computational assistance. This research was supported in part by the National Science Council grant 92-2118-M001-023 and 100-2118-M001-003-MY2, and Academia Sinica Thematic grant 91-3112-P001-037 to Grace S. Shieh.
References
Boone, C., Bussey, H., and Andrews, B. J. (2007). Exploring genetic interactions and networks with yeast. Nat. Rev. Genet. 8, 437–449.
Chen, C. M., Lee, C., Chuang, C. L., Wang, C. C., and Shieh, G. S. (2010). Inferring genetic interactions via a nonlinear model and an optimization algorithm. BMC Syst. Biol. 4, 16.
Chen, K. C., Wang, T. Y., Tseng, H. H., Huang, C. Y., and Kao, C. Y. (2005). A stochastic differential equation model for quantifying transcriptional regulatory network in Saccharomyces cerevisiae. Bioinformatics 21, 2883–2890.
Chuang, C. L., Hung, K., Chen, C. M., and Shieh, G. S. (2009). Uncovering transcriptional interactions via an adaptive fuzzy logic approach. BMC Bioinformatics 10, 400.
Chuang, C. L., Jen, C. H., Chen, C. M., and Shieh, G. S. (2008). A pattern recognition approach to infer time-lagged genetic interactions. Bioinformatics 24, 1183–1190.
Ding, L., Getz, G., Wheeler, D. A., Mardis, E. R., McLellan, M. D., Cibulskis, K., Sougnez, C., Greulich, H., Muzny, D. M., Morgan, M. B., Fulton, L., Fulton, R. S., Zhang, Q., Wendl, M. C., Lawrence, M. S., Larson, D. E., Chen, K., Dooling, D. J., Sabo, A., Hawes, A. C., Shen, H., Jhangiani, S. N., Lewis, L. R., Hall, O., Zhu, Y., Mathew, T., Ren, Y., Yao, J., Scherer, S. E., Clerc, K., Metcalf, G. A., Ng, B., Milosavljevic, A., Gonzalez-Garay, M. L., Osborne, J. R., Meyer, R., Shi, X., Tang, Y., Koboldt, D. C., Lin, L., Abbott, R., Miner, T. L., Pohl, C., Fewell, G., Haipek, C., Schmidt, H., Dunford-Shore, B. H., Kraja, A., Crosby, S. D., Sawyer, C. S., Vickery, T., Sander, S., Robinson, J., Winckler, W., Baldwin, J., Chirieac, L. R., Dutt, A., Fennell, T., Hanna, M., Johnson, B. E., Onofrio, R. C., Thomas, R. K., Tonon, G., Weir, B. A., Zhao, X., Ziaugra, L., Zody, M. C., Giordano, T., Orringer, M. B., Roth, J. A., Spitz, M. R., Wistuba, I. I., Ozenberger, B., Good, P. J., Chang, A. C., Beer, D. G., Watson, M. A., Ladanyi, M., Broderick, S., Yoshizawa, A., Travis, W. D., Pao, W., Province, M. A., Weinstock, G. M., Varmus, H. E., Gabriel, S. B., Lander, E. S., Gibbs, R. A., Meyerson, M., and Wilson, R. K. (2008). Somatic mutations affect key pathways in lung adenocarcinoma. Nature 455, 1069–1075.
Harbison, C. T., Gordon, D. B., Lee, T. I., Rinaldi, N. J., Macisaac, K. D., Danford, T. W., Hannett, N. M., Tagne, J. B., Reynolds, D. B., Yoo, J., Jennings, E. G., Zeitlinger, J., Pokholok, D. K., Kellis, M., Rolfe, P. A., Takusagawa, K. T., Lander, E. S., Gifford, D. K., Fraenkel, E., and Young, R. A. (2004). Transcriptional regulatory code of a eukaryotic genome. Nature 431, 99–104.
Hartman, J. L., Garvick, B., and Hartwell, L. (2001). Principles for the buffering of genetic variation. Science 291, 1001–1004.
Hoffman, R., and Valencia, A. (2004). A gene network for navigating the literature. Nat. Genet. 36, 664.
Kafri, R., Bar-Even, A., and Pilpel, Y. (2005). Transcription control reprogramming in genetic backup circuits. Nat. Genet. 37, 295–299.
Li, H., and Zhan, M. (2008). Unraveling transcriptional regulatory programs by integrative analysis of microarray and transcription factor binding data. Bioinformatics 24, 1874–1880.
Lo, Y. C., Paffett, K. S., Amit, O., Clikeman, J. A., Sterk, R., Brenneman, M. A., and Nickoloff, J. A. (2006). Sgs1 regulates gene conversion tract lengths and crossovers independently of its helicase activity. Mol. Cell. Biol. 26, 4086–4094.
Mankouri, H. W., Ngo, H. P., and Hickson, I. D. (2009). Esc2 and Sgs1 act in functionally distinct branches of the homologues recombination repair pathway in Saccharomyces cerevisiae. Mol. Biol. Cell 20, 1683–1694.
Matys, V., Fricke, E., Geffers, R., Gößling, E., Haubrock, M., Hehl, R., Hornischer, K., Karas, D., Kel, A. E., Kel-Margoulis, O. V., Kloos, D. U., Land, S., Lewicki-Potapov, B., Michael, H., Münch, R., Reuter, I., Rotert, S., Saxel, H., Scheer, M., Thiele, S., and Wingender, E. (2003). TRANSFAC: transcriptional regulation, from patterns to profiles. Nucleic Acids Res. 31, 374–378.
McManus, K. J., Barrett, I. J., Nouhi, Y., and Hieter, P. (2009). Specific synthetic lethal killing of RAD54B-deficient human colorectal cancer cells by FEN1 silencing. Proc. Natl. Acad. Sci. U.S.A. 106, 3276–3281.
McVey, M., Kaeberlein, M., Tissenbaum, H. A., and Guarente, L. (2001). The short life span of Saccharomyces cerevisiae sgs1 and srs2 mutants is a composite of normal aging processes and mitotic arrest due to defective recombination. Genetics 157, 1531–1542.
Ooi, S. L., Shoemaker, D. D., and Boeke, J. D. (2003). DNA helicase gene interaction network defined using synthetic lethality analyzed by microarray. Nat. Genet. 35, 204–205.
Scott, D. W. (1992). Multivariate Density Estimation: Theory, Practice, and Visualization. New York: John Wiley.
Shieh, G. S., Chen, C. M., Yu, C. Y., Hwang, J., Wang, W. F., and Lo, Y. C. (2008). Inferring transcriptional compensation interactions in yeast via stepwise structure equation modeling. BMC Bioinformatics 9, 134.
Spellman, P. T., Sherlock, G., Zhang, M. Q., Iyer, V. R., Anders, K., Eisen, M. B., Brown, P. O., Botstein, D., and Futcher, B. (1998). Comprehensive identification of cell cycle-regulated genes of the yeast Saccharomyces cerevisiae by microarray hybridization. Mol. Biol. Cell 9, 3273–3297.
Tong, A. H. Y., Evangelista, M., Parsons, A. B., Xu, H., Bader, G. D., Page, N., Robinson, M., Raghibizadeh, S., Hogue, C. W. V., Bussey, H., Andrews, B., Tyers, M., and Boone, C. (2001). Systematic genetic analysis with ordered arrays of yeast deletion mutants. Science 294, 2364–2366.
Tong, A. H. Y., Lesage, G., Bader, G. D., Ding, H., Xu, H., Xin, X., Young, J., Berriz, G. F., Brost, R. L., Chang, M., Chen, Y. Q., Cheng, X., Chua, G., Friesen, H., Goldberg, D. S., Haynes, J., Humphries, C., He, G., Hussein, S., Ke, L., Krogan, N., Li, Z., Levinson, J. N., Lu, H., Menard, P., Munyana, C., Parsons, A. B., Ryan, O., Tonikian, R., Roberts, T., Sdicu, A. M., Shapiro, J., Sheikh, B., Suter, B., Wong, S. L., Zhang, L. V., Zhu, H., Burd, C. G., Munro, S., Sander, C., Rine, J., Greenblatt, J., Peter, M., Bretscher, A., Bell, G., Roth, F. P., Brown, G. W., Andrews, B., Bussey, H., and Boone, C. (2004). Global mapping of the yeast genetic interaction network. Science 303, 808–813.
Vogelstein, B., and Kinzler, K. W. (2004). Cancer genes and the pathways they control. Nat. Med. 10, 789–799.
Wood, L. D., Williams Parsons, D., Jones, S., Lin, J., Sjoblom, T., Leary, R. J., Shen, D., Boca, S. M., Barber, T., Ptak, J., Silliman, N., Szabo, S., Dezso, Z., Ustyanksky, V., Nikolskaya, T., Nikolsky, Y., Karchin, R., Wilson, P. A., Kaminker, J. S., Zhang, Z., Croshaw, R., Willis, J., Dawson, D., Shipitsin, M., Willson, J. K. V., Sukumar, S., Polyak, K., Park, B. H., Pethiyagoda, C. L., Krishna Pant, P. V., Ballinger, D. G., Sparks, A. B., Hartigan, J., Smith, D. R., Suh, E., Papadopoulos, N., Buckhaults, P., Markowitz, S. D., Parmigiani, G., Kinzler, K. W., Velculescu, V. E., and Vogelstein, B. (2007). The genomic landscapes of human breast and colorectal cancers. Science 318, 1108–1113.
Woolf, P. J., and Wang, Y. (2000). A fuzzy logic approach to analyzing gene expression data. Physiol. Genomics 3, 9–15.
Wray, G. A., Hahn, M. W., Abouheif, E., Balhoff, J. P., Pizer, M., Rockman, M. V., and Romano, L. A. (2003). The evolution of transcriptional regulation in Eukaryotes. Mol. Biol. Evol. 20, 1377–1419.
Xu, H., Wu, P., Wu, C. F. J., Tidwell, C., and Wang, Y. (2002). A smooth response surface algorithm for constructing gene regulatory network. Physiol. Genomics 11, 11–20.
Zhang, B., and Horvath, S. (2005). A general framework for weighted gene co-expression networks analysis. Stat. Appl. Genet. Mol. Biol. 4, 17.
Appendix
Quantitative RT-polymerase chain reaction (qRT-PCR) experiments qRT-PCR is a major development of PCR technology that enables reliable detection and measurement of products generated during each cycle of PCR process.
To check whether a gene pair has TC (or TD) interactions, we measured the qRT-PCR expression level of gene B when its partner gene A was mutated, and compared this to that when gene A was wild type (WT). By the definition of TC (TD), the expression level of gene B should increase (decrease) when A is mutant vs when A is WT.
In order to verify the differences between experimental groups (knockout) and control group (WT) are significant or not, the (aforementioned) above experiment was repeated four times for each group. Then a t-test was performed to check:
where μC and μE is the mean of gene expression in control group and experimental group, respectively, and α = 0.1.
In this study, 112 pairs of TC and TD interactions formed by 17 As and Bs were confirmed by qRT-PCR experiments. The complete list cannot be released until these results are published by our collaborator in biochemistry.
Application 2: The List of 63 Gene Names

Application 2, the Predicted Triplets of 63 Yeast Genes Which Overlapped with Transfac.
Use DDSOM and alpha dataset.
“Score < 0.3” = 16 pairs, “Score < 0.3 and 132 AT/RTs from TRANSFAC” = 7 (in boldface). The predict triplets:
Xu’s Model and alpha dataset.
“Score < 0.3” = 8 pairs, “Score < 0.3 and 132 AT/RTs from TRANSFAC” = 0 pairs.
The predict triplets:
Keywords: gene expression, genetic interaction, microarray data, pathway, regression, transcriptional regulatory interaction
Citation: Jiang C-R, Hung Y-C, Chen C-M and Shieh GS (2012) Inferring genetic interactions via a data-driven second order model. Front. Gene. 3:71. doi: 10.3389/fgene.2012.00071
Received: 17 December 2011; Paper pending published: 27 February 2012;
Accepted: 12 April 2012; Published online: 03 May 2012.
Edited by:
Rongling Wu, Pennsylvania State University, USAReviewed by:
Alexander V. Favorov, Johns Hopkins University, USADajiang Liu, University of Michigan, USA
Copyright: © 2012 Jiang, Hung, Chen and Shieh. This is an open-access article distributed under the terms of the Creative Commons Attribution Non Commercial License, which permits non-commercial use, distribution, and reproduction in other forums, provided the original authors and source are credited.
*Correspondence: Grace S. Shieh, Institute of Statistical Science, Academia Sinica, 128 Academia Road, Section 2, Nan-Gang District, Taipei 115, Taiwan. e-mail:Z3NoaWVoQHN0YXQuc2luaWNhLmVkdS50dw==
 Ci-Ren Jiang1
