Abstract
Since the introduction of the Gene Ontology (GO), the analysis of high-throughput data has become tightly coupled with the use of ontologies to establish associations between knowledge and data in an automated fashion. Ontologies provide a systematic description of knowledge by a controlled vocabulary of defined structure in which ontological concepts are connected by pre-defined relationships. In plant science, MapMan and GO offer two alternatives for ontology-driven analyses. Unlike GO, initially developed to characterize microbial systems, MapMan was specifically designed to cover plant-specific pathways and processes. While the dependencies between concepts in MapMan are modeled as a tree, in GO these are captured in a directed acyclic graph. Therefore, the difference in ontologies may cause discrepancies in data reduction, visualization, and hypothesis generation. Here provide the first systematic comparative analysis of GO and MapMan for the case of the model plant species Arabidopsis thaliana (Arabidopsis) with respect to their structural properties and difference in distributions of information content. In addition, we investigate the effect of the two ontologies on the specificity and sensitivity of automated gene function prediction via the coupling of co-expression networks and the guilt-by-association principle. Automated gene function prediction is particularly needed for the model plant Arabidopsis in which only half of genes have been functionally annotated based on sequence similarity to known genes. The results highlight the need for structured representation of species-specific biological knowledge, and warrants caution in the design principles employed in future ontologies.
Introduction
With the ever increasing availability and quality of high-throughput data from all levels of cellular organization (e.g., transcriptome, proteome, and metabolome), ontologies have become an integral part of multivariate data analysis to facilitate biological interpretations. Accumulated knowledge in biology, unlike other scientific fields, is rather difficult to capture, and convey with mathematical formalisms. Nevertheless, ontologies offer the means for structured representation of knowledge gathered in various (electronic) written forms (e.g., text books, journal articles, databases), whereby the structure pertains to the relationships between knowledge concepts. Since ontologies are intended to represent corpora of knowledge, often in a particular field, the considered concepts can be used to annotate entities from the field of research.
Decade-long research efforts in this area, including annotation schemes such as the MIPS functional categories as well as the KEGG ontology (Ruepp et al., 2004), have resulted in ontologies tailored to different aspects of biological research, from genes and pathways to species-specific tissues, organs, and entire anatomies (Bard and Rhee, 2004). Two aspects of using biological ontologies have already been adequately addressed and thoroughly investigated, namely: (1) statistical tests for enrichment of ontological concepts (Rivals et al., 2007), (2) categorization and choice of semantic similarity measures for comparison of ontological concepts (Guzzi et al., 2011). However, the integration of biological ontologies, to facilitate interoperability of genomic databases, and their comparison, with the aim of selecting suitable ontologies, can still be regarded as pressing issues in bioinformatics and computational biology (Stein, 2003; Punta and Ofran, 2008).
In combination with methods from multivariate data analysis (e.g., clustering and separation), structured biological knowledge allows for automated reasoning and statistically sound inferences in biology. This is particularly relevant due to the recent surge of methods and applications in network-driven co-expression analysis of transcriptomics (i.e., gene expression) data. Co-expression networks provide the medium for transfer of gene annotation following the guilt-by-association (GBA) principle, whereby known (and enriched) function in a set of genes is propagated to the genes of unknown function in the set. Solutions for automated gene function annotation are still relevant even for well-investigated model organisms, such as Arabidopsis thaliana (Arabidopsis) with ∼27,000 genes of which only half have been functionally annotated based on sequence similarity to known genes, while the function of mere 13% has been experimentally confirmed (Lamesch et al., 2012).
In modern plant biology, there are two widely used ontologies: the Gene Ontology (GO) and MapMan. While the general GO has originated as species-unspecific, MapMan was initially specifically tailored to Arabidopsis. Furthermore, the latter has been extended to cover other plants such as maize (Doehlemann et al., 2008), Medicago (Tellström et al., 2007), tomato (Urbanczyk-Wochniak et al., 2006), and potato (Rotter et al., 2007). With respect to the nomenclature of concepts, the MapMan ontology comprises a set of 34 tree-structured bins, describing the central metabolism as well as other cellular processes (e.g., stress responses). On the other hand, GO is a collection of concepts, called terms, which are connected via is a and part of relations aimed at functionally categorizing genes (for details of scope and structure of GO, the reader is directed to, Ashburner, 2000; Stevens et al., 2000; Blake and Harris, 2002). Moreover, GO can be regarded as a collection of three ontologies that correspond to independent categories of gene function: molecular function (GO-MF), biological processes (GO-BP), and cellular component (GO-CC). Functional categorization of genes can also be performed across species with the help of high-level GO terms, reducing GO to the so-called GO slim ontology. Besides the generic species-unspecific version, there are GO slim ontologies which are designed for specific species, e.g., Saccharomyces cerevisiae (Cherry et al., 2012), Arabidopsis (Lamesch et al., 2012), and Drosophila (Adams et al., 2000). In MapMan, the original assignment of bins was based on publicly available gene annotation in TIGR (The Institute for Genomic Research), adopting a process alternating between automatic recruitment, and manual correction (Thimm et al., 2004).
Although the two ontologies have both been used in plant research, systematic comparison of GO and MapMan has not yet been undertaken. Assessing the advantages and drawbacks of the two is crucial for the selection of the ontology suitable for automated gene function annotation. Here we present the findings from the comparative analysis of GO and MapMan, first by analyzing similarities and differences with respect to the (1) overall structure and size, and (2) design principles. Here, we suggest suitable preprocessing strategies to alleviate the problem of inconsistent mappings regarding the inheritance of concepts given by the respective structure of the ontology.
Furthermore, for the specific case of the gene annotation for Arabidopsis, we investigate (3) the coverage and (4) biological relevance of concepts within the two ontologies. In addition, we analyze the effect of a particular ontology on the function transfer across genes based on the coupling between the GBA principle and co-expression networks. The findings from our comparative analysis point out that the domain in which ontologies are used may have a profound effect on the selection of a best-performing alternative. Therefore, our results pinpoint the need for development of methods for objective, systematic, and problem-specific comparison of biological ontologies as well as formal frameworks for transfer of ontologies in cross-species analyses.
Results
The structure of MapMan and GO
Although the relationships between two ontological terms in GO and MapMan can be described by is a and part of relationships, the structures of the two ontologies differ. While all three categories of GO are structured in the form of a directed acyclic graph (DAG; Yon Rhee et al., 2008), the relationships in MapMan are modeled following a tree structure (cf. Figure 1). The implication of using a DAG as an underlying structure of the ontology is that child concepts may have more than one parent. The multiplicity of parent concepts can be regarded as an advantage, as it provides a high degree of flexibility and may enable powerful grouping, searching, and analysis of genes (Yon Rhee et al., 2008). In contrast, although the tree structure closely resembles the intuitive connotation of a hierarchy of concepts, it sacrifices a part of the flexibility when the ontology is updated (e.g., by adding new concepts).
Figure 1
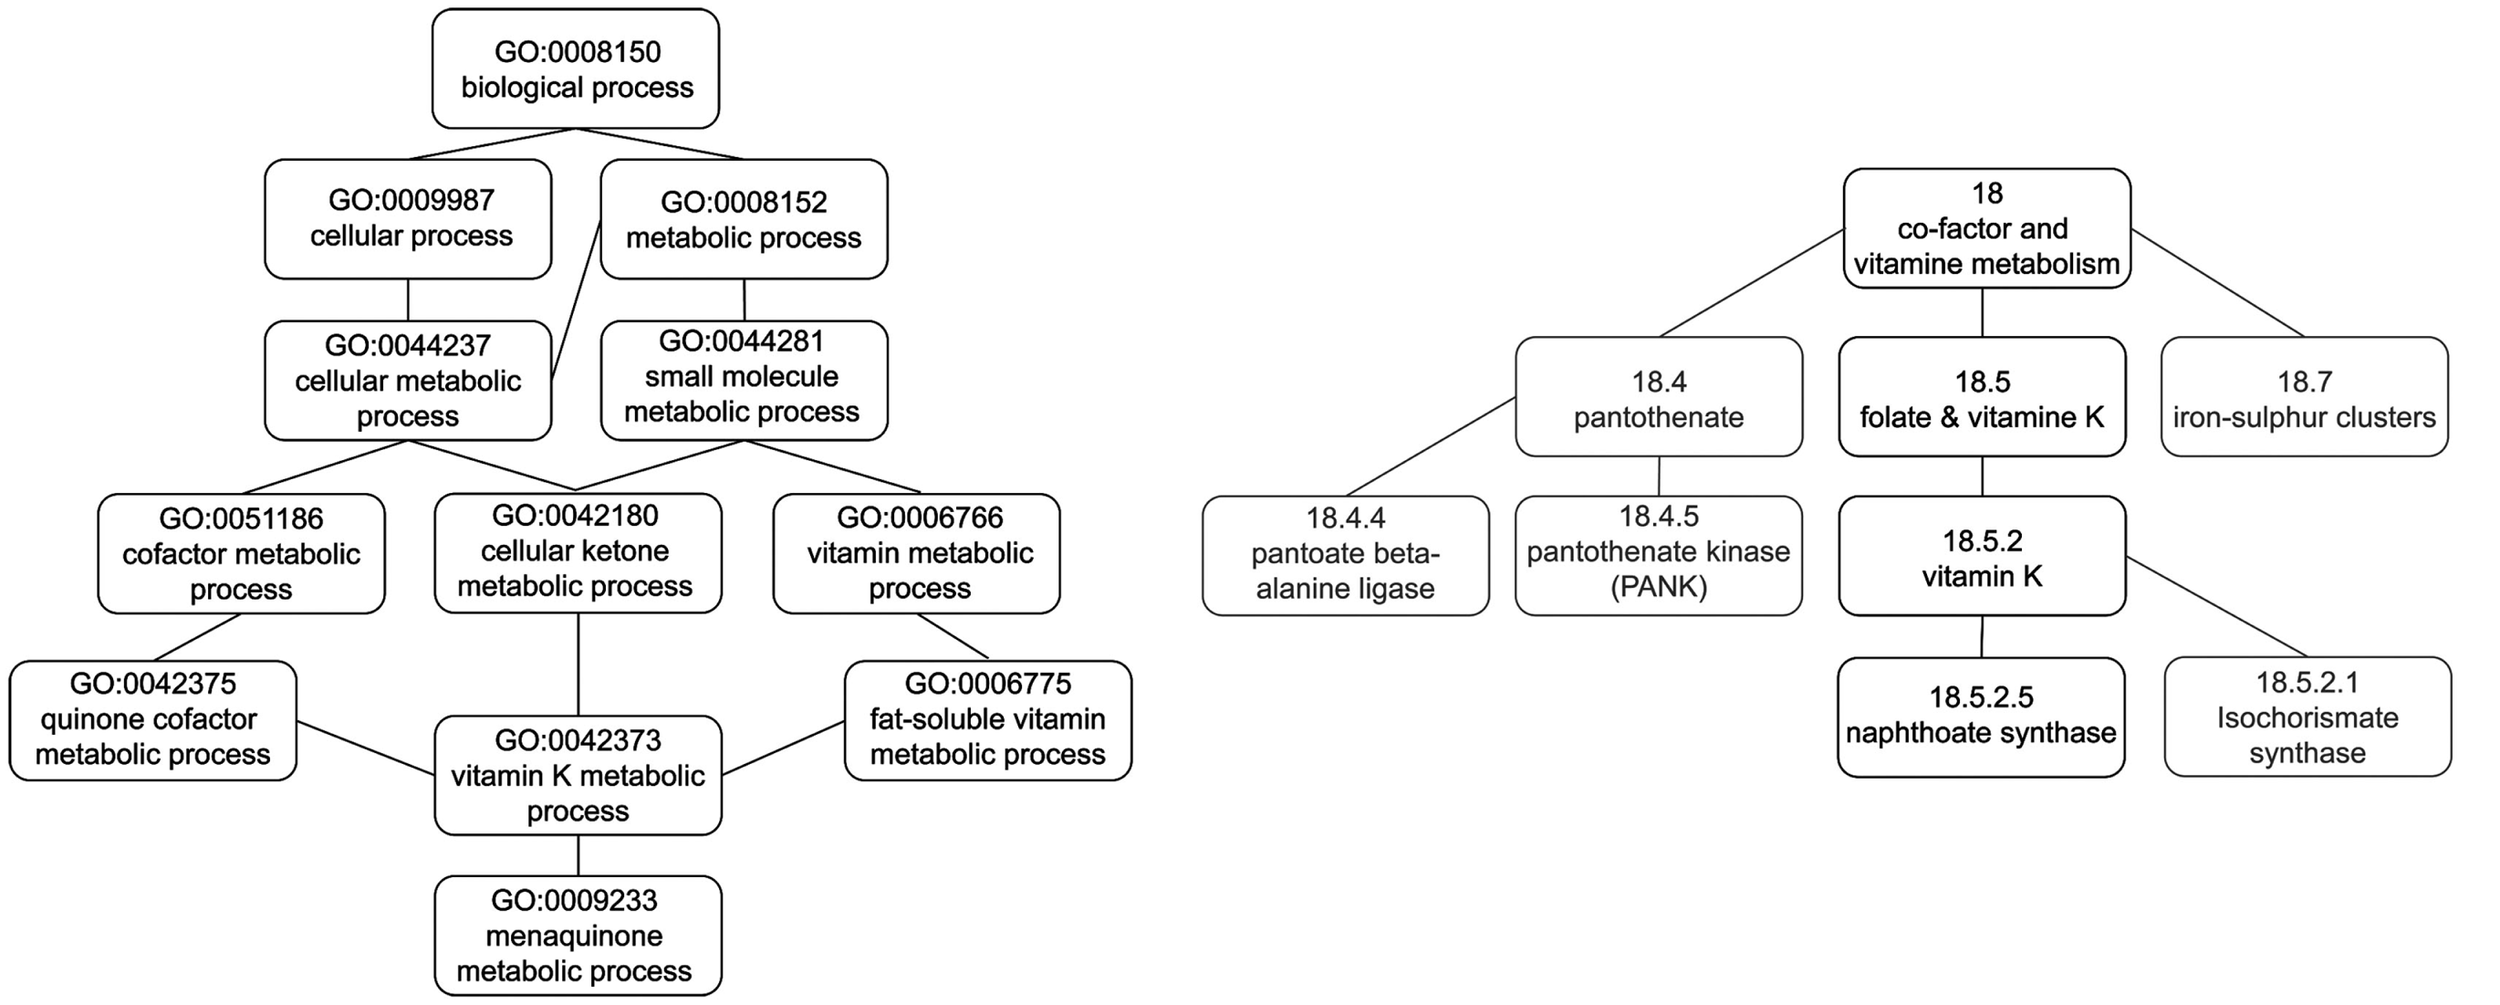
Comparison of the concepts used in the annotation of the gene coding for naphthoate synthase (at1g60550, 264920_at) in the DAG and tree structure of GO DAG and MapMan, respectively.
A disadvantage of the DAG structure, compared to a tree, is that the depth of a concept cannot be unambiguously defined, since there may exist multiple paths to the root node. Therefore, we define the depth of a concept in GO (i.e., term) as the shortest path to the root node, corresponding to the minimum concept depth (see Guzzi et al., 2011) for other similar measures). In addition, multiple parent concepts increase the overall number of possible ancestors at the same concept depth. This is particularly the case when comparing the DAG structure of GO with the tree structure of MapMan. Furthermore, the number of potential parent concepts as well as the overall size of an ontology renders it difficult to visualize concept associations for large-scale transcriptomic analyses (for the plethora of available visualization methods see, e.g., Zeeberg et al., 2003; Tsiaras et al., 2008; Carbon et al., 2009; and has effect on statistical hypothesis testing, e.g., in multiple testing scenarios Goeman and Mansmann, 2008).
An immediate solution represents GO slim, which categorizes genes on the basis of a relatively small set of high-level GO terms. Like in the tree structure of MapMan, the smaller number of (parent-) terms of the slim ontologies facilitates the interpretability of obtained results. However, similarly to the previous arguments, a small number of parent terms can also turn out to be a disadvantage, as it may lead to a comparatively flatter hierarchy structure, regardless of the actual size of the used ontology. Subsequently, a flat hierarchy may compromise the specificity and biological relevance of individual concepts due to its coarseness.
Design principles of ontologies – capturing biological concepts
An important characteristic of GO is the division in three non-overlapping domains of molecular biology–biological process (GO-BP), molecular function (GO-MF), and cellular component (GO-CC; Ashburner, 2000; Harris and Gene Ontology, 2004). While terms in GO-BP domain describe biological objectives and processes in which the annotated genes participate, terms in GO-MF characterize biochemical activities that ultimately contribute to biological processes. Finally, GO-CC summarizes the subcellular localization where a gene product is active. In contrast, while MapMan does not have a structure composed of independent categories, one can still distinguish between high- and low-level bins. Since the design principle of MapMan was to intuitively characterize and visualize metabolic pathways and processes (Thimm et al., 2004), high-level bins tend to be similar to terms in the GO-BP ontology, whereas low-level bins often resemble terms from the GO-MF ontology.
To illustrate this claim based on the whole annotation of gene products rather than examples of individual concepts, we quantified the similarity of MapMan bins and GO terms by utilizing a network-based approach. For the purpose of this analysis, nodes correspond to concepts, i.e., terms in GO and bins in MapMan. An edge between two nodes is established if the set of genes which are annotated with the respective terms corresponding to the nodes are similar (cf. Materials and Methods).
Figure 2 shows the resulting network which consists of all GO-MF and GO-BP terms that exhibit a similarity to at least one MapMan bin. The edges of the resulting network can further be divided by the type of association they model, namely: similarity between MapMan bin and GO-BP term, MapMan bin and GO-MF term as well MapMan bin, and both GO-MF and GO-BP terms. Inspection of the three types of edges in this concept-association network shows that high-level MapMan bins are often associated with terms originating from GO-BP. In contrast, MapMan bins deeper in the hierarchy are predominantly associated with GO-MF terms. A statistical analysis quantifies this observation as the difference of average depth of concepts for the first two of the groups of edges is statistically significant at the 5% level (Wilcoxon-Rank-Sum test, p-value = 0.016, cf. Figure 3). Here and in the following, we only use the terms from the two GO ontologies, namely: GO-MF and GO-BP, since there is no correspondence between GO-CC and any bin in MapMan.
Figure 2
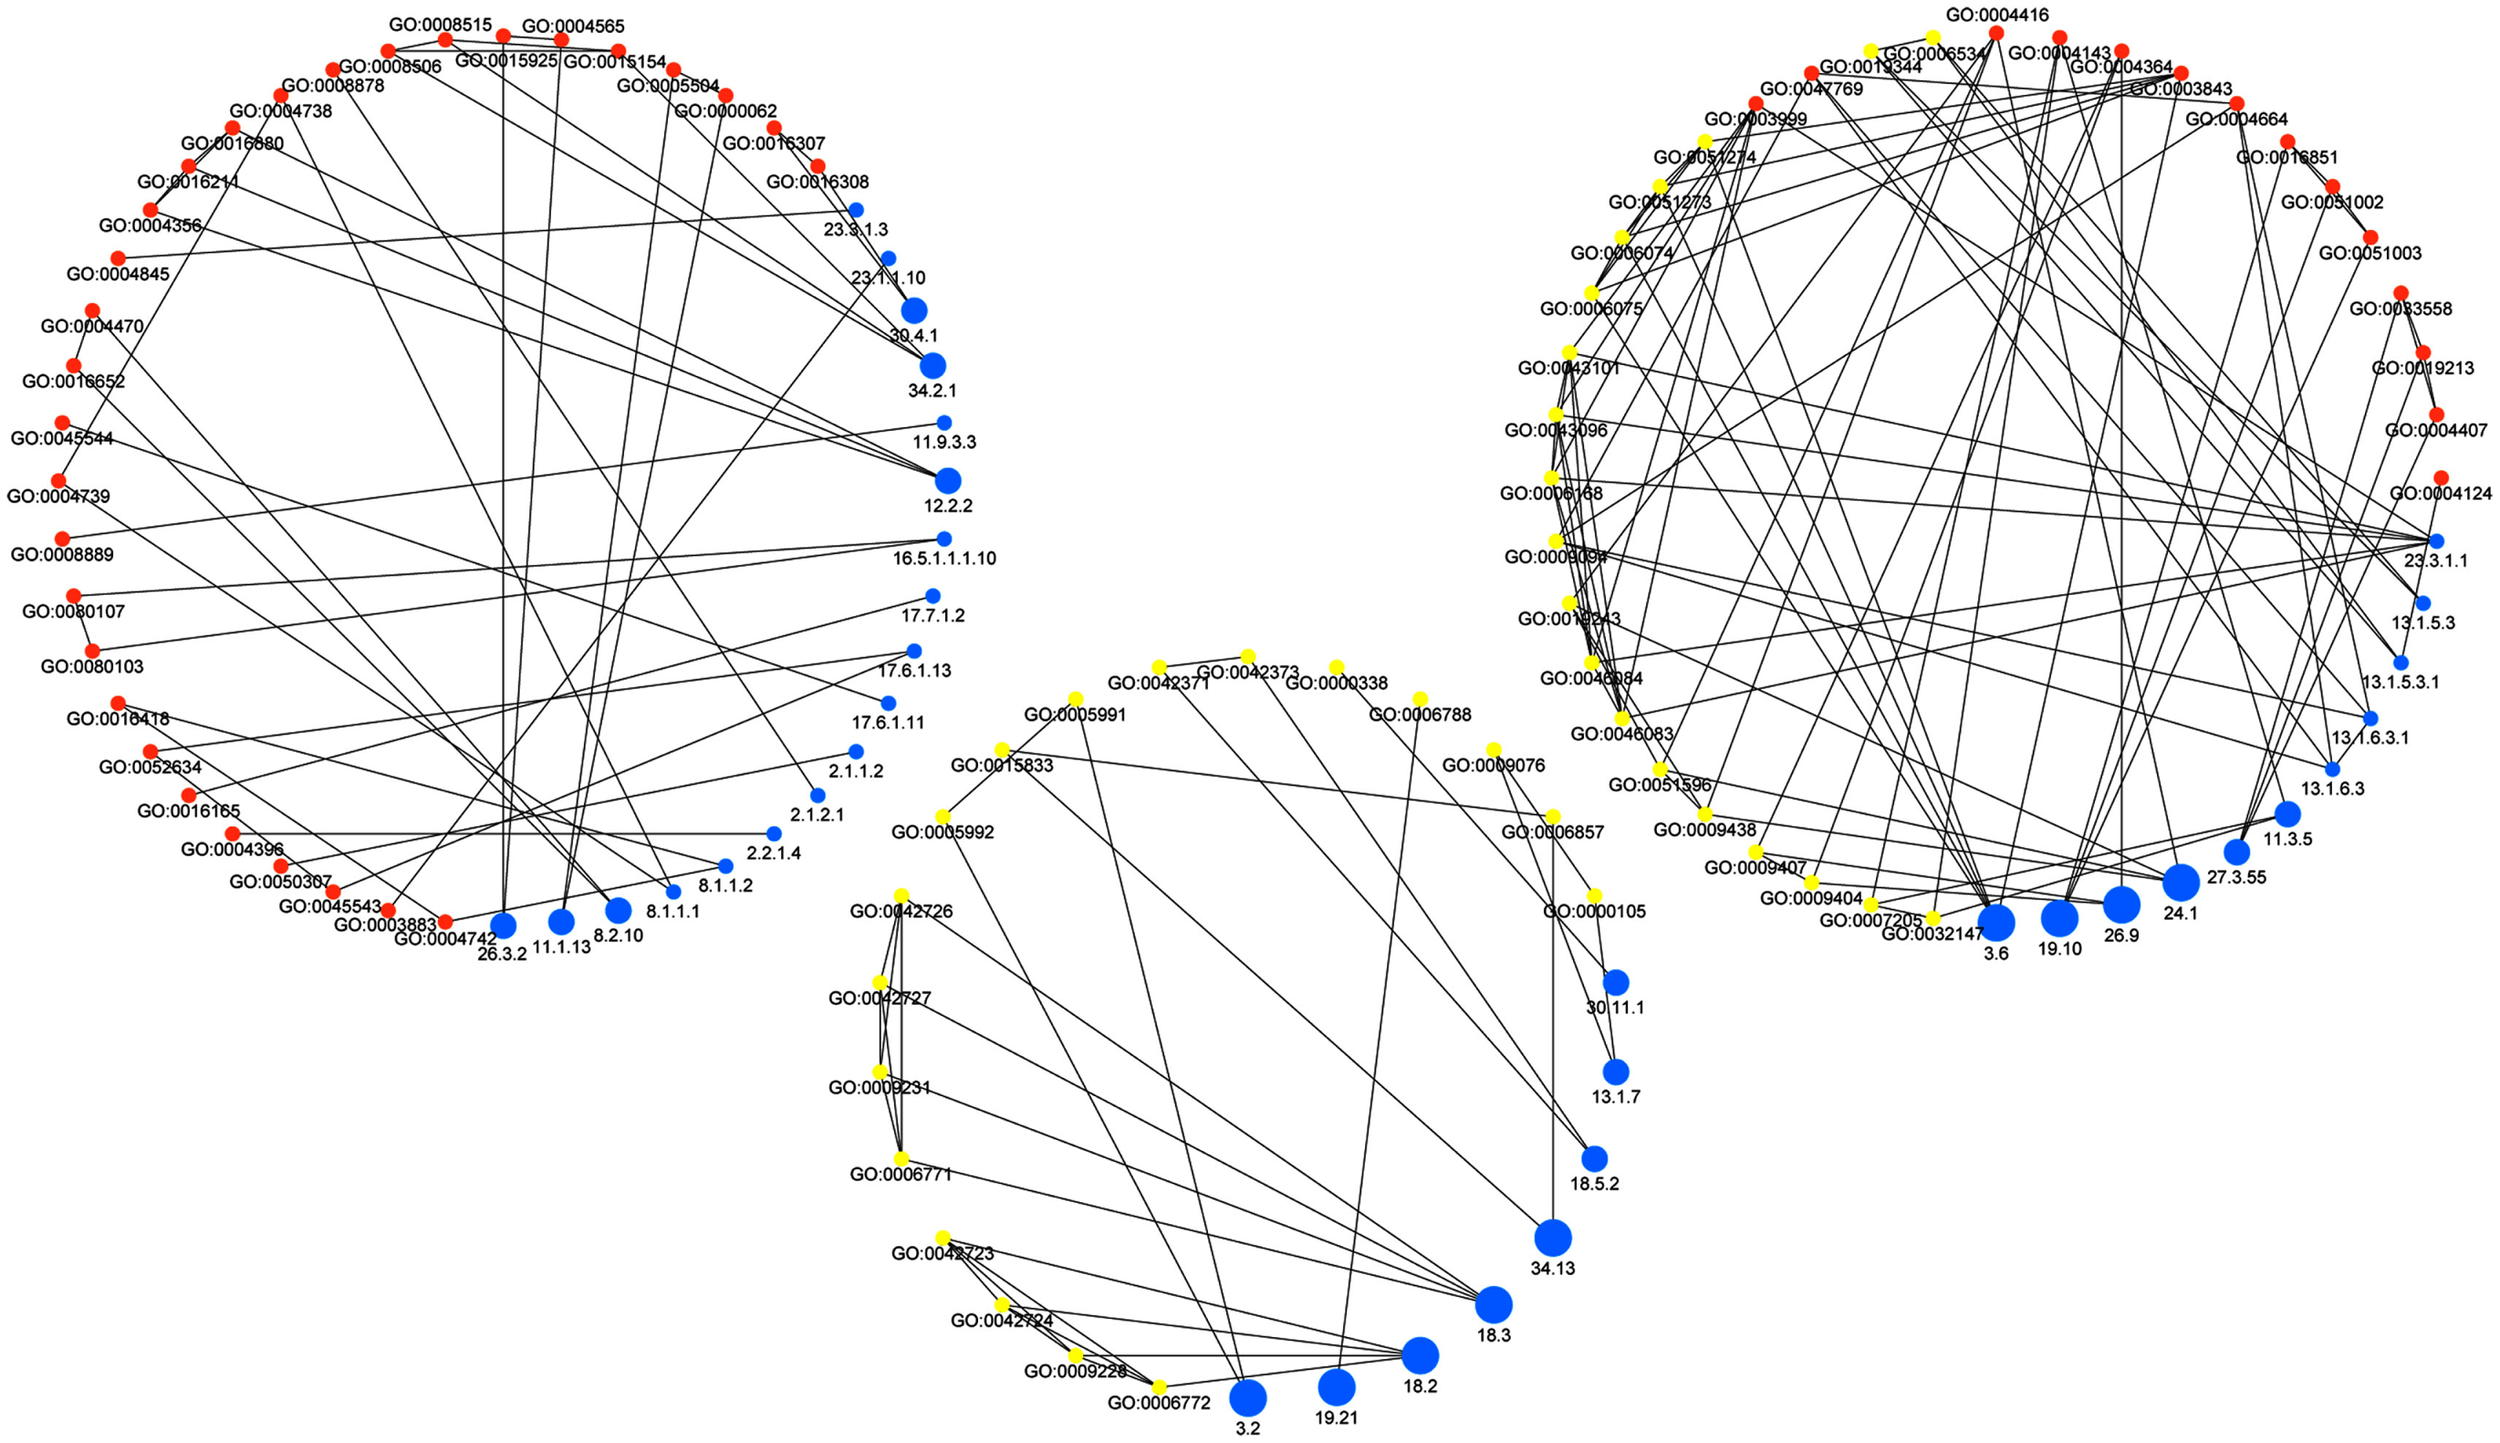
Network of associations between MapMan bins and GO terms. Blue nodes represent MapMan bins, yellow denote GO-BP terms, and orange nodes correspond to GO-MF terms. The size of the nodes representing MapMan bins corresponds to their depth in the ontology. Note that the low-level bins (small blue nodes) correspond to terms in GO-MF, while high-level bins (large blue nodes) are associated to terms in GO-BP. The edges of the network are divided by the type of association they model, namely: association between MapMan bin and GO-BP term (left), MapMan bin and GO-MF term (middle) as well MapMan bin and both GO-MF and GO-BP terms (right).
Figure 3
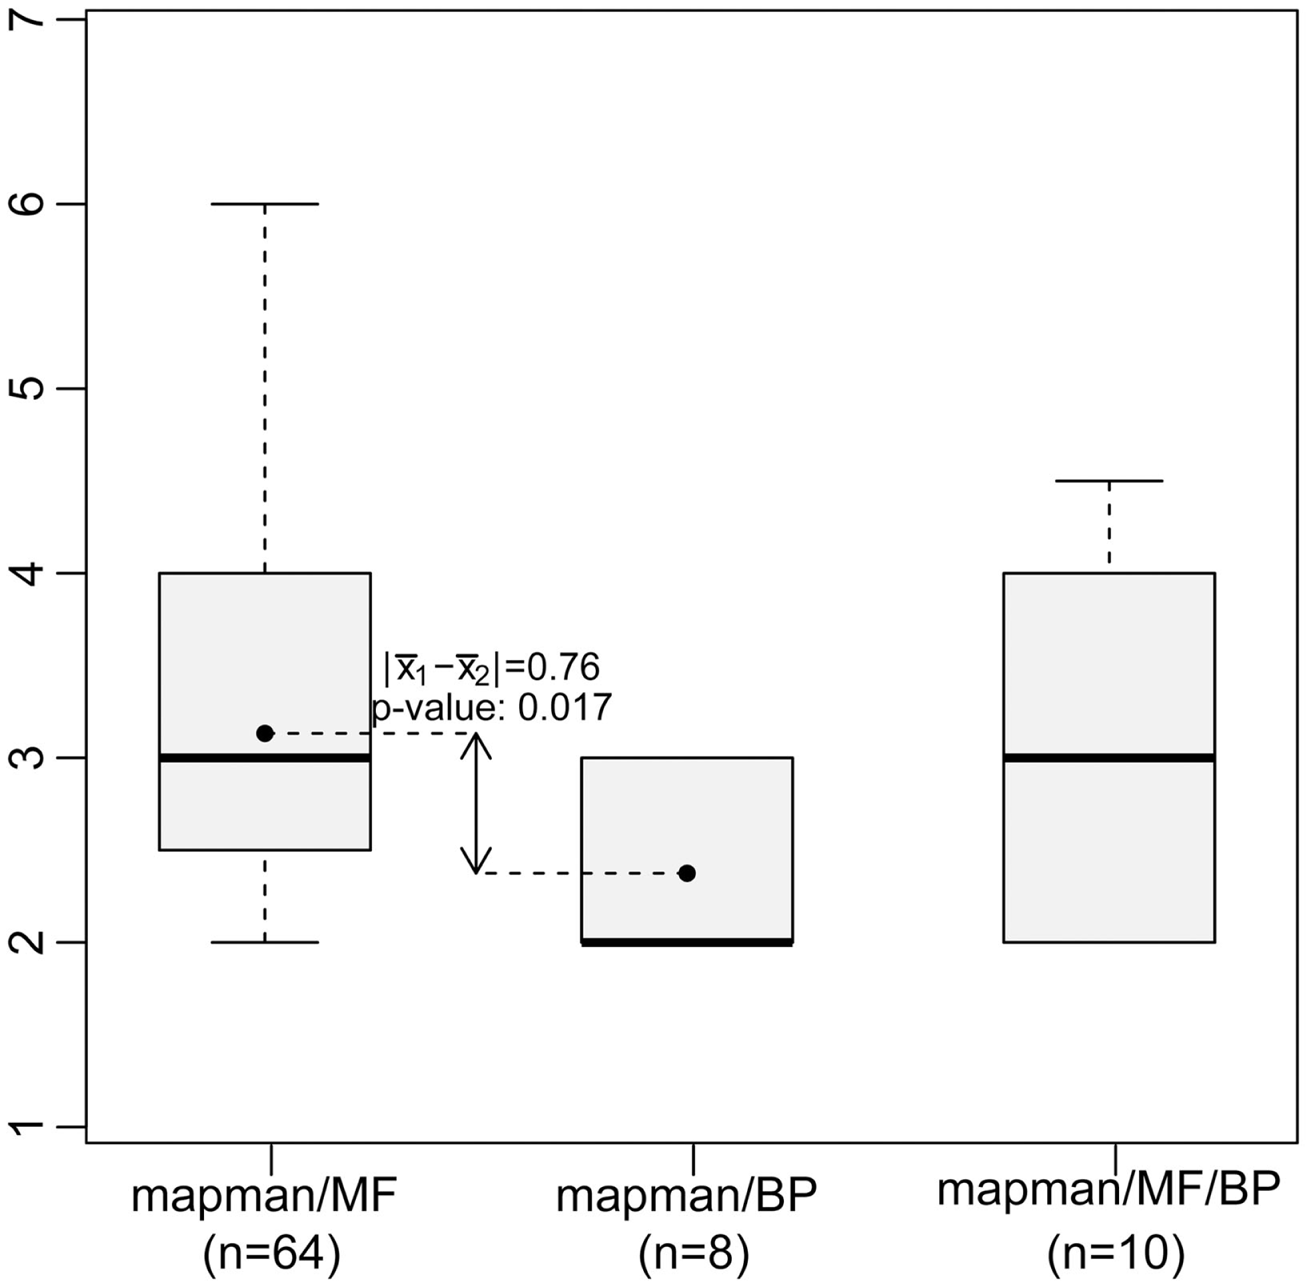
Concept depth of MapMan bins associated with GO terms based on similarity of the annotated genes (cf. Figure 2). Low-level MapMan bins tend to represent terms from the GO-MF ontology (left boxplot), while high-level MapMan bins are associated with terms from GO-BP (middle). The difference of the bin depth for these two groups is statistically significant at level α = 0.05.
Gene annotation coverage – the status quo for Arabidopsis
The genome of Arabidopsis contains 27,416 protein coding genes according to the latest genome annotation version (TAIR10, November 2010)1 which excludes pseudo genes and genes encoded by transposable elements (Lamesch et al., 2012). Inspection of these mappings shows that a total of 15,238 gene products are annotated with MapMan bins, while 12,225 and 13,157 genes are annotated by GO-BP and GO-MF terms, respectively. By combining the available annotation of all three ontologies ∼63% of Arabidopsis’ genes can be annotated.
The number of genes that are annotated with both MapMan and GO terms (either GO-BP or GO-MF) is ∼87% of the total number of annotated genes with concepts from any of the three ontologies (cf. Figure 4). Furthermore, each ontology contains concepts used in the annotation of a unique set of genes: the contribution of MapMan is slightly larger, with 2,557 unique bins, compared to 625 and 572 terms for GO-MF and GO-BP, respectively (Figure 4). In summary, the coverage of the two ontologies is comparable, which further serves as a justification for the undertaken comparative analysis.
Figure 4
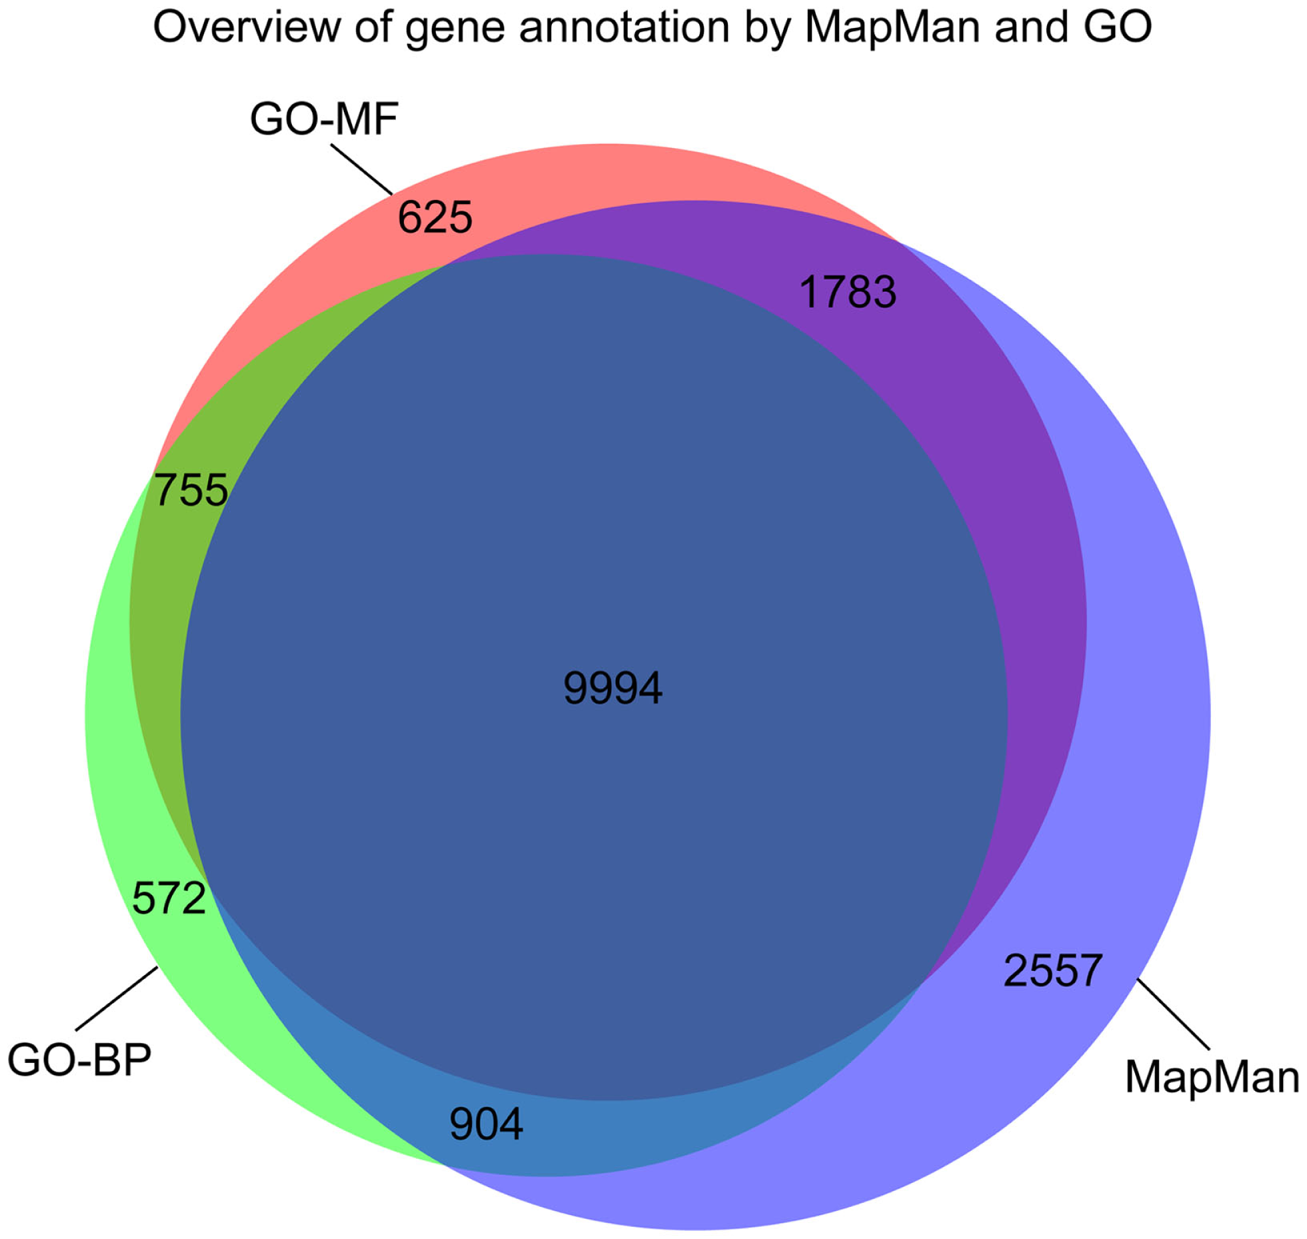
Venn diagram illustrating the overlap in the gene annotation of Arabidopsis thaliana with concepts from MapMan, GO-BP, and GO-MF, respectively.
In addition, we find that 3,598 unique GO-BP terms are used to annotate ∼45% of Arabidopsis’ genes. GO-MF contains 2,148 unique terms covering ∼48% of the genes. Finally, 1,361 unique bins of MapMan are used in annotating 56% of Arabidopsis’ genes. Similarly to the overall size of the ontologies, we demonstrate that the average number of parent terms per gene in MapMan is 3 in comparison to 20 and 7 in GO-BP and GO-MF, respectively. Clearly, MapMan is the smaller ontology with roughly one-third of the size of GO-BP.
Furthermore, to see whether a comparatively low number of parent terms ultimately results in an overall flatter hierarchy structure in the case of MapMan, we analyze the differences in the distribution of depth in the two ontologies. Again, we contrasted the concept depth distribution on the current state of ontological gene annotation in Arabidopsis. Here, for each annotated gene, we determined the depth of every associated term and all of its parents (further defined as “complete ontology”, see Materials and Methods). As shown in Figure 5, MapMan indeed represents a flatter hierarchy: while both term depth distributions of the two GO categories closely resemble a normal distribution with a mean ≅ median term depth of ∼5 (sample skewness: GO-MF = 0.01,GO-BP = 0.26), the term depth distribution of MapMan is skewed toward lower values with median term depth of three (sample skewness: 0.69). In addition, the maximum term depth is lower, and is of value seven in MapMan and 10 in both GO categories, respectively.
Figure 5
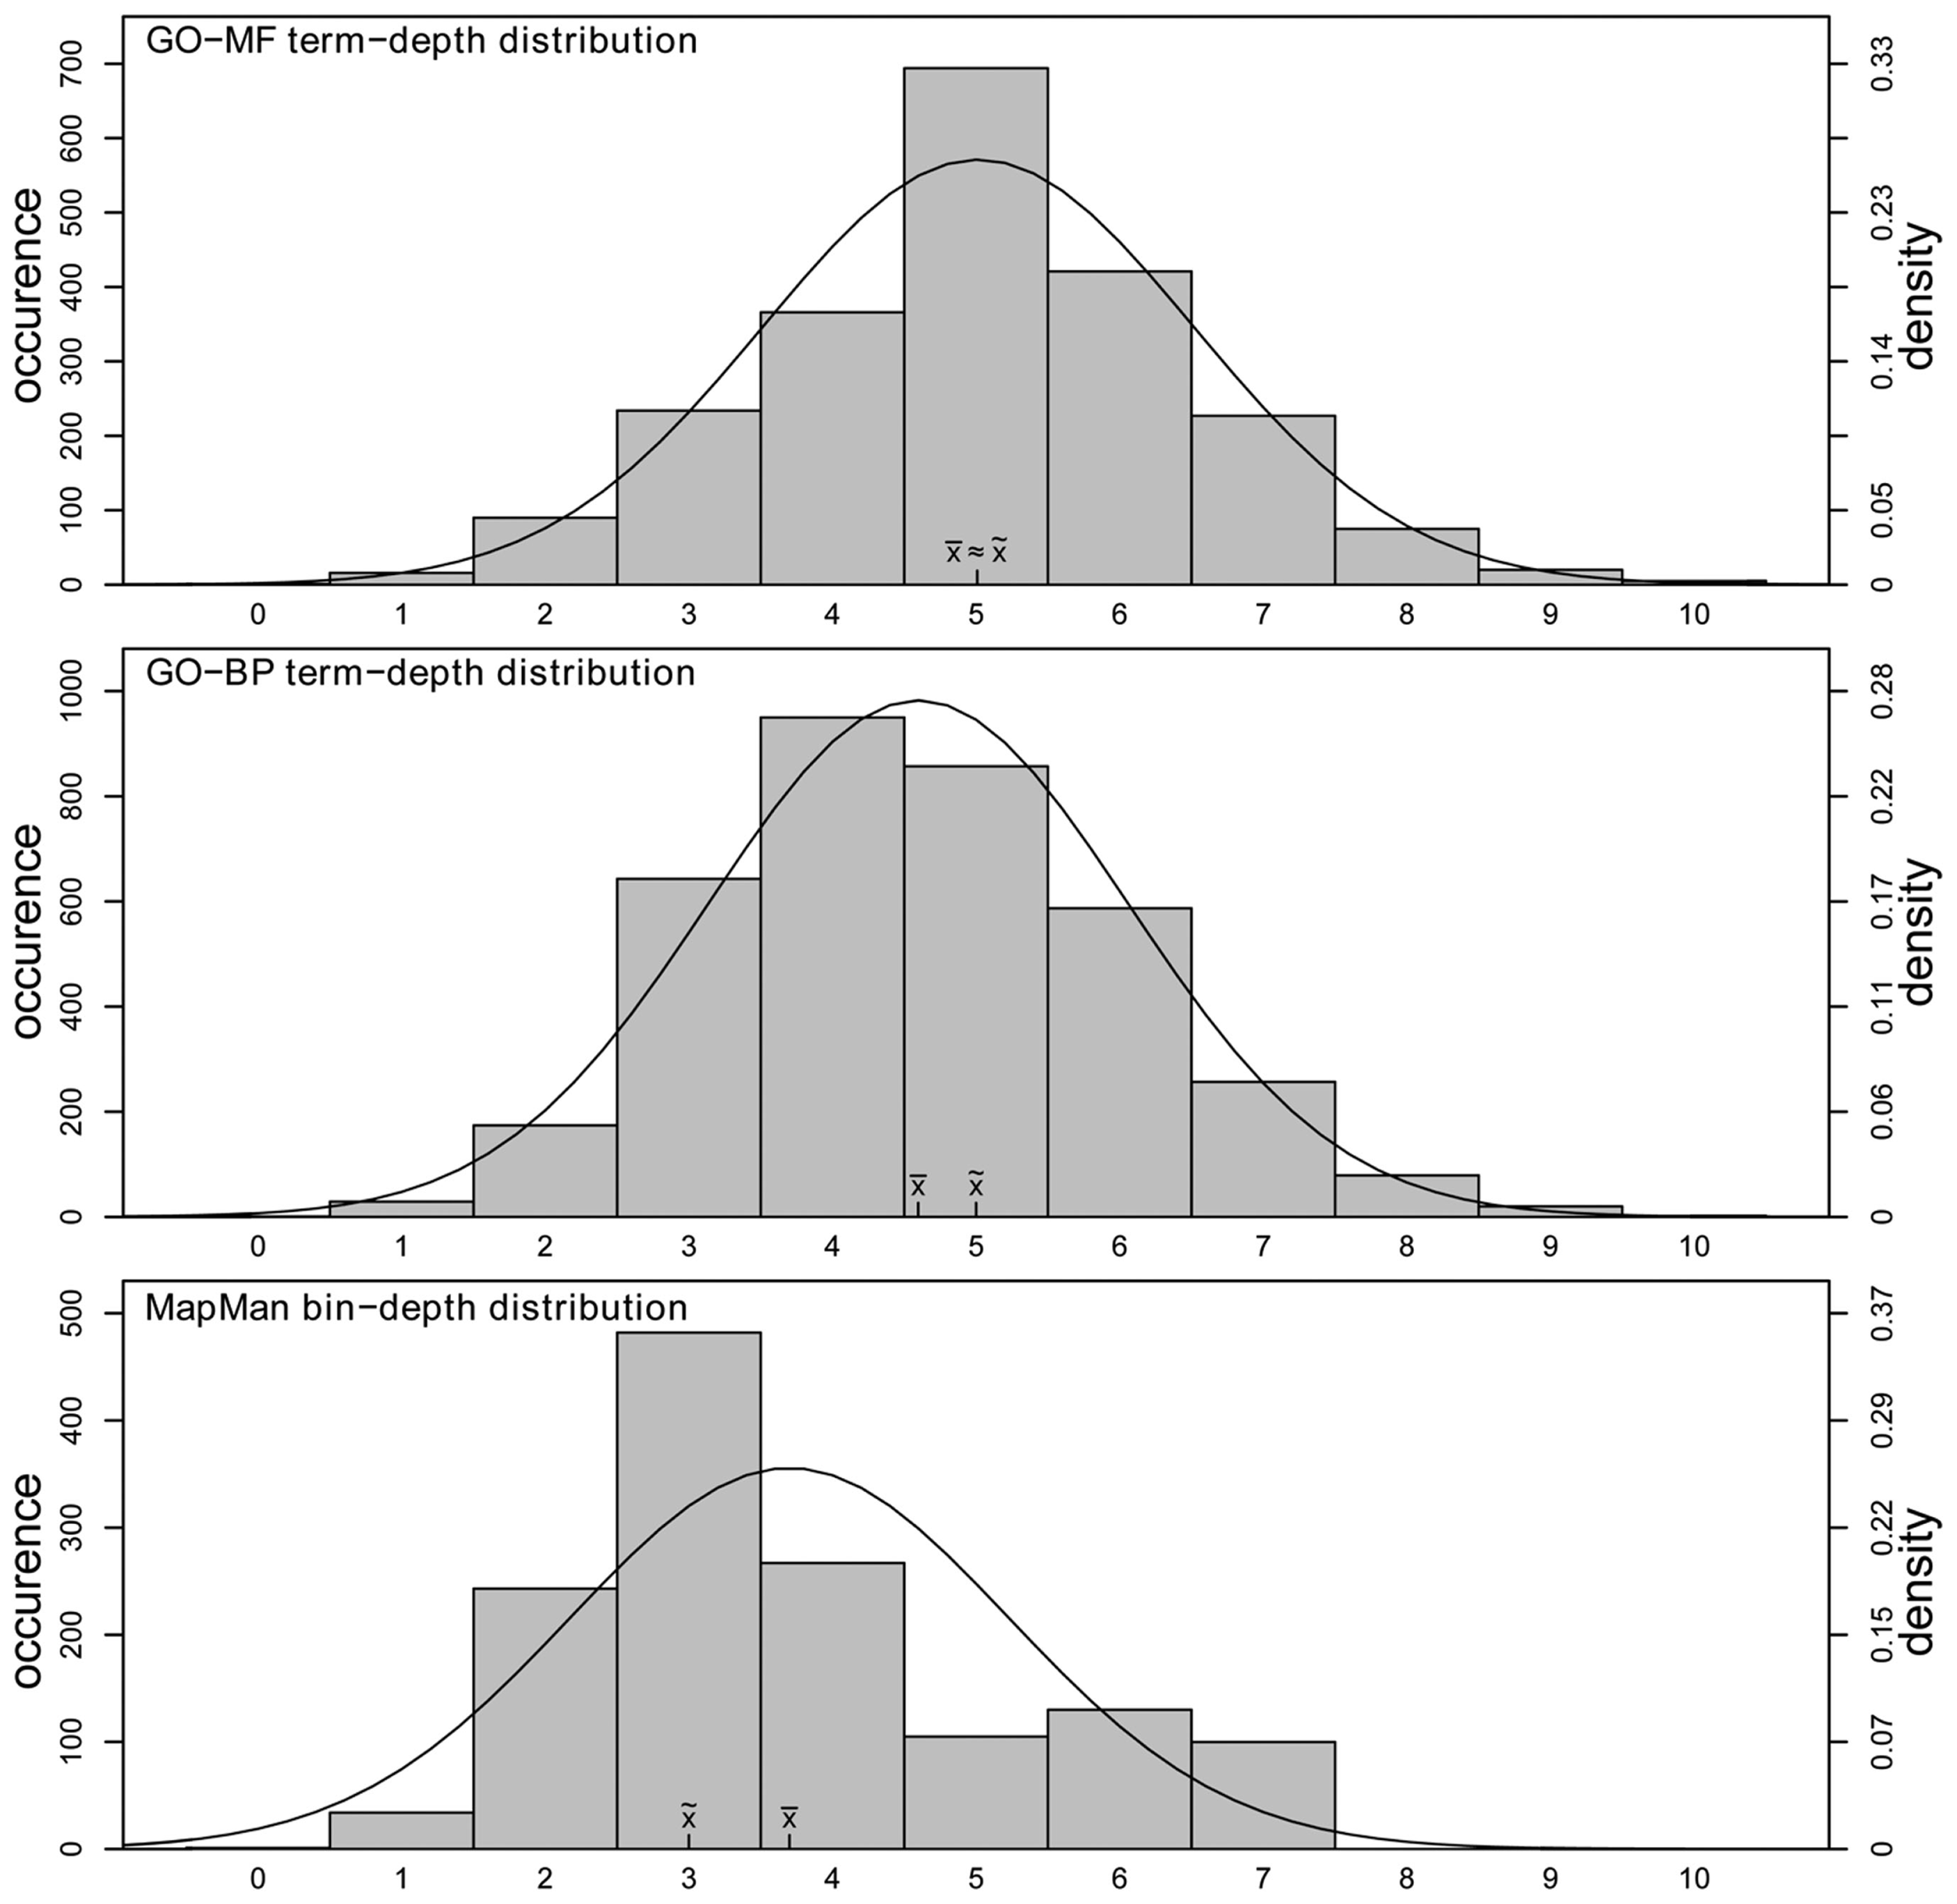
Distributions of concept depth in GO-MF (upper), GO-BP (middle), and MapMan (lower). The x-axis denotes the depth of a concept while the left y-axis denotes the corresponding occurrence. For all three distributions, a normal distribution is fitted (right y-axis).
Information content of ontological terms
Common to both ontologies is that high-level concepts describe general processes, functions, or structures, while low-level concepts are more specific. The previous claim that MapMan constitutes a flatter hierarchy structure, compared to GO, needs further investigation to ascertain whether the structure of MapMan can be used equally well in elucidating biologically meaningful information from its ontological concepts (i.e., bins). Here we rely on the information content (IC) of an ontology concept to quantify its specificity by accounting for the overall number of genes annotated with it (Resnik, 1995). Briefly, the information content of an ontology concept is lower as its specificity decreases; the more abstract a concept, or broader an ontological category, the lower its information content (see Material and Methods). Figure 6 shows a histogram of the IC of all MapMan, GO-MF and GO-BP used in the annotation of the Arabidopsis’ genome. One can observe that both GO ontologies exhibit a higher maximum IC as well as more terms of large IC. Moreover, the median IC of 9.23 for MapMan is smaller than that of GO ontologies, i.e., 10.4 for GO-MF and 10.82 for GO-BP. This implies a slightly coarser grouping of processes and functions in the case of MapMan. However, one can also observe that MapMan contains more terms of average IC (∼5.5 to ∼8.5).
Figure 6
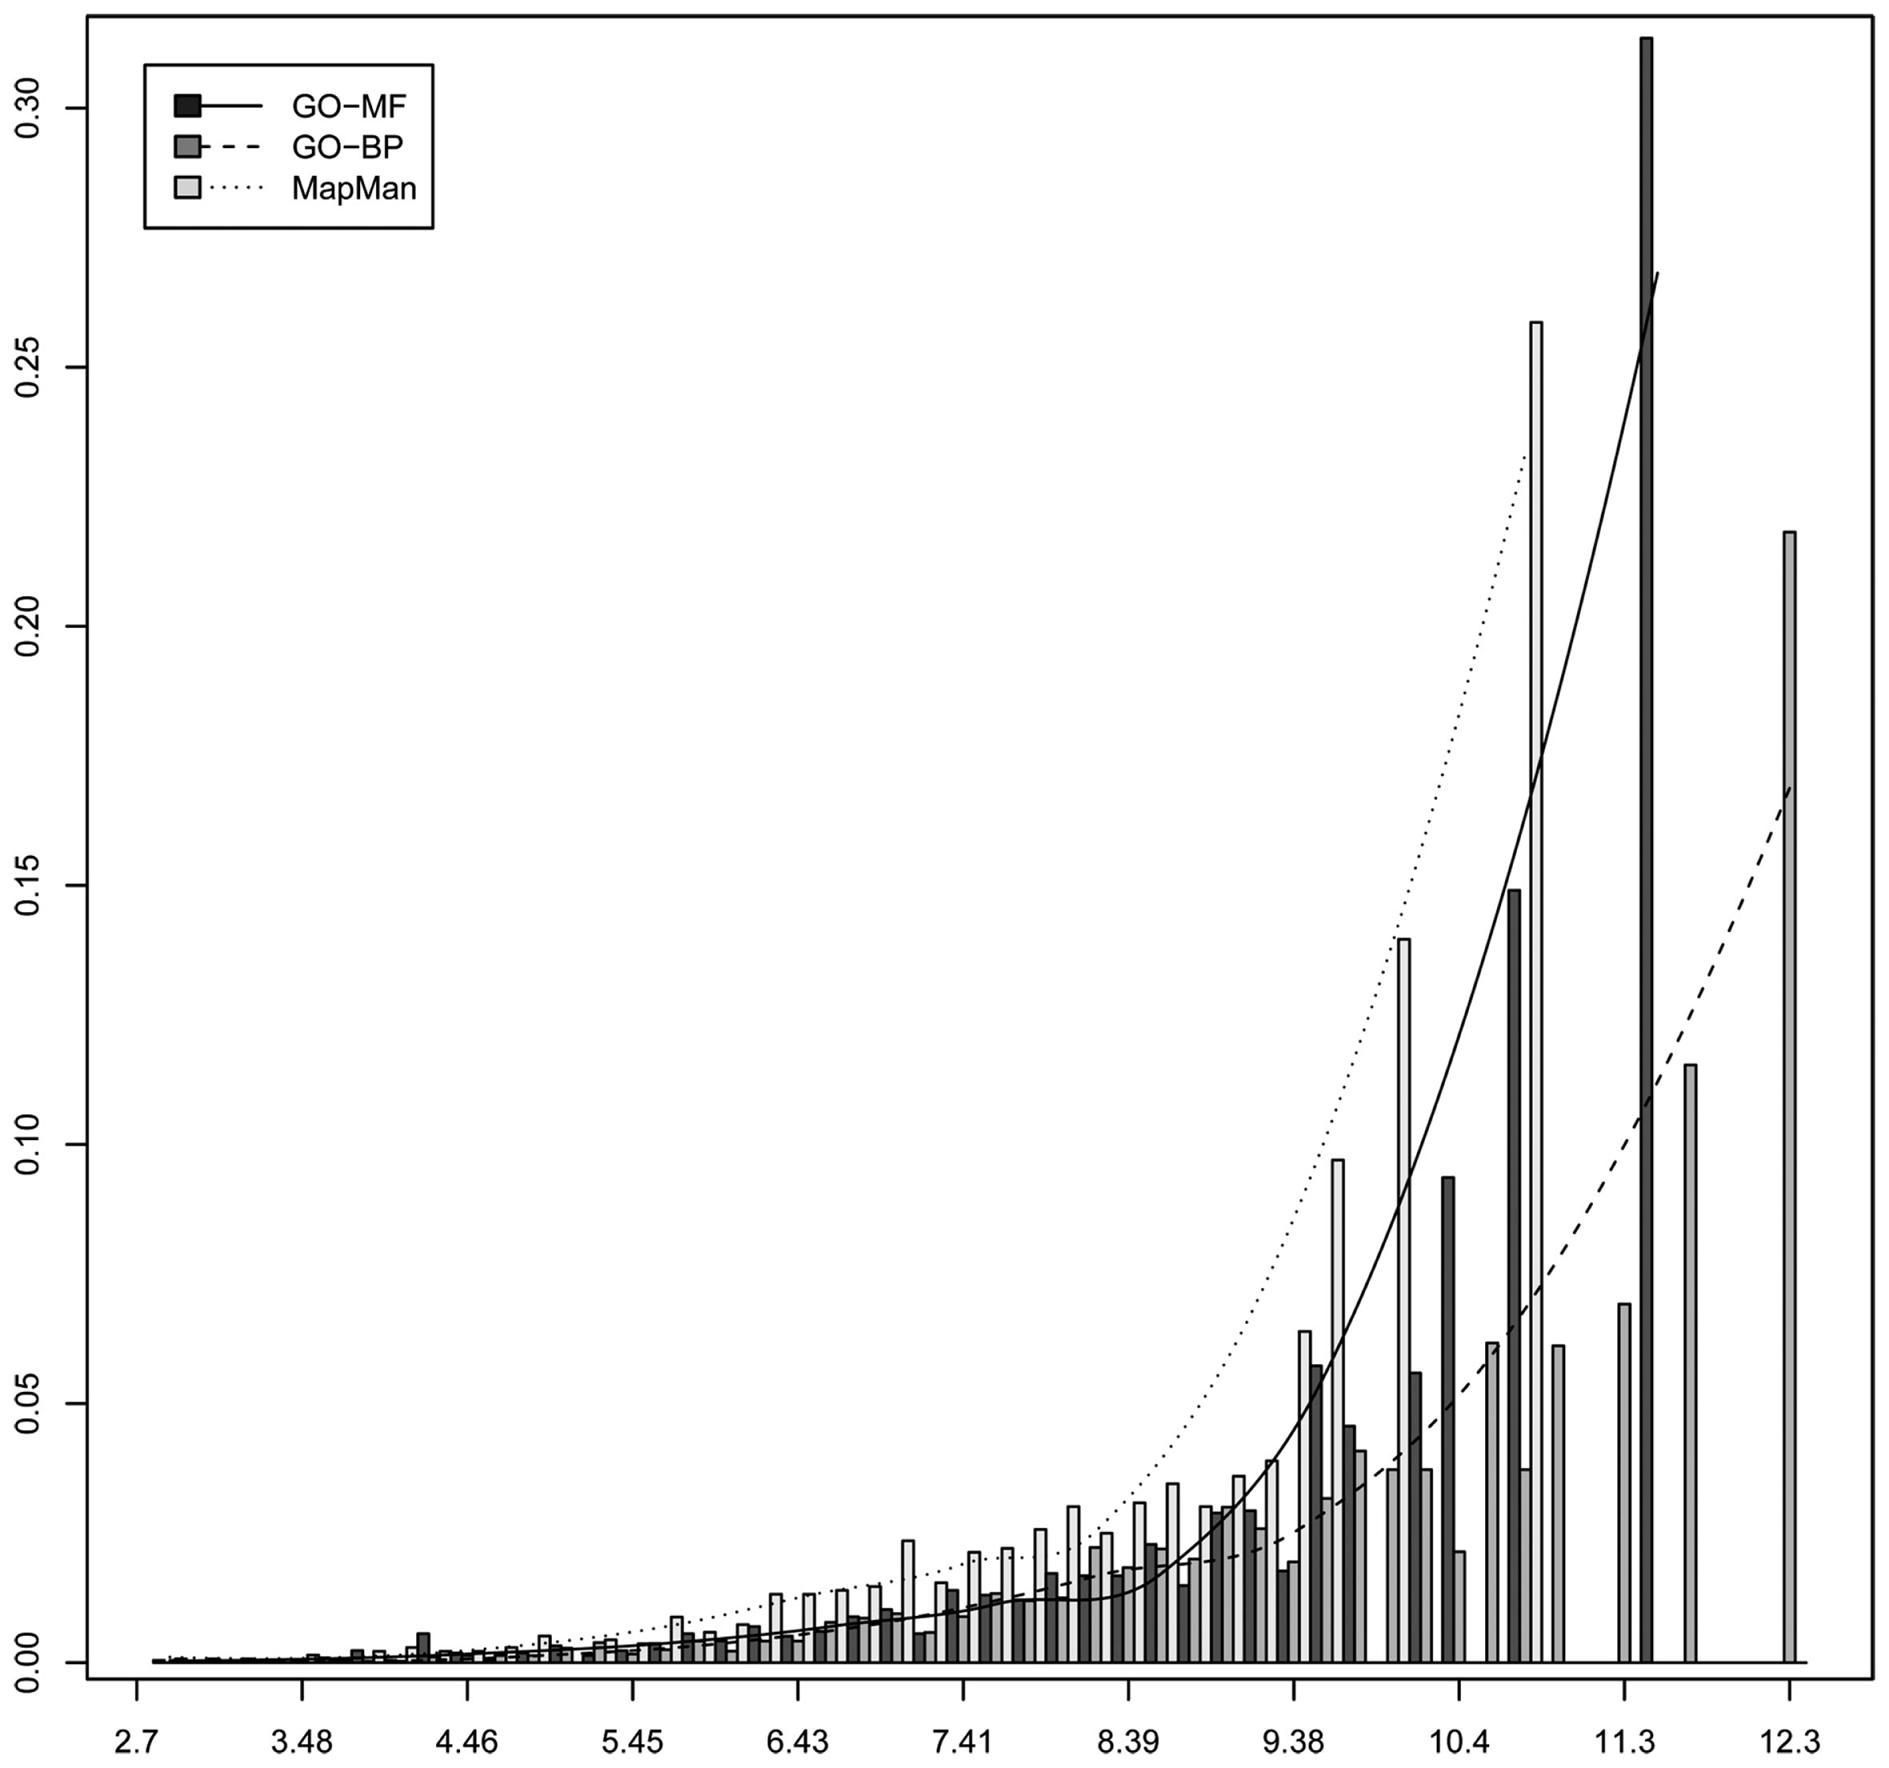
Histogram of the information content of all concepts used to annotate Arabidopsis’ genome by using the three ontologies MapMan, GO-MF, and GO-BP.
Besides the analysis of the distribution of ICs for concepts of an ontology, it is important to also investigate the interplay between the underlying structure (captured by the concept depth) and IC to characterize the level at which a deeper hierarchy relates to more specific sets of genes. This dependence between concept depth and IC is visualized in Figure 7 with the help of box plots. One can observe that all three ontologies exhibit an asymptotic trend of the median IC values per concept depth. Interestingly, none of the ontologies displays a gradual trend of a linearly increasing IC with the increasing concept depth. Further, this non-linear behavior can be modeled using classical Michaelis-Menten kinetics (Lehninger et al., 2008), which relates the rate of a reaction (dependent variable) with the (saturating) concentration of its substrate (independent variable). The relation is fully described by two parameters: Vmax, representing the maximum rate achieved at maximum (saturating) substrate concentrations, and Km, denoting the substrate concentration at which the rate is half of Vmax. Analogously to this classical enzyme kinetics, we take Vmax to denote maximum IC achieved at maximum concept depth and Km, the concept depth at which the IC is Vmax/2. By using non-linear (least-squares) regression (Leskovac, 2003), we obtain estimates for the constants Vmax and Km (cf. Materials and Methods). Interestingly, we find the all determined Km values are close to ∼1, relating to Vmax/2 of 6.08, 6.04 and 6.76 for MapMan, GO-MF and GO-BP, respectively. Therefore, we conclude that, in the case of Arabidopsis, all three ontologies possess the similar structural capabilities to allow for an adequate biologically meaningful discrimination of concepts and genes.
Figure 7
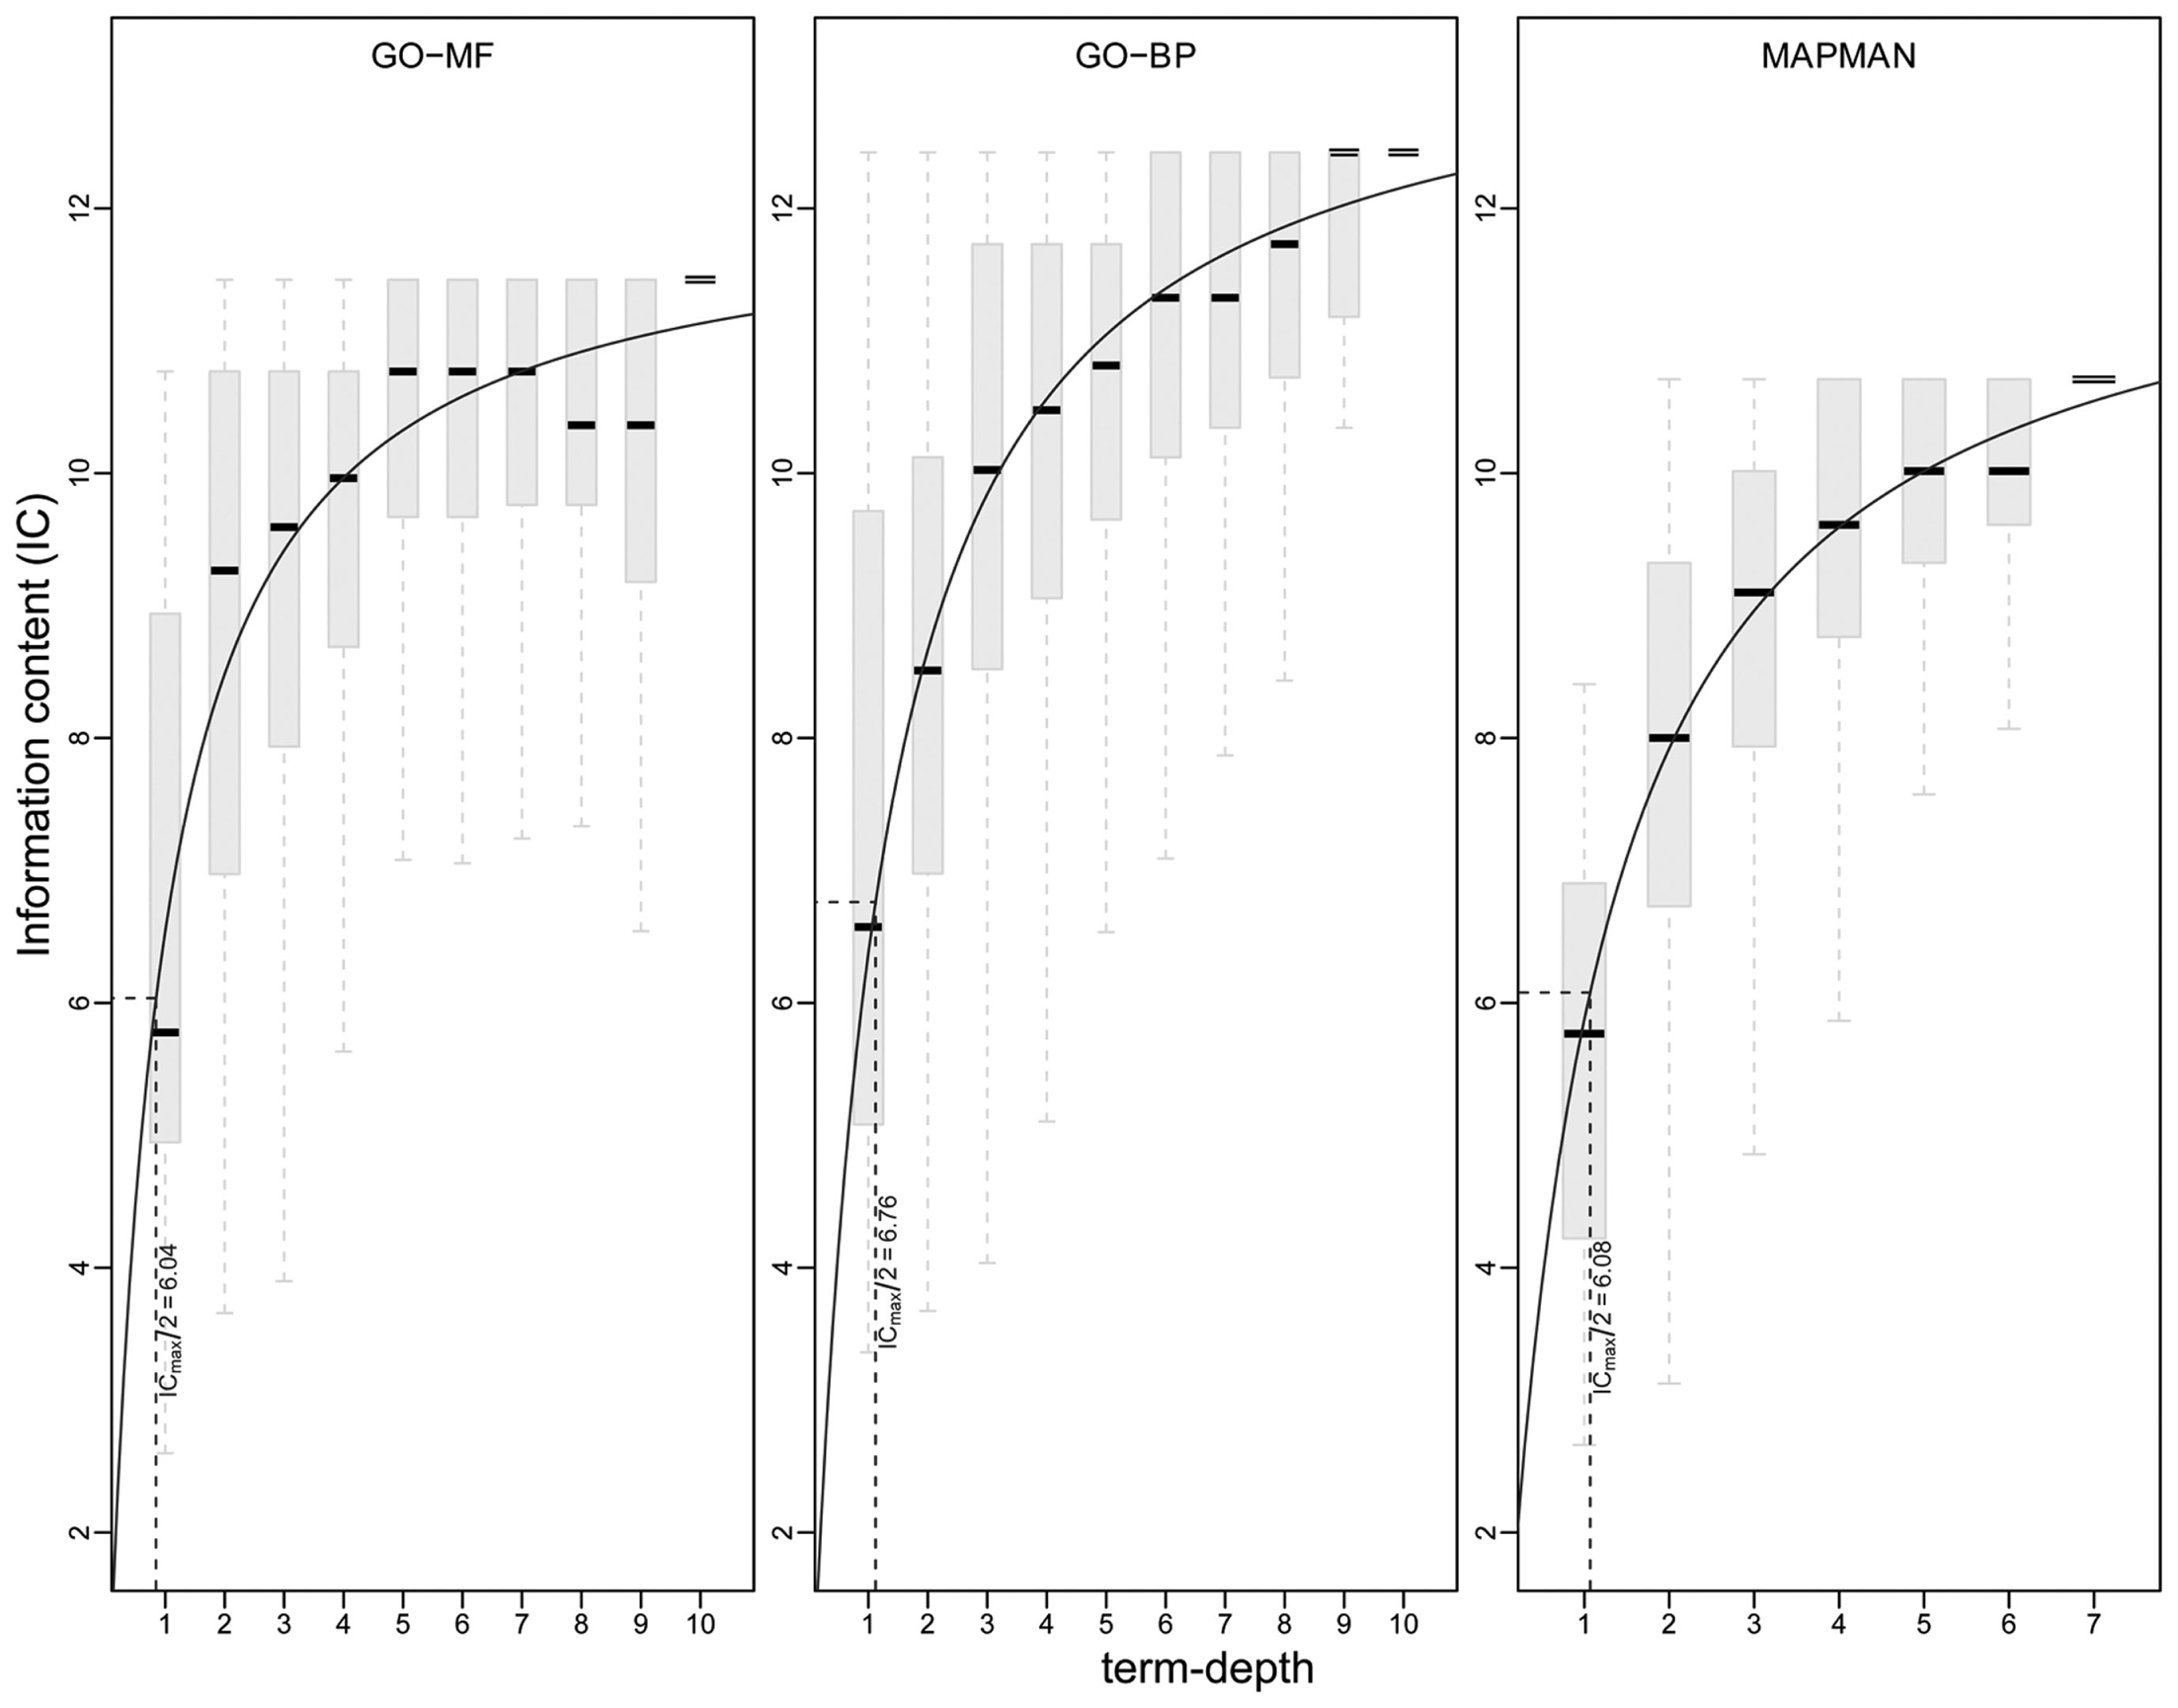
Visualization of information content (y-axis) at a given term depth (x-axis) for GO-MF (left), GO-BP (middle), and MapMan (right). A non-linear regression is used on the medians of the information content per concept depth following Michaelis-Menten kinetics (solid line). The constant Vmax/2 is shown by dotted lines (see main text for details).
Employing MapMan and GO for automated gene function annotation – the case study of Arabidopsis
The current incompleteness of available gene annotation for Arabidopsis clearly emphasizes the need for automated gene function prediction, even in the case of well-studied model organism. In addition to sequence similarity, gene co-expression analysis employing genome-wide transcriptomics data across tissues or in response to environmental perturbation has become a valuable tool to predict gene function based on the GBA principle (Klie et al., 2010). The transfer of function annotations between two genes, exhibiting similar profiles, according to GBA is now a standard procedure for gene function prediction. Furthermore, gene co-expression networks have emerged as a powerful representative of the structure of similarity of transcriptomic profiles, and are readily employed for intra-species transfer of gene annotations following GBA (e.g., in the field of plant science see, Obayashi et al., 2009; Mutwil et al., 2010; Mochida et al., 2011).
Due to the previously described difference in the structure of GO and MapMan, we next evaluate the effect of these characteristics on the performance of gene function prediction by using a GBA-based network-driven approach. To this end, we employ a transcriptomic data-set of 273 publicly available Arabidopsis microarray experiments to construct a gene co-expression network (see Materials and Methods). We rely on the approach described in Mutwil et al. (2011) to obtain a co-expression network which is based on robust statistical parameter estimation combined with successive optimization of the biological relevance of the obtained network. In the co-expression network, the nodes correspond to Arabidopsis’ genes, and edges are established if the incident nodes (i.e., genes) are mutually in the top 30 most similar genes. The similarity is assessed by the Pearson correlation coefficient, and this approach, termed highest reciprocal rank, has already been characterized to optimally capture functional annotation of co-expressed genes (Obayashi and Kinoshita, 2009).
In the following, we rigorously extend this method to allow for a network-based prediction method of gene annotation by employing the method of majority voting (cf. Materials and Methods). In majority voting, the annotations of all adjacent nodes (i.e., immediate neighbors) of a given gene are ordered in a list, from the most to the least frequently appearing (Schiwikowski et al., 2000). The function of an unannotated gene is then predicted by the first k functions in the list. Note that k is a user-specified parameter. Although the approach is very simple, it is exceptionally fast and can serve as an excellent reference for the amount of local information captured by the network due to the consideration of annotations of immediate neighbors.
To generate and verify predictions of annotation with both ontologies, we conduct the following simulation: We first select the genes which are annotated with concepts from each of the three ontologies, i.e., MapMan, GO-MF, and GO-BP, which resulted in 9,994 genes. Moreover, the annotation provided in all three ontologies for a set of randomly chosen genes is discarded. To this end, the number of this artificially unannotated genes is set to be 4,000, corresponding to a fraction of ∼40% genes of unknown function. This scenario closely resembles the current state of Arabidopsis’ gene annotation. For these genes, prediction of gene annotation is obtained by using each one of the three ontologies. The predictions of the top k∈[1,20] most abundant concepts in the network vicinity are evaluated for their performance based on the original discarded annotation. For every k most abundant concepts from the unannotated genes, this procedure is repeated 1,000 times, such that in every iteration a different set of randomly unannotated genes is sampled. Note, that all three used ontologies were preprocessed so that for each gene all parent terms are included. Moreover, to avoid trivially correct predictions, such as the root terms of GO-MF and GO-BP, we do not consider the root terms as well the 20 less informative terms (based on the IC; see Materials and Methods). The predictions are summarized by precision and recall, two widely used performance measures in information retrieval and binary classification (Baeza-Yates and Ribeiro-Neto, 1999), as well as by their harmonic mean, the F-measure. On the other hand, we evaluate the biological relevance of the obtained predictions by investigating the normalized IC (with respect to the maximum) and the depth of the top k, k∈[1,20] predicted terms. Additionally, we also report the number of genes for which a prediction can be obtained following this procedure.
Figure 8 summarizes the acquired prediction performance results for all three employed ontologies. One can observe that the use of MapMan exhibits an advantage in the performance of gene function prediction, as the combined F-measure is the highest over the whole range of top k, k∈[1,20] concepts (the exception is the case of k = 20, where the F-measure is zero, due to the lower number of terms in MapMan). This is mainly due to a higher average recall, i.e., a higher fraction of all the originally concepts, used in the annotation of a gene, that were successfully retrieved. Nevertheless, the average precision between GO and MapMan is comparable, indicating that the ratio of correctly predicted concepts to all predicted concepts is similar across all three ontologies.
Figure 8
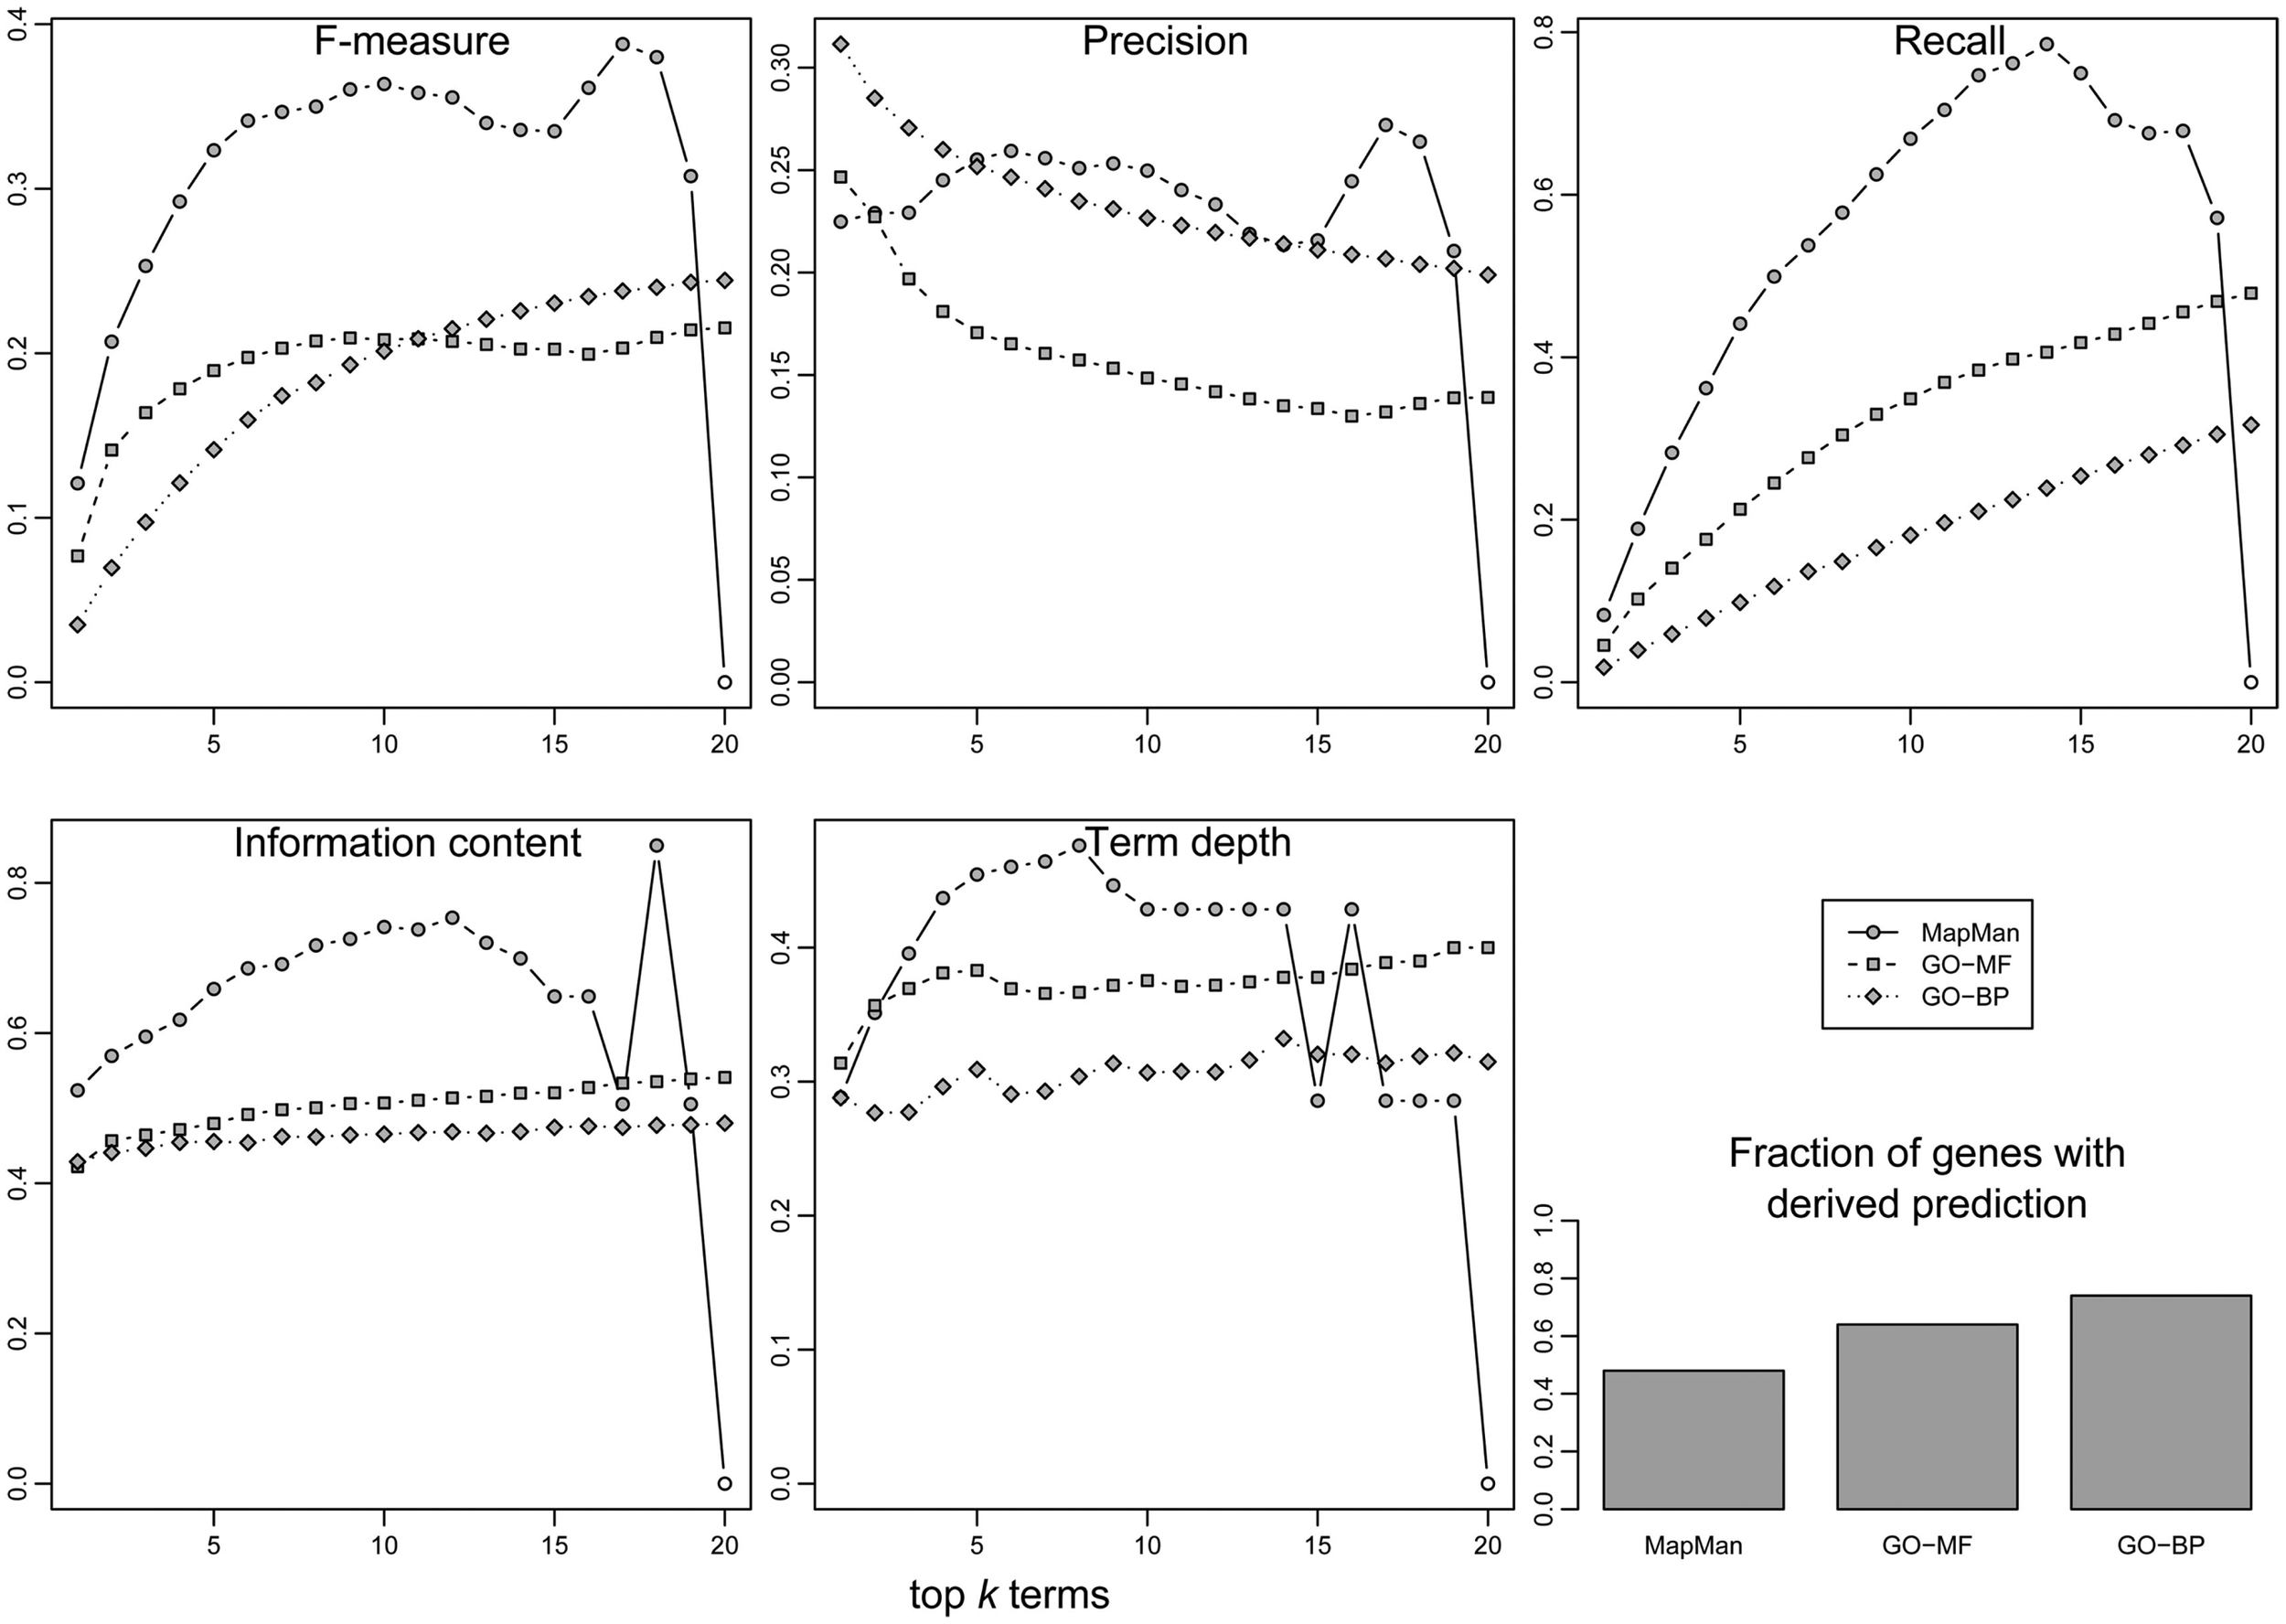
Evaluation of prediction performance (y-axis) for gene function annotation using the three ontologies. Three classical performance indices from information retrieval were employed: F-measure (upper-left), precision (upper-middle), and recall (upper-right). In addition, the information content (lower-right), and the concept depth relative to the maximum depth within the respective ontology (lower-middle) of predicted concepts were evaluated. In all cases, the 20 most abundant concepts (x-axis) in an unknown gene’s neighborhood are evaluated. Finally, the fraction of unknown genes for which a prediction could be derived is given (bar plot, lower-right).
Correspondingly, the average IC and depth of concepts is generally higher in the case of MapMan, which implies a higher biological relevance or specificity of the predicted terms (Figure 8). However, both GO ontologies perform better with respect to the fraction of genes for which any prediction of gene annotation can be derived, i.e., 51% for MapMan vs. 64 and 73% for GO-MF and GO-BP, respectively. This suggests that the distribution of genome annotation is less clustered and more homogeneous.
Discussion
Here, we provided the first comparative analysis of two ontologies, GO, and MapMan, both widely used in plant biology studies. The first part of the comparison comprises the structural characteristics of the ontologies, namely: the type of concepts and relationships between them as well as the design principles underlying GO and MapMan. Our findings were in support of the claim that higher level bins in MapMan correspond to terms of GO-BP, while lower level bins are more similar to terms of GO-MF. Regardless of these analogies, GO offers the possibility to also investigate gene products with respect to their spatial distributions, captured in the terms of the third GO ontology – cellular component (GO-CC). In contrast, MapMan does not facilitate spatial analysis of genes and the downstream processes (e.g., metabolism). Nevertheless, although cellular processes and molecular functions are represented well in both GO and MapMan, temporal changes during plant development, fruit ripening, or progression of stress are in their nascent stages. Therefore, future developments in plant-specific ontologies should consider integrating the indicated spatial and temporal dimensions indispensable for accurate description of molecular processes in plants.
In the second part of the study, we investigated the annotation corpus of Arabidopsis’ genes and carried out a detailed comparison of the two ontologies with respect to the information content of the respective concepts, i.e., bins in MapMan and terms in GO. It turned out that MapMan, GO-BP, and GO-MF exhibited similar relationships between information content and depth of concepts. In conjunction with the plethora of existing tools for computational analyses based on both ontologies, our results indicated that both ontologies may be equally suitable with respect to the biologically meaningful information that could potentially be extracted.
Finally, we used the two ontologies as a principle source of information in the context of automated gene function prediction following the GBA principle on co-expression networks. The co-expression networks were created by using publicly available transcriptomics data sets for Arabidopsis, and provided the medium for local propagation of concepts to unannotated genes in the vicinity of a given well-characterized gene. To this end, we used the simplest available alternative for automated function annotation given by the majority voting. Although our findings that MapMan outperformed GO with respect to function annotation depend on the algorithm for annotation transfer, we believe that they are robust as most of the available algorithms rely on propagation of local information only. While MapMan’s tree hierarchy at a first glance appears to be flatter, as assessed by term depth, and IC, in comparison to GO’s DAG structure, MapMan’s design tailored to Arabidopsis is most likely reflected in the improved performance in gene function prediction. In contrast to MapMan, GO represents a more generic ontology, reflected in its changing structure and gene annotation. Since no other plant model organism is currently equally well-annotated by GO and MapMan as it is the case for Arabidopsis, no general conclusions for plant species can be made. Nevertheless, what remains to be investigated is the effect of the distribution of annotated genes in the network. In other words, we expect that choice of the ontology for automated gene function annotation will ultimately depend on the dispersion of patches of annotated nodes (following the focused biological interest in genes of particular process/function).
Last but not the least, the major implication of our study is that the choice of which ontology to be used computational analyses is problem-specific, as it highly depends on the interplay between the structural properties of the ontology, the size, and quality of the annotation corpus, using the ontology, as well as the employed multivariate data. Therefore, we believe that aside from the comparison of ontologies based on intra-ontology characteristics (e.g., distribution of information content), our study emphasizes the need for another criterion – namely, the biological question to be answered by using ontologies, for instance, comparison of plant developmental stages, or plant-specific structures and the here addressed gene annotation. This, of course, may open yet another field of bioinformatics research related to the design of sound methods for ontology selection suitable for a particular problem at hand. In this respect, we believe that the suggested direction may result in development of (external and internal) measures for problem-specific comparison of ontologies and their performance – an issue which was already addressed in other research areas (e.g., data clustering, retrieval in audio and video databases). Taken altogether, the identified issues warrant caution in extending ontologies from model to other species and suggest that this may be most appropriately performed in a careful semi-automated manner.
Materials and Methods
Arabidopsis transcriptomics data-set and reconstruction of a gene co-expression network
The employed transcriptomic data-set used to derive the gene co-expression network consist of 279 of publicly available microarray experiments (Affymetrix Ath1 gene-chip, 22,500 probe sets) obtained from the Gene Expression Omnibus2 (Edgar et al., 2002). Note, that this is the same transcriptomics compendium which is used in the PlaNet co-expression analysis platform (Mutwil et al., 2011). Initially, a total of over 6,000 microarray experiments were downloaded and the quality of each individual microarray experiment was ensured by an automated outlier detection and quality control. Here, the R Bioconductor package array Quality Metrics (Kauffmann et al., 2009) was employed to conduct (1) between-array comparisons based on distance between arrays and Principal Component Analysis, (2) inspection of array-wide probe intensity distributions by boxplots and density plots, (3) variance-mean dependence of each array, and (4) individual array quality assessment by MA plots. After this preprocessing, 1,707 microarrays were retained. Furthermore, this transcriptomics compendium was reduced by selecting a subset of experiments comprising 273 microarrays. This is performed to remove any bias arising through (potentially) un-informative or repetitive data while preserving the overall structure of the transcriptomics compendium (Mutwil et al., 2011). Briefly, this selection strategy is based on the Subset Selection problem from linear algebra, whereby, for a given number l and a matrix A, one is to find the subset of l columns from A which are most mutually independent. Here, columns of the matrix A denote individual microarray experiments (1,707 in total), rows correspond to genes, such that each matrix entry represents the corresponding gene expression levels. Application of the outlined selection procedure yielded 279 microarrays which were subsequently normalized using quantile normalization via the simpleAffy R package. This data-set was used to reconstruct the co-expression network and is available in the Table S1 in Supplementary Material.
Preprocessing of ontologies – removal of inconsistencies and integration of parent concepts
As sources of mapping genes to ontology terms in Arabidopsis, we employed the latest versions available for MapMan (Version 1.1 from January 2010)3 and GO (Version 2.5 from September 2010, available via the R package ath1121501.db4). Within these mappings, a total of 15,238 gene products are annotated with MapMan bins and 12,225 and 13,157 genes are annotated by GO-BP and GO-MF terms, respectively. However those raw mapping files contain inconsistencies: while the annotations for some genes contain only the most specific concepts, i.e., terminal or leaf concepts with no further child concepts, others are additionally annotated with parent concepts. As an example, consider the genes annotated with the MapMan bin “29.5.11.4.2” corresponding to “protein.degradation.ubiquitin.E3.RING” in Arabidopsis. This bin is a leaf or terminal concept, i.e., it has no children. One gene that is annotated with this concept is a member of the ARM repeat superfamily (locus ID at1g71020) and is additionally annotated with the parent bin “29.5.11” corresponding to “protein degradation ubiquitin.” However, other genes annotated with the bin 29.5.11.4.2, for instance EDA40 (at4g37890), are only annotated with the leaf bin “29.5.11.4.2” missing the mapping to any parent bins, e.g., 29.5.11.4 or 29.5.11. Likewise, similar examples hold for both GO domains, GO-MF, and GO-BP. In total, 25 of such inconsistencies can be identified for MapMan and 3,750 and 2,202 for GO-MF and GO-BP, respectively.
The effect of an incomplete mapping which includes only partially – or even not at all – parent concepts is twofold: first, the analysis by means of IC of a concept would lead to incorrect results since the IC of a concept is dependent on the number of genes associated with it. By definition of an ontology, a gene annotated with a low-level concept should automatically be annotated with all of the ancestral terms, too (Figures 1 and 9). Only considering the concept-gene association counts in a raw ontology will lead accidentally to erroneous results for the derived ICs; in this case leaf or terminal concepts might exhibit a higher IC than their parent terms (Klie et al., 2010). Second, for the purpose of gene function prediction in majority voting, common ancestor terms of the neighboring genes are of great importance. In the case that the annotation of all neighboring genes is a disjoint set of low-level concepts, no majority vote can be found (cf. Figure 9D). However, the gene’s neighbors can share common parent concepts that can help in deriving predictions for the gene in question. Although the derived annotation might not be as specific, the prediction of a high-level concept suggesting the putative involvement in processes or pathways is preferred to obtaining no prediction at all. To resolve the problem of incomplete mappings, we preprocessed all three ontologies so that for each gene, the complete list of parent terms is included. Note, that those parent terms can readily be identified by enumerating the respective DAG or tree structure defined by is a or part of relations (Figures 9A,B). We further define these modified mappings as “complete ontologies”.
Figure 9
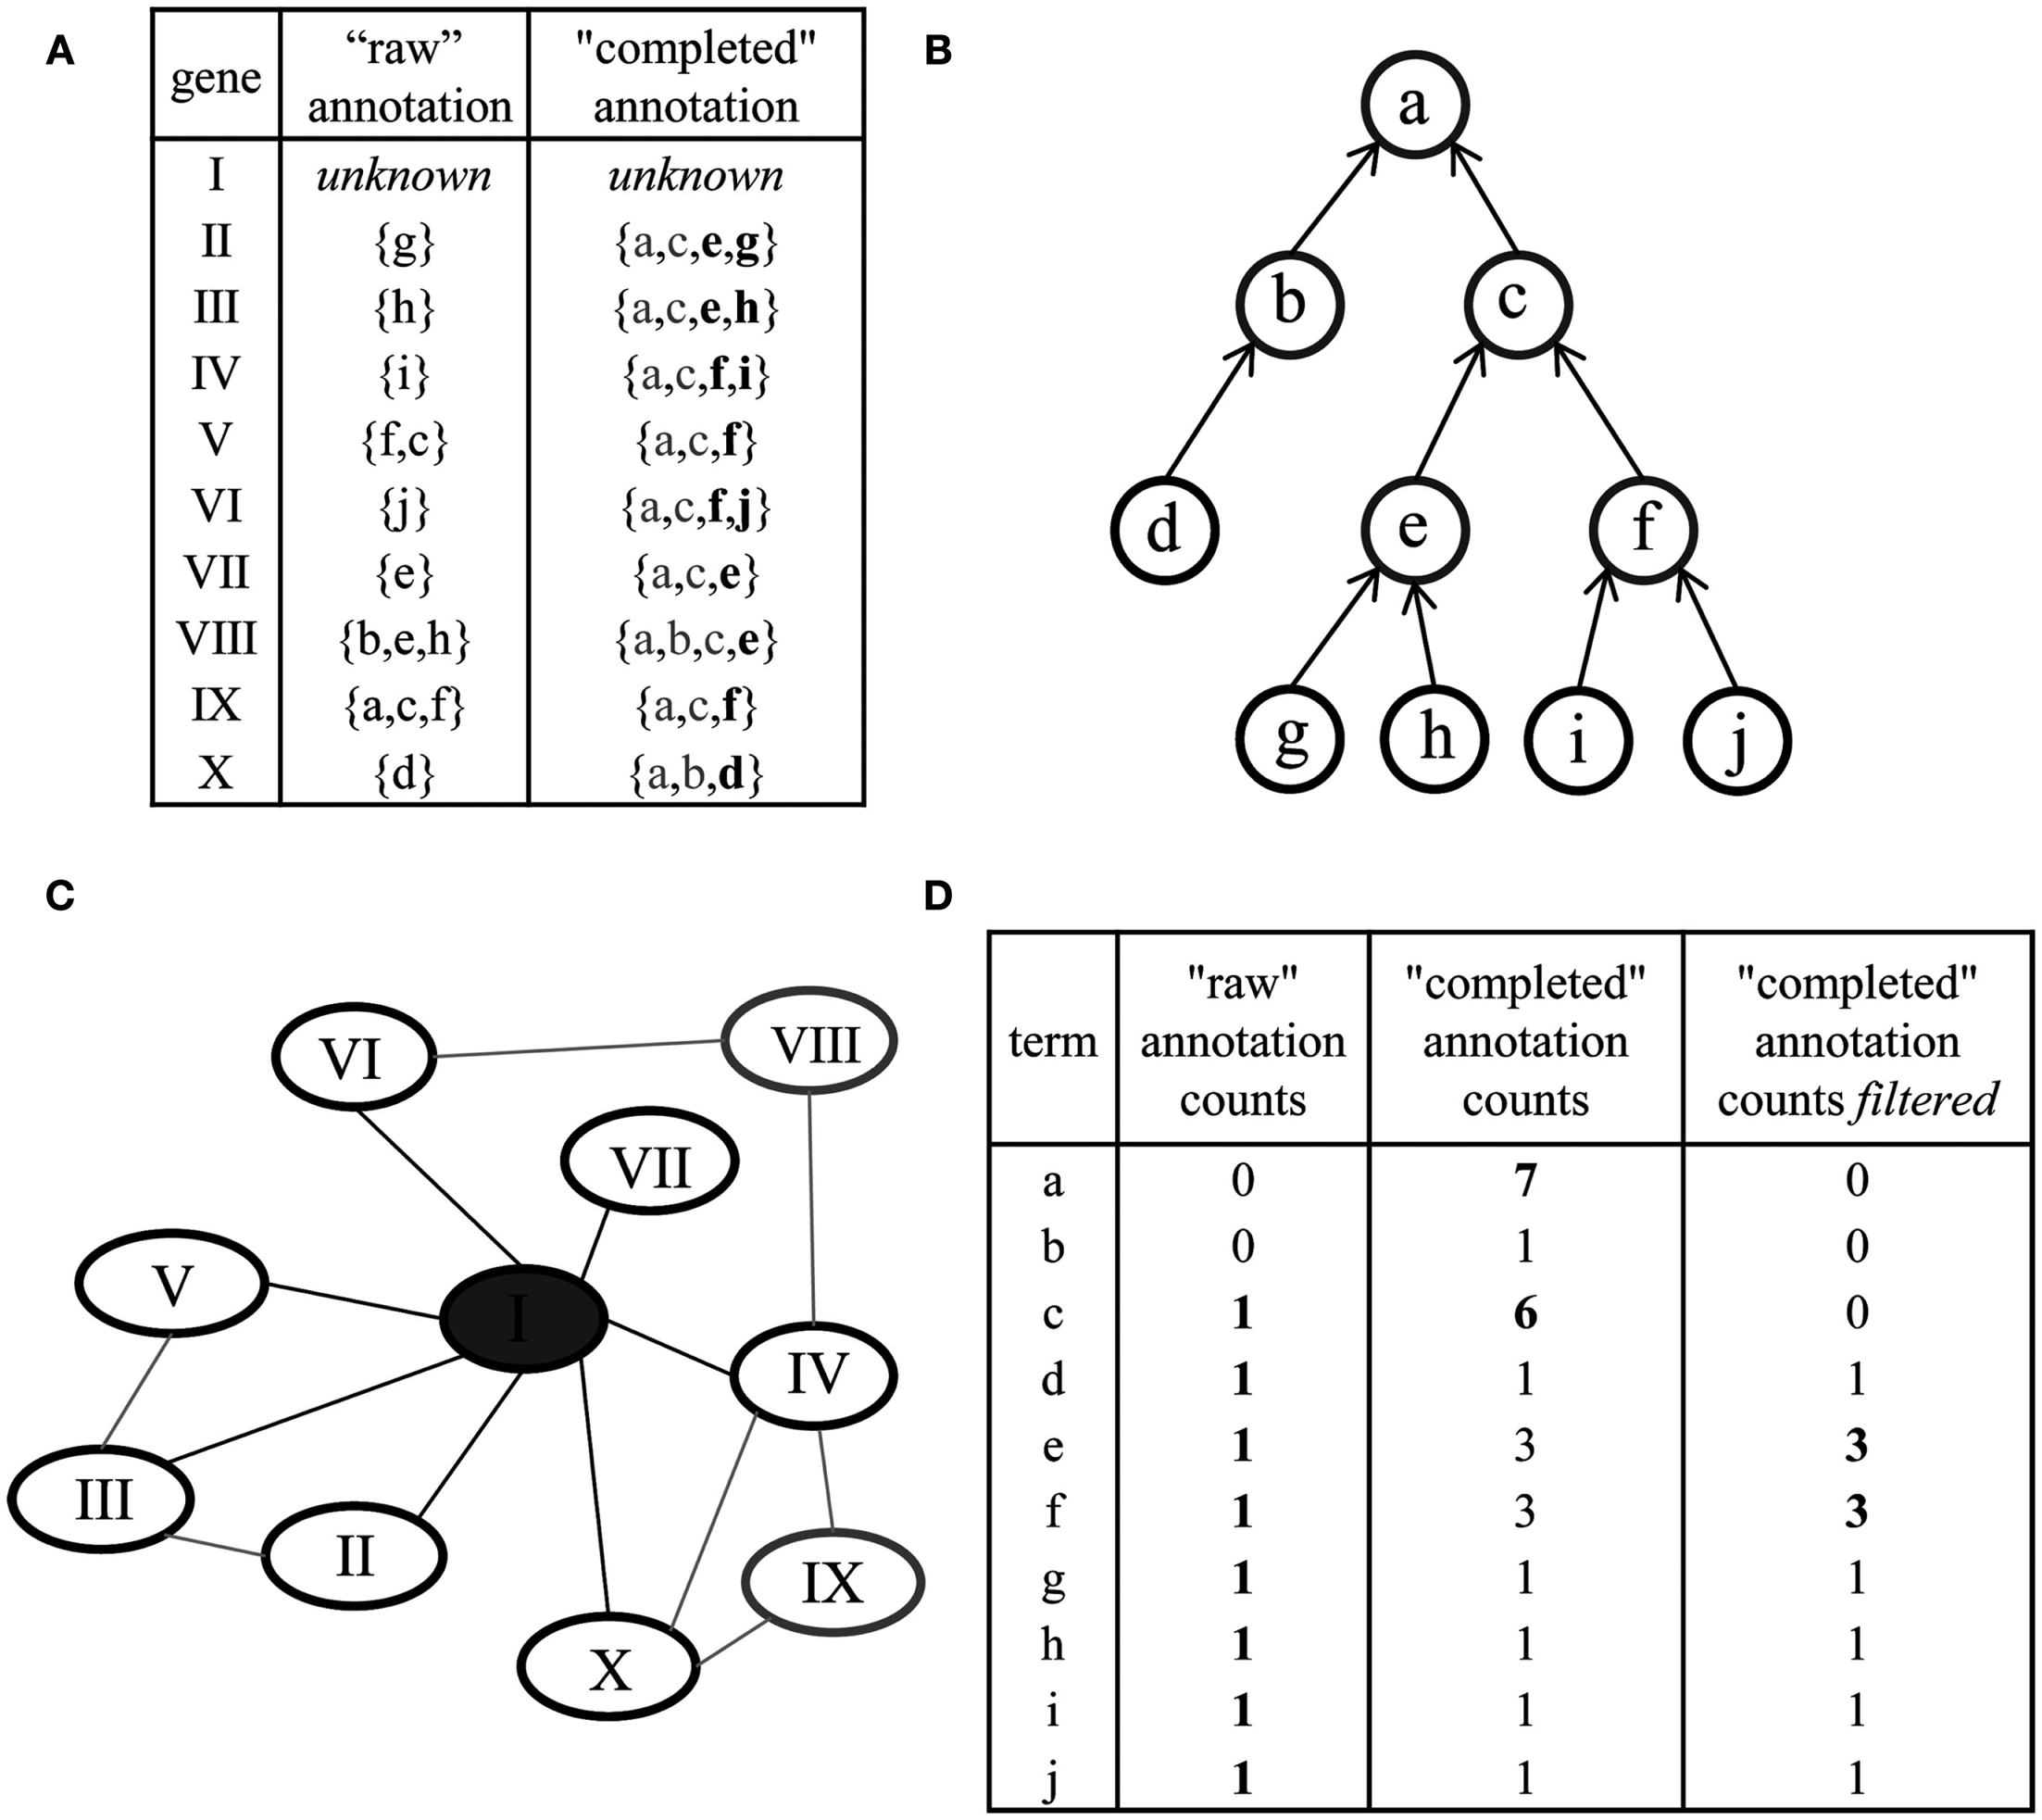
Preprocessing of ontologies and network-based gene function prediction by majority voting. (A) The original annotation of genes (“raw” annotation) and corresponding concepts (denoted by letters) is extended for each gene by including all parent concepts. The latter is referred to as “completed” annotation. Additional filtering can be performed to remove concepts annotated by many genes (gray letters). (B) Parent terms can be readily obtained by traversal of the ontology structure (a node represents a concept, an arrow an is a or part of relationship among concepts; terminal or leaf concepts are denoted in black). (C) Gene function prediction of the unknown gene, denoted by I, by using the majority voting approach: the annotation of all immediate neighbors in a co-expression network (black ellipses) is considered. (D) Deriving a prediction for the gene I by ranking the annotation obtained through its neighbors. By using the raw annotation, unambiguous prediction cannot be derived (left column); the “completed” annotation aids in deriving meaningful predictions by considering concepts intermediate in the hierarchy (e.g., concept c, middle column); additional filtering (right column) further improves the prediction (“optimized ontology”).
Finally, the preprocessing involved removal of control and unknown probe sets, which corresponds to probes associated with MapMan bins 0 and 35 (“control” and “unknown”/“not assigned”) and all their child bins.
Evaluation of ontology structure and information content
We employ two measures to characterize the structure and the characteristics of an ontology – the depth and the information content (IC) of concepts.
Given a directed acyclic graph G = (V, E), which defines the relationships of concepts within an ontology, where V is a set of vertices, E is a set of edges, the depth of a term x is given by the distanced(x, r) between the two vertices x and r, where node r corresponds to the root concept of the ontology. Furthermore, the distance is defined as the length of the shortest path from x to r (Bondy and Murty, 2008). Note that node r represents the root term which is explicitly defined for GO-BP as and GO-MF and which can be implicitly defined for MapMan by adding an artificial root node, i.e., bin r.
The IC of an ontological concept c is defined as IC(c) = -log2(|Gc|/|Gall|), where Gc is the set of genes annotated with the concept c and Gall is the set of genes annotated with any of the concepts in the ontology (Resnik, 1995).
Determining similar concepts across ontologies
To quantify the similarity of two concepts c1 and c2, we use the Jaccard similarity coefficient of the set of genes G1 annotated with concept c1in MapMan and the set of genes G1 annotated with concept c2 in GO. The Jaccard similarity coefficient for two sets G1 and G2 is defined as sim(c1,c2) = J (G1,G2) = |G1∩G2|/|G1∪G2|. As 50% of all MapMan and GO concepts describe four or more genes, we consider only concepts of MapMan and GO that are annotated with at least four genes (i.e., |G1| and |G2| > 3) to avoid identifying similar concepts based on individual genes.
In addition, to analyze the pair-wise similarity over all concepts, we create a network in which nodes correspond to concepts and edge are established between two nodes c1 and c2 if sim (c1, c2) ≥ 0.6. Note, that despite its numerical value, this threshold is rather strict as it refers to only the highest 1% of all observed pair-wise concept similarities, not only between MapMan and GO but also within the respective ontologies. Nodes corresponding MapMan bins that are not connected to a node denoting a GO term are discarded. Finally, the edges of the resulting network can be divided by the type of association between nodes they model: the similarity between a MapMan bin and GO-BP term, a MapMan bin and GO-MF term as well as a MapMan bin and both GO-MF and GO-BP terms. For each of those three derived types of associations, the average bin depth of MapMan bins is determined and the statistical significance of the difference of means within the first two groups (MapMan/GO-MF, MapMan/GO-BP) is derived via Wilcoxon-Rank-Sum test (Sokal and Rohlf, 2003).
Gene function prediction using network-based majority voting
Majority voting is one of the simplest, yet fastest, network-based gene function prediction methods (Schiwikowski et al., 2000). Particularly, its reliance on the immediate neighborhood of a given node renders it applicable in estimating usefulness of local information on gene function prediction.
Here, the network consists of nodes corresponding to the genes included in the aforementioned Arabidopsis transcriptomics compendium. The necessary steps to transform similarity of gene expression profiles to edges between genes in a final co-expression network rely on the approach presented in Mutwil et al. (2011). In summary, this approach is comprised of ranking pair-wise gene expression profiles by the Pearson correlation coefficient. Successively, the application of statistical tests is conducted to determine the optimal cut-off (range) for the reciprocal ranks which translate into establishing edges between the nodes in the network. Moreover, an optimality principle is employed to select a set of best-performing parameter values with respect to the GBA principle. To this end, we conduct an iterative search on the allowable ranges for the reciprocal ranks that maximize the similarity of gene function in the neighborhood of a given gene/node. A highest reciprocal rank (HRR) cut-off between 10 and 30 produced biologically relevant networks (Mutwil et al., 2010). However, while >80% of the nodes were disconnected for HRR = 10, and consequently excluded from any further co-expression analysis, a HRR = 30 was chosen as the number of disconnected nodes decreased to 25%. Note, that by relying on ranks of derived from pair-wise correlations of gene expression profiles, no explicit threshold for the Pearson correlation coefficient is needed. This is nicely illustrated by the range of Pearson correlation coefficients of expression profiles of a pairs of genes with a HRR of 30 which varies from 0.32 to 0.9 depending on the individual gene. The advantage of using HHR rather than the simple pair-wise correlation is that co-expression analysis by HRR uncovers more meaningful biological associations (Aoki et al., 2007).
The obtained co-expression network is composed of 9,994 nodes, which correspond to those genes in Arabidopsis’ genome that are annotated with a set of concepts from all three ontologies, i.e., MapMan, GO-BP, and GO-MF. This network consists of 461 connected components of which 439 are singleton genes, i.e., nodes with no adjacent edges, and exhibits a density of 0.001. The largest component contains 9,506 nodes and the average degree of a node is 10.36. To simulate the effect on gene function prediction depending on the ontology used, the annotation provided in all three ontologies for a set of randomly chosen genes is discarded. To this end, the number of this artificially unannotated genes is set to be 4,000, a fraction corresponding to the ∼40% genes of unknown function in Arabidopsis.
For each of the 4,000 genes, the annotations of all adjacent nodes are derived using the completed ontology and ordered in a list, separately for all three ontologies. Every concept present in the annotation of neighboring nodes is ranked from the most to the least frequently appearing within the neighborhood (Figure 9). The function of an unannotated gene is then predicted by examining the first k functions in the list. Here, we consider the predictions of the top k∈[1,20] most abundant concepts in the network vicinity and successively evaluate them by comparing the predicted terms to the original discarded annotation. This procedure is repeated 1,000 times, such that in every iteration a different set of randomly unannotated genes is sampled and evaluated for every k most abundant concepts.
Furthermore, we removed those 20 concepts (corresponding to the choice of parameter k) with the lowest IC from all three complete ontologies. The aim of this filtering step is to avoid deriving trivial annotation (e.g., the root concepts of the ontologies) or unspecific annotations (e.g., very broad, high-level biological concepts) as predictions. We note that although those high-level terms are technically correct in terms of prediction, their benefit in characterizing a gene of unknown function is limited (cf. Figure 9D). An example of terms exhibiting a low IC are within the GO-BP sub-ontology “biological process” (GO:0008150), i.e. the root term or “transport” (GO:0006810). For GO-MF, examples of removed terms include “binding” (GO:0005488) and, again, the root node “molecular function” (GO:0003674). In contrast, more specific concepts of higher IC are unaffected by this filtering step. These include, for instance, the children of the term “binding” which are “secretion” (GO:0046903) and “ion transport” (GO:0006811). These modified ontologies are termed “optimized ontologies” and further used for evaluation of the prediction performance (Figure 8). Finally, the effect of this optimization step on gene function prediction is illustrated in Figure 10: A raw ontology only contains some of the ancestral concepts resulting in a lower prediction performance (F-measure; similar results hold for precision and recall; data not shown) and average term depth of predicted concepts (similar results hold for the average IC of predicted terms; data not shown). In contrast, the complete ontology includes all ancestral concepts defined in the respective ontology, resulting in an increase of prediction performance; however, it is accompanied by a lower term depth of predicted concepts. The optimized ontology removes ambiguous terms, i.e., terms of high IC, and represents a compromise between good prediction performance and specificity of derived predictions. Interestingly, MapMan profits the most from the proposed optimization strategy.
Figure 10
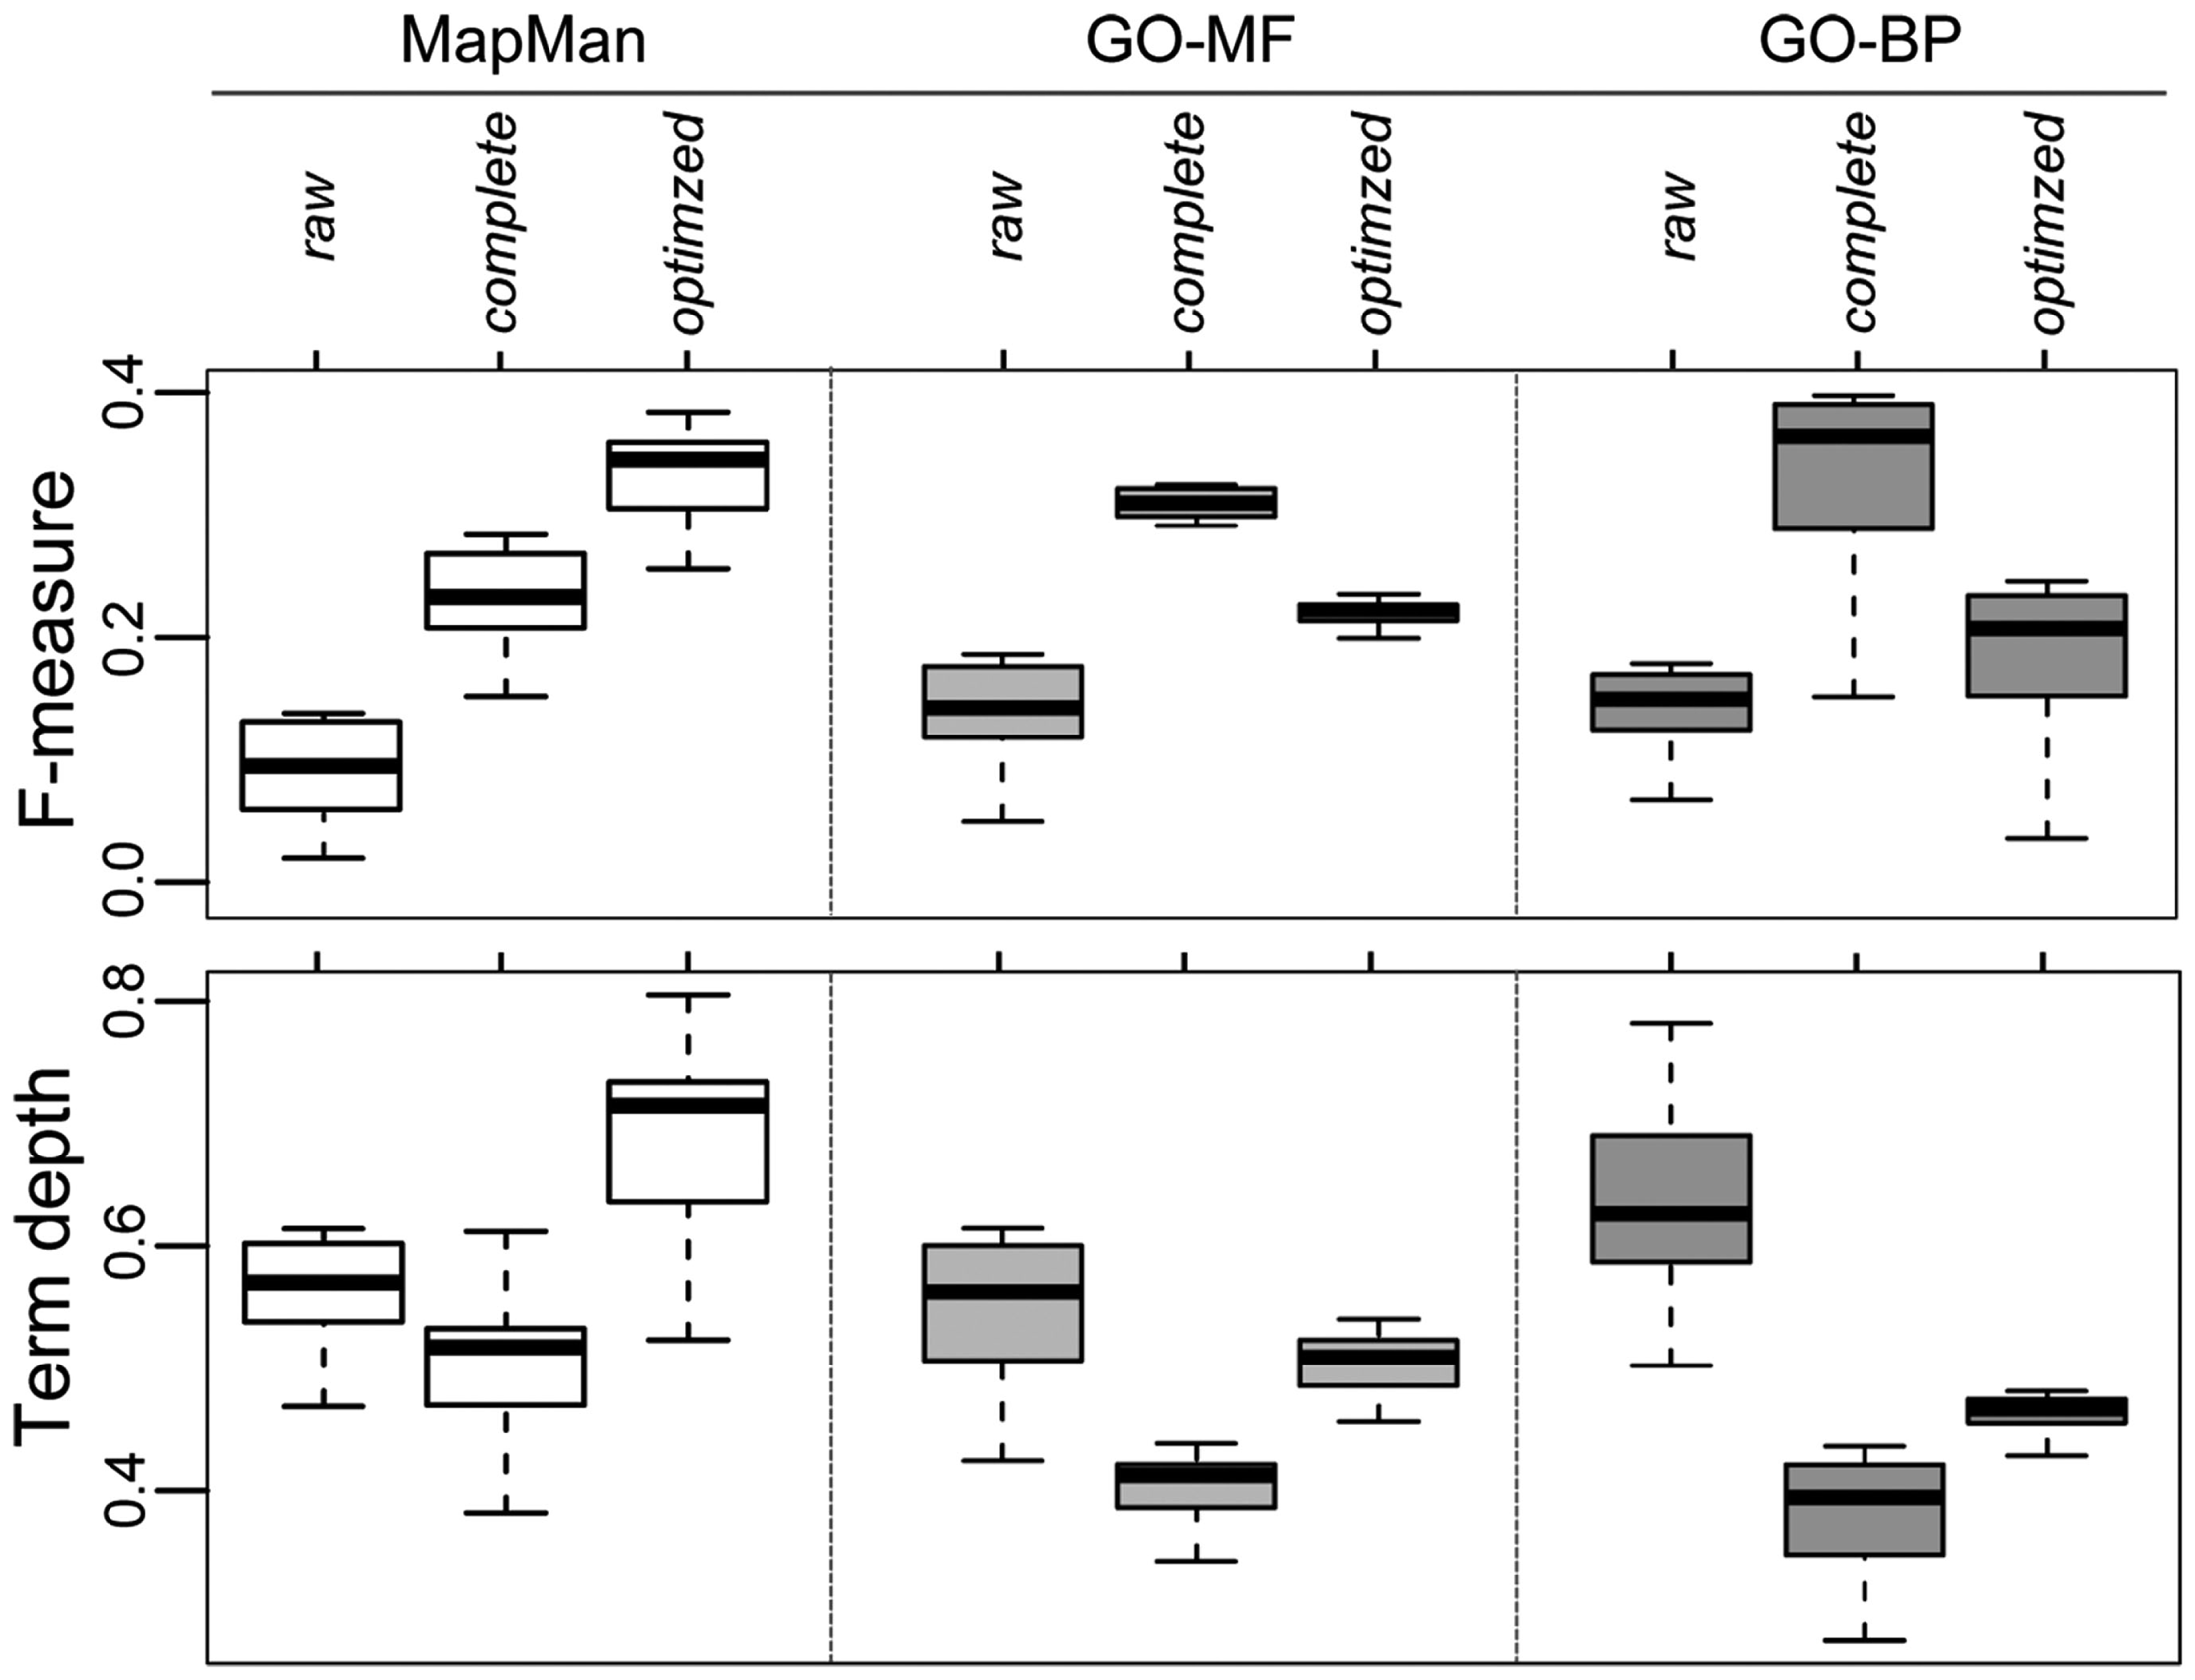
Effect of the preprocessing of ontologies (cf. Figure 9) and the impact on network-based gene function prediction by majority voting for all three ontologies quantified by the F-measure (upper panel) and the normalized depth of term/concept (lower panel) separately for raw, complete and optimized versions of the ontologies.
Evaluation of gene annotation prediction performance
The quality of the predicted ontological concepts for genes is evaluated by two complementary strategies. While the first strategy comprises the use of classical quality measures from the field of pattern recognition and information retrieval that assess the correctness of predicted terms, the second strategy seeks to quantify the quality of those derived predictions in terms of biological relevance. Again, the previously established concepts of term depth and IC are employed for this task. Note that for the purpose of comparative evaluation, both term depth and IC are normalized to the respective maximum value encountered within the particular ontology.
For a single gene, the prediction performance for a set of derived concepts, Cp, is used in defining the precision as:
where Ca denotes the set of originally annotated concepts. Furthermore, we define the recall of the prediction of concepts for the gene as:
Finally, we rely on the F-measure as a combined performance index, defined as the harmonic mean of precision and recall:
In the case of precision = recall = 0, we take F = 0. Note, that the values for all three performance indices correspond to the average of precision, recall, and F-measure, respectively, for all artificially unannotated genes over 1,000 iterations.
Supplementary Material
The Supplementary Material for this article can be found online at http://www.frontiersin.org/Bioinformatics_and_Computational_Biology/10.3389/fgene.2012.00115/abstract
Statements
Conflict of interest
The authors declare that the research was conducted in the absence of any commercial or financial relationships that could be construed as a potential conflict of interest.
Footnotes
References
1
Adams M. D. Celniker S. E. Holt R. A. Evans C. A. Gocayne J. D. Amanatides P. G. Scherer S. E. Li P. W. Hoskins R. A. Galle R. F. George R. A. Lewis S. E. Richards S. Ashburner M. Henderson S. N. Sutton G. G. Wortman J. R. Yandell M. D. Zhang Q. Chen L. X. Brandon R. C. Rogers Y.-H. C. Blazej R. G. Champe M. Pfeiffer B. D. Wan K. H. Doyle C. Baxter E. G. Helt G. Nelson C. R. Gabor G. L. Miklos X. Abril J. F. Agbayani A. An H.-J. Andrews-Pfannkoch C. Baldwin D. Ballew R. M. Basu A. Baxendale J. Bayraktaroglu L. Beasley E. M. Beeson K. Y. Benos P. V. Berman B. P. Bhandari D. Bolshakov S. Borkova D. Botchan M. R. Bouck J. Brokstein P. Brottier P. Burtis K. C. Busam D. A. Butler H. Cadieu E. Center A. Chandra I. Cherry J. M. Cawley S. Dahlke C. Davenport L. B. Davies P. Pablos B. D. Delcher A. Deng Z. Mays A. D. Dew I. Dietz S. M. Dodson K. Doup L. E. Downes M. Dugan-Rocha S. Dunkov B. C. Dunn P. Durbin K. J. Evangelista C. C. Ferraz C. Ferriera S. Fleischmann W. Fosler C. Gabrielian A. E. Garg N. S. Gelbart W. M. Glasser K. Glodek A. Gong F. Gorrell J. H. Gu Z. Guan P. Harris M. Harris N. L. Harvey D. Heiman T. J. Hernandez J. R. Houck J. Hostin D. Houston K. A. Howland T. J. Wei M.-H. Ibegwam C. Jalali M. Kalush F. Karpen G. H. Ke Z. Kennison J. A. Ketchum K. A. Kimmel B. E. Kodira C. D. Kraft C. Kravitz S. Kulp D. Lai Z. Lasko P. Lei Y. Levitsky A. A. Li J. Li Z. Liang Y. Lin X. Liu X. Mattei B. McIntosh T. C. McLeod M. P. McPherson D. Merkulov G. Milshina N. V. Mobarry C. Morris J. Moshrefi A. Mount S. M. Moy M. Murphy B. Murphy L. Muzny D. M. Nelson D. L. Nelson D. R. Nelson K. A. Nixon K. Nusskern D. R. Pacleb J. M. Palazzolo M. Pittman G. S. Pan S. Pollard J. Puri V. Reese M. G. Reinert K. Remington K. Saunders R. D. Scheeler F. Shen H. Shue B. C. Sidén-Kiamos I. Simpson M. Skupski M. P. Smith T. Spier E. Spradling A. C. Stapleton M. Strong R. Sun E. Svirskas R. Tector C. Turner R. Venter E. Wang A. H. Wang X. Wang Z. Y. Wassarman D. A. Weinstock G. M. Weissenbach J. Williams S. M. Woodage T. Worley K. C. Wu D. Yang S. Yao Q. A. Ye J. Yeh R. F. Zaveri J. S. Zhan M. Zhang G. Zhao Q. Zheng L. Zheng X. H. Zhong F. N. Zhong W. Zhou X. Zhu S. Zhu X. Smith H. O. Gibbs R. A. Myers E. W. Rubin G. M. Venter J. C. (2000). The genome sequence of Drosophila melanogaster. Science287, 2185–2195.10.1126/science.287.5461.2185
2
Aoki K. Ogata Y. Shibata D. (2007). Approaches for extracting practical information from gene co-expression networks in plant biology. Plant Cell Physiol.48, 381–390.10.1093/pcp/pcm013
3
Ashburner M. (2000). Gene ontology: tool for the unification of biology. Nat. Genet.25, 25–29.10.1038/75556
4
Baeza-Yates R. Ribeiro-Neto B. (1999). Modern Information Retrieval. New York: ACM Press, Addison-Wesley.
5
Bard J. B. L. Rhee S. Y. (2004). Ontologies in biology: design, applications and future challenges. Nat. Rev. Genet.5, 213–222.10.1038/nrg1295
6
Blake J. A. Harris M. A. (2002). “The gene ontology (go) project: structured vocabularies for molecular biology and their application to genome and expression analysis,” in Current Protocols in Bioinformatics, Chap. 23, ed. PageR. D. M. (Hoboken: John Wiley & Sons, Inc.), 7.2.1–7.2.9.
7
Bondy J. A. Murty U. (2008). Graph Theory. New York: Springer.
8
Carbon S. Ireland A. Mungall C. J. Shu S. Marshall B. Lewis S. Hub T. A. Group T. W. P. W. (2009). AmiGO: online access to ontology and annotation data. Bioinformatics25, 288–289.10.1093/bioinformatics/btn615
9
Cherry J. M. Hong E. L. Amundsen C. Balakrishnan R. Binkley G. Chan E. T. Christie K. R. Costanzo M. C. Dwight S. S. Engel S. R. Fisk D. G. Hirschman J. E. Hitz B. C. Karra K. Krieger C. J. Miyasato S. R. Nash R. S. Park J. Skrzypek M. S. Simison M. Weng S. Wong E. D. (2012). Saccharomyces genome database: the genomics resource of budding yeast. Nucleic Acids Res.40, D700–D705.
10
Doehlemann G. Wahl R. Horst R. J. Voll L. M. Usadel B. Poree F. Stitt M. Pons-Kühnemann J. Sonnewald U. Kahmann R. Kämper J. (2008). Reprogramming a maize plant: transcriptional and metabolic changes induced by the fungal biotroph Ustilago maydis. Plant J.56, 181–195.10.1111/j.1365-313X.2008.03590.x
11
Edgar R. Domrachev M. Lash A. E. (2002). Gene expression omnibus: NCBI gene expression and hybridization array data repository. Nucleic Acids Res.30, 207–210.10.1093/nar/30.1.207
12
Goeman J. J. Mansmann U. (2008). Multiple testing on the directed acyclic graph of gene ontology. Bioinformatics24, 537–544.10.1093/bioinformatics/btm628
13
Guzzi P. H. Mina M. Guerra C. Cannataro M. (2011). Semantic similarity analysis of protein data: assessment with biological features and issues. Brief. Bioinformatics. [Epub ahead of print].10.1093/bib/bbr066
14
Harris M. A. Gene Ontology C. (2004). The gene ontology (GO) database and informatics resource. Nucleic Acids Res.32, D258–D261.10.1093/nar/gkh036
15
Kauffmann A. Gentleman R. Huber W. (2009). Array quality metrics – a bioconductor package for quality assessment of microarray data. Bioinformatics25, 415–416.10.1093/bioinformatics/btp354
16
Klie S. Nikoloski Z. Selbig J. (2010). Biological cluster evaluation for gene function prediction. J. Comput. Biol.17, 1–18.10.1089/cmb.2009.0031
17
Lamesch P. Berardini T. Z. Li D. Swarbreck D. Wilks C. Sasidharan R. Muller R. Dreher K. Alexander D. L. Garcia-Hernandez M. Karthikeyan A. S. Lee C. H. Nelson W. D. Ploetz L. Singh S. Wensel A. Huala E. (2012). The Arabidopsis information resource (TAIR): improved gene annotation and new tools. Nucleic Acids Res.40, D1202–D1210.10.1093/nar/gkr1090
18
Lehninger A. Nelson D. Cox M. (2008). Lehninger Principles of Biochemistry. New York: W. H. Freeman.
19
Leskovac V. (2003). Comprehensive Enzyme Kinetics. New York: Springer.
20
Mochida K. Uehara-Yamaguchi Y. Yoshida T. Sakurai T. Shinozaki K. (2011). Global landscape of a co-expressed gene network in barley and its application to gene discovery in Triticeae crops. Plant Cell Physiol.52, 785–803.10.1093/pcp/pcr035
21
Mutwil M. Klie S. Tohge T. Giorgi F. M. Wilkins O. Campbell M. M. Fernie A. R. Usadel B. Nikoloski Z. Persson S. (2011). Planet: combined sequence and expression comparisons across plant networks derived from seven species. Plant Cell23, 895–910.10.1105/tpc.111.083667
22
Mutwil M. Usadel B. Schutte M. Loraine A. Ebenhoh O. Persson S. (2010). Assembly of an interactive correlation network for the Arabidopsis genome using a novel heuristic clustering algorithm. Plant Physiol.152, 29–43.10.1104/pp.109.145318
23
Obayashi T. Hayashi S. Saeki M. Ohta H. Kinoshita K. (2009). ATTED-II provides coexpressed gene networks for Arabidopsis. Nucleic Acids Res.37, D987–D991.10.1093/nar/gkn807
24
Obayashi T. Kinoshita K. (2009). Rank of correlation coefficient as a comparable measure for biological significance of gene coexpression. DNA Res.16, 249–260.10.1093/dnares/dsp016
25
Punta M. Ofran Y. (2008). The rough guide to in silico function prediction, or how to use sequence and structure information to predict protein function. PLoS Comput. Biol.4, e1000160.10.1371/journal.pcbi.1000160
26
Resnik P. (1995). “Using information content to evaluate semantic similarity in a taxonomy,” in Proceedings of the 14th International Joint Conference on Artificial Intelligence, Los Altos, 448–453.
27
Rivals I. Personnaz L. Taing L. Potier M. C. (2007). Enrichment or depletion of a GO category within a class of genes: which test?Bioinformatics23, 401–407.10.1093/bioinformatics/btl633
28
Rotter A. Usadel B. Baebler S. Stitt M. Gruden K. (2007). Adaptation of the mapman ontology to biotic stress responses: application in Solanaceous species. Plant Methods3, 10.10.1186/1746-4811-3-10
29
Ruepp A. Zollner A. Maier D. Albermann K. Hani J. Mokrejs M. Tetko I. Güldener U. Mannhaupt G. Münsterkötter M. Mewes H. W. (2004). The funcat, a functional annotation scheme for systematic classification of proteins from whole genomes. Nucleic Acids Res.32, 5539–5545.10.1093/nar/gkh894
30
Schiwikowski B. Uetz P. Fields S. (2000). A network of protein-protein interactions in Yeast. Nat. Biotechnol.18, 1257–1261.10.1038/82360
31
Sokal R. R. Rohlf F. J. (2003). Biometry. New York: W.H. Freeman and Company.
32
Stein L. D. (2003). Integrating biological databases. Nat. Rev. Genet.4, 337–345.10.1038/nrn1121
33
Stevens R. Goble C. A. Bechhofer S. (2000). Ontology-based knowledge representation for bioinformatics. Brief. Bioinformatics1, 398–414.10.1093/bib/1.4.398
34
Tellström V. Usadel B. Thimm O. Stitt M. Küster H. Niehaus K. (2007). The lipopolysaccharide of Sinorhizobium meliloti suppresses defense-associated gene expression in cell cultures of the host plant Medicago truncatula. Plant Physiol.143, 825–837.10.1104/pp.106.090985
35
Thimm O. Blasing O. Gibon Y. Nagel A. Meyer S. Kruger P. Selbig J. Muller L. A. Rhee A. S. Y. Stitt M. (2004). Mapman: a user-driven tool to display genomics data sets onto diagrams of metabolic pathways and other biological processes. Plant J.37, 914–939.10.1111/j.1365-313X.2004.02016.x
36
Tsiaras V. Triantafilou S. Tollis I. (2008). “Treemaps for directed acyclic graphs graph drawing,” eds HongS.-H.NishizekiT.QuanW. (Heidelberg: Springer), 377–388.
37
Urbanczyk-Wochniak E. Usadel B. Thimm O. Nunes-Nesi A. Carrari F. Davy M. Bläsing O. Kowalczyk M. Weicht D. Polinceusz A. Meyer S. Stitt M. Fernie A. (2006). Conversion of mapman to allow the analysis of transcript data from & lt; I & gt; Solanaceous species: effects of geznetic and environmental alterations in energy metabolism in the leaf. Plant Mol. Biol. 60, 773–792.10.1007/s11103-005-5772-4
38
Yon Rhee S. Wood V. Dolinski K. Draghici S. (2008). Use and misuse of the gene ontology annotations. Nat. Rev. Genet.9, 509–515.10.1038/nrg2363
39
Zeeberg B. Feng W. Wang G. Wang M. Fojo A. Sunshine M. Narasimhan S. Kane D. Reinhold W. Lababidi S. Bussey K. Riss J. Barrett J. Weinstein J. (2003). Gominer: a resource for biological interpretation of genomic and proteomic data. Genome Biol.4, R28.10.1186/gb-2003-4-4-r28
Summary
Keywords
Arabidopsis thaliana , design principles of ontologies, gene function prediction, Gene Ontology, information content, MapMan
Citation
Klie S and Nikoloski Z (2012) The Choice between MapMan and Gene Ontology for Automated Gene Function Prediction in Plant Science. Front. Gene. 3:115. doi: 10.3389/fgene.2012.00115
Received
02 April 2012
Accepted
05 June 2012
Published
28 June 2012
Volume
3 - 2012
Edited by
John Hancock, Medical Research Council, UK
Reviewed by
John Hancock, Medical Research Council, UK; Pankaj Jaiswal, Oregon State University, USA; Keiichi Mochida, RIKEN, Japan
Copyright
© 2012 Klie and Nikoloski.
This is an open-access article distributed under the terms of the Creative Commons Attribution Non Commercial License, which permits non-commercial use, distribution, and reproduction in other forums, provided the original authors and source are credited.
*Correspondence: Zoran Nikoloski, Systems Biology and Mathematical Modeling Group, Max-Planck Institute of Molecular Plant Physiology, Potsdam-Golm D-14476, Germany. e-mail: nikoloski@mpimp-golm.mpg.de
This article was submitted to Frontiers in Bioinformatics and Computational Biology, a specialty of Frontiers in Genetics.
Disclaimer
All claims expressed in this article are solely those of the authors and do not necessarily represent those of their affiliated organizations, or those of the publisher, the editors and the reviewers. Any product that may be evaluated in this article or claim that may be made by its manufacturer is not guaranteed or endorsed by the publisher.