Abstract
The emerging single-cell RNA-Seq (scRNA-Seq) technology holds the promise to revolutionize our understanding of diseases and associated biological processes at an unprecedented resolution. It opens the door to reveal intercellular heterogeneity and has been employed to a variety of applications, ranging from characterizing cancer cells subpopulations to elucidating tumor resistance mechanisms. Parallel to improving experimental protocols to deal with technological issues, deriving new analytical methods to interpret the complexity in scRNA-Seq data is just as challenging. Here, we review current state-of-the-art bioinformatics tools and methods for scRNA-Seq analysis, as well as addressing some critical analytical challenges that the field faces.
Introduction
Characterization of genomic signatures in individual patients is a key step toward the realization of precision medicine. Recently, next-generation sequencing (NGS) based RNA expression profiling (RNA-seq) has made broad impacts on biomedical fields. However, population-averaged RNA-seq has limited discovery power, and it can also mask the presence of rare subpopulations of cells (such as cancer stem cells) and thus may overlook important biological insights. The emerging single-cell RNA-Seq (scRNA-Seq) technology is designed to overcome these limitations by investigating expression profiles at the cell level. In just a few years, the number scRNA-Seq experiments has grown beyond exponentially. This new approach offers the potential to revolutionize our understanding of diseases and associated biological processes, with the capacity to reveal the intercellular heterogeneity within a specific tissue at an unprecedented resolution (Yan et al., 2013; Trapnell et al., 2014). Using single-cell level features, we can infer cell lineages (Treutlein et al., 2014), identify subpopulations (Trapnell et al., 2014) and highlight cell-specific biological characteristics (Tang et al., 2010). Moreover, single-cell analyses have already demonstrated their utilities in the clinical applications, ranging from characterizing cancer cells subpopulations (Navin et al., 2011; Patel et al., 2014; Ting et al., 2014), highlighting specific resistance mechanisms (Kim, K. T. et al., 2015; Miyamoto et al., 2015) to being used as diagnostic tools (Ramsköld et al., 2012; Kvastad et al., 2015).
Despite the expansion of scRNA-Seq studies and rapid maturing of experimental methods, major analytical challenges remain as the consequences of experimentation. One major challenge is that scRNA-Seq datasets present a very high level of noise (Brennecke et al., 2013; Kharchenko et al., 2014). Much of the noise is due to the nature of single-cell technologies. Because of the extremely low amount of starting biological material in the single cell, amplification processes are required. These procedures are prone to distortion and contamination (Leng et al., 2015). To tackle these issues, rigorous efforts have been made to develop analytical methods for scRNA-Seq data. Here, we summarize current state-of-the-art bioinformatics analysis tools and methods for scRNA-Seq (Figure 1 and Table 1), and address some critical analytical challenges that we are facing. The first section describes specific pre-processing steps for noise removal of scRNA-Seq datasets. The second section reviews specific scRNA-Seq bioinformatics analysis procedures with emphasis on subpopulation detection. The third section focuses on microevolution analysis for scRNA-Seq data. In the last section, we highlight the challenges to be addressed and work to be accomplished in scRNA-Seq bioinformatics field.
Figure 1
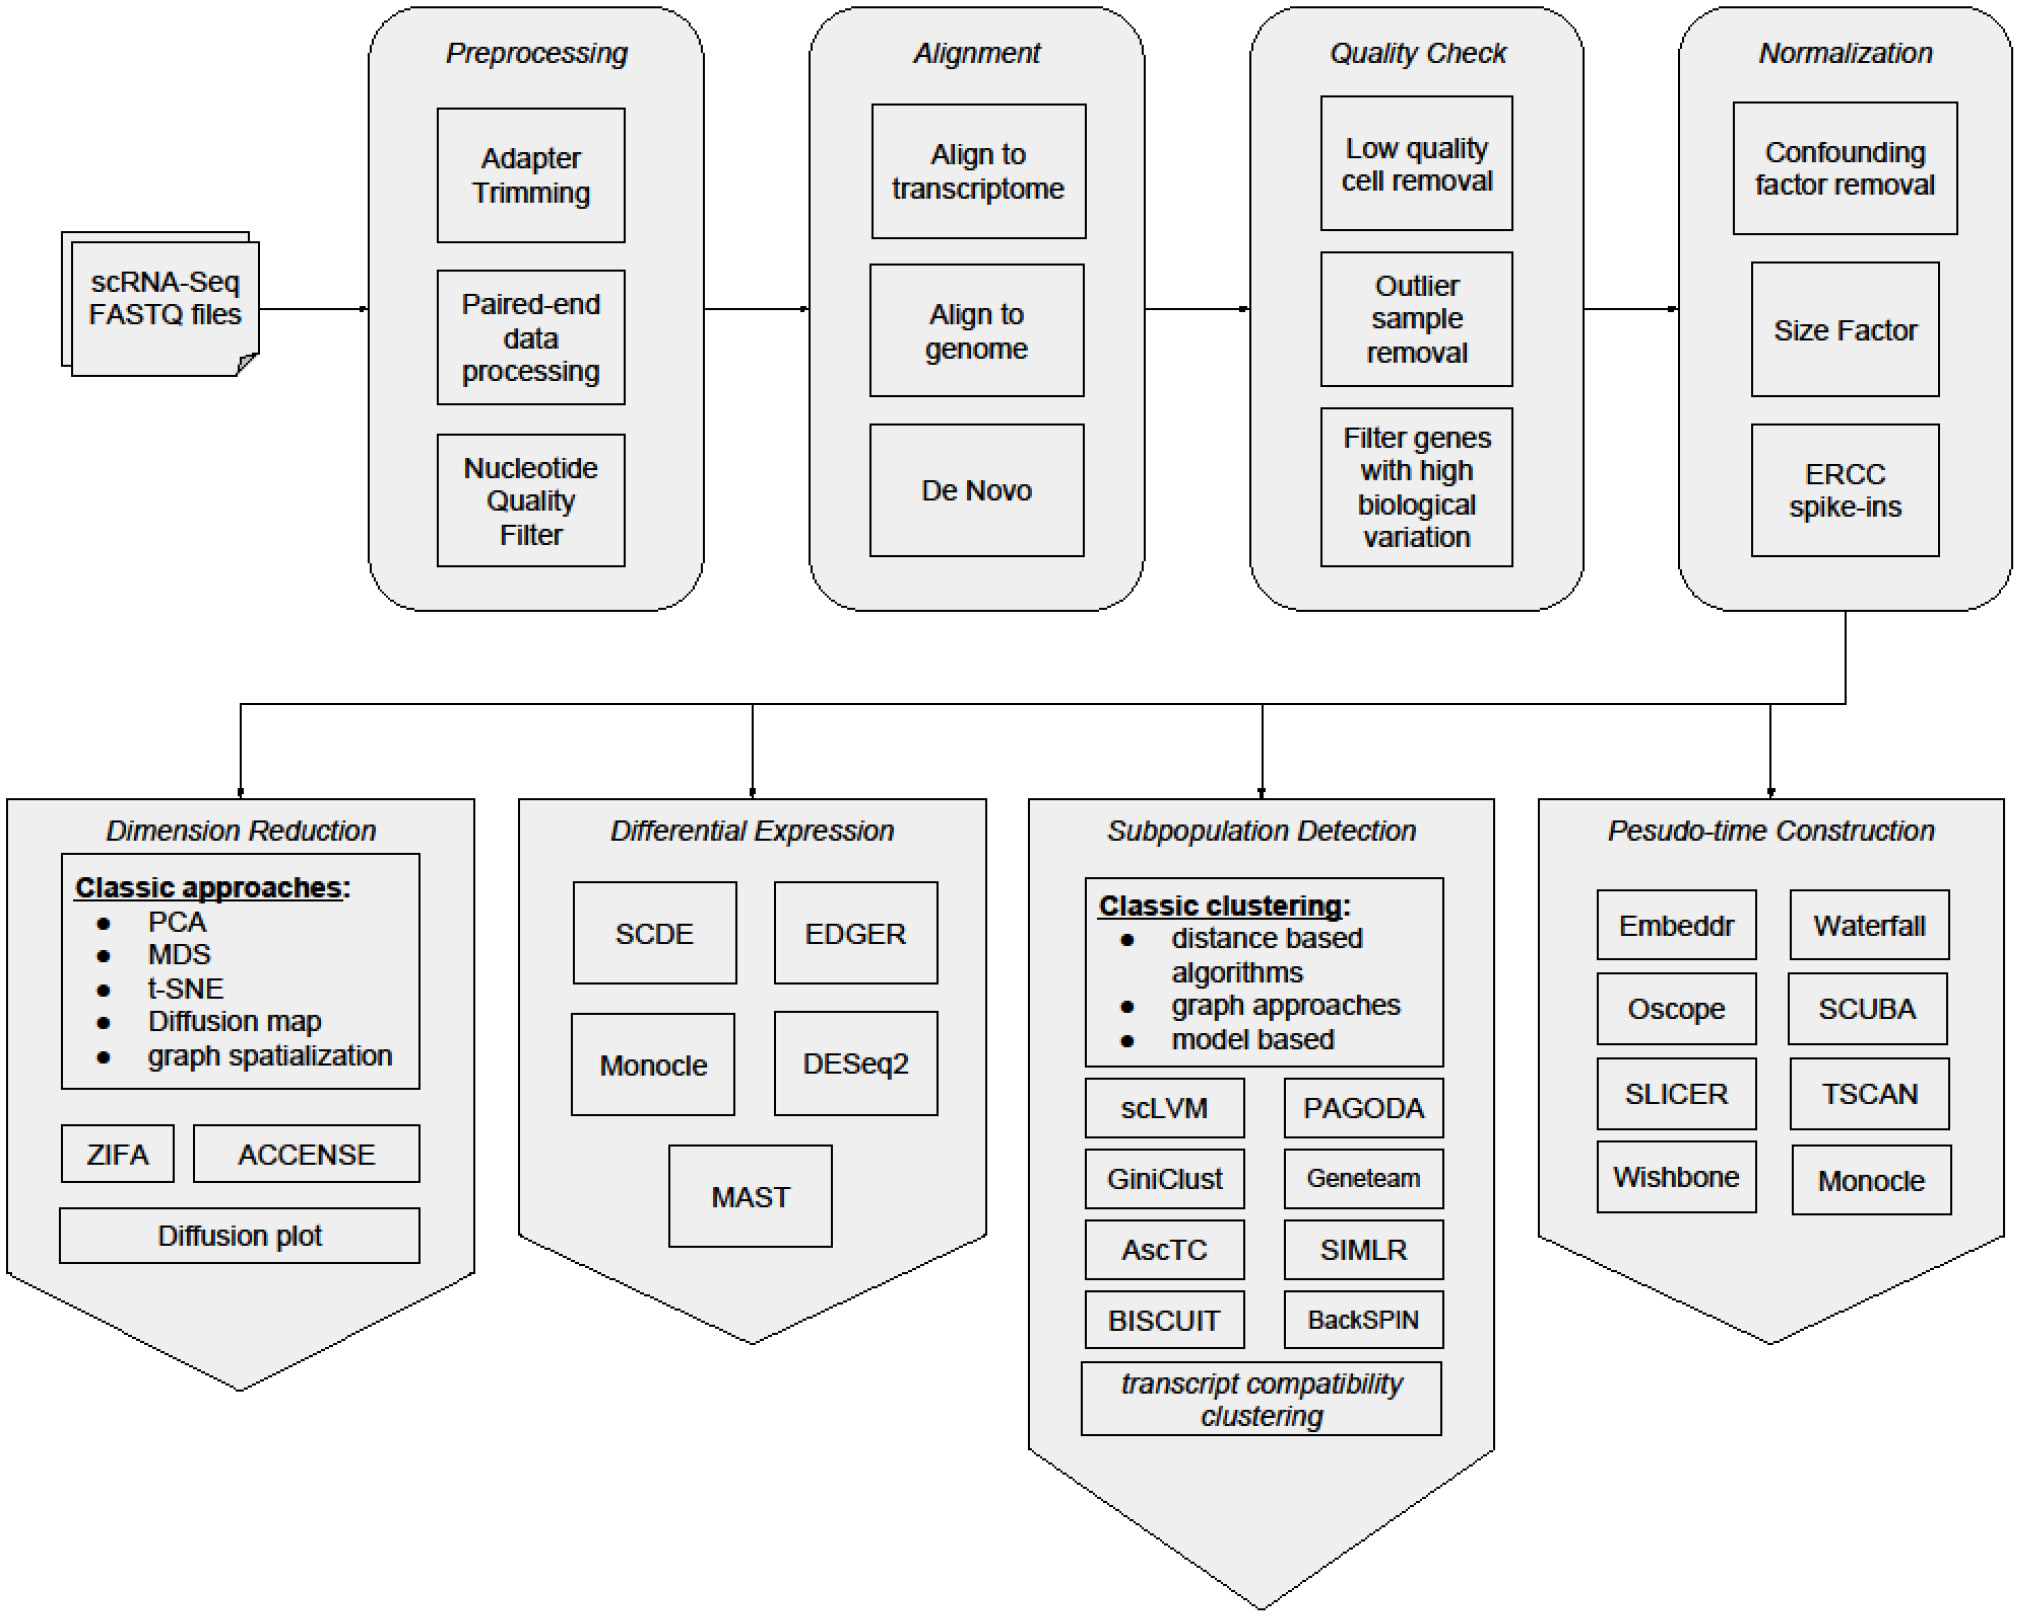
General workflow of Single-cell analysis.
Table 1
List of single-cell analytical tools mentioned in this chapter.
Links for their availability are attached.
Data preprocessing and noise removal
Quality control
scRNA-Seq experiments generate FASTQ files from the sequencing machine, which contain millions of reads composed of RNA sequences and add-on sequences (UMI tag and the cell tag etc). These reads need to be pre-processed before being aligned back to the reference genome. For scRNA-seq, pre-processing and quality control (QC) analyses similar to bulk RNA-seq are used. Cutadapt (Martin, 2011) is a tool that removes adapter sequences, and Trimmomatic (Bolger et al., 2014) performs quality-based trimming in addition to removing adapter sequence. These tools are commonly used in scRNA-seq experiments (Treutlein et al., 2014; Handel et al., 2016; Hou et al., 2016). Other generic quality control tools such as FASTQC or HTQC (Yang et al., 2013) might also be useful to produce quality metrics. Finally, it is worth noting that platform-specific QC tools such as SolexaQA (Cox et al., 2010) provide QC pipelines specific for Illumina sequencing, with trimming and quality-based filtering.
Other QC procedures for scRNA-seq involve the analysis of the expression of housekeeping genes (Ting et al., 2014; Treutlein et al., 2014), overall gene expression patterns (Zeisel et al., 2015) and the number of genes or reads detected per cell (Kumar et al., 2014). However, one issue of these approaches is that the thresholds chosen for filtering are arbitrary and should differ according to the dataset (Jiang, P. et al., 2016). SinQC (Jiang, P. et al., 2016) and SCell (Diaz et al., 2016) are two QC tools specifically designed for scRNA-seq data. SinQC uses sequencing library quality to confirm gene expression outliers. It computes different quality metrics (e.g., total number of mapped reads, mapping rate and library complexity) to identify a user-specified fraction of the dataset as noise. SCell is a versatile tool that allows for outlier detection. It estimates genes that are expressed at the background level using Gini index, which measures statistical dispersion, and removes samples whose background fraction is significantly higher than the average. Recently, a new mapping and quality assessment pipeline Celloline detects low quality cells from expression profiles, using curated biological and technical features (Ilicic et al., 2016).
Alignment
To our knowledge, there are currently no specific aligners dedicated to scRNA-seq, and scRNA-seq studies use existing aligners made for bulk RNA-Seq. Tophat is one of the most popular aligners capable of detecting novel splice (Trapnell et al., 2009; Kim et al., 2013), and it is widely used in scRNA-seq studies (Treutlein et al., 2014; Fan et al., 2016; Freeman et al., 2016; Handel et al., 2016; Hou et al., 2016). RNA-Seq by Expectation Maximization, or RSEM, is a popular framework that includes an aligner (Li and Dewey, 2011). It is also used in some scRNA-seq studies (Gao et al., 2016; Kimmerling et al., 2016; Meyer et al., 2016). Other aligners used in scRNA-Seq studies include MapSplice (Wang et al., 2010), GSNAP (Brennecke et al., 2013; Buettner et al., 2015; Wu et al., 2016), and STAR (Dobin and Gingeras, 2015; Moignard et al., 2015; Petropoulos et al., 2016). Among these aligners, TopHat and STAR were found to be about one to two magnitudes faster than GSNAP and MapSplice (Engström et al., 2013). More recently developed aligners include Kallisto (Bray et al., 2016) and HISAT (Kim, D. et al., 2015). Kallisto uses pseudo-alignment with hashing de Bruijn graphs and avoids alignment altogether, which drastically improves the speed of expression quantification. HISAT (hierarchical indexing for spliced alignment of transcripts) seems also promising in term of the speed and accuracy. It is worth mentioning that some major scRNA-Seq methods do not get enough coverage across the gene to measure alternative splicing, therefore algorithms for isoform measurements are not as critical in scRNA-Seq, at least at this stage.
Feature quantification
Feature quantification is the process of converting alignment results into a gene expression profile. An expression profile is conventionally represented as a numeric matrix where rows are genes and columns are cells. Each entry in the matrix is the abundance of a particular gene or transcript in a particular sample. Just as is the case for aligners, most scRNA-Seq studies use canonical feature quantification methods applied to bulk RNA-Seq.
Quantification methods for gene expression differ dramatically. The simplest approach, employed by programs such as HTSeq (Anders et al., 2014) and FeatureCounts (Liao et al., 2013), is to count the number of reads located within the boundaries of a gene (Liao et al., 2013; Anders et al., 2014). These programs have simple but flexible parameters for determining read counts in the case of overlapping genes, and were used in some scRNA-Seq studies (Brennecke et al., 2013; Moignard et al., 2015; Fan et al., 2016; Handel et al., 2016). More sophisticated approaches calculate probabilistic estimates of gene expression. For example, RSEM and Cufflinks both employ a maximum likelihood approach (Trapnell et al., 2010; Li and Dewey, 2011). These programs are based on statistical models where reads in a RNA-Seq sample are observed random variables predicted from the latent variables, such as the transcript sequence, strand and length. The new Kallisto pipeline (Bray et al., 2016) as described before, is shown to have up to two orders of magnitude speed improvement over previous aligner-quantifier combinations (Ntranos et al., 2016). Interestingly, while probabilistic approaches are conceptually more refined, simple counting programs such as HTSeq and FeatureCounts showed comparable or even stronger performance (Chandramohan et al., 2013; Fonseca et al., 2014), suggesting that these probabilistic models are yet to be improved.
Given the uncertainties of quantifying fragments post-amplification, a new technique was shown to reduce amplification noise by introducing random sequences called unique molecular identifiers, or UMIs (Islam et al., 2014). UMIs are tagged on individual RNA molecules before amplification and used for tracking transcripts directly rather than using sophisticated statistical modeling. This approach may lead to a different workflow than conventional fragment-based quantification methods (e.g., gene filtering and normalization).
Gene filtering
Due to the high level of noise in scRNA-Seq datasets, it is necessary to filter out low quality genes and samples. Various practices have been made to filter out genes that are expressed in too few samples (Brennecke et al., 2013; Treutlein et al., 2014; Petropoulos et al., 2016). Usually, a gene is defined as “expressed” by a minimal expression level threshold. For experiments that quantify gene expression with fragment counting, an FPKM (Fragment per Kilobase per Million Reads) threshold is appropriate. Common FPKM thresholds are 1 (Freeman et al., 2016) and 10 (Petropoulos et al., 2016). Other studies also set the threshold by Transcript Per Million (TPM) instead of FPKM (Meyer et al., 2016). Yet better filtering reference could come from External RNA Controls Consortium (ERCC) spike-ins added to the experiment, which provides calibration of the relative amount of starting material (Brennecke et al., 2013; Treutlein et al., 2014).
Recently, specific methods have been developed to filter genes from scRNA-seq dataset. OEFinder is designed to identify artifact genes from scRNA-seq experiments using the Fluidigm C1 platform for cell capture (Leng et al., 2016). For experiments that quantify gene expression with UMI counting, one can directly set up a molecule number threshold, e.g., 25 (Zeisel et al., 2015). It is also recommended to remove UMIs that have reads <1/100 of average non-zero UMI reads, in order to avoid erroneous UMIs generated during amplification.
Removal of confounding factors
When the entire data set consists of several runs of experiments with potentially varied conditions, systematic variations called batch effects might be introduced. These artifacts may pose substantial problems to downstream statistical analysis, or even mask biological signals. For studies concerning over-dispersion of gene expression, it is necessary to factor out the extra variance caused by the systematic differences between batches (Fan et al., 2016). The appropriate way to compensate for batch effect depends on the quantification method as well as the downstream analysis. For most studies batch effects can be eliminated by using down-sampling methods, however the complexity is reduced (Wang et al., 2012; Dey et al., 2015; Grün and van Oudenaarden, 2015). For studies that use traditional fragment counting, COMBAT (Johnson et al., 2007) is a batch effect eliminating method based on empirical Bayes frameworks and purports to be robust to outliers for small sample sizes. It was originally designed for microarray data but was used in scRNA-Seq experiments (Kim, K. T. et al., 2015). Although unsupervised batch effect detection or removal methods exist (Leek, 2014), the batches called by such methods often correlate highly with subpopulations detected by other scRNA-Seq methods (Finak et al., 2015). Since it is usually desirable to consider subpopulations for valuable biological insights, unsupervised batch effect removal methods should be used with discretion in single-cell experiments.
Besides batch-effect removal, it is also important to remove technical variability within the noise. The technical noise level of a genes correlates with its average expression level. Thus, a probabilistic model can be built to fit this correlation using technical spike-ins and further infer the biological variability of each gene (Brennecke et al., 2013). For most studies, it is also desirable to avoid the ubiquitous cell-cycle induced variation to mask other interesting biological variations. scLVM is a package that tries to introduce a cell-cycle factor removal step before subpopulations detection (Buettner et al., 2015). Recently, a new package called ccRemover was developed to remove the principal components that are identified as cell-cycle affected, which claimed to perform better than scLVM in several simulated and real datasets (Barron and Li, 2016).
Normalization
In scRNA-seq experiments, technical factors such as read depth, cell capture efficiency, 3′ bias or full sequence coverage due to particular library prep methods, might differ among different scRNA-Seq data sets. Thus, raw read counts should be normalized before downstream analyses. This procedure maximally ensures that the difference between the values in the matrix correctly reflects the abundance difference of transcripts or genes between the cells. When experiments are designed with ERCC spike-ins, ERCC can be used as internal controls and serve as anchors for normalization. GRM is a scRNA-seq normalization tool fitting a Gamma Regression Model between the reads (FPKM, RPKM, TPM) and spike-ins (Ding et al., 2015). The trained model is then used to estimate gene expression from the reads. BASICS, another recent workflow, provides a Bayesian model allowing to infer cell-specific normalization factor (Vallejos et al., 2015). This workflow estimates the technical variability using spike-ins. Finally, SAMstrt (Katayama et al., 2013) is an earlier algorithm that applies the resampling normalization procedure of the SAMseq algorithm to spike-ins, which was originally developed for bulk RNA-seq (Li and Tibshirani, 2013).
For experiments without spike-ins, if the quantification is count-based, one can normalize the expression profile by the scaling methods used in DESeq and edgeR etc. (Love et al., 2014). A new specific scRNA-seq procedure proposes a de-convolution approach on the pooled counts of gene expression for multiple cells, thus allows to infer the size factor for individual cells without using spike-ins (Aaron et al., 2016). The authors claimed that their approach improved the accuracy of the normalization compared with existing methods. However, experiments designed with UMIs as mentioned earlier quantify gene expression on an absolute basis and thus they do not need computational normalization.
Differential expression
Differential expression (DE) analysis is the process of calling gene expression that show statistically significant difference between pre-specified groups of samples. Although DE is typically not the main objective of a single-cell experiment design, as it requires pre-defined grouping information among cells of interest, it is nevertheless common in scRNA-Seq experiments. Simple statistical methods such as t-test and Wilcoxon rank sum test are used in scRNA-Seq workflows such as SINCERA (Guo et al., 2015). Interestingly, EdgeR and DESeq2, two DE methods developed for bulk RNA-Seq, gave the best results for some scRNA-Seq data (Schurch et al., 2016).
The dropout event is a unique type of noise of scRNA-Seq that rarely occurs in bulk RNA-Seq experiments. It refers to the phenomenon that a gene is shown expressed abundantly in one cell but not detectable in another cell, as a consequence of the transcript loss in the reverse-transcription step. To account for frequent dropout events and biological variability within cell population, more sophisticated algorithms have been developed for scRNA-Seq data. Single-Cell Differential Expression (SCDE) is a package developed specifically for single-cell differential expression (Kharchenko et al., 2014). The model assumes that observed expression levels in scRNA-Seq data follow a mixture of negative binomial distribution for amplified genes, as proposed before (Anders and Huber, 2010); and a low-mean poisson distribution for dropout genes, as is observed in transcriptionally silenced genes. This model is then fit using Expectation Maximization (EM) algorithm (Kharchenko et al., 2014). It claimed higher sensitivity of differentially expressed genes compared to DESeq and CuffDiff. More recently, PAGODA improved upon SCDE's method in several aspects, including optimization of the computational process and a refined model for better fitting (Fan et al., 2016). MAST is another scRNA-Seq differential expression detection method that uses a two-part generalized linear model and adjusts for the fraction of cells that express a certain gene (Finak et al., 2015).
Another challenge unique to scRNA-Seq is that some genes may exhibit bimodality, meaning that the expression levels across a group of cells concentrate around two modes instead of one. A beta-Poisson distribution was proposed in order to provide a more accurate differential expression analysis that captures bimodality (Vu et al., 2016). Another tool Monocle (Trapnell et al., 2014) also has a module for differential expression, which fits the data with a non-parametric generalized additive model. Finally, the workflow of BASICS as described earlier, provides an criterion to detect high- or low-variable genes within the single cells dataset (Vallejos et al., 2015). However, it is not clear which methods have generally superior performance.
Subpopulation and module detection
General machine-learning approaches
Different classical unsupervised approaches have been used to highlight single cell subgroups among a population. Principal Component Analysis (PCA) and its variants (e.g., Robust PCA and Kernel PCA) have been used in different single cell studies (Amir et al., 2013; Yan et al., 2013; Pollen et al., 2014; Trapnell et al., 2014; Treutlein et al., 2014; Satija et al., 2015; Fan et al., 2016; Ilicic et al., 2016). K-means and other distance based clustering algorithms such as hierarchical clustering or WARD are also widely used (Yan et al., 2013; Jaitin et al., 2014; Kharchenko et al., 2014; Lohr et al., 2014; Marco et al., 2014; Pollen et al., 2014; Shin et al., 2015). For example, Jaitin et al. combined hierarchical clustering and probabilistic mixture models to classify single cells from different tissues (Jaitin et al., 2014). A refined clustering method called pcaReduce (Zurauskiene and Yau, 2015) was designed for scRNA-Seq. It iteratively uses PCA combined with K-means to produce the hierarchical tree of the cells. For distance metrics employed by these methods, Euclidean distance, Pearson and Spearman correlation coefficients have been popular (though may not be optimal) choices (Pollen et al., 2014; Rotem et al., 2015).
Machine-learning approaches tailored for scRNA-Seq analysis
More sophisticated machine-learning algorithms have great potentials to overcome some issues of scRNA-Seq functional analysis. A main issue of scRNA-Seq analysis is that gene expression data cannot be expressed as a linear combination of the relationships between two cells in general (Buettner and Theis, 2012; Bendall et al., 2014; Levine et al., 2015). Also classical similarities (such as cosine or Euclidean distances) are less meaningful as the dimensionality increases (Beyer et al., 1999), and may not be appropriate for scRNA-Seq (Xu and Su, 2015). Possible irrelevant associations may arise with inappropriate metrics, while searching for the nearest neighbors on noisy data (Balasubramanian and Schwartz, 2002). Adequate analytical methods for scRNA-Seq data should also be able to highlight “rare events,” such as the small fraction of metastatic cancer cells amongst a large cell population (Bose et al., 2015; Shin et al., 2015). We describe the scRNA-Seq specific algorithms below in the order of dimension reduction, clustering, and other clustering variant methods. The datasets that were used to test these algorithms are listed in Table 2.
Table 2
| Dataset description | Accession | References | Species | Number of cells | Original analysis | Applied algorithms |
|---|---|---|---|---|---|---|
| Cortex and hippocampus cells | GSE60361 | Zeisel et al., 2015 | Mouse | 3005 | BackSPIN | Geneteam, PAGODA, AscTC, BISCUIT, GiniClust |
| 11 different cell types | SRP041736 | Pollen et al., 2014 | Human | 301 | PCA and hierarchical clustering | ZIFA, SILMR, pcaReduce |
| Myoblast differentiation | GSE52529 | Trapnell et al., 2014 | Human | 372 | MONOCLE | ZIFA, AscTC, TSCAN, Embeddr |
| Embryomic T-cells under different cell cycle stages | E-MTAB-2512 | Buettner et al., 2015 | Mouse | 182 | scLVM | ZIFA, SLIMR |
| Preimplementation embryos and embryonic stem cells at different stages | GSE36552 | Yan et al., 2013 | Human | 124 | PCA and hierarchical clustering | scLVM, SNN-Cliq |
| Cells from developing bronchioalveolar at four different stages of development | GSE52583 | Treutlein et al., 2014 | Mouse | 202 | PCA and hierarchical clustering | SLICER, EMBEDDR |
Description of the main datasets for subpopulation and module detection analysis.
Among the dimension reduction methods, Zero-inflated factor analysis (ZIFA) algorithm is a new method that includes dropout events by representing the probability of gene dropout as an exponential function of its mean expression (Pierson and Yau, 2015). Using a latent variable model based on factor analysis, ZIFA reduces the dimension of scRNA-Seq dataset and allows the probability of each gene expression to be zero. Experiments in the original study suggest that ZIFA is a more robust alternative to PCA. As mentioned earlier, scLVM is another method for identifying cell subpopulations, which features removal of confounding factor like cell-cycle effects (Buettner et al., 2015). It first computes cell-to-cell covariance using a set of marker genes related to biological hidden factors of interest (such as the cell cycle). Another approach, PAGODA as mentioned before, uses a weighted PCA to characterize multiple aspects of heterogeneity in mouse neuronal progenitors (Fan et al., 2016). PAGODA evaluates over-dispersion of individual genes using error models.
SIMLR is a new clustering method designed to learn a distance metric that best fits the structure of the data. It infers a distance function as a linear combination of several distance metrics (Wang et al., 2016). It is designed to tackle the heterogeneity observed amongst single-cell datasets related to both technological difference across platforms as well as biological difference across studies. In another single-cell clustering approach named analysis of scRNA-seq based on transcript-compatibility counts (AscTC), read counts from scRNA-Seq dataset are transformed into probabilities using transcript-compatibility counts, rather than the conventional transcript abundance (Ntranos et al., 2016). Individual cells are clustered using an affinity propagation algorithm, a derivative of spectral clustering.
A few other hierarchical clustering approaches are worth mentioning. Geneteam is a multi-level recursive clustering method that searches for bipartitions of cells sharing exclusive expression profiles for a subset of genes (Harris et al., 2015). Similarly, Backspin is another hierarchical dividing clustering algorithm, allowing to cluster both genes and cells (Zeisel et al., 2015). It uses the SPIN algorithm (Tsafrir et al., 2005) at each iteration to sort the expression matrix and then separates genes (rows) and cells (columns) into two groups by a specific splitting criterion. Alternatively, BISCUIT is a new iterative normalization and clustering procedure based on Dirichlet Process, which was designed to correct technical variation in scRNA-seq together with cell clustering (Prabhakaran et al., 2016).
Graph approaches beyond clustering
Traditional clustering methods lack the function of inferring the inherent lineage between cells. Common approaches for cell lineage inferences require the creation of a graph or a tree, where single cells are represented as nodes and edges between the cells indicate their similarities. The lengths of the edges are computed from a similarity matrix based on a given metric. Before constructing the graph, a de-noising procedure is necessary. A useful de-noising procedure is to compute the k-Nearest-Neighbor graph (kNNG; Bendall et al., 2014; Levine et al., 2015; Xu and Su, 2015). Samples from the kNNG could then be compared using the geodesic distance, defined as the shortest path between two nodes (Bendall et al., 2014). Such an approach can remove “shortcuts” between irrelevant pairs of samples due to the curse of high dimensionality (Tenenbaum et al., 2000). Clustering analysis can then be performed on the graph using community detection algorithms (Fortunato, 2010). Xu and Su first used Euclidean distance to compute Shared Nearest-Neighbor (SNN) graph, then searched for quasi-cliques to obtain clusters of cells (Xu and Su, 2015). Quasi-cliques are communities of nodes, densely but not necessarily fully connected. Highly Connected Sub-graph (HPC) is another community detection algorithm that showed very similar performances as SNN (Hartuv and Shamir, 2000).
Microevolution of single cells
Inference without spatial and temporal information
scRNA-Seq data are also informative to reveal single-cell microevolution. Different algorithms have been specifically designed for scRNA-Seq to infer a pseudo temporal ordering of single cells. Moncole is the first scRNA-Seq bioinformatics tool to infer the temporal ordering of single cells (Trapnell et al., 2014). It first uses Independent Component Analysis (ICA) to reduce the dimension, then computes a Minimum Spanning Tree (MST) on the graph constructed by Euclidean distance between cell pairs. MST connects all nodes of a graph using edges with a minimal total weighting, based on the hypothesis that the longest path through the MST corresponds to the longest series of transcriptionally similar cells. Another similar method, Waterfall, uses PCA coupled with k-means to produce clusters, then connects the cluster centroids with MST (Shin et al., 2015). Similar to Waterfall, TSCAN is a new approach based on MST. Cells are first clustered using a model-based approach before constructing an MST, allowing the reduction of the tree space complexity (Ji and Ji, 2016).
Embeddr is a method that uses the correlation metric between cells to construct kNNG, then projects the samples into a low-dimensional embedding using Laplacian eigen maps. The pseudo time order is then fitted using the principal curves (Campbell et al., 2015). Embeddr aims to tackle the drawbacks of Monocle, where gene expression is modeled as a linear combination and the result is highly sensitive to outliers. This scheme is also used in the workflow of SLICER, a recent algorithm using Locally Linear Embedding (LLE) to project the dataset and to construct a kNNG among cells (Welch et al., 2016).
Since visualization is key in understanding reconstructed single-cell trajectories, better visualization algorithms are as important as methods to reconstruct the single-cell microevolution. t-SNE is a popular method to visualize single cells, as part of a more complex workflow (Jiang, L. et al., 2016; Petropoulos et al., 2016). Another approach derived from diffusion map was developed, allowing one to visualize a clear bifurcation event among the cells which may be missed by independent component analysis (ICA) or t-SNE (Haghverdi et al., 2015; Moignard et al., 2015).
Modeling microevolution with spatial and temporal information
Cell subpopulations can also be characterized by different temporal and/or spatial gene expressions. Several approaches have been designed to exploit datasets with explicit temporal information. SCUBA is a method to detect bifurcation events using time course data (Marco et al., 2014). It assumes that the switch between cell states is a stochastic punctual process. To infer cellular hierarchy, it iteratively divides cells using k-means algorithm and uses a gap statistic to determine if a bifurcation event should occur. This process creates a binary tree, which can then be used to model gene expression dynamics (Marco et al., 2014). However, one drawback of SCUBA is that it requires data with temporal features. Free from such a requirement, Oscope is another method to infer oscillatory genes among single cells collected from a single tissue (Leng et al., 2015). It hypothesizes that these cells represent distinct states according to an oscillatory process. Oscope fits a two-dimensional sinusoidal function for each pair of genes, clusters gene pairs by frequency and reconstructs the order of the cells in a cyclic fashion. However, Oscope is unable to infer bifurcation events.
Other models also consider the spatial organization of cells in a tissue. Seurat is an approach that infers the spatial localization of single cells by integrating RNA-Seq with in situ RNA patterns (Satija et al., 2015). Seurat divides a cellular tissue into distinct spatial bins, linked by the expression of landmark genes per RNA in-situ hybridization. Within each bin, it builds a mixture model using expression values among correlated genes. The posterior probability is generated for each cell and assigned to a given bin. Another approach models the tissue as a 3D map and assumes that cells spatially close share common scRNA-Seq profiles (Pettit et al., 2014). This method uses a hidden markov random field to assign each bin of the map to a given cluster. Similar to Seurat, it takes the input of spatial gene expression measurement using whole mount in situ Hybridizations (WiSH) technology, a confocal microscopic approach that detects the presence of mRNA linked to a fluorescent probe.
Challenges and future work
Compared to bulk-cell analysis, single-cell genomics has the advantage of exploring cellular processes with a more accurate resolution, but it is more vulnerable to disturbances. Besides perfecting the experimental protocols to deal with issues such as dropouts in gene expression and biases in amplification, deriving new analytical methods to reveal the complexity in scRNA-Seq data is just as challenging. In this review, we have listed the different bioinformatics algorithms dedicated to single-cell analysis. Although the initial few steps of workflow for scRNA-Seq analysis are similar to bulk-cell analysis (data pre-processing, batch removal, alignment, quality check, and normalization), the subsequent analyses are largely unique for single cells, such as subpopulations detection, and microevolution characterization (Figure 1). With the increasing popularity of single-cell assays and ever increasing number of computational methods developed, these methods need to be more accessible to research groups without bioinformatics expertise. Moreover, datasets where cell classes have already been previously charaterized should be identified as benchmark data, in order to accurately assess the performance of new bioinformatics methods.
Although this review focuses on scRNA-Seq analyses, with the rapid development of technologies, coupled DNA-based genomics data can be obtained from the same cell, in parallel with scRNA-Seq data (Han et al., 2014; Dey et al., 2015; Kim, K. T. et al., 2015; Macaulay et al., 2015). This will further increase the analytical challenges. Previous multi-omics bioinformatics tools applied to bulk samples could be leveraged. The use of graphs and tensor approaches that integrate heterogeneous features in bulk samples may be good starting points for multi-dimensional single cell data (Li et al., 2009; Levine et al., 2015; Katrib et al., 2016; Zhu et al., 2016). Efforts should also be made toward developing computational methods to make use of spatial information (possibly guided by imaging) in combination of scRNA-Seq (Pettit et al., 2014; Satija et al., 2015). Also most emphasis in scRNA-Seq by far has been made on protein coding genes, and the dynamics and roles of non-coding RNAs such as lncRNAs (Travers et al., 2015; Ching et al., 2016) and micro-RNAs are poorly explored. Finally, a large number of single-cells (n = 4645) in a single data set was reported recently (Tirosh et al., 2016), and the scRNA-Seq data volume is expected to continue growing exponentially. Foreseeably, this poses a large spectrum of challenges from developing more efficient aligners to better data storage and data sharing solutions.
Statements
Author contributions
LG envisioned this project, OP, XZ, TC, and LG wrote the manuscript, all authors have read and agreed on the manuscript.
Acknowledgments
This research was supported by grants K01ES025434 awarded by NIEHS through funds provided by the trans-NIH Big Data to Knowledge (BD2K) initiative (www.bd2k.nih.gov), P20 COBRE GM103457 awarded by NIH/NIGMS, 1R01LM012373 awarded by NLM, and Hawaii Community Foundation Medical Research Grant 14ADVC-64566 to LG.
Conflict of interest
The authors declare that the research was conducted in the absence of any commercial or financial relationships that could be construed as a potential conflict of interest.
References
1
AaronT. L. L.BachK.MarioniJ. C. (2016). Pooling across cells to normalize single-cell RNA sequencing data with many zero counts. Genome Biol.17:75. 10.1186/s13059-016-0947-7
2
AmirE. D.DavisK. L.TadmorM. D.SimondsE. F.LevineJ. H.BendallS. C. (2013). viSNE enables visualization of high dimensional single-cell data and reveals phenotypic heterogeneity of leukemia. Nat. Biotechnol.31, 545–552. 10.1038/nbt.2594
3
AndersS.HuberW. (2010). Differential expression analysis for sequence count data. Genome Biol.11:R106. 10.1186/gb-2010-11-10-r106
4
AndersS.PylP. T.HuberW. (2014). HTSeq—a python framework to work with high-throughput sequencing data. Bioinformatics31, 166–169. 10.1093/bioinformatics/btu638
5
AndrewsS. (2010). FastQC: a quality control tool for high throughput sequence data. Available online at: http://www.bioinformatics.babraham.ac.uk/projects/fastqc
6
BalasubramanianM.SchwartzE. L. (2002). The isomap algorithm and topological stability. Science295:7. 10.1126/science.295.5552.7a
7
BarronM.LiJ. (2016). Identifying and removing the cell-cycle effect from single-cell rna-sequencing data. arXiv:1605.04492.
8
BendallS. C.DavisK. L.Amirel-DTadmorM. D.SimondsE. F.ChenT. J.et al. (2014). Single-cell trajectory detection uncovers progression and regulatory coordination in human b cell development. Cell157, 714–725. 10.1016/j.cell.2014.04.005
9
BeyerK.GoldsteinJ.RamakrishnanR.ShaftU. (1999). When Is ‘Nearest Neighbor’ Meaningful?, in DATABASE Theory–ICDT'99 (Jerusalem: Springer), 217–235.
10
BolgerA. M.LohseM.UsadelB. (2014). Trimmomatic: a flexible trimmer for illumina sequence data. Bioinformatics30, 2114–2120. 10.1093/bioinformatics/btu170
11
BoseS.WanZ.CarrA.RizviA. H.VieiraG.Pe'erD.et al. (2015). Scalable microfluidics for single cell rna printing and sequencing. Genome Biol.16:120. 10.1186/s13059-015-0684-3
12
BrayN. L.PimentelH.MelstedP.PachterL. (2016). Near-optimal probabilistic RNA-seq quantification. Nat. Biotechnol.34, 525–527. 10.1038/nbt.3519
13
BrenneckeP.AndersS.KimJ. K.KołodziejczykA. A.ZhangX.ProserpioV.et al. (2013). Accounting for technical noise in single-cell RNA-seq experiments. Nat. Methods10, 1093–1095. 10.1038/nmeth.2645
14
BuettnerF.NatarajanK. N.CasaleF. P.ProserpioV.ScialdoneA.TheisF. J.et al. (2015). Computational analysis of cell-to-cell heterogeneity in single-cell RNA-sequencing data reveals hidden subpopulations of cells. Nat. Biotechnol.33, 55–160. 10.1038/nbt.3102
15
BuettnerF.TheisF. J. (2012). A novel approach for resolving differences in single-cell gene expression patterns from zygote to blastocyst. Bioinformatics28, i626–i632. 10.1093/bioinformatics/bts385
16
CampbellK.PontingC. P.WebberC. (2015). Laplacian eigenmaps and principal curves for high resolution pseudotemporal ordering of single-cell rna-seq profiles. bioRxiv27219. 10.1101/027219
17
ChandramohanR.WuP.-Y.PhanJ. H.WangM. D. (2013). Benchmarking RNA-Seq quantification tools, in Engineering In Medicine and Biology Society (EMBC), 2013 35th Annual International Conference of the IEEE (Osaka), 647–650.
18
ChingT.PeplowskaK.HuangS.ZhuX.ShenY.MolnarJ.et al. (2016). Pan-Cancer analyses reveal long intergenic non-coding rnas relevant to tumor diagnosis, subtyping and prognosis. EBioMedicine7, 62–72. 10.1016/j.ebiom.2016.03.023
19
CoxM. P.PetersonD. A.BiggsP. J. (2010). SolexaQA: at-a-glance quality assessment of illumina second-generation sequencing data. BMC Bioinformatics11:485. 10.1186/1471-2105-11-485
20
der MaatenL.HintonG. (2008). Visualizing data using T-SNE. J. Mach. Learn. Res.9, 2579–2605. Available online at: https://lvdmaaten.github.io/publications/papers/JMLR_2008.pdf
21
DeyS. S.KesterL.SpanjaardB.BienkoM.van OudenaardenA. (2015). Integrated genome and transcriptome sequencing of the same cell. Nat. Biotechnol.33, 285–289. 10.1038/nbt.3129
22
DiazA.LiuS. J.SandovalC.PollenA.NowakowskiT. J.LimD. A.et al. (2016). SCell: integrated analysis of single-cell RNA-Seq data. Bioinformatics32, 2219–2220. 10.1093/bioinformatics/btw201
23
DingB.ZhengL.ZhuY.LiN.JiaH.AiR.et al. (2015). Normalization and noise reduction for single cell RNA-Seq experiments. Bioinformatics31, 2225–2227. 10.1093/bioinformatics/btv122
24
DobinA.GingerasT. R. (2015). Mapping RNA-seq reads with STAR. Curr. Protoc. Bioinform.51, 11.14.1–11.14.19. 10.1002/0471250953.bi1114s51
25
EngströmP. G.SteijgerT.SiposB.GrantG. R.KahlesA.RätschG.et al. (2013). Systematic evaluation of spliced alignment programs for RNA-seq data. Nat. Methods10, 1185–1191. 10.1038/nmeth.2722
26
FanJ.-B.JeanJ. J.-B.SalathiaN.LiuR.KaeserG. E.YungY. C.et al. (2016). Characterizing transcriptional heterogeneity through pathway and gene set overdispersion analysis. Nat. Methods13, 241–244. 10.1038/nmeth.3734
27
FinakG.McDavidA.YajimaM.DengJ.GersukV.ShalekA. K.et al. (2015). MAST: a flexible statistical framework for assessing transcriptional changes and characterizing heterogeneity in single-cell RNA sequencing data. Genome Biol.16:278. 10.1186/s13059-015-0844-5
28
FonsecaN. A.MarioniJ.BrazmaA. (2014). RNA-Seq gene profiling-a systematic empirical comparison. PloS ONE9:e107026. 10.1371/journal.pone.0107026
29
FortunatoS. (2010). Community detection in graphs. Phys. Rep.486, 75–174. 10.1016/j.physrep.2009.11.002
30
FreemanB. T.JungJ. P.OgleB. M. (2016). Single-Cell RNA-seq reveals activation of unique gene groups as a consequence of stem cell-parenchymal cell fusion. Sci. Rep.6:23270. 10.1038/srep23270
31
GaoY.WangF.EisingerB. E.KelnhoferL. E.JobeE. M.ZhaoX. (2016). Integrative single-cell transcriptomics reveals molecular networks defining neuronal maturation during postnatal neurogenesis. Cereb. Cortex. [Epub ahead of print]. 10.1093/cercor/bhw040
32
GrünD.van OudenaardenA. (2015). Design and analysis of single-cell sequencing experiments. Cell163, 799–810. 10.1016/j.cell.2015.10.039
33
GuoM.WangH.PotterS. S.WhitsettJ. A.XuY. (2015). SINCERA: a Pipeline for Single-Cell RNA-Seq profiling analysis. PLoS Comput. Biol.11:e1004575. 10.1371/journal.pcbi.1004575
34
HaghverdiL.BuettnerF.TheisF. J. (2015). Diffusion maps for high-dimensional single-cell analysis of differentiation data. Bioinformatics31, 2989–2998. 10.1093/bioinformatics/btv325
35
HanL.ZiX.GarmireL. X.WuY.WeissmanS. M.PanX.et al. (2014). Co-detection and sequencing of genes and transcripts from the same single cells facilitated by a microfluidics platform. Sci. Rep.4:6485. 10.1038/srep06485
36
HandelA. E.ChintawarS.LalicT.WhiteleyE.VowlesJ.GiustacchiniA.et al. (2016). Assessing similarity to primary tissue and cortical layer identity in induced pluripotent stem cell-derived cortical neurons through single-cell transcriptomics. Hum. Mol. Genet. 25, 989–1000. 10.1093/hmg/ddv637
37
HarrisK.MagnoL.KatonaL.LönnerbergP.Muñoz ManchadoA. B.SomogyiP.et al. (2015). Molecular organization of CA1 interneuron classes. bioRxiv34595. 10.1101/034595
38
HartuvE.ShamirR. (2000). A clustering algorithm based on graph connectivity. Inf. Process. Lett.76, 175–181. 10.1016/S0020-0190(00)00142-3
39
HouY.GuoH.CaoC.LiX.HuB.ZhuP.et al. (2016). Single-Cell triple omics sequencing reveals genetic, epigenetic, and transcriptomic heterogeneity in hepatocellular carcinomas. Cell Res.26, 304–319. 10.1038/cr.2016.23
40
IlicicT.KimJ. K.KolodziejczykA. A.BaggerF. O.McCarthyD. J.MarioniJ. C.et al. (2016). Classification of low quality cells from single-cell RNA-seq data. Genome Biol.17:29. 10.1186/s13059-016-0888-1
41
IslamS.ZeiselA.JoostS.La MannoG.ZajacP.KasperM.et al. (2014). Quantitative single-Cell RNA-Seq with unique molecular identifiers. Nat. Methods11, 163–166. 10.1038/nmeth.2772
42
JaitinD. A.KenigsbergE.Keren-ShaulH.ElefantN.PaulF.ZaretskyI.et al. (2014). Massively parallel Single-Cell RNA-Seq for marker-free decomposition of tissues into cell types. Science343, 776–779. 10.1126/science.1247651
43
JiZ.JiH. (2016). TSCAN: pseudo-time reconstruction and evaluation in Single-Cell RNA-Seq analysis. Nucl. Acids Res. 44:e117. 10.1093/nar/gkw430
44
JiangL.ChenH.PinelloL.YuanG.-C. (2016). GiniClust: detecting rare cell types from single-cell gene expression data with gini index. Genome Biol.17:144. 10.1186/s13059-016-1010-4
45
JiangP.ThomsonJ. AStewartR. (2016). Quality control of Single-Cell RNA-seq by SinQC. Bioinformatics. [Epub ahead of print]. 10.1093/bioinformatics/btw176
46
JohnsonW. E.LiC.RabinovicA. (2007). Adjusting batch effects in microarray expression data using empirical bayes methods. Biostatistics8, 118–127. 10.1093/biostatistics/kxj037
47
KatayamaS.TöhönenV.LinnarssonS.KereJ. (2013). SAMstrt: statistical test for differential expression in single-cell transcriptome with spike-in normalization. Bioinformatics29, 2943–2945. 10.1093/bioinformatics/btt511
48
KatribA.HsuW.BuiA.XingY. (2016). Radiotranscriptomics: a synergy of imaging and transcriptomics in clinical assessment. Quant. Biol.4, 1–12. 10.1007/s40484-016-0061-6
49
KharchenkoP. V.SilbersteinL.ScaddenD. T. (2014). Bayesian approach to single-cell differential expression analysis. Nat. Methods11, 740–742. 10.1038/nmeth.2967
50
KimD.LangmeadB.SalzbergS. L. (2015). HISAT: a fast spliced aligner with low memory requirements. Nat. Methods12, 357–360. 10.1038/nmeth.3317
51
KimD.PerteaG.TrapnellC.PimentelH.KelleyR.SalzbergS. L.et al. (2013). TopHat2: accurate alignment of transcriptomes in the presence of insertions, deletions and gene fusions. Genome Biol.14:R36. 10.1186/gb-2013-14-4-r36
52
KimK. T.LeeH. W.LeeH. O.KimS. C.SeoY. J.ChungW.et al. (2015). Single-Cell mRNA sequencing identifies subclonal heterogeneity in anti-cancer drug responses of lung adenocarcinoma cells. Genome Biol.16:127. 10.1186/s13059-015-0692-3
53
KimmerlingR. J.SzetoG. L.LiJ. W.GenshaftA. S.KazerS. W.PayerK. R.et al. (2016). A microfluidic platform enabling single-cell RNA-seq of multigenerational lineages. Nat. Commun.7:10220. 10.1038/ncomms10220
54
KumarR. M.CahanP.ShalekA. K.SatijaR.DaleyKeyserA. J.LiH.et al. (2014). Deconstructing transcriptional heterogeneity in pluripotent stem cells. Nature516, 56–61. 10.1038/nature13920
55
KvastadL.SolnestamB. W.JohanssonE.NygrenA. O.LaddachN.SahlénP.et al. (2015). Single cell analysis of cancer cells using an improved RT-MLPA method has potential for cancer diagnosis and monitoring. Sci. Rep.5:16519. 10.1038/srep16519
56
LeekJ. T. (2014). Svaseq: removing batch effects and other unwanted noise from sequencing data. Nucleic Acids Res. 42. 10.1093/nar/gku864
57
LengN.ChoiJ.ChuL. F.ThomsonJ. A.KendziorskiC.StewartR. (2016). OEFinder: a user interface to identify and visualize ordering effects in single-cell RNA-seq data. Bioinformatics32, 1408–1410. 10.1093/bioinformatics/btw004
58
LengN.ChuL. F.BarryC.LiY.ChoiJ.LiX.et al. (2015). Oscope identifies oscillatory genes in unsynchronized single-cell RNA-seq experiments. Nat. Methods12, 947–950. 10.1038/nmeth.3549
59
LevineJ. H.SimondsE. F.BendallS. C.DavisK. L.Amir elA. D.TadmorM. D.et al. (2015). Data-driven phenotypic dissection of AML reveals progenitor-like cells that correlate with prognosis. Cell162, 184–197. 10.1016/j.cell.2015.05.047
60
LiB.DeweyC. N. (2011). RSEM: accurate transcript quantification from RNA-seq data with or without a reference genome. BMC Bioinformatics12:323. 10.1186/1471-2105-12-323
61
LiH.HandsakerB.WysokerA.FennellT.RuanJ.HomerN.et al. (2009). The sequence alignment/map format and SAMtools. Bioinformatics25, 2078–2079. 10.1093/bioinformatics/btp352
62
LiJ.TibshiraniR. (2013). Finding consistent patterns: a nonparametric approach for identifying differential expression in RNA-seq data. Stat. Methods Med. Res.22, 519–536. 10.1177/0962280211428386
63
LiaoY.SmythG. K.ShiW. (2013). featurecounts: an efficient general purpose program for assigning sequence reads to genomic features. Bioinformatics. 10.1093/bioinformatics/btt656
64
LohrJ. G.AdalsteinssonV. A.CibulskisK.ChoudhuryA. D.RosenbergM.Cruz-GordilloP.et al. (2014). Whole exome sequencing of circulating tumor cells provides a window into metastatic prostate cancer. Nat. Biotechnol.32:479. 10.1038/nbt.2892
65
LoveM. I.HuberW.AndersS. (2014). Moderated estimation of fold change and dispersion for RNA-seq data with DESeq2. Genome Biol.15, 1–21. 10.1101/002832
66
MacaulayI. C.HaertyW.KumarP.LiY. I.HuT. X.TengM. J.et al. (2015). G&T-Seq: parallel sequencing of single-cell genomes and transcriptomes. Nat. Methods12, 519–522. 10.1038/nmeth.3370
67
MarcoM.KarpR. L.GuoG.RobsonP.HartA. H.TrippaL.et al. (2014). Bifurcation analysis of single-cell gene expression data reveals epigenetic landscape. Proc. Natl. Acad. Sci.111, E5643–E5650. 10.1073/pnas.1408993111
68
MartinM. (2011). Cutadapt removes adapter sequences from high-throughput sequencing reads. EMBnet. J.17:10. 10.14806/ej.17.1.200
69
MeyerS. E.QinT.MuenchD. E.MasudaK.VenkatasubramanianM.OrrE.et al. (2016). Dnmt3a haploinsufficiency transforms Flt3-ITD myeloproliferative disease into a rapid, spontaneous, and fully-penetrant acute myeloid leukemia. Cancer Discov. 6, 501–515. 10.1158/2159-8290.CD-16-0008
70
MiyamotoD. T.ZhengY.WittnerB. S.LeeR. J.ZhuH.BroderickK. T.et al. (2015). RNA-seq of single prostate CTCs implicates noncanonical wnt signaling in antiandrogen resistance. Science349, 1351–1356. 10.1126/science.aab0917
71
MoignardV.WoodhouseS.HaghverdiL.LillyA. J.TanakaY.WilkinsonA. C.et al. (2015). Decoding the regulatory network of early blood development from single-cell gene expression measurements. Nat. Biotechnol.33, 269–276. 10.1038/nbt.3154
72
NavinN.KendallJ.TrogeJ.AndrewsP.RodgersL.McIndooJ.et al. (2011). Tumour evolution inferred by single-cell sequencing. Nature472, 90–94. 10.1038/nature09807
73
NtranosV.KamathG. M.ZhangJ. M.PachterL.TseD. N. (2016). Fast and accurate single-cell RNA-seq analysis by clustering of transcript-compatibility counts. bioRxiv. 17:112. 10.1186/s13059-016-0970-8
74
PatelA. P.TiroshI.TrombettaJ. J.ShalekA. K.GillespieS. M.WakimotoH.et al. (2014). Single-cell RNA-seq highlights intratumoral heterogeneity in primary glioblastoma. Science344, 1396–1401. 10.1126/science.1254257
75
PetropoulosS.EdsgärdD.ReiniusB.DengQ.PanulaS. PCodeluppiS.et al. (2016). Single-cell RNA-seq reveals lineage and x chromosome dynamics in human preimplantation embryos. Cell165, 1012–1026. 10.1016/j.cell.2016.03.023
76
PettitJ.-B.TomerRAchimKRichardsonSAziziL.MarioniJ. (2014). Identifying cell types from spatially referenced single-cell expression datasets. PLoS Comput Biol10:e1003824. 10.1371/journal.pcbi.1003824
77
PiersonE.YauC. (2015). ZIFA: dimensionality reduction for zero-inflated single-cell gene expression analysis. Genome Biol.16, 1–10. 10.1186/s13059-015-0805-z
78
PollenA. A.NowakowskiT. J.ShugaJ.WangX.LeyratA. ALuiJ. H.et al. (2014). Low-coverage single-cell mRNA sequencing reveals cellular heterogeneity and activated signaling pathways in developing cerebral cortex. Nat. Biotechnol.32, 1053–1058. 10.1038/nbt.2967
79
PrabhakaranS.AziziE.Pe'erD. (2016). Dirichlet process mixture model for correcting technical variation in single-cell gene expression data. in Proceedings of The 33rd International Conference on Machine Learning (New York, NY), 1070–1079.
80
RamsköldD.LuoS.WangY.-C.LiR.DengQ.FaridaniO. R.et al. (2012). Full-length mRNA-Seq from single-cell levels of RNA and individual circulating tumor cells. Nat. Biotechnol.30, 777–782. 10.1038/nbt.2282
81
RobinsonM. D.McCarthyD. JSmythG. K. (2010). edgeR: a bioconductor package for differential expression analysis of digital gene expression data. Bioinformatics26, 139–140. 10.1093/bioinformatics/btp616
82
RotemA.RamO.ShoreshN.SperlingR. A.GorenA.WeitzD. A.et al. (2015). Single-Cell ChIP-seq reveals cell subpopulations defined by chromatin state. Nat. Biotechnol.33, 1165–1172. 10.1038/nbt.3383
83
SatijaR.FarrellJ. A.GennertD.SchierA. F.and RegevA. (2015). Spatial reconstruction of single-cell gene expression data. Nat. Biotechnol.33, 495–502. 10.1038/nbt.3192
84
SchurchN. J.SchofieldP.GierlińskiM.ColeC.SherstnevA.SinghV.et al. (2016). How many biological replicates are needed in an RNA-seq experiment and which differential expression tool should you use?RNA22, 839–851. 10.1261/rna.053959.115
85
ShekharK.BrodinP.DavisM. M.ChakrabortyA. K. (2014). Automatic classification of cellular expression by nonlinear stochastic embedding (ACCENSE). Proc. Natl. Acad. Sci.U.S.A.111, 202–207. 10.1073/pnas.1321405111
86
ShinJ.BergD. A.ZhuY.ShinJ. Y.SongJ.BonaguidiM. A.et al. (2015). Single-Cell RNA-Seq with waterfall reveals molecular cascades underlying adult neurogenesis. Cell Stem Cell17, 360–372. 10.1016/j.stem.2015.07.013
87
TangF.BarbacioruC.BaoS.LeeC.NordmanE.WangX.et al. (2010). Tracing the derivation of embryonic stem cells from the inner cell mass by single-cell RNA-seq analysis. Cell Stem Cell6, 468–478. 10.1016/j.stem.2010.03.015
88
TenenbaumJ. B.De SilvaV.LangfordJ. C. (2000). A global geometric framework for nonlinear dimensionality reduction. Science290, 2319–2323. 10.1126/science.290.5500.2319
89
TingD. T.WittnerB. S.LigorioM.JordanN. VShahA. M.MiyamotoD. T.et al. (2014). Single-cell RNA sequencing identifies extracellular matrix gene expression by pancreatic circulating tumor cells. Cell Rep.8, 1905–1918. 10.1016/j.celrep.2014.08.029
90
TiroshI.IzarB.PrakadanS. M.WadsworthM. H.TreacyD.TrombettaJ. J.et al. (2016). Dissecting the multicellular ecosystem of metastatic melanoma by single-cell RNA-seq. Science352, 189–196. 10.1126/science.aad0501
91
TrapnellC.CacchiarelliD.GrimsbyJ.PokharelP.LiS.MorseM.et al. (2014). Pseudo-temporal ordering of individual cells reveals dynamics and regulators of cell fate decisions. Nat. Biotechnol.32, 381. 10.1038/nbt.2859
92
TrapnellC.PachterL.SalzbergS. L. (2009). TopHat: discovering splice junctions with RNA-seq. Bioinformatics25, 1105–1111. 10.1093/bioinformatics/btp120
93
TrapnellC.WilliamsB. A.PerteaG.MortazaviA.KwanG.Van BarenM. J.et al. (2010). Transcript assembly and quantification by RNA-seq reveals unannotated transcripts and isoform switching during cell differentiation. Nat. Biotechnol.28, 511–515. 10.1038/nbt.1621
94
TraversC.MasakiJ.WeiratherJ.GarmireL. X.ChingT.MasakiJ.et al. (2015). Non-coding yet non-trivial: a review on the computational genomics of lincRNAs. BioData Min.8:44. 10.1186/s13040-015-0075-z
95
TreutleinB.BrownfieldD. G.WuA. R.NeffN. F.MantalasG. L.EspinozaF. H.et al. (2014). Reconstructing lineage hierarchies of the distal lung epithelium using single-cell RNA-seq. Nature509, 371–375. 10.1038/nature13173
96
TsafrirD.TsafrirI.Ein-DorL.ZukO.NottermanD. A.DomanyE. (2005). Sorting points into neighborhoods (SPIN): data analysis and visualization by ordering distance matrices. Bioinformatics21, 2301–2308. 10.1093/bioinformatics/bti329
97
VallejosC. A.MarioniJ. C.RichardsonS. (2015). BASiCS: Bayesian analysis of single-cell sequencing data. PLoS Comput. Biol.11:e1004333. 10.1371/journal.pcbi.1004333
98
VuT. N.WillsQ. F.KalariK. R.NiuN.WangL.RantalainenM.et al. (2016). Beta-poisson model for single-cell RNA-seq data analyses. Bioinformatics32, 2128–2135. 10.1093/bioinformatics/btw202
99
WangB.ZhuJ.PiersonE.BatzoglouS. (2016). Visualization and analysis of single-cell RNA-seq data by kernel-based similarity learning. bioRxiv.52225. 10.1101/052225
100
WangJ.-Y.BensmailH.GaoX. (2012). Multiple graph regularized protein domain ranking. BMC Bioinformatics13:307. 10.1186/1471-2105-13-307
101
WangK.SinghD.ZengZ.ColemanS. J.HuangY.SavichG. L.et al. (2010). MapSplice: accurate mapping of RNA-seq reads for splice junction discovery. Nucleic Acids Res.38:e178. 10.1093/nar/gkq622
102
WelchJ. D.HarteminkA. J.PrinsJ. F. (2016). SLICER: inferring branched, nonlinear cellular trajectories from single cell RNA-seq data. Genome Biol.17:106. 10.1186/s13059-016-0975-3
103
WuT. D.ReederJ.LawrenceM.BeckerG.BrauerM. J. (2016). GMAP and GSNAP for genomic sequence alignment: enhancements to speed, accuracy, and functionality. Stat. Genomics Methods Protoc. 1418, 283–334. 10.1007/978-1-4939-3578-9_15
104
XuC.SuZ. (2015). Identification of cell types from single-cell transcriptomes using a novel clustering method. Bioinformatics31, 1974–1980. 10.1093/bioinformatics/btv088
105
YanL.YangM.GuoH.YangL.WuJ.LiR.et al. (2013). Single-cell RNA-seq profiling of human preimplantation embryos and embryonic stem cells. Nat. Struct. Mol. Biol.20, 1131–1139. 10.1038/nsmb.2660
106
YangX.LiuD.LiuF.WuJ.ZouJ.XiaoX.et al. (2013). HTQC: a fast quality control toolkit for illumina sequencing data. BMC Bioinformatics14:33. 10.1186/1471-2105-14-33
107
ZeiselA.Muñoz-ManchadoA. B.CodeluppiS.LönnerbergP.MannoG. L.JuréusA.et al. (2015). Cell types in the mouse cortex and hippocampus revealed by single-cell RNA-seq. Science347, 1138–1142. 10.1126/science.aaa1934
108
ZhangT.LuoY.LiuK.PanL.ZhangB.YuJ.et al. (2011). BIGpre: a quality assessment package for next-generation sequencing data. Genomics, Proteomics Bioinformatics9, 238–244. 10.1016/S1672-0229(11)60027-2
109
ZhuZ.ChenZ.ZhangK.WangM.MedovoyD.WhitakerJ. W.et al. (2016). Constructing 3D interaction maps from 1D epigenomes. Nat. Commun.7:10812. 10.1038/ncomms10812
110
ZurauskieneJ.YauC. (2015). pcaReduce: hierarchical clustering of single cell transcriptional profiles. bioRxiv.26385. 10.1186/s12859-016-0984-y
Summary
Keywords
single-cell genomics, single-cell analysis, bioinformatics, heterogeneity, microevolution
Citation
Poirion OB, Zhu X, Ching T and Garmire L (2016) Single-Cell Transcriptomics Bioinformatics and Computational Challenges. Front. Genet. 7:163. doi: 10.3389/fgene.2016.00163
Received
01 May 2016
Accepted
02 September 2016
Published
21 September 2016
Volume
7 - 2016
Edited by
H. Steven Wiley, Pacific Northwest National Laboratory, USA
Reviewed by
Seth G. N. Grant, University of Edinburgh, UK; Milind Ratnaparkhe, Indian Institute of Soybean Research (ICAR), India
Updates
Copyright
© 2016 Poirion, Zhu, Ching and Garmire.
This is an open-access article distributed under the terms of the Creative Commons Attribution License (CC BY). The use, distribution or reproduction in other forums is permitted, provided the original author(s) or licensor are credited and that the original publication in this journal is cited, in accordance with accepted academic practice. No use, distribution or reproduction is permitted which does not comply with these terms.
*Correspondence: Lana Garmire lgarmire@cc.hawaii.edu
This article was submitted to Genomic Assay Technology, a section of the journal Frontiers in Genetics
†These authors have contributed equally to this work.
Disclaimer
All claims expressed in this article are solely those of the authors and do not necessarily represent those of their affiliated organizations, or those of the publisher, the editors and the reviewers. Any product that may be evaluated in this article or claim that may be made by its manufacturer is not guaranteed or endorsed by the publisher.