 Tao Zhong
 Jiangtao Hu†
 Siyuan Zhan
 Jiazhong Guo
- Farm Animal Genetic Resources Exploration and Innovation Key Laboratory of Sichuan Province, College of Animal Science and Technology, Sichuan Agricultural University, Chengdu, China
The rumen is an important digestive organ in ruminants. Numerous regulatory factors including microRNAs (miRNAs) are involved in embryonic organ development. In the present study, miRNAs expressed in the rumens of goats (Capra hircus) and their potential roles in the pathways involved in rumen development were identified using high-throughput sequencing. Histological morphology revealed a distinct difference in each layer of rumen during the period from embryonic day 60 (E60) to embryonic day 135 (E135). We determined the expression profiles of miRNAs in the goat rumen, and identified 423 known miRNAs and 559 potentially novel miRNAs in the E60 and E135 embryonic rumen, respectively. Bioinformatics analysis annotated the 42 differentially expressed miRNAs and the top 10 most highly expressed miRNAs of the two libraries to 48 and 38 gene ontology categories, as well as to 168 and 71 Kyoto Encyclopedia of Genes and Genomes pathways, respectively. The expression patterns of eight randomly selected miRNAs were validated by stem-loop quantitative reverse transcription PCR, suggesting that the sequencing data were reliable. We profiled the genome-wide expression of rumen-expressed miRNAs at different prenatal stages of rumen tissues, revealing that a subset of miRNAs might play important roles in the formation of the rumen layers. Taken together, these findings will aid the investigation of dominant rumen-related miRNA sets and help understand the genetic control of rumen development in goats.
Introduction
The rumen, a specialist digestive organ of ruminants, plays a vital role in digestion metabolism. Its wall can be divided into four layers: the mucosa, submucosa, muscularis, and tunica adventitia. In goats (Capra hircus), rumen papillae appear to be separated by clear boundaries at embryonic day 64 (E64); by embryonic day 150 (E150), rumen papillae are fully developed and show signs of surface keratinization (Franco et al., 1992). To date, studies have focused on the effect of dietary composition and nutrition on rumen development (Coverdale et al., 2004; Gupta et al., 2016; Suarez-Mena et al., 2016). Naeem et al. (2012) also evaluated the expression of genes involved in rumen development, while several microRNAs (miRNAs) associated with development of the digestive tract have been reported (Hino et al., 2008; McKenna et al., 2010; Nguyen et al., 2010; Dalmasso et al., 2011; Kim et al., 2011; Ye et al., 2011; Chen et al., 2013). However, the role of miRNAs in the goat rumen during embryonic development has not been described.
MicroRNAs were originally identified as negative regulators of their target genes that binding to the sequences of 3′-untranslated region (3′-UTR) (Lim et al., 2005). They may also induce gene expression by targeting the promoter sequences of target genes (Place et al., 2008). Although miRNAs are encoded by only a small number of genes, they may regulate the expression of many mRNAs (Berezikov et al., 2005; Lewis et al., 2005). Increasing evidence has suggested that miRNAs are implicated in embryonic development (Wienholds et al., 2005), cell differentiation (Ivey and Srivastava, 2010), proliferation (Brennecke et al., 2003), apoptosis (Cimmino et al., 2005), and tumorigenesis (Yamanaka et al., 2012; Han et al., 2015).
Little genetic information is available about the development of the rumen in goats, and differences between miRNA profiles during the formation of rumen layers are also unknown. Therefore, in the present study, we used RNA sequencing technology to understand the complex regulation of rumen development at gestational day 60 (before rumen papillae formation) and gestational day 135 (after rumen papillae formation). Systematical analyses were carried out of known miRNAs, potentially novel miRNAs, differentially expressed miRNAs, and their target genes. We also observed the morphology of rumen tissues at different development stages (E60 and E135) to provide an insight into the mechanisms of miRNA regulation of rumen development.
Materials and Methods
Ethics Statement
All animal experiments were performed in strict accordance with the Regulations for the Administration of Affairs Concerning Experimental Animals (Ministry of Science and Technology, China, revised in June 2004) and given prior approval by the Institutional Animal Care and Use Committee at the College of Animal Science and Technology, Sichuan Agricultural University, Sichuan, China under permit No. DKY-B20110807. All animals were sacrificed humanely to minimize suffering.
Rumen Collection and Total RNA Isolation
Pregnant does were provided by the Station of the Jianyang Da’er Goat Breeding Center (Sichuan, China). Six pregnant does at two embryonic stages (E60 and E135) were anesthetized by Zoletil (4 mg/kg body weight) for cesarean section. Rumen tissues were collected from the embryos (n = 3 per stage). The six rumen tissues were immediately frozen in liquid nitrogen, and then stored at -80°C until required for RNA isolation. Total RNA was isolated using TRIzol reagent (Invitrogen, Carlsbad, CA, United States). The purity, concentration, and quality of the RNA were determined by a Nanodrop 2000 spectrophotometer (Thermo Scientific Nanodrop, Wilmington, DE, United States), Qubit 3.0 Fluorometer (Life Technologies, Camarillo, CA, United States), and Agilent 2100 Bioanalyzer (Agilent Technologies, Palo Alto, CA, United States), respectively.
Hematoxylin and Eosin Staining
The fixed rumen samples were dehydrated and embedded in paraffin. Sections (5-μm) were cut using a microtome (LeicaRM2016, Leica Microsystems, Germany) and placed on glass slides. The sections were stained with hematoxylin and eosin (H&E) and viewed using an Olympus BX51 microscope (Olympus, Tokyo, Japan) equipped with a Nikon DS-Fi1 camera (Nikon, Tokyo, Japan).
Small RNA Library Construction and Sequencing
Approximately 1.5 μg of total RNA was used to generate small RNA libraries with TruSeq Small RNA Sample Prep Kits (Illumina, San Diego, CA, United States) according to the manufacturer’s protocol. Briefly, small RNAs were ligated to 3′ and 5′ RNA adapters. The ligated small RNAs were reverse transcribed and amplified by PCR. The PCR products were then purified by denaturing polyacrylamide gel electrophoresis (PAGE). After examining the concentration and insert size by a Qubit 3.0 Fluorometer (Life Technologies, Camarillo, CA, United States) and Agilent 2100 Bioanalyzer (Agilent Technologies, Palo Alto, CA, United States), the libraries were subjected to 50 bp single-end reads sequencing on an Illumina HiSeq 2500 platform (Illumina, San Diego, CA, United States).
Sequencing Data Analysis and Identification of miRNAs
Raw reads in fastq format were filtered out the low-quality reads, reads containing poly-N (>10% unknown bases), and reads containing adapter using in-house scripts (fastq v1.11) written in Perl. Then reads were trimmed and cleaned by removing the sequences smaller than 18 nt or longer than 30 nt. In addition, Q30 of the clean data were also calculated. The clean reads were aligned with Silva, GtRNAdb, Rfam, and Repbase databases, respectively, to filter rRNA, tRNA, snRNA, snoRNA, other ncRNA, and repeat sequences using the Bowtie v.1.1.0 software (Langmead et al., 2009). The derived reads were used to detect known goat miRNAs by aligned to the goat miRNA precursors present in the miRBase v212 as described in our previous study (Guo et al., 2016a). Clear reads were also mapped to the goat reference genome (CHIR_1.0, NCBI) using the Bowtie aligner. The mapped reads were further denoted as known miRNAs under the following criteria: (i) aligned to the mature known miRNA precursors of other animal species in miRBase, (ii) raw count for known miRNAs was quantified and normalized using transcripts per million (TPM) mapped reads. Only those miRNAs, an overall expression level greater than one RPM in six libraries, were denoted as true known miRNAs. The unannotated reads which mismatched to any public databases or goat genome were further analyzed to identify novel miRNAs using Mirdeep2 v2.0.0.7 (Friedlander et al., 2012), with the default options (e.g., minimal free energy < -18 kcal/mol) as described in our previous study (Guo et al., 2016a).
Differential Expression Analysis of miRNAs
To assess the differentially expressed miRNAs, the DESeq2 package in the statistics software R (Version 3.0.1) was used with standard parameters (Love et al., 2014). In order to avoid false positive results, the two criteria: only |log2 (Fold change)| ≥ 1 and the false-discovery rate (FDR) adjusted p-value ≤ 0.01 were used to determine the differentially expressed miRNAs.
Target Prediction and Functional Annotation of Target Genes
TargetScan (Lewis et al., 2003), RNAhybrid (Kruger and Rehmsmeier, 2006), and miRanda (Betel et al., 2010) prediction tools were used to predict the target genes of differentially expressed miRNAs. To filter out the false positives, the predicted target genes were retained only when they were identified by all the three programs.
The predicted target gene candidates of differentially expressed miRNAs were mapped in NR (Deng et al., 2006), Swiss-Prot (Apweiler et al., 2004), gene ontology (GO) (The Gene Ontology Consortium et al., 2000), COG (Tatusov et al., 2000), Kyoto Encyclopedia of Genes and Genomes (KEGG) (Kanehisa et al., 2004), KOG (Koonin et al., 2004), and Pfam (Eddy, 1998) databases to obtain annotation information. GO enrichment analysis3 was performed using three ontologies (cellular component, molecular function, and biological process). To understand the biological functions of target genes, KEGG pathway analysis was performed.
Validation of Differentially Expressed miRNAs
To validate the sequencing data, eight randomly selected miRNAs (including six known and two novel miRNAs) were validated by stem-loop quantitative real-time reverse transcription PCR (qRT-PCR). Total RNA (5 ng) was reverse transcribed into cDNA using the Mir-XTM miRNA First-Strand Synthesis Kit (TaKaRa, Dalian, China) according to the user’s manual. To detect the expression patterns of target genes of differentially expressed miRNAs, cDNA was synthesized using the PrimeScript RT Reagent Kit (TaKaRa, Dalian, China). The cDNA products were diluted 1:5 (v/v) with EASY Dilution (TaKaRa, Dalian, China) and stored at -20°C. Primers used in this study are shown in Supplementary Table S8.
Quantitative real-time reverse transcription PCR was performed using a CFX Connect Real-Time PCR Detection System (Bio-Rad Laboratories, Singapore) in a volume of 10 μL including 5 μL of SYBR Green Real Time PCR Master Mix (TaKaRa, Dalian, China), 0.2 μL each of forward and reverse primer, 3.8 μL of RNase-Free dH2O, and 0.8 μL of cDNA. U6 snRNA was used as the reference for miRNA and target gene candidates (Guo et al., 2016a). All reactions were performed in triplicate, and the relative expression level was normalized by 2-ΔΔCT method.
Results
Histological Observation of the Embryonic Goat Rumen
To observe the differences between E60 and E135 goat rumens, H&E-stained sections were prepared. As shown in Figure 1, each layer of E60 rumen was thinner than that those of the E135 rumen. At E135, rumen papillae were more developed than at E60, appearing as evaginations of the stratum basale toward the stratum granulosum. Moreover, cells in the lamina propria were more closely packed, the diameters of muscle fibers were increased, and the spaces between muscle fibers were wider. Finally, more numerous blood vessels were found in the tunica muscularis.
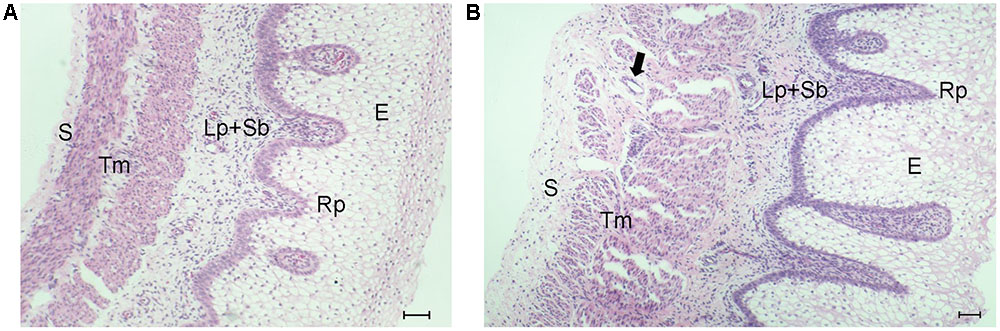
FIGURE 1. Histological observation of embryonic goat rumen tissues. The wall is composed of four layers: epithelium (E), lamina propria and submucosa (Lp + Sb), tunica muscularis (Tm), and serosa (S). (A) Photomicrograph of rumen wall at E60. (B) Photomicrograph of rumen wall at E135. The arrow indicates the blood vessel. Bar, 100 μm.
Overview of Sequencing Data
To obtain a transcriptome of the caprine rumen at different developmental stages, two libraries were constructed from goats at E60 and E135. An average of 18,810,062 and 21,162,680 raw reads was obtained from E60 and E135, respectively (Table 1). After removing low-quality sequences and adapters, an average of 15,500,932 and 19,252,745 clean reads, respectively, was retained (Table 1). The rRNA, scRNA, snRNA, snoRNA, tRNA, and repeat sequences were filtered from clean reads to obtain an average of 13,630,047 and 17,583,220 reads, respectively, which were mapped to the goat genome (CHIR_1.0, NCBI) using the miRDeep2 program (Supplementary Table S1). The reads between 18 and 30 nt were BLASTed against the miRBase, which identified 423 known miRNAs and 559 novel miRNAs (Supplementary Table S2).
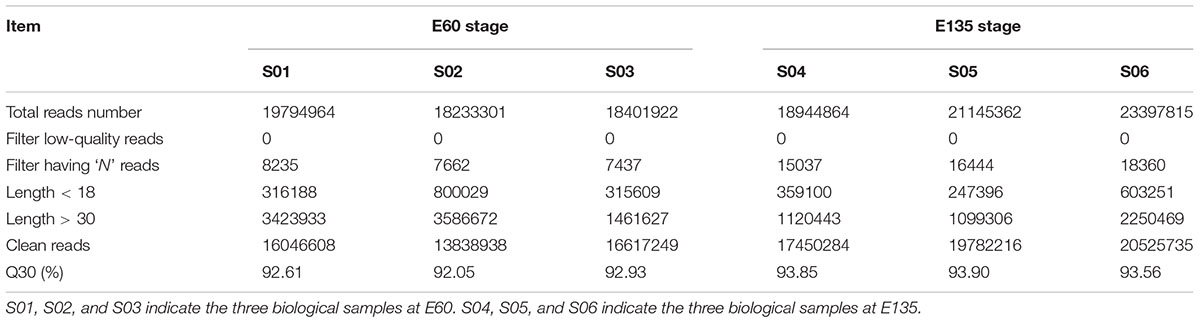
TABLE 1. Summary of reads from raw data and clean reads for microRNAs (miRNAs) sequencing in goat rumen.
Expression Analysis of miRNAs in the Embryonic Goat Rumen
As shown in Figure 2A, most miRNAs were 22 nt in length, followed by 21 and 23 nt, indicating good sequencing quality. Expression density distributions were analyzed according to the normalized reads. As shown in Figure 2B, the expression levels were highly consistent among the six tested samples and between the different embryonic periods (Supplementary Figure S1). Differential expression analysis found that 42 miRNAs were differentially expressed, of which 22 miRNAs were up-regulated and 20 were down-regulated: 27 of the miRNAs were known while 15 were novel (Table 2). However, sample size is an important point for the determination of DE miRNAs, less abundant miRNAs might be hidden in a small sample size.
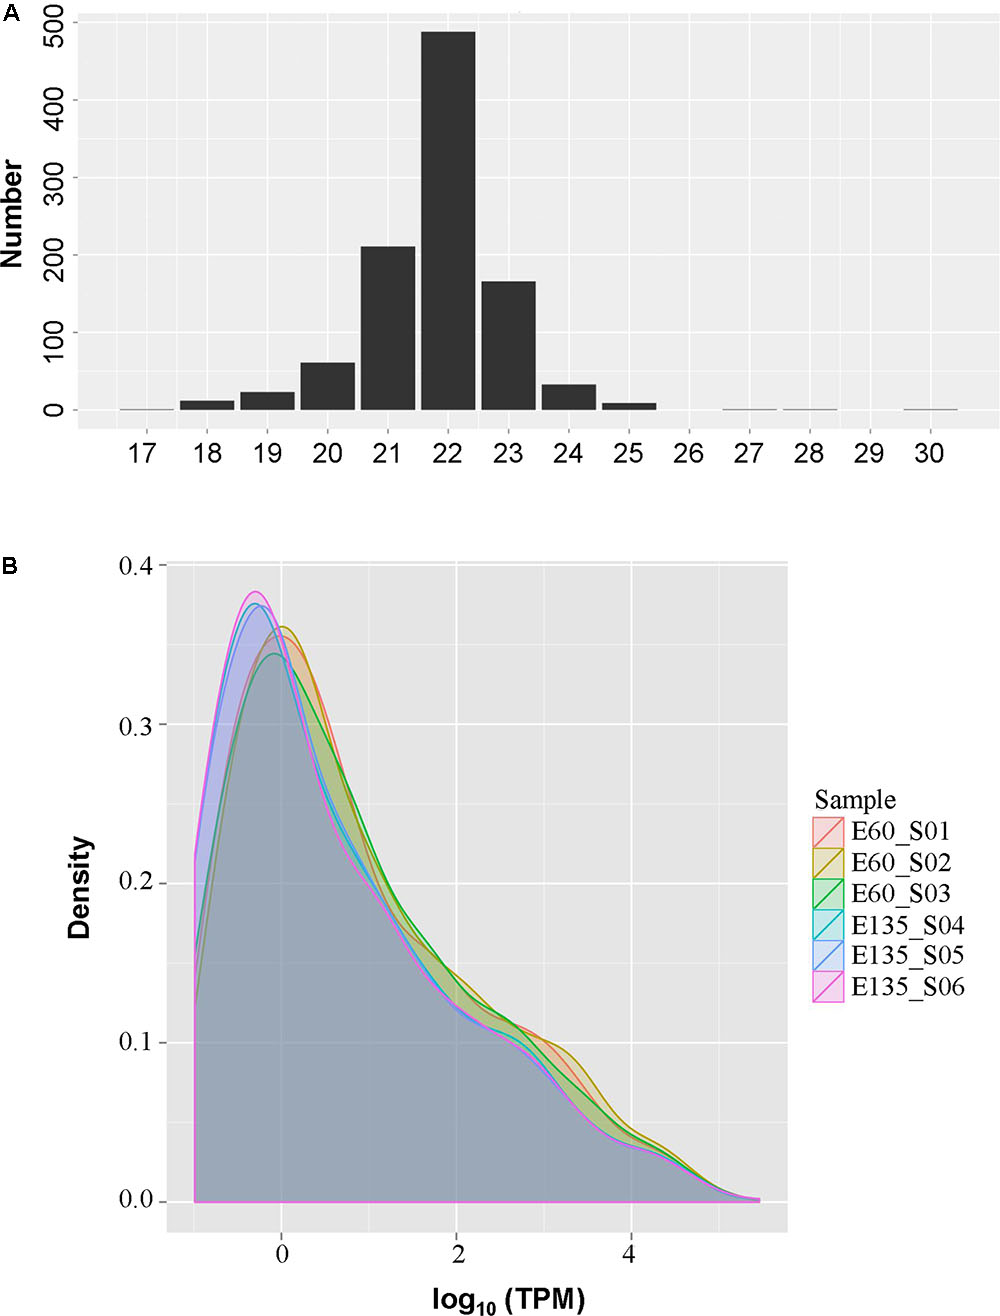
FIGURE 2. The size (A) and expression density (B) distributions of the microRNAs (miRNAs) in goat rumen tissues.
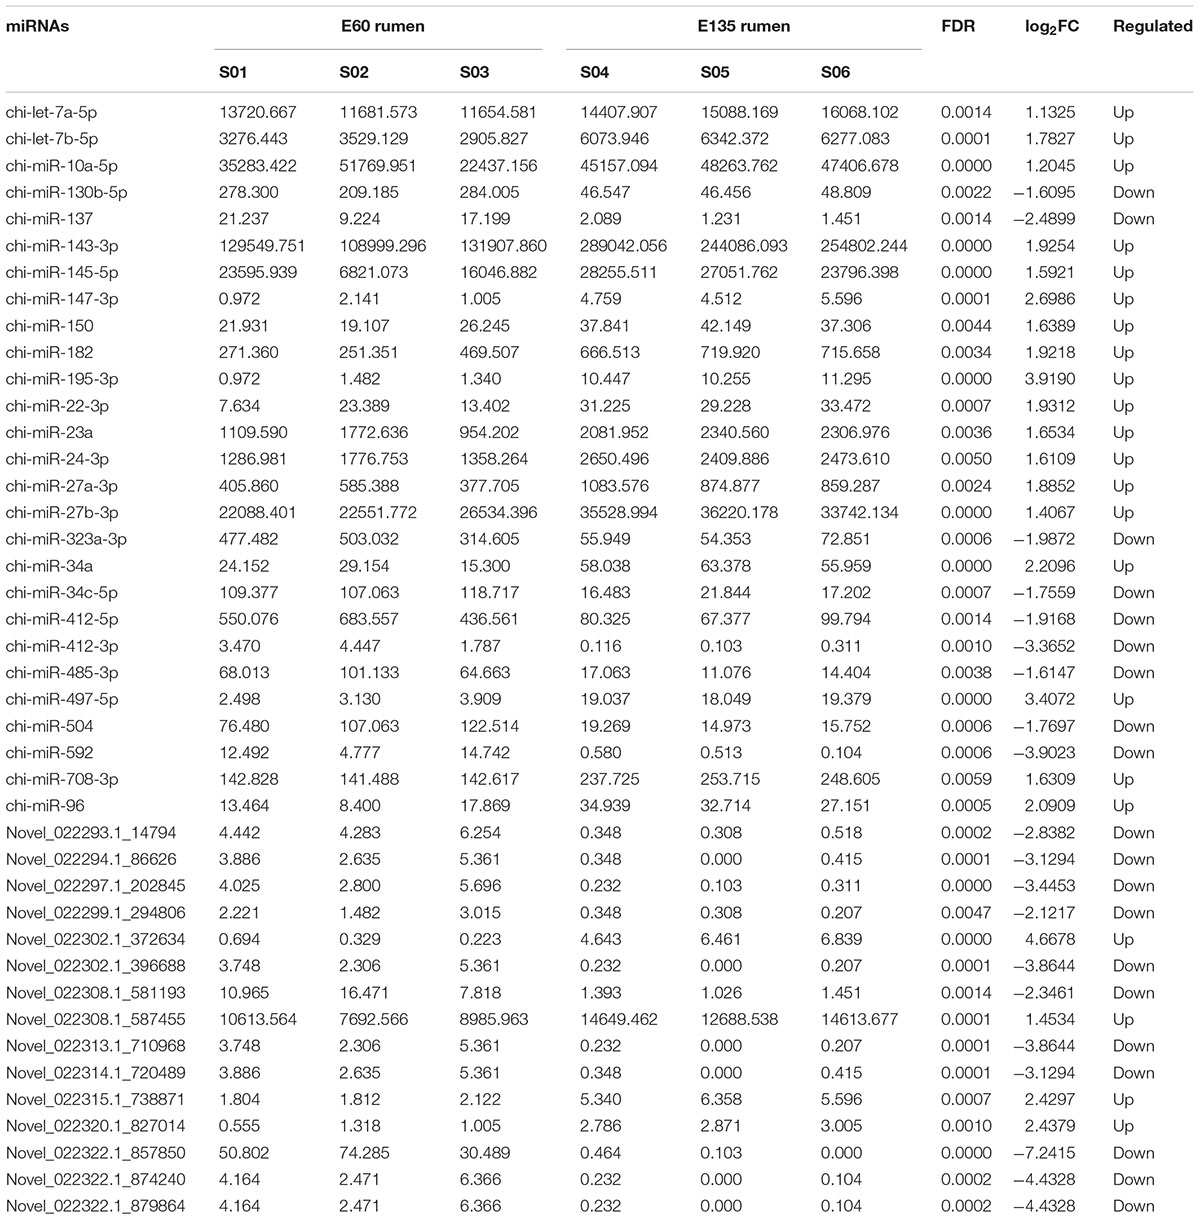
TABLE 2. List of the differentially expressed miRNAs identified at E60 and E135 rumen tissues.
We also focused on miRNAs with high TPM in each library. The reads of the top 10 most highly expressed miRNAs accounted for 50.6 and 63.9% of the total average reads, respectively, in each library. A total of 11 miRNAs are listed in the top 10 of the two libraries, of which 9 (except miR-7-5p and miR-145-5p) are found in both libraries (Table 3).
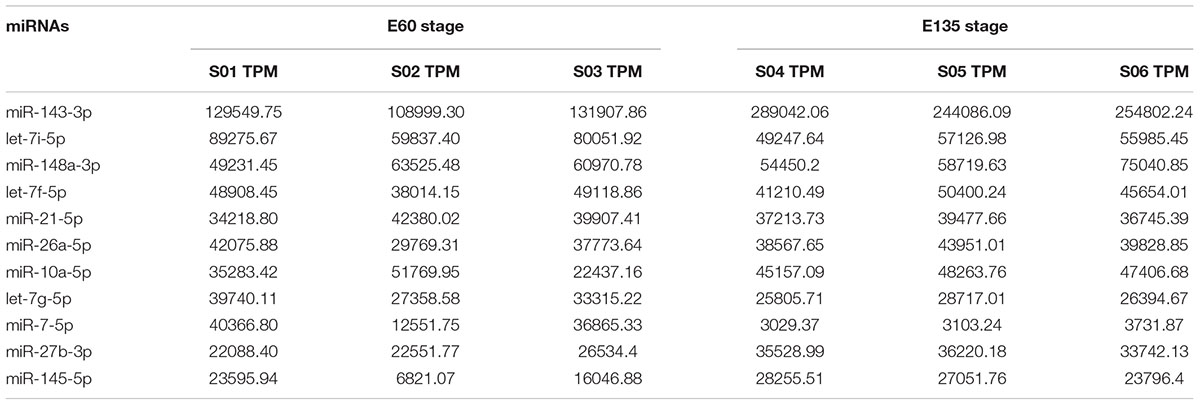
TABLE 3. Top 10 most highly expressed miRNAs of two libraries.
GO Enrichment Analysis and KEGG Pathway Analysis of Target Genes
Target gene prediction found that 223 genes were predicted to be targeted by 18 differentially expressed miRNAs, while 65 genes were predicted to be targeted by 6 of the top 10 most highly expressed miRNAs (Supplementary Tables S3, S4). Supplementary Table S5 shows the annotation of target genes for all miRNAs.
Gene ontology enrichment analysis of these putative target genes revealed that 175 and 54 target genes of differentially expressed and the top 10 most highly expressed miRNAs, respectively, were annotated. As shown in Figure 3, the most enriched GO categories of differentially expressed miRNAs were consistent with those of the top 10 most highly expressed miRNAs. The analysis of cellular component showed that most genes were involved in cell and cell part categories. The analysis of molecular function showed that most genes were clustered into binding and catalytic activities. Moreover, the analysis of biological process showed that most genes were related to single organism and cellular processes.
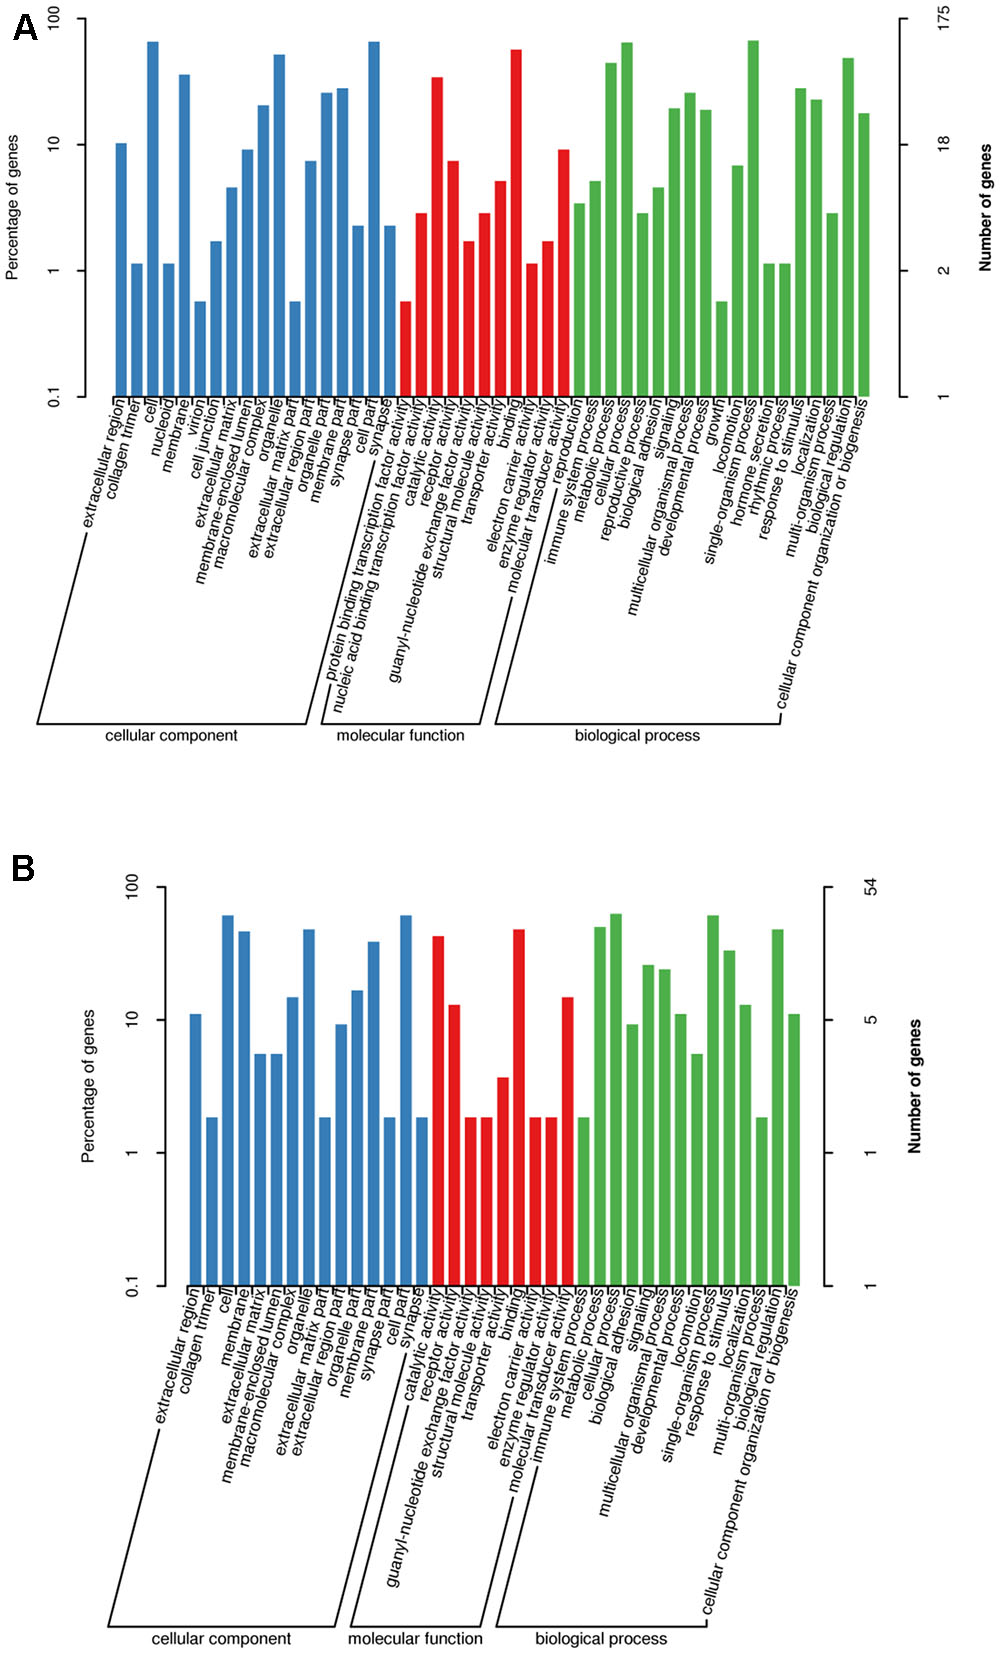
FIGURE 3. Partial gene ontology classification for predicted miRNAs. (A) Gene ontology classification for differentially expressed miRNAs. (B) Gene ontology classification for top 10 highly expressed miRNAs.
Kyoto Encyclopedia of Genes and Genomes pathway annotation showed that 168 and 71 biological functions were annotated by target genes of differentially expressed and the top 10 most highly expressed miRNAs, respectively (Supplementary Tables S6, S7). The enriched pathways for target genes of differentially expressed miRNAs mainly included the Ras signaling pathway, the phosphoinositide 3-kinase (PI3K)-Akt signaling pathway, focal adhesion, and regulation of the actin cytoskeleton. KEGG pathway analysis based on predicted targets revealed that the top 10 most highly expressed miRNAs were involved in the mitogen-activated protein kinase (MAPK) signaling pathway, the Ras signaling pathway, the PI3K-Akt signaling pathway, and olfactory transduction.
Quantitative Real-Time-PCR Validation of the Differentially Expressed miRNAs
Eight miRNAs, including six known and two novel miRNAs, were randomly selected to validate the reliability of the sequencing data. As shown in Figure 4, relative expression changes of miRNAs were represented using log2 (E135/E60). All selected miRNAs showed expression changes that were consistent with the deep sequencing results, suggesting that the sequencing data were credible.
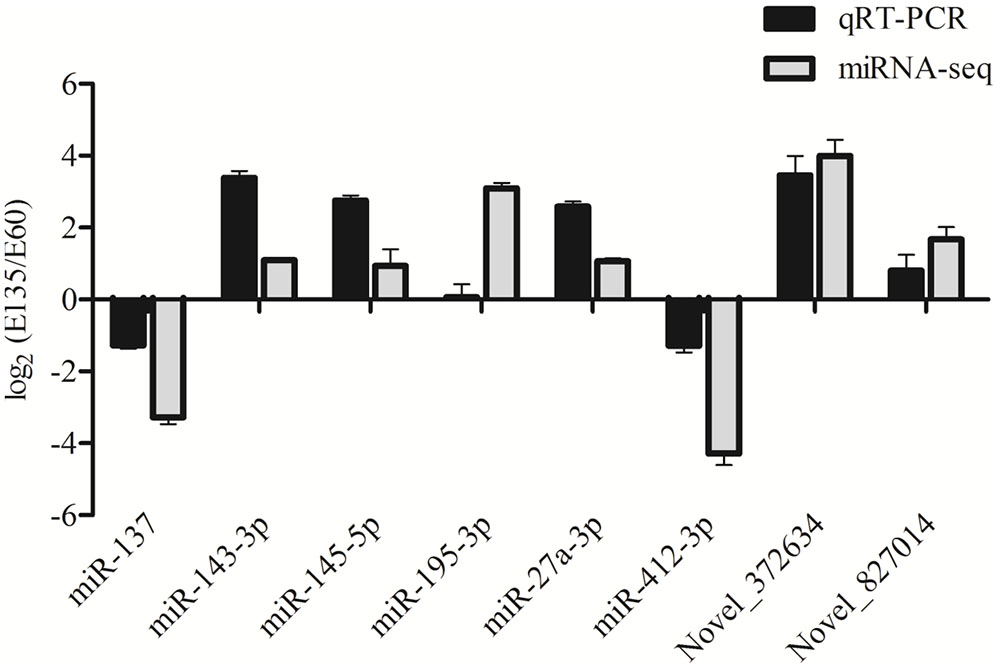
FIGURE 4. Validation of differentially expressed miRNAs by stem-loop qRT-PCR.
Discussion
Histological analysis revealed that the goat E60 rumen is composed of four layers, and that the rumen mainly undergoes a process of tissue growth during the period from E60 to E135. Rudimentary pillars have previously been observed in the E46 rumen, whose wall lacked a complete structure (Garcia et al., 2012). This indicates that samples earlier than E46 should be used to identify miRNAs with important roles in rumen development.
Embryonic rumen development involves the formation and differentiation of the rumen wall, and differentiation of the epithelial layer. The molecular mechanism for this complex biological process has not been reported yet. However, numerous studies have focused on the development and regulatory mechanisms of intestinal epithelial cells, and Wnt and Notch signaling pathways were identified as determining factors for cell fate (Nakamura et al., 2007). In this study, differentially expressed miRNAs such as miR-182 (Kim et al., 2012), miR-23a (Wang et al., 2012), and miR-195-3p (Chen et al., 2011) were reported to mainly take part in the regulation of cell proliferation, differentiation, and apoptosis. Moreover, miR-34a was shown to promote renal senescence and regulate neural stem cell differentiation (Aranha et al., 2011; Bai et al., 2011), while miR-592 regulates neuronal apoptosis through p75NTR (Irmady et al., 2014). These findings suggest that differentially expressed miRNAs are involved in cell differentiation and apoptosis, mitochondrial metabolism and neuronal development of the goat rumen. Moreover, the top 10 most highly expressed miRNAs, such as miR-26a-5p (Guo et al., 2016b) and miR-27b-3p (Tao et al., 2015), were also implicated in cell proliferation. Interestingly, let-7i-5p, let-7f-5p, and miR-21-5p are highly expressed in the porcine ovary and testis, suggesting that they are associated with secretory function (Li et al., 2011). miR-143 and miR-145 are co-expressed miRNAs that are not expressed in colonic epithelial tissue (Kent et al., 2014). Deep sequencing results revealed that they were highly expressed in the goat rumen, although the expression of miR-145 was significantly lower than that of miR-143 in both E60 and E135, which may be caused by post-transcriptional regulation. The expression of the conserved miRNAs in goat rumen revealed that the top 10 abundant miRNAs might act important roles in the development or physiology of rumen layers. These miRNAs could be studied as the preferred candidate miRNAs for regulation analysis of rumen development in ruminants. However, it is also crucial to point that DE miRNAs associated with rumen development could be limited by the small sample size in our study. Therefore, the evaluation of DE miRNAs in goat rumen with larger sample size might produce more reliable and compatible results.
Functional enrichment analysis revealed that the differentially expressed and top 10 most highly expressed miRNAs shared similar functions (Supplementary Table S5 and Figure 3). GO annotation analysis revealed that a large proportion of the genes of miRNA targets in goat rumen were involved in the (extra)cellular structures and cytoskeleton, which had binding and catalytic functions. Consistently, no specifically expressed miRNAs were found between E60 and E135. The most enriched pathways, including MAPK, Ras, and PI3K-Akt signaling pathways, are implicated in gastric cell proliferation, intestinal epithelial cell growth, and intestinal epithelial cell proliferation, respectively (Osaki et al., 2011; Waseem et al., 2014; Depeille et al., 2015). In addition, KEGG analysis also showed that approximately 24% pathways of the top 10 miRNAs were committed to internal secretion, cancer, leukemia, and virus infection diseases (Supplementary Table S7). These results indicated that some miRNAs might be involved in cell proliferation, apoptosis, and phagocytosis. Further research is required to demonstrate the relationship between miRNAs and target mRNAs transcripts and their pathways in the development of the goat rumen.
Conclusion
This study identified miRNAs of the E60 and E135 goat rumen and evaluated expression of these miRNAs at the two time points. A total of 423 known miRNAs and 559 novel miRNAs were identified. Analysis of 42 differentially expressed and the 11 top most highly expressed miRNAs revealed that most of their target genes are involved in cellular activities such as proliferation, differentiation, and apoptosis, which is consistent with histological observations. To identify miRNAs that play essential roles in early rumen development, samples before E46 should be examined. However, our current results provide useful information for further research, which will contribute to the elucidation of the molecular mechanisms involved in rumen development.
Author Contributions
TZ conceived and designed the experiments. JH and PX performed the experiments. JH and SZ analyzed the data. LW, JG, LL, and HZ participated in sample collection. HZ, LN, and TZ contributed reagents/materials. JH and TZ wrote the manuscript.
Funding
This work was partially supported by the grants from National Natural Science Foundation of China (31501936) and the Chinese Domestic Animal Germplasm Resources Infrastructure.
Conflict of Interest Statement
The authors declare that the research was conducted in the absence of any commercial or financial relationships that could be construed as a potential conflict of interest.
The reviewer RS and handling Editor declared their shared affiliation.
Supplementary Material
The Supplementary Material for this article can be found online at: https://www.frontiersin.org/articles/10.3389/fgene.2017.00163/full#supplementary-material
FIGURE S1 | Box plot of the expression levels among the six tested rumen samples.
Footnotes
- ^https://github.com/ZHONGTAO2017/filter/blob/data-filter/.gitattributes
- ^http://www.mirbase.org
- ^http://www.geneontology.org/
References
Apweiler, R., Bairoch, A., Wu, C. H., Barker, W. C., Boeckmann, B., Ferro, S., et al. (2004). UniProt: the universal protein knowledgebase. Nucleic Acids Res. 32, D115–D119. doi: 10.1093/nar/gkh131
Aranha, M. M., Santos, D. M., Sola, S., Steer, C. J., and Rodrigues, C. M. (2011). miR-34a regulates mouse neural stem cell differentiation. PLOS ONE 6:e21396. doi: 10.1371/journal.pone.0021396
Bai, X. Y., Ma, Y., Ding, R., Fu, B., Shi, S., and Chen, X. M. (2011). miR-335 and miR-34a promote renal senescence by suppressing mitochondrial antioxidative enzymes. J. Am. Soc. Nephrol. 22, 1252–1261. doi: 10.1681/ASN.2010040367
Berezikov, E., Guryev, V., van de Belt, J., Wienholds, E., Plasterk, R. H., and Cuppen, E. (2005). Phylogenetic shadowing and computational identification of human microRNA genes. Cell 120, 21–24. doi: 10.1016/j.cell.2004.12.031
Betel, D., Koppal, A., Agius, P., Sander, C., and Leslie, C. (2010). Comprehensive modeling of microRNA targets predicts functional non-conserved and non-canonical sites. Genome Biol. 11:R90. doi: 10.1186/gb-2010-11-8-r90
Brennecke, J., Hipfner, D. R., Stark, A., Russell, R. B., and Cohen, S. M. (2003). bantam encodes a developmentally regulated microRNA that controls cell proliferation and regulates the proapoptotic gene hid in Drosophila. Cell 113, 25–36. doi: 10.1016/S0092-8674(03)00231-9
Chen, Y., Xiao, Y., Ge, W., Zhou, K., Wen, J., Yan, W., et al. (2013). miR-200b inhibits TGF-beta1-induced epithelial-mesenchymal transition and promotes growth of intestinal epithelial cells. Cell Death Dis. 4, e541. doi: 10.1038/cddis.2013.22
Chen, Y. Q., Wang, X. X., Yao, X. M., Zhang, D. L., Yang, X. F., Tian, S. F., et al. (2011). MicroRNA-195 promotes apoptosis in mouse podocytes via enhanced caspase activity driven by BCL2 insufficiency. Am. J. Nephrol. 34, 549–559. doi: 10.1159/000333809
Cimmino, A., Calin, G. A., Fabbri, M., Iorio, M. V., Ferracin, M., Shimizu, M., et al. (2005). miR-15 and miR-16 induce apoptosis by targeting BCL2. Proc. Natl. Acad. Sci. U.S.A. 102, 13944–13949. doi: 10.1073/pnas.0506654102
Coverdale, J., Tyler, H., Quigley, J., and Brumm, J. (2004). Effect of various levels of forage and form of diet on rumen development and growth in calves. J. Dairy Sci. 87, 2554–2562. doi: 10.3168/jds.S0022-0302(04)73380-9
Dalmasso, G., Nguyen, H. T., Yan, Y., Laroui, H., Charania, M. A., Obertone, T. S., et al. (2011). MicroRNA-92b regulates expression of the oligopeptide transporter PepT1 in intestinal epithelial cells. Am. J. Physiol. Gastrointest. Liver Physiol. 300, G52–G59. doi: 10.1152/ajpgi.00394.2010
Deng, Y., Li, J., Wu, S., Zhu, Y., Chen, Y., and He, F. (2006). Integrated nr database in protein annotation system and its localization. Comput. Eng. 32, 71–74.
Depeille, P., Henricks, L. M., van de Ven, R. A., Lemmens, E., Wang, C. Y., Matli, M., et al. (2015). RasGRP1 opposes proliferative EGFR-SOS1-Ras signals and restricts intestinal epithelial cell growth. Nat. Cell Biol. 17, 804–815. doi: 10.1038/ncb3175
Eddy, S. R. (1998). Profile hidden Markov models. Bioinformatics 14, 755–763. doi: 10.1093/bioinformatics/14.9.755
Franco, A., Regodon, S., Robina, A., and Redondo, E. (1992). Histomorphometric analysis of the rumen of sheep during development. Am. J. Vet. Res. 53, 1209–1217.
Friedlander, M. R., Mackowiak, S. D., Li, N., Chen, W., and Rajewsky, N. (2012). miRDeep2 accurately identifies known and hundreds of novel microRNA genes in seven animal clades. Nucleic Acids Res. 40, 37–52. doi: 10.1093/nar/gkr688
Garcia, A., Masot, J., Franco, A., Gazquez, A., and Redondo, E. (2012). Histomorphometric and immunohistochemical study of the goat rumen during prenatal development. Anat. Rec. 295, 776–785. doi: 10.1002/ar.22431
Guo, J., Zhao, W., Zhan, S., Li, L., Zhong, T., Wang, L., et al. (2016a). Identification and expression profiling of miRNAome in goat longissimus dorsi muscle from prenatal stages to a neonatal stage. PLOS ONE 11:e0165764. doi: 10.1371/journal.pone.0165764
Guo, K., Zheng, S., Xu, Y., Xu, A., Chen, B., and Wen, Y. (2016b). Loss of miR-26a-5p promotes proliferation, migration, and invasion in prostate cancer through negatively regulating SERBP1. Tumour Biol. 37, 12843–12854. doi: 10.1007/s13277-016-5158-z
Gupta, M., Khan, N., Rastogi, A., ul Haq, Z., and Varun, T. (2016). Nutritional drivers of rumen development: a review. Agric. Rev. 37, 148–153. doi: 10.18805/ar.v37i2.10740
Han, T. S., Hur, K., Xu, G., Choi, B., Okugawa, Y., Toiyama, Y., et al. (2015). MicroRNA-29c mediates initiation of gastric carcinogenesis by directly targeting ITGB1. Gut 64, 203–214. doi: 10.1136/gutjnl-2013-306640
Hino, K., Tsuchiya, K., Fukao, T., Kiga, K., Okamoto, R., Kanai, T., et al. (2008). Inducible expression of microRNA-194 is regulated by HNF-1α during intestinal epithelial cell differentiation. RNA 14, 1433–1442. doi: 10.1261/rna.810208
Irmady, K., Jackman, K. A., Padow, V. A., Shahani, N., Martin, L. A., Cerchietti, L., et al. (2014). Mir-592 regulates the induction and cell death-promoting activity of p75NTR in neuronal ischemic injury. J. Neurosci. 34, 3419–3428. doi: 10.1523/JNEUROSCI.1982-13.2014
Ivey, K. N., and Srivastava, D. (2010). MicroRNAs as regulators of differentiation and cell fate decisions. Cell Stem Cell 7, 36–41. doi: 10.1016/j.stem.2010.06.012
Kanehisa, M., Goto, S., Kawashima, S., Okuno, Y., and Hattori, M. (2004). The KEGG resource for deciphering the genome. Nucleic Acids Res. 32, D277–D280. doi: 10.1093/nar/gkh063
Kent, O. A., McCall, M. N., Cornish, T. C., and Halushka, M. K. (2014). Lessons from miR-143/145: the importance of cell-type localization of miRNAs. Nucleic Acids Res. 42, 7528–7538. doi: 10.1093/nar/gku461
Kim, B. M., Woo, J., Kanellopoulou, C., and Shivdasani, R. A. (2011). Regulation of mouse stomach development and Barx1 expression by specific microRNAs. Development 138, 1081–1086. doi: 10.1242/dev.056317
Kim, K. M., Park, S. J., Jung, S. H., Kim, E. J., Jogeswar, G., Ajita, J., et al. (2012). miR-182 is a negative regulator of osteoblast proliferation, differentiation, and skeletogenesis through targeting FoxO1. J. Bone. Miner. Res. 27, 1669–1679. doi: 10.1002/jbmr.1604
Koonin, E. V., Fedorova, N. D., Jackson, J. D., Jacobs, A. R., Krylov, D. M., Makarova, K. S., et al. (2004). A comprehensive evolutionary classification of proteins encoded in complete eukaryotic genomes. Genome Biol. 5:R7. doi: 10.1186/gb-2004-5-2-r7
Kruger, J., and Rehmsmeier, M. (2006). RNAhybrid: microRNA target prediction easy, fast and flexible. Nucleic Acids Res. 34, W451–W454. doi: 10.1093/nar/gkl243
Langmead, B., Trapnell, C., Pop, M., and Salzberg, S. L. (2009). Ultrafast and memory-efficient alignment of short DNA sequences to the human genome. Genome Biol. 10:R25. doi: 10.1186/gb-2009-10-3-r25
Lewis, B. P., Burge, C. B., and Bartel, D. P. (2005). Conserved seed pairing, often flanked by adenosines, indicates that thousands of human genes are microRNA targets. Cell 120, 15–20. doi: 10.1016/j.cell.2004.12.035
Lewis, B. P., Shih, I. H., Jones-Rhoades, M. W., Bartel, D. P., and Burge, C. B. (2003). Prediction of mammalian microRNA targets. Cell 115, 787–798. doi: 10.1016/S0092-8674(03)01018-3
Li, M., Liu, Y., Wang, T., Guan, J., Luo, Z., Chen, H., et al. (2011). Repertoire of porcine microRNAs in adult ovary and testis by deep sequencing. Int. J. Biol. Sci. 7, 1045–1055. doi: 10.7150/ijbs.7.1045
Lim, L. P., Lau, N. C., Garrett-Engele, P., Grimson, A., Schelter, J. M., Castle, J., et al. (2005). Microarray analysis shows that some microRNAs downregulate large numbers of target mRNAs. Nature 433, 769–773. doi: 10.1038/nature03315
Love, M. I., Huber, W., and Anders, S. (2014). Moderated estimation of fold change and dispersion for RNA-seq data with DESeq2. Genome Biol. 15, 550. doi: 10.1186/s13059-014-0550-8
McKenna, L. B., Schug, J., Vourekas, A., McKenna, J. B., Bramswig, N. C., Friedman, J. R., et al. (2010). MicroRNAs control intestinal epithelial differentiation, architecture, and barrier function. Gastroenterology 139, 1654–1664. doi: 10.1053/j.gastro.2010.07.040
Naeem, A., Drackley, J. K., Stamey, J., and Loor, J. J. (2012). Role of metabolic and cellular proliferation genes in ruminal development in response to enhanced plane of nutrition in neonatal Holstein calves. J. Dairy Sci. 95, 1807–1820. doi: 10.3168/jds.2011-4709
Nakamura, T., Tsuchiya, K., and Watanabe, M. (2007). Crosstalk between Wnt and Notch signaling in intestinal epithelial cell fate decision. J. Gastroenterol. 42, 705–710. doi: 10.1007/s00535-007-2087-z
Nguyen, H. T., Dalmasso, G., Yan, Y., Laroui, H., Dahan, S., Mayer, L., et al. (2010). MicroRNA-7 modulates CD98 expression during intestinal epithelial cell differentiation. J. Biol. Chem. 285, 1479–1489. doi: 10.1074/jbc.M109.057141
Osaki, L. H., Figueiredo, P. M., Alvares, E. P., and Gama, P. (2011). EGFR is involved in control of gastric cell proliferation through activation of MAPK and Src signalling pathways in early-weaned rats. Cell Prolif. 44, 174–182. doi: 10.1111/j.1365-2184.2011.00733.x
Place, R. F., Li, L. C., Pookot, D., Noonan, E. J., and Dahiya, R. (2008). MicroRNA-373 induces expression of genes with complementary promoter sequences. Proc. Natl. Acad. Sci. U.S.A. 105, 1608–1613. doi: 10.1073/pnas.0707594105
Suarez-Mena, F. X., Heinrichs, A. J., Jones, C. M., Hill, T. M., and Quigley, J. D. (2016). Straw particle size in calf starters: effects on digestive system development and rumen fermentation. J. Dairy Sci. 99, 341–353. doi: 10.3168/jds.2015-9884
Tao, J., Zhi, X., Zhang, X., Fu, M., Huang, H., Fan, Y., et al. (2015). miR-27b-3p suppresses cell proliferation through targeting receptor tyrosine kinase like orphan receptor 1 in gastric cancer. J. Exp. Clin. Cancer Res. 34, 139. doi: 10.1186/s13046-015-0253-3
Tatusov, R. L., Galperin, M. Y., Natale, D. A., and Koonin, E. V. (2000). The COG database: a tool for genome-scale analysis of protein functions and evolution. Nucleic Acids Res. 28, 33–36. doi: 10.1093/nar/28.1.33
The Gene Ontology Consortium, Ashburner, M., Ball, C. A., Blake, J. A., Botstein, D., Butler, H., Cherry, J. M., et al. (2000). Gene ontology: tool for the unification of biology. Nat Genet. 25, 25–29. doi: 10.1038/75556
Wang, L., Chen, X., Zheng, Y., Li, F., Lu, Z., Chen, C., et al. (2012). MiR-23a inhibits myogenic differentiation through down regulation of fast myosin heavy chain isoforms. Exp. Cell Res. 318, 2324–2334. doi: 10.1016/j.yexcr.2012.06.018
Waseem, T., Duxbury, M., Ashley, S. W., and Robinson, M. K. (2014). Ghrelin promotes intestinal epithelial cell proliferation through PI3K/Akt pathway and EGFR trans-activation both converging to ERK 1/2 phosphorylation. Peptides 52, 113–121. doi: 10.1016/j.peptides.2013.11.021
Wienholds, E., Kloosterman, W. P., Miska, E., Alvarez-Saavedra, E., Berezikov, E., de Bruijn, E., et al. (2005). MicroRNA expression in zebrafish embryonic development. Science 309, 310–311. doi: 10.1126/science.1114519
Yamanaka, S., Olaru, A. V., An, F., Luvsanjav, D., Jin, Z., Agarwal, R., et al. (2012). MicroRNA-21 inhibits Serpini1, a gene with novel tumour suppressive effects in gastric cancer. Dig. Liver Dis. 44, 589–596. doi: 10.1016/j.dld.2012.02.016
Keywords: goat, rumen development, embyronic stage, microRNAs, RNA-sequencing
Citation: Zhong T, Hu J, Xiao P, Zhan S, Wang L, Guo J, Li L, Zhang H and Niu L (2017) Identification and Characterization of MicroRNAs in the Goat (Capra hircus) Rumen during Embryonic Development. Front. Genet. 8:163. doi: 10.3389/fgene.2017.00163
Received: 30 June 2017; Accepted: 13 October 2017;
Published: 26 October 2017.
Edited by:
David E. MacHugh, University College Dublin, IrelandReviewed by:
Ronan G. Shaughnessy, University College Dublin, IrelandHugo Naya, Institut Pasteur de Montevideo, Uruguay
Peter Vegh, Newcastle University, United Kingdom
Copyright © 2017 Zhong, Hu, Xiao, Zhan, Wang, Guo, Li, Zhang and Niu. This is an open-access article distributed under the terms of the Creative Commons Attribution License (CC BY). The use, distribution or reproduction in other forums is permitted, provided the original author(s) or licensor are credited and that the original publication in this journal is cited, in accordance with accepted academic practice. No use, distribution or reproduction is permitted which does not comply with these terms.
*Correspondence: Tao Zhong, emhvbmd0YW9Ac2ljYXUuZWR1LmNu
†These authors have contributed equally to this work.