 Hao Mei
 Lianna Li3†
- 1Department of Data Science, School of Population Health, University of Mississippi Medical Center, Jackson, MS, United States
- 2Shanghai Children’s Medical Center, Shanghai Jiao Tong University School of Medicine, Shanghai, China
- 3Department of Biology, Tougaloo College, Jackson, MS, United States
- 4Department of Neurology, University of Mississippi Medical Center, Jackson, MS, United States
Seven gene sets were significantly enriched for SNP associations with diabetes, and considered as potential diabetes pathways in a previous meta-analysis of diabetes GWAS. This study aims to examine if these gene sets also have expression associations with diabetes. The analysis was conducted using pooled data from 23 diabetes gene expression studies. Gene associations were examined using linear modeling with an empirical Bayes approach, and pathway associations were investigated by testing enrichment for significant genes. Meta-analyses were performed to investigate gene and pathway associations in all studies and tissue types. The analysis showed that six gene sets and three member genes of ACADSB, RASSF2, and KLF12 had significant associations with diabetes traits. The findings suggest that these gene sets are related to diabetes regulation, and their functions tend to be tissue non-specific.
Introduction
Diabetes mellitus is a chronic metabolic disease of hyperglycemia resulting from defects in insulin secretion, action, or both. The disease has two common etiologies: Type I diabetes (T1D) is mainly caused by beta-cell destruction, and Type II diabetes (T2D) is characterized by defects in insulin action and/or secretion. Development of diabetes is usually accompanied by varied symptoms and complications, and long-term diabetes may cause diabetic nephropathy, retinopathy, peripheral neuropathy and a range of cardiovascular symptoms (American Diabetes Association, 2014). Insulin regulation has been implicated in the pathogenesis of many of these diabetes traits.
Development of diabetes is affected by genetic predispositions within familial aggregations. The heritability of type I diabetes (T1D) is as high as 88% (Hyttinen et al., 2003). The concordance rate of type 2 diabetes (T2D) is 50–92% for monozygotic (MZ) twins, consistently greater than the rate for dizygotic (DZ) twins (Permutt et al., 2005). The complication of diabetic nephropathy has been observed in familial clustering (Seaquist et al., 1989). A twin bivariate genetic study of the Atherosclerosis Risk in Communities (ARIC) population showed that genetic heritability is 30% for fasting glucose and 39% for fasting insulin, and genetic correlation between them is 22 ∼ 39% (Vattikuti et al., 2012). Although T1D and T2D have different etiologies with pathologic changes observable in multiple tissues, they present some common clinical manifestations. A gene expression study has shown that both types of diabetes share pathogenic mechanisms and common pathways (Kaizer et al., 2007). Findings from these studies suggest that these diabetes traits have strong genetic susceptibility, and there are shared genetic components among them. Further genetic studies of diabetes traits and complications can help improve our understanding of the etiology and pathogenesis of diabetes.
Genome-wide association studies (GWAS) have identified hundreds of genetic risk variants associated with diabetes (Welter et al., 2014), typically single nucleotide polymorphisms (SNPs). In the post-GWAS era, ascertaining the biological roles of these variants underlying diabetes pathogenesis is essential. Investigations of expression quantitative trait loci (eQTL) have demonstrated that diabetes risk variants are linked to gene expression (Kang et al., 2012; van de Bunt et al., 2015), providing biological insight regarding variant associations and diabetes development. These linkages may be present in different tissues, showing non-specific characteristics. A genetic pathway, defined as a gene set, consists of genes related to specific biological functions. A diabetes pathway study of GWAS has suggested that SNP associations with diabetes traits are enriched in particular genetic pathways (Mei et al., 2015). Pathway investigations of gene expression have supplemented diabetes GWAS and eQTL studies that have been based on individual SNPs; this approach enhances our comprehension of how systemic genetic regulation may affect the etiology of diabetes. The broad application of advanced high-throughput technology in the past decade has led to the generation of abundant gene expression data sets collected from different tissue types, and gene expression studies can provide insight into genetic functions and biological mechanisms of diseases (Barrett et al., 2011). An investigation of pooled gene expressions from different studies and tissue types can help improve the power to identify gene and pathway signatures associated with a disease.
In our previous study, we proposed a novel method of uniform-score gene-set analysis (USGSA) that uses hypergeometric exact test statistic for GWAS-based pathway identification, and analysis of diabetes GWAS showed that seven gene sets are associated with diabetes traits and pathway member genes share common binding motifs for transcription factors (TFs) of FOXO4, NFAT, TCF3, VSX1 and POU2F1 and microRNA of MIR-218 (Mei et al., 2015). We extended the exact test of USGSA method with developed software package of snpGeneSets to generalize pathway analysis for both GWAS and gene expression study (Mei et al., 2016). Our analysis of NHGRI GWAS catalog and gene expression data using snpGeneSets evidenced that significant SNP associations and differential gene expressions of diabetes are enriched in particular pathways. We further performed pathway analysis of genome-wide differential gene expression and the results suggested that diabetes pathogenesis was involved with both tissue-specific and non-specific genetic pathways (Mei et al., 2017). Based on our studies and published findings, we hypothesize that diabetes pathways enriched for GWAS SNP associations are also enriched for differential gene expressions. We therefore conducted the present follow-up study to investigate our previously identified seven gene sets for their expression associations with diabetes traits in different tissues.
Materials and Methods
Gene Expressions of Candidate Gene Sets
The candidate pathways are seven gene sets enriched for GWAS SNP associations with diabetes traits identified our previous study (Mei et al., 2015) and annotated in the MSigDB database (Liberzon, 2014). The candidate pathways are summarized in Table 1, and each gene set was specified by its pathway ID (PID) (Mei et al., 2016). Member genes of every candidate gene set share common promoter binding motifs for particular transcription factors, including FOXO4, TCF3, NFAT, VSX1, and POU2F1 and microRNA of mir-218.
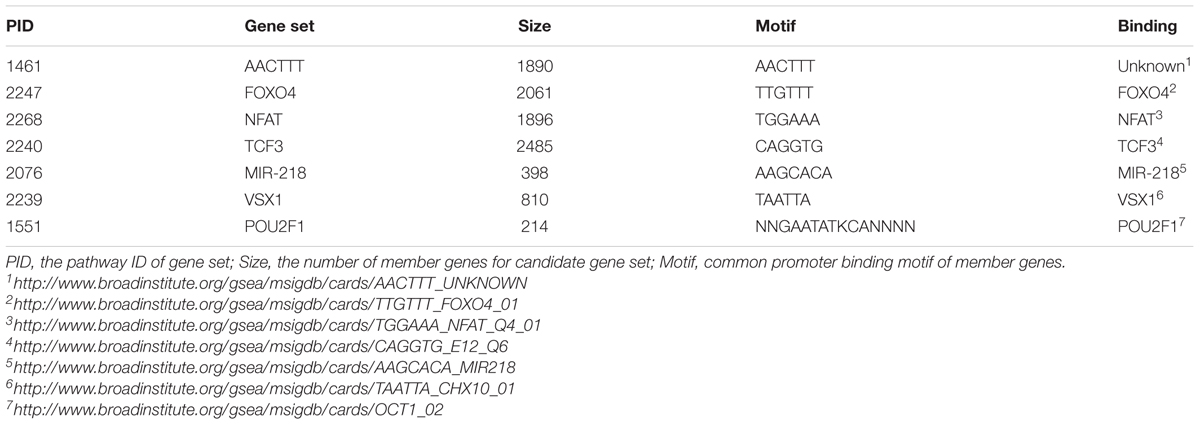
TABLE 1. Description of candidate gene sets.
Gene expressions were obtained from the GEO data sets (GDS) (Barrett et al., 2011) for diabetes traits. All expression GDS were preprocessed and parsed through the R package of GEOquery (Davis and Meltzer, 2007). The M-value of each gene expression (i.e., log 2 -expression level) was extracted and normalized by quantile normalization using the R package, preprocessCore (Bolstad et al., 2003). Multiple GDS of the same samples were merged into a single data set, and the largest M-value was used as the study-specific gene expression (Dozmorov and Wren, 2011).
Gene Expression Association and Meta-Analysis
Differential gene expression (DGE) was investigated by testing the null hypothesis that the expression M-value is equal across different diabetes trait statuses. The hypothesis was tested by fitting a linear model with the R package, limma (Smyth, 2004), which adjusts the standard errors by empirical Bayes approach to obtain an accurate p-value. The snpGeneSets package (Mei et al., 2016) was applied to calculate the association U-score and define significant genes. The association U-score for the i-th gene (Ui) is calculated as Ui =(∑ jI (pj < pi) + 0.5 ⋅∑ jI (pj =pi))/N, where pi is the p-value of the i-th gene and N is the total number of genes. The U-score approximately follows a uniform distribution, and genes with a U-score ≤ 0.05 were defined to have significant DGE.
Meta-analyses of DGE were conducted using both the binomial test and Fisher’s method over multiple expression studies. For a particular gene, the binomial test counted the number of studies with a U-score ≤ 0.05, and the meta-analysis p-value was gene_binp = pr (X ≥  I (Ui < 0.05)), where X is a random variable following a binomial distribution. The Fisher’s method measured the gene’s combined U-scores over GDS, and the p-value was gene_fishp=Pr (X ≥-2 log (Ui)), where X follows a chi-square distribution with df = 46. Study-specific DGE analysis and meta-analysis across studies were summarized in the Supplementary Figure 1.
Pathway Expression Association and Meta-Analysis
The pathway expression association with diabetes traits was examined using the snpGeneSets package (Mei et al., 2016), which measures pathway enrichment of differential gene expressions by hypergeometric exact test. For a candidate gene set Ω and total L genes (Gi, i = 1,…,L), the enrichment effect was measured as πd =k/S - l/L, where K= I (Gi ∈ Ω) I (Ui ≤ α), S=I (Gi ∈ Ω) and l=I (Ui ≤ α). The α equaled 0.05, defined as the significance level, and the estimate of πd had a variation of π0 (1-π0)/S, approximately following a normal distribution. The pathway exact p-value was calculated as
Besides the exact test of snpGeneSets, we also conducted test of pathway expression association with diabetes traits using different methods of gene set enrichment (Hung et al., 2012; Varemo et al., 2013), including Wilcoxon rank-sum and Fisher’s test from piano package (Varemo et al., 2013) and GSEA test (Subramanian et al., 2005) implemented in fgsea package (Sergushichev, unpublished), and obtained p-value based on 10,000 permutations.
Meta-analysis was conducted using binomial test to investigate pathway expression association over studies for all methods (Supplementary Figure 1), and binomial p-value was calculated as above. For exact test of snpGeneSets, the fixed-effect model was also applied to estimate pathway enrichment effect across studies, using the inverse of variance as a study-specific weight. The analysis was performed using the R package of metaphor (Viechtbauer, 2010).
Pathway Expression Heterogeneity and KEGG Pathway Mapping
Pathway expression heterogeneity was tested using the McNemar’s chi-squared method, to compare significant expression patterns of a gene set between two studies (Supplementary Figure 1). For every pair of GDS studies, the number of inconsistent genes was counted, i.e., genes for which we found a significant DGE in one study but that were found to be insignificant in a second study. The p-value was adjusted by the Bonferroni method, and a finding of significant heterogeneity indicates that the gene set had a different expression pattern between studies.
The Kyoto Encyclopedia of Genes and Genomes (KEGG) (Kanehisa et al., 2010) pathway database is a compendium of known biological pathways related to human diseases. Our mapping analysis identified KEGG pathways statistically related to the candidate gene sets based on hypergeometric tests (Supplementary Figure 1). For a total of L genes (Gi, i = 1,…,L), a candidate gene set Φ and a KEGG pathway Ω of S genes, the enrichment effect was measured as πd=k/S - l/L with a variation of (l/L) (1-l/L)/S, and the p-value was
where K=I (Gi ∈ Ω) I(Gi ∈ Φ) and l=I(Gi ∈ Φ). An adjusted p-value was obtained using 10,000 permutation tests. The KEGG mapping analysis was conducted using the snpGeneSets package (Mei et al., 2016).
Results
The procedures for gene and pathway expression analyses of the seven candidate gene sets, which are significantly enriched for GWAS SNP associations with diabetes traits (Mei et al., 2015), are summarized in the Supplementary Figure 1.
Gene Expression Studies
Twenty-three expression studies, consisting of 30 GEO data sets (GDS) (Barrett et al., 2011), are summarized in Table 2. Diabetes traits explored in expression studies included insulin resistance, insulin sensitivity, T1D, T2D, diabetic nephropathy, diabetic neuropathy and diabetic heart failure (HF). Tissues used in expression assays included skeletal muscle, glomeruli, endothelial progenitor cells (EPCs), blood, adipocytes, and liver, heart, artery, nerve, myotube and pancreatic cells.
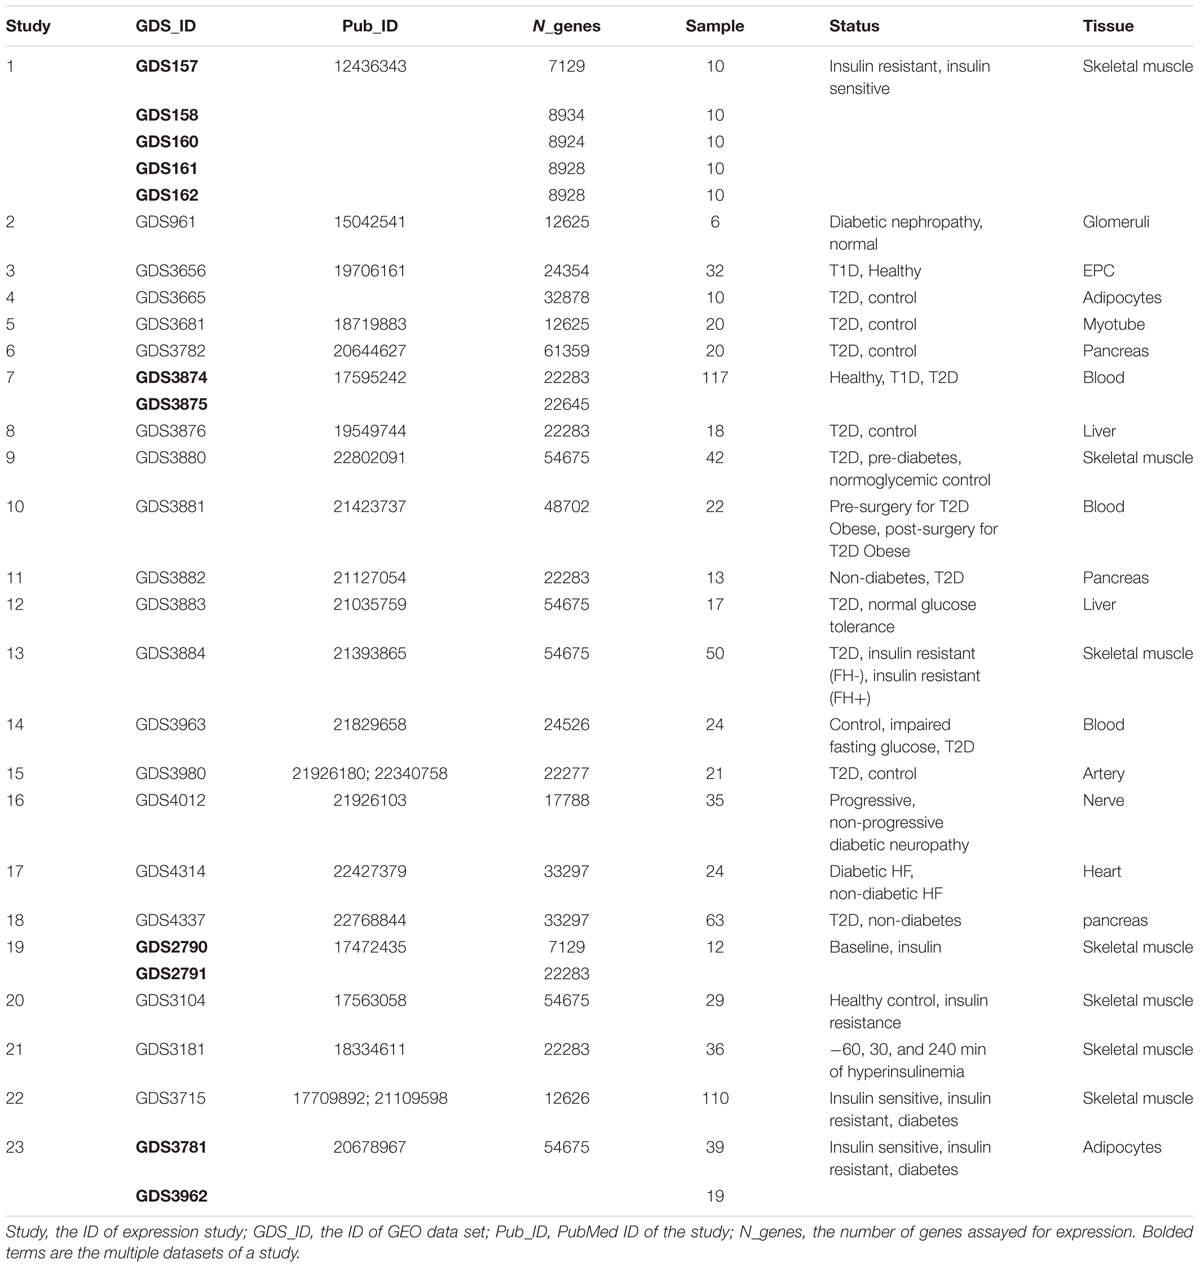
TABLE 2. Expression studies and GEO datasets.
Analysis of Gene Expression Association
The proportion of member genes with significant differential expression (i.e., an association U-score ≤ 0.05) is noted in Figure 1 for every gene set. Given the null hypothesis that a pathway is not associated with a diabetes trait, it was expected that 5% of member genes would have significant expression associations. Our analysis showed that with the exception of the POU2F1 gene set (PID: 1551), more than 5% of member genes from all of the other 6 gene sets had significant expression associations.
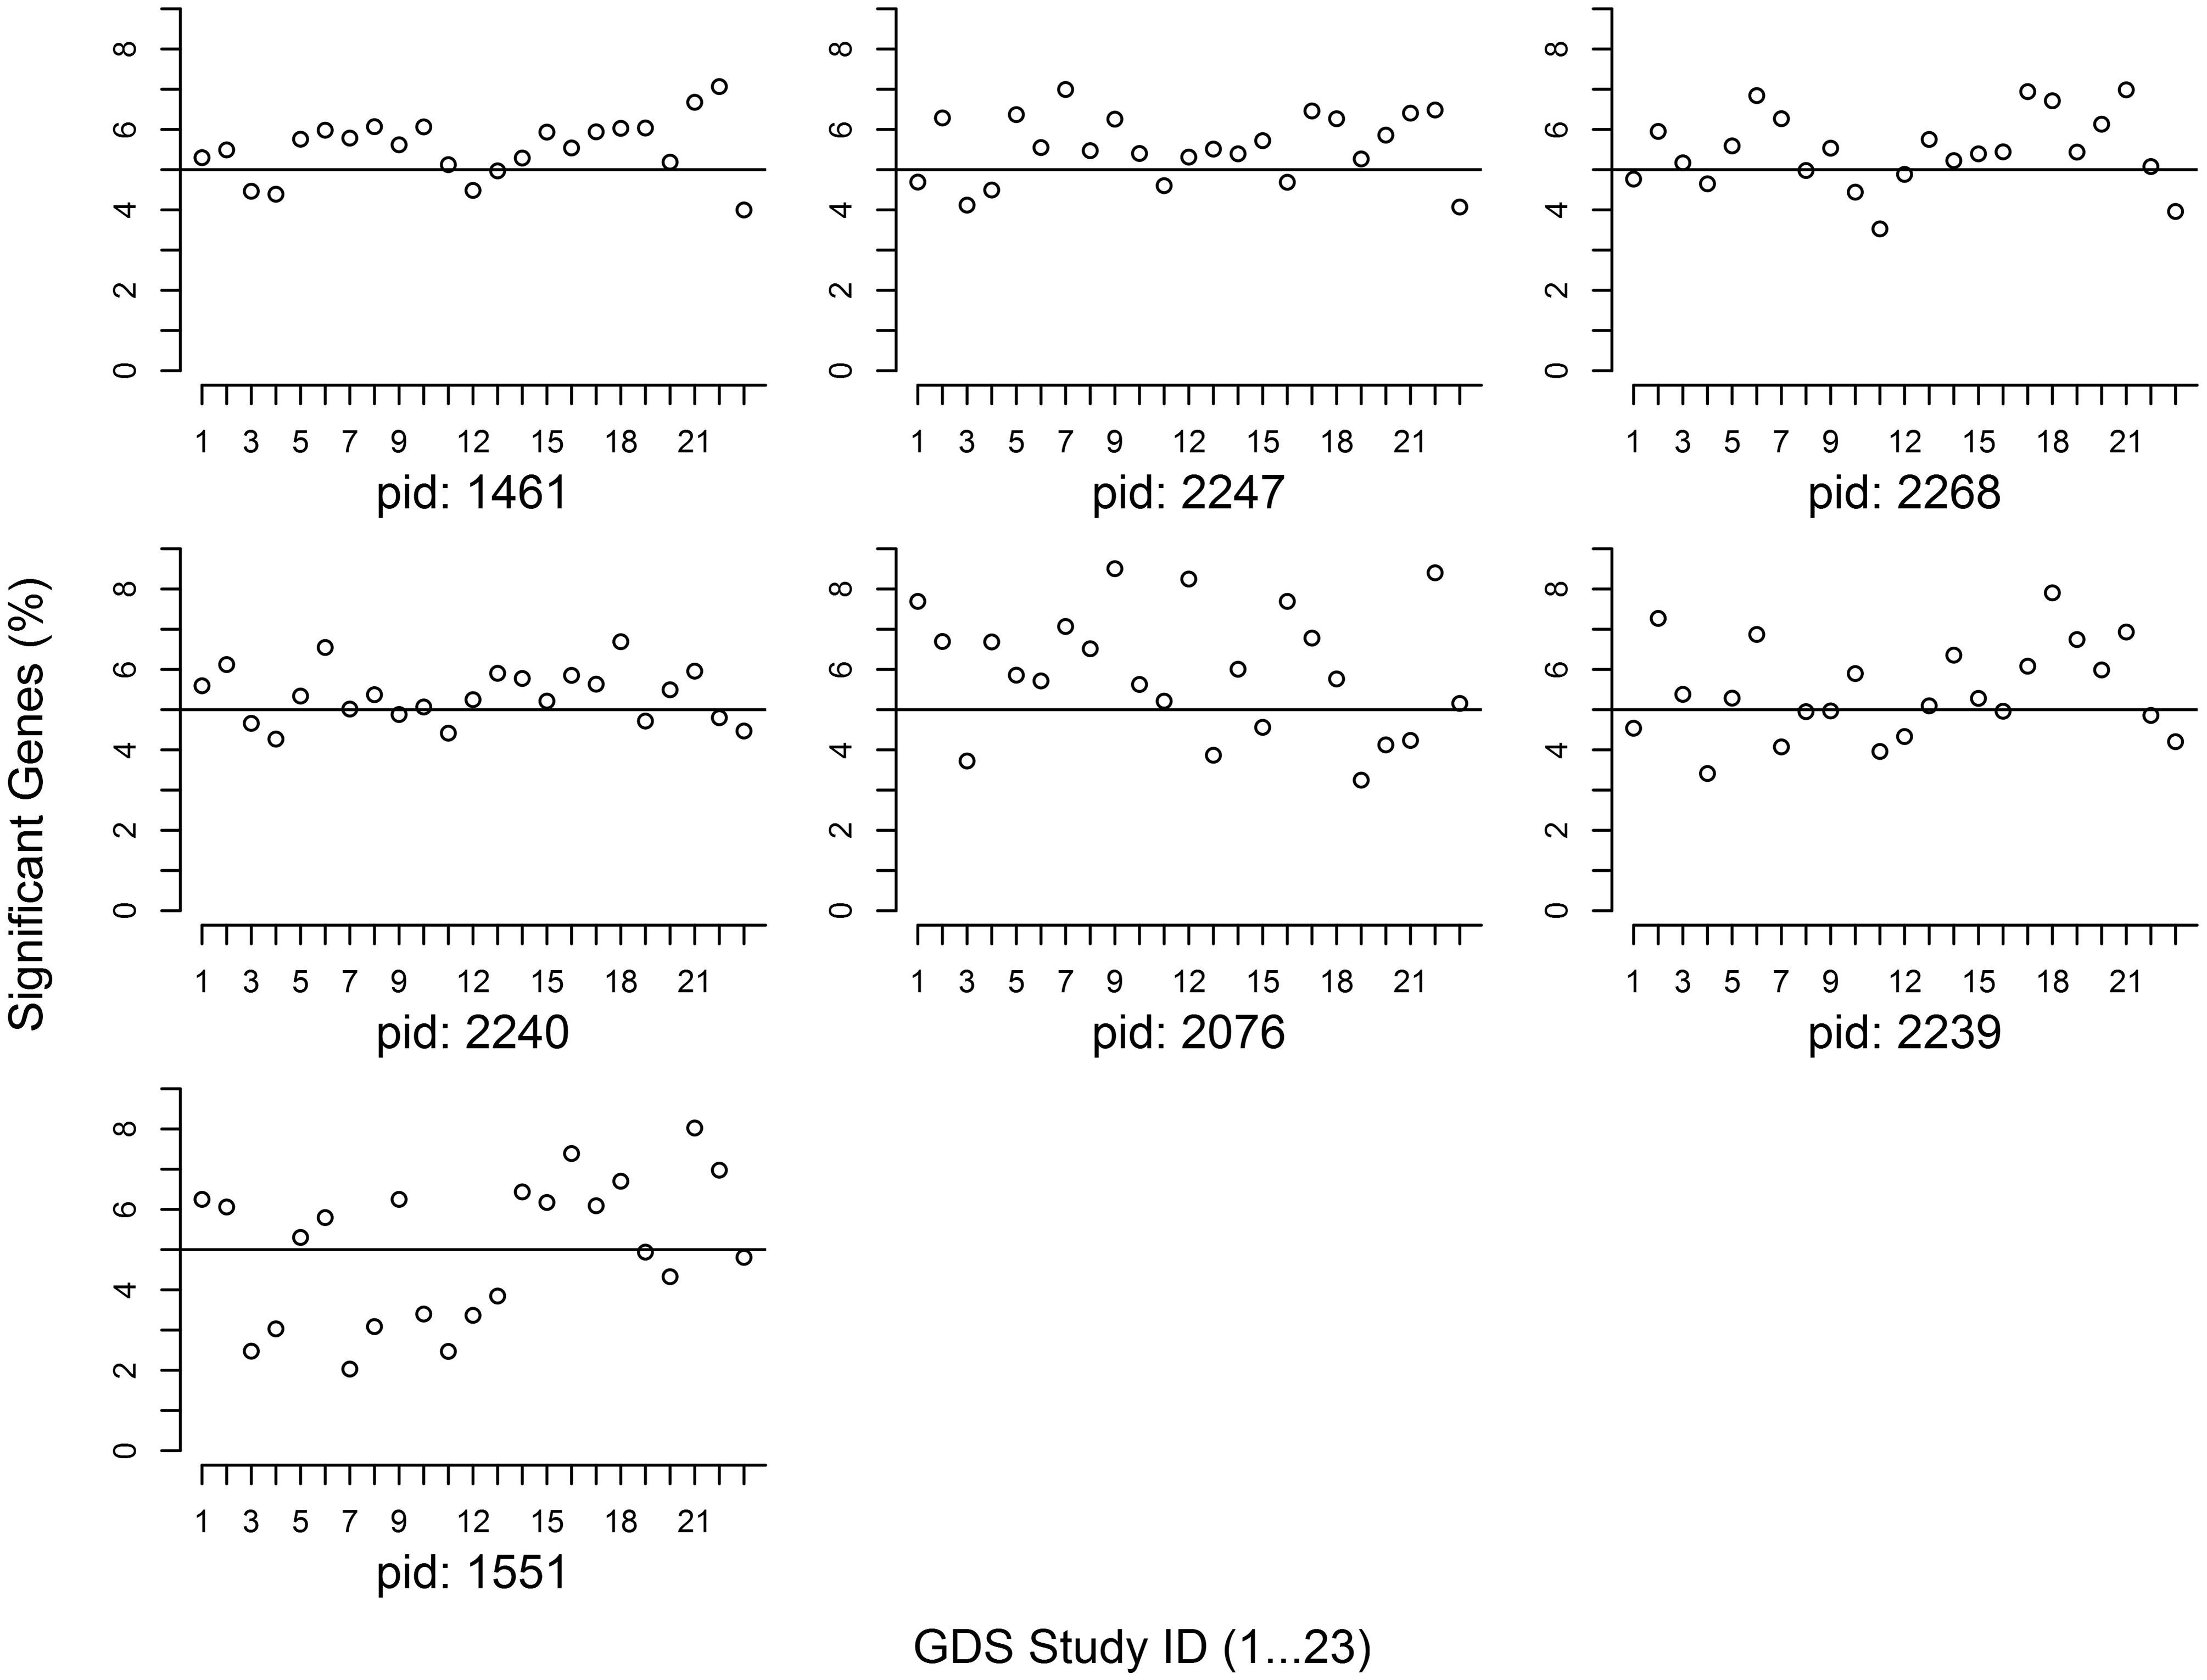
FIGURE 1. Proportion of significant genes at candidate gene sets. The study IDs in the X-axis are arrayed from 1 to 23. The Y-axis indicates the proportion of member genes with a U-score < 0.05. Pathway ID (PID): 1461 (AACTTT-motif), 2247 (FOXO4), 2268 (NFAT), 2240 (TCF3), 2076 (MIR-218), 2239 (VSX1), and 1551 (POU2F1).
Gene expression associations across studies were examined by meta-analysis using Fisher and binomial tests, and the p-values were calculated as gene_fishp and gene_binp, respectively. Three genes were found to be significant: (1) ACADSB (GID:36) belongs to the gene sets of VSX1 (PID:2239) and TCF3 (PID:2240) with gene_fishp = 9.27∗10-5 and gene_binp = 9.71∗10-6; (2) RASSF2 (GID:9770) belongs to the gene sets TCF3 (PID:2240), AACTTT–motif (PID:1461), FOXO4 (PID:2247) and NFAT (PID:2268) with gene_fishp = 1.32∗10-4 and gene_binp = 9.71∗10-6; and 3) KLF12 (GID: 11278) belongs to the gene set of MIR-218 (PID:2076) with gene_fishp = 5.65∗10-4 and gene_binp = 9.4∗10-6 (see Table 3). The negative log 10 of each U-score and the corresponding Bayes p-value are shown in Supplementary Figure 2.
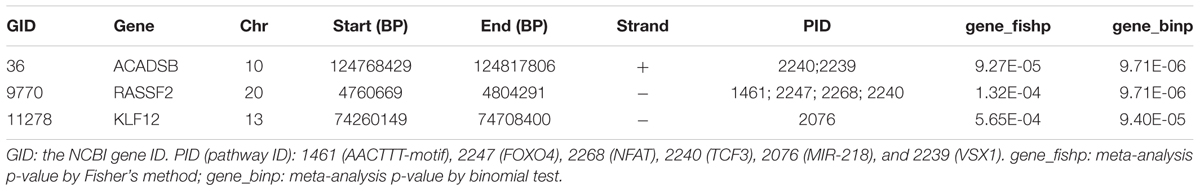
TABLE 3. Meta-analysis of gene expression associations with diabetes traits.
Analysis of Pathway Expression Association
Study-specific pathway p-values with different methods are shown in Supplementary Figures 3a–g. The hypergeometric exact test of snpGeneSets (Exact), Wilcoxon, Fisher and GSEA methods, respectively, had 28.0, 37.9, 37.9, and 28.6% of tests with p-value≤0.05. The results suggest that different methods have consistent pathway association pattern, and the Exact had over 75% of concordant tests with the other three methods. Study-specific pathway p-values of hypergeometric exact test by snpGeneSets for each gene set is shown in Figure 2. The significance level, based on Bonferroni adjustment, was p = 0.007. The gene sets of FOXO4 (PID: 2247), NFAT (PID: 2268) and VSX1 (PID: 2239) were found to have significant expression associations in 6, 4, and 1 studies, respectively, and the gene sets of AACTTT-motif (PID: 1461), TCF3 (PID: 2240) and MIR-218 (PID: 2076) each were found to have significant expression associations in two studies. There was no significant expression association for POU2F1 (PID: 1551). The FOXO4 and TCF3 gene sets both had the minimum p-values of 4.5∗10-5 and 5.3∗10-5 in Study 7, which measured gene expressions in blood samples from healthy, T1D and T2D individuals, and in Study 18, which measured expressions in pancreatic tissue samples from T2D and non-diabetic individuals, respectively.
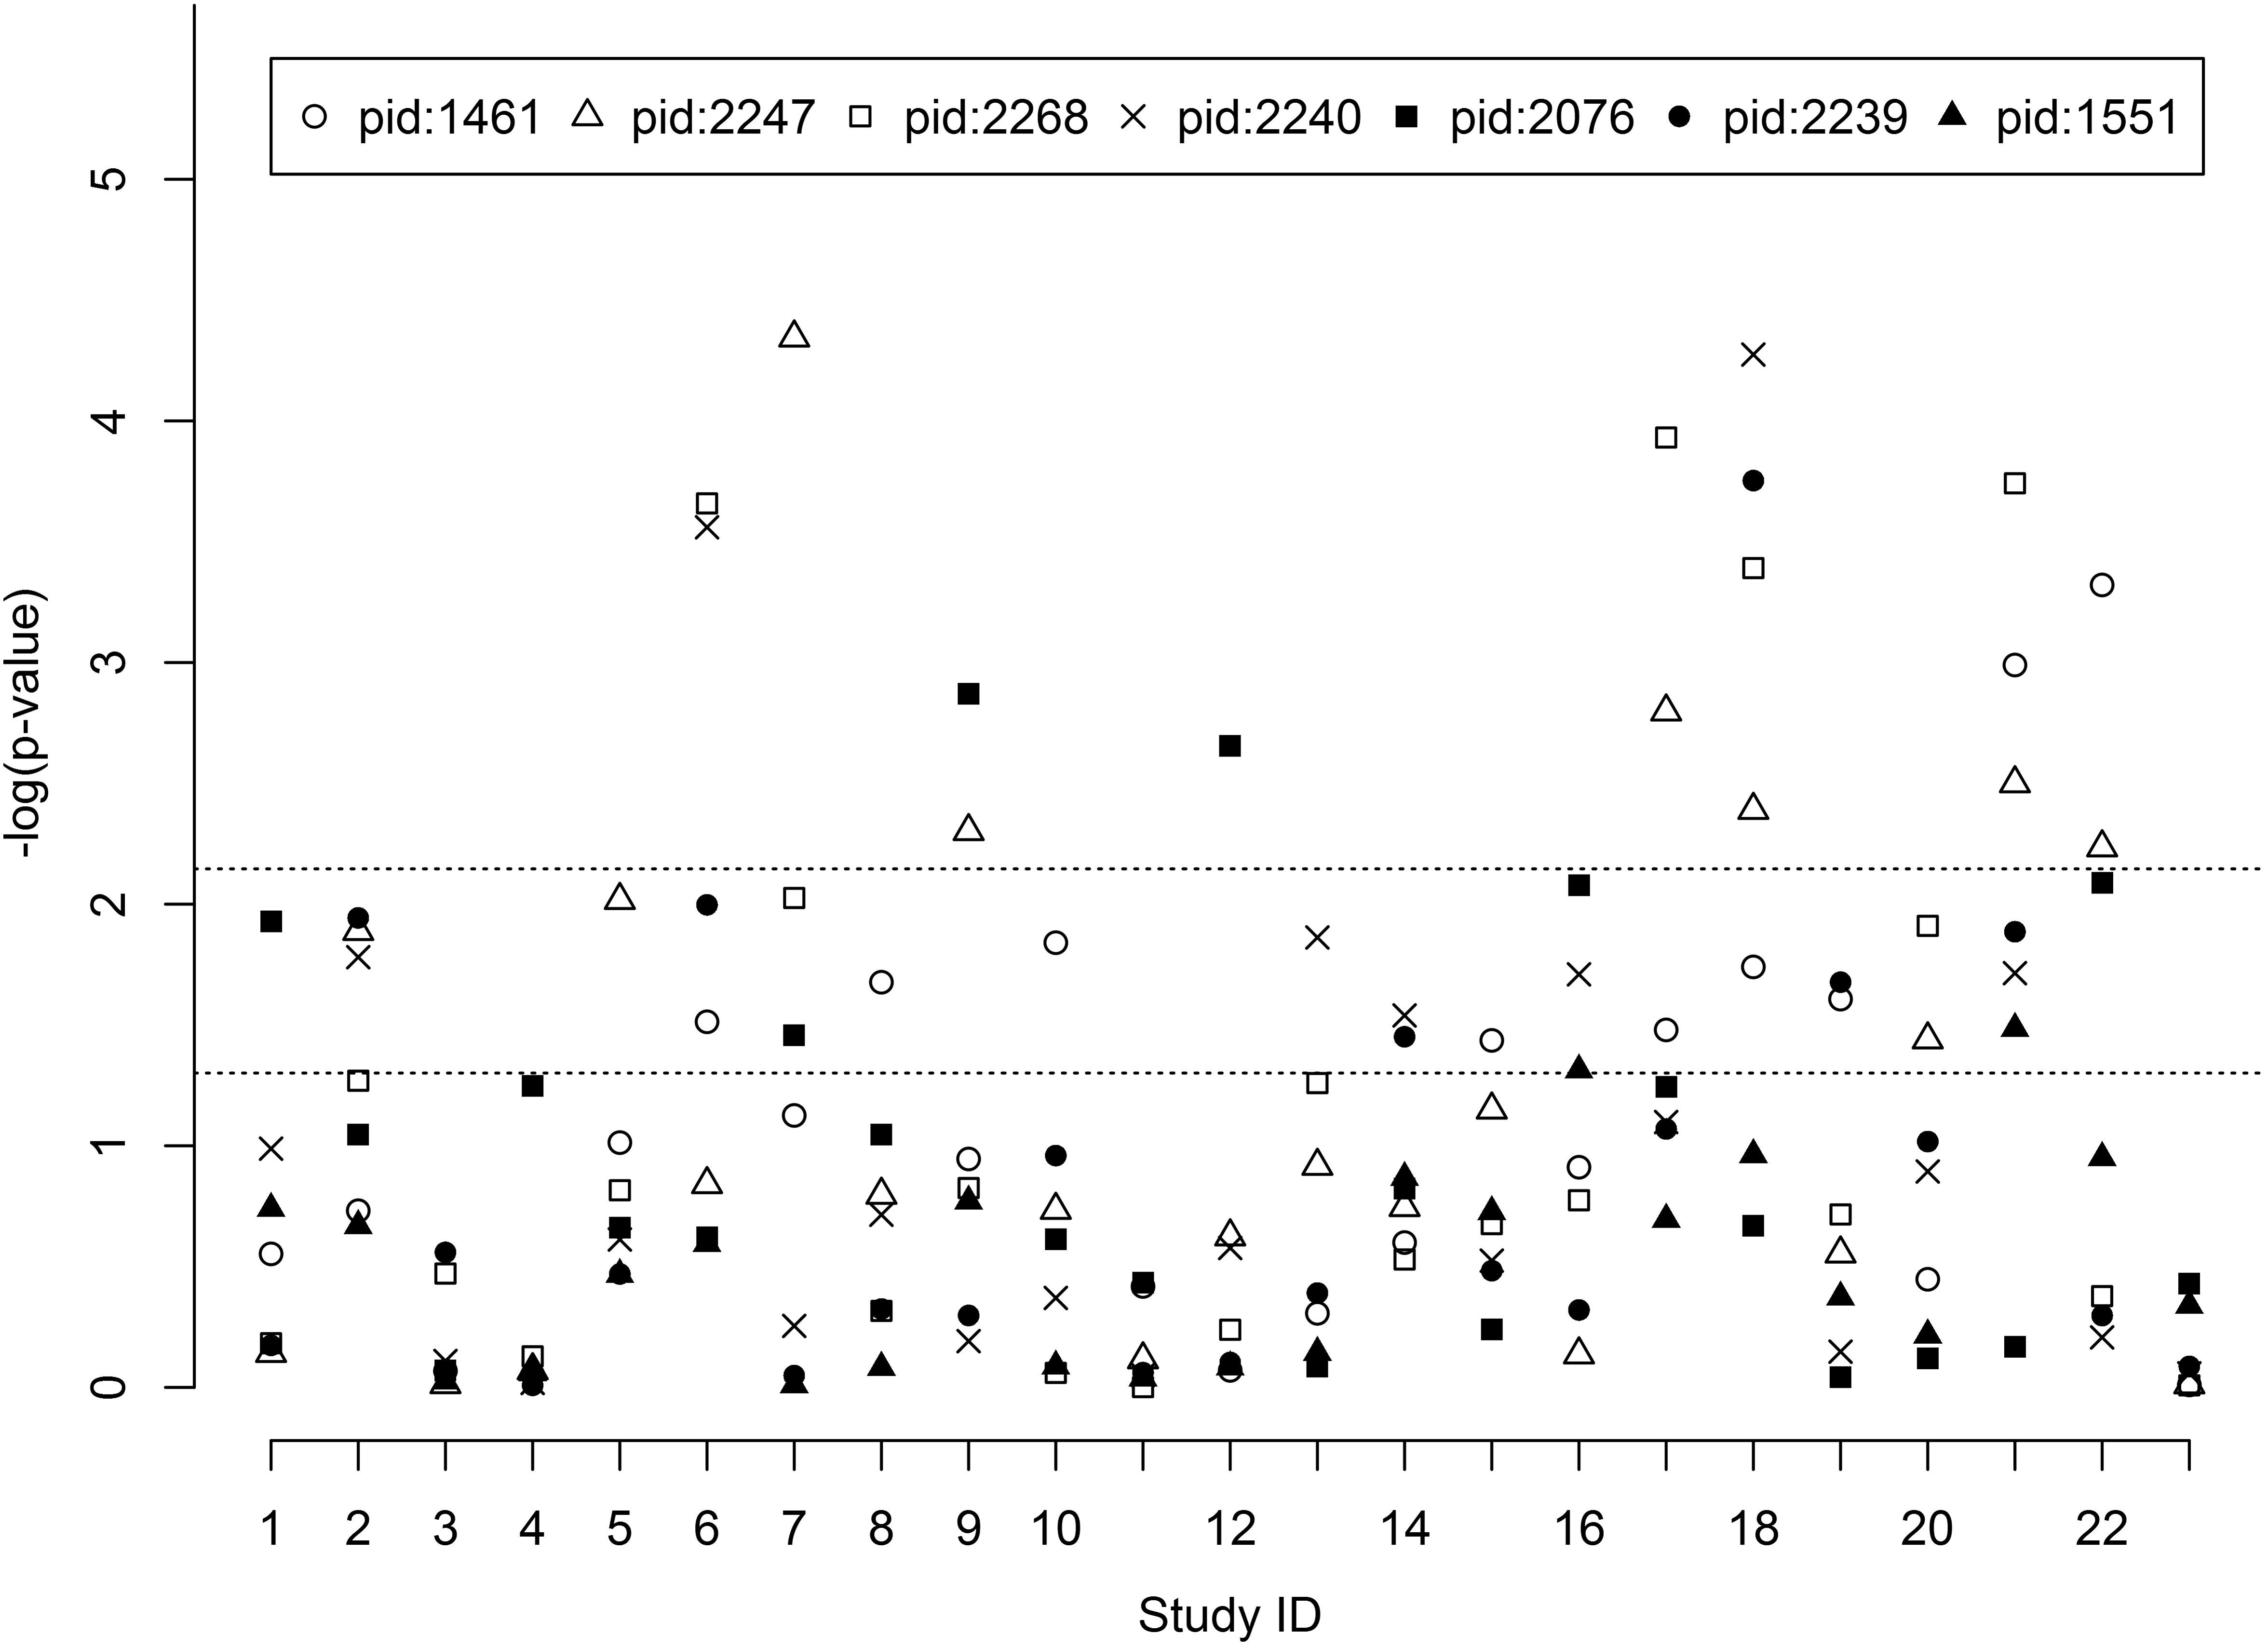
FIGURE 2. Pathway expression association of candidate gene sets. The study IDs in the X-axis are arrayed from 1 to 23. The Y-axis indicates the -log10 (p-value) of every candidate gene set. Pathway ID (PID): 1461 (AACTTT-motif), 2247 (FOXO4), 2268 (NFAT), 2240 (TCF3), 2076 (MIR-218), 2239 (VSX1) and 1551 (POU2F1).
Meta-analysis p-values of seven candidate gene sets were calculated by binomial test to measure their associations with diabetes traits across studies for all four methods (Supplementary Table 1). The meta-analysis suggested that these methods had consistent test results: all gene sets, except the POU2F1 (PID: 1551), presented significant meta-analysis p-values of pathway expression associations. The results also showed that the exact test of snpGenesets had conservative meta-analysis p-value compared to the other three methods.
The exact test of snpGeneSets provides estimate of pathway enrichment effect and calculation of association p-value. Meta-analysis of pathway expression associations with diabetes traits was conducted using binomial and fixed-effect tests to measure effects over studies, which yielded p-values of path_binp and path_fixp, respectively. Results are summarized in Table 4 and plotted in Supplementary Figures 4a–g. Except for POU2F1 (PID:1551), all other six gene sets had strong significant associations with diabetes traits after Bonferroni correction (p-value < 0.007). MIR-218 (PID:2076) had the largest effect of πd = 0.94% with a 95% confidence interval of [0.46, 1.42], and p-values of path_fixp = 1.22∗10-4 and path_binp = 9.4∗10-5. FOXO4 (PID:2247) had the smallest p-values of path_fixp = 4.94∗10-6 and path_binp = 6.11∗10-8. AACTTT-motif (PID:1461), NFAT (PID:2268), TCF3 (PID:2240) and VSX1 (PID:2239) had path_fixp (path_binp) of 4.08∗10-5 (6.11∗10-8), 6.79∗10-5 (9.40∗10-5), 7.14∗10-4 (9.71∗10-6), and 0.02 (9.40∗10-5), respectively.
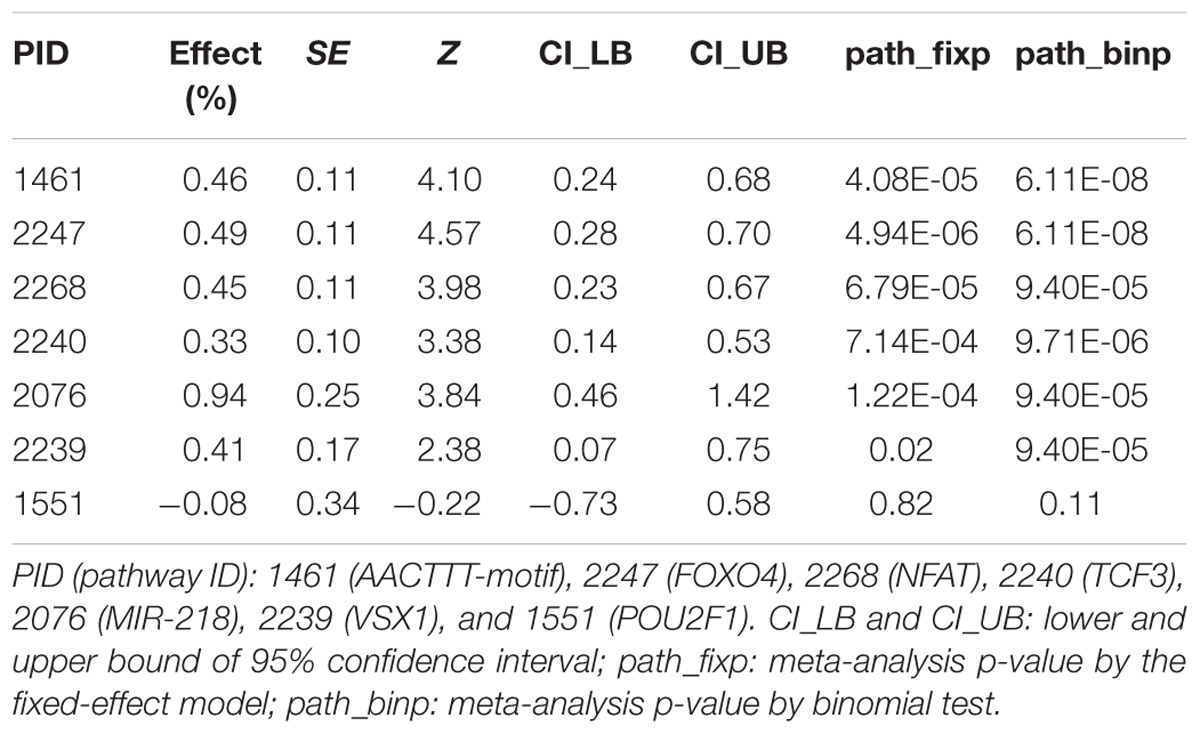
TABLE 4. Meta-analysis of pathway expression associations with diabetes traits.
Stratified meta-analysis of pathway expression association with T2D based on exact test of snpGeneSets was performed over 11 studies and 7 tissues with results summarized in the Supplementary Table 2. Consistent with diabetes traits, the POU2F1 gene set (PID:1551) is insignificant (p-value > 0.05), while all other six gene sets have p-value < 0.05 in meta-analysis of binomial test. Besides, gene sets of FOXO4 (PID:2247) and TCF3 (PID:2240) have p-values < 0.007 in both binomial and fixed-effect tests; AACTTT-motif (PID:1461) and VSX1 (PID:2239) gene sets have p-values of path_binp = 1.12∗10-4 and 0.002, respectively; and the MIR-218 gene set has p-value of path_fixp = 0.002. Pathway analysis of expression association with T1D in the EPCs (Study 3) did not find any significant candidate gene set (p-value > 0.05). Pathway analysis of T1D association in the blood mononuclear cells (Study 7) showed that gene sets of AACTTT-motif (PID:1461), FOXO4 (PID:2247), NFAT (PID:2268), MIR-218 (PID:2076) and VSX1 (PID:2239) have p-values of 3.95∗10-4, 7.05∗10-6, 0.04, 0.04, and 0.06, respectively (Supplementary Table 3).
Analysis of Expression Heterogeneity and Pathway Mapping
We performed 253 pairwise heterogeneity tests of pathway expression patterns for 23 expression studies, and the significant p-value based on Bonferroni adjustment was ≤2E-4. The negative log 10 of each p-value for the heterogeneity tests is plotted in Supplementary Figure 5. Ten significant tests were identified, accounting for 0.6% of all comparisons. The FOXO4 gene set (PID:2247) showed significantly different expression patterns for Study 7 (blood) vs. Study 3 (endothelial progenitor cells) and Study 23 (adipocytes). NFAT (PID:2268) had eight significant heterogeneity tests—for Study 23 (adipocytes) vs. Study 6 (pancreas), Study 17 (heart) and Study 21 (skeletal muscle); and for Study 11 (pancreas) vs. Study 6 (pancreas), Study 7 (blood), Study 17 (heart), Study 18 (pancreas), and Study 21 (skeletal muscle). These results suggest that the candidate gene sets have tissue-specific expression associations with diabetes traits. However, significant heterogeneity of pathway expressions was not found in the majority of studies and tissues (>99%), which indicates that the candidate gene sets tend to have consistent expression patterns for different diabetes traits and tissues.
KEGG pathway mapping of the candidate gene sets found effects and p-values ranging from 5.5% ∼ 23.4% and 5.7E-04 ∼ 3.63E-11, respectively (see Table 5). The AACTTT-motif gene set (PID: 1461) was mapped to four signaling pathways of Wnt, MAPK, Insulin and TGF-beta with an adjusted p-value (adj_p) ≤ 3E-04. The FOXO4 gene set (PID: 2247) was mapped to MAPK (adj_p = 6.1E-03) and TGF-beta (adj_p < 1E-04) signaling pathways. The NFAT gene set (PID: 2268) was mapped to Wnt (adj_p = 0.01), MAPK (adj_p < 1E-04) and TGF-beta (adj_p = 5E-04) signaling pathways. The TCF3 gene set (PID: 2240) was mapped to Wnt and MAPK signaling pathways with adj_p < 1E-04. The MIR-218 gene set (PID: 2076) was mapped to the Axon guidance pathway with adj_p = 0.041. Finally, the VSX1 gene set (PID: 2239) was mapped to the tight junction pathway with adj_p = 0.016. The POU2F1 gene set (PID: 1551) was not significantly mapped to any KEGG pathways.
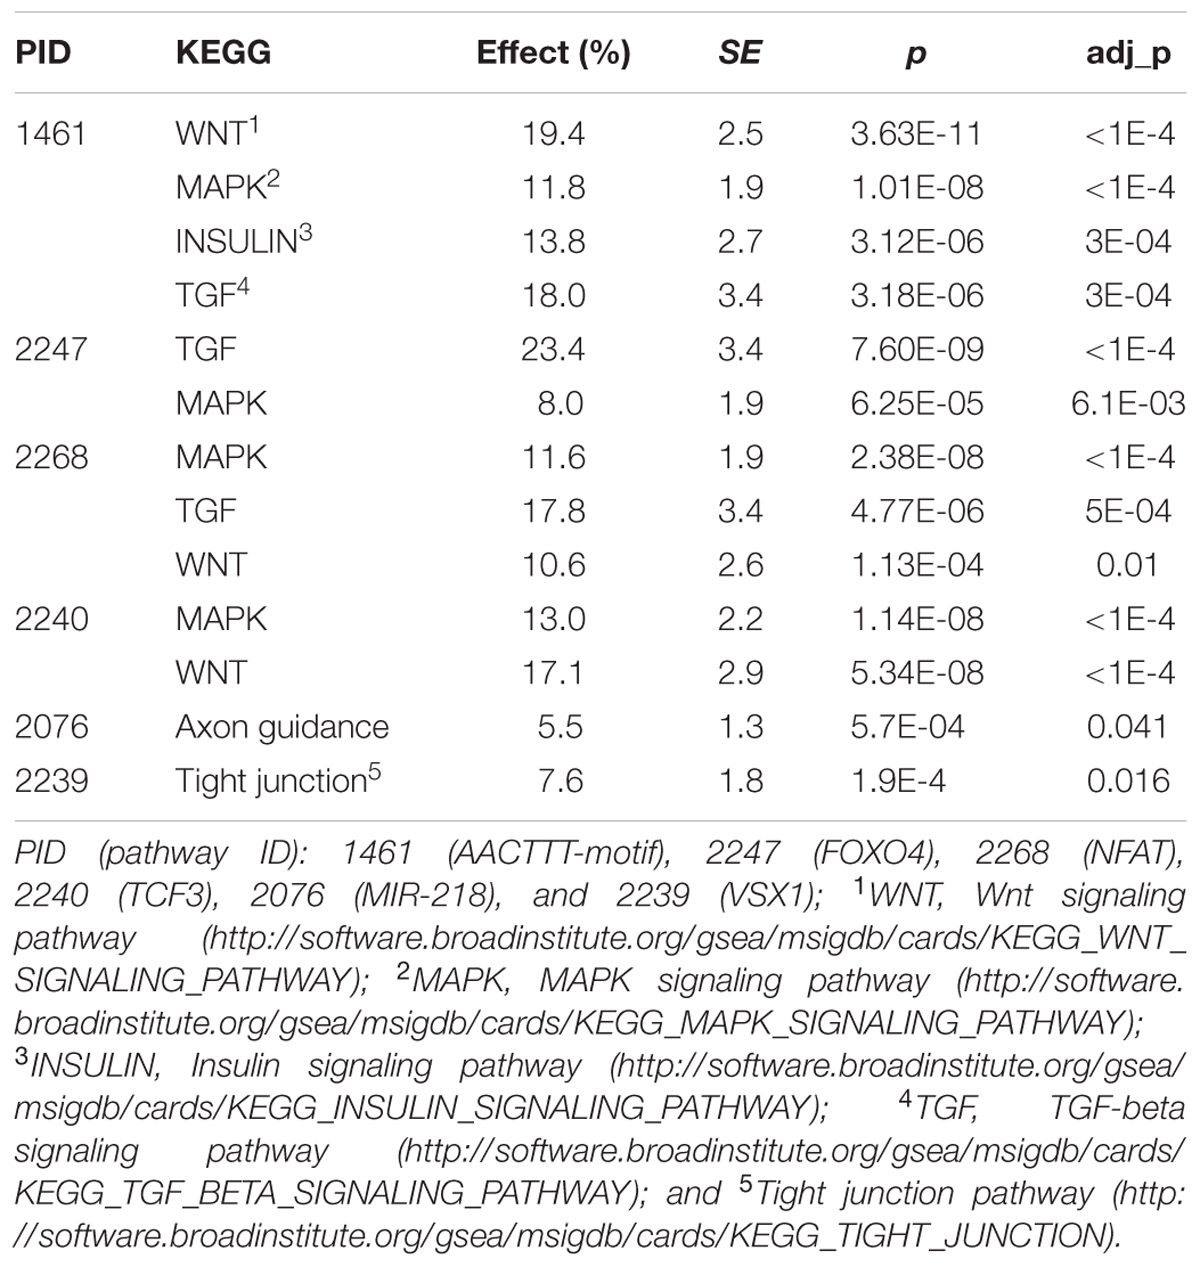
TABLE 5. KEGG pathway mapping of candidate gene sets.
Discussion
We investigated 7 GWAS-identified gene sets for their expression associations with diabetes traits in 23 independent studies. Our analysis found that 6 gene sets had a higher-than-expected proportion of significant member genes with differential expressions (Figure 1), suggesting potential correlations between gene expression regulation and diabetes risk DNA variants. In contrast to our previous hypothesis-free pathway expression study of diabetes traits (Mei et al., 2017), this meta-analysis of candidate gene sets following GWAS helps to expand our understanding of biology function of GWAS findings.
Member genes of the candidate gene sets share particular promoter motifs bound by transcription factors of FOXO4, NFAT, TCF3, VSX1, POU2F1, or microRNA of MIR-218. We applied two types of meta-analysis to test gene expression association with diabetes traits across studies (Supplementary Figure 1): the binomial method was based on the number of significant study-specific DGE tests, and the Fisher’s method was conducted using the combined p-values of individual studies. Both meta-analyses presented consistent tests of DGE and the results showed that genes of ACADSB, RASSF2, and KLF12 had significant gene expression associations with diabetes traits (Table 3). ACADSB is a member gene of the TCF3 and VSX1 gene sets, and it encodes the mitochondrial enzyme involved in metabolism of fatty acids (Rozen et al., 1994). The RASSF2 gene belongs to gene sets of AACTTT-motif, FOXO4, NFAT, and TCF3, and it encodes the proteins of the RAS family, which are important intracellular signal transducers regulating various biologic processes. KLF12 is a component gene of the MIR-218 gene set, and its protein represses expression of AP-2 alpha transcription factor (Roth et al., 2000), a developmentally regulated activator of transcription. These genes are all highly expressed in blood, and their significant expression associations in different tissues suggest that the encoded proteins may be potential biomarkers for measuring diabetes risk.
We applied four methods of pathway enrichment test to study expression association of candidate gene sets with diabetes traits. All methods showed consistent patterns of pathway association tests and the exact test of snpGeneSets presented more conservative p-values than the other three methods. In contrast to the methods of Fisher, Wilcoxon and GSEA, the hypergeometric exact test of snpGeneSets also provides estimate of pathway enrichment effect in addition to calculation of pathway association p-value. We used two types of meta-analysis to estimate pathway enrichment effect and association p-value for pathway expression association with diabetes traits over studies: the fixed-effect model test was dependent on the combined effects of all studies and the binomial method was based on the number of significant individual studies. Both types of meta-analysis showed consistent results for the seven candidate gene sets. Our analyses with different methods and meta-analyses provide a relatively comprehensive evaluation of pathway expression association with diabetes traits.
The pathophysiology of diabetes and its complications typically involve diverse tissues. A prior gene expression study has indicated that T1D and T2D share common pathways related to hyperglycemia and beta-cell dysfunctions (Kaizer et al., 2007). Our stratified meta-analysis of expression studies indicated that the pathophysiology of diabetes involves tissue non-specific pathways. For example, the FOXO4 gene set was found to be significant in blood, skeletal muscle, heart, myotube, glomeruli and pancreatic tissues (Figure 2 and Supplementary Figure 4b), and more than 99% of our heterogeneity analyses found no significant difference in expression patterns across studies and tissues (Supplementary Figure 5). We also observed that 0.6% of tests had significantly different expression patterns across tissues, e.g., expressions of the FOXO4 gene set between blood (study 7) and adipocytes (study 23), indicating that the candidate gene sets also have tissue-specific roles in diabetes pathogenesis. Compared to meta-analysis of diabetes traits over all expression studies, the stratified meta-analysis of pathway expression association with T2D among 11 studies and 7 tissues presented almost consistent results for the 7 candidate gene sets (Supplementary Table 2). For pathway analysis in the two expression studies of T1D, we did not observe any significant association in the study 3 of endothelial progenitor cells, while analysis in the study 7 of blood mononuclear cells identified two gene sets with strongly significant association (p-value < 0.001), two gene sets with p-value < 0.05 and one with p-value = 0.06 (Supplementary Table 3). The results suggest that some candidate gene sets are not associated with T1D and some have pathway expression associations at particular tissues.
We also performed a mapping analysis to infer the functions of candidate gene sets. The mapped KEGG pathways suggest that the gene sets are involved in the pathogenesis of diabetes (Table 5). The Wnt (Jin, 2008), MAPK (Zhang et al., 2011), TGF-beta (Yadav et al., 2011) and insulin signaling pathways are known to regulate insulin sensitivity, lipid metabolism, glucose and energy homeostasis; the axon guidance pathway is associated with Wnt proteins (Zou, 2004); and the tight junction pathway is related to the pathophysiology of diabetes (Harhaj and Antonetti, 2004). The results from our mapping analyses are also consistent with previous findings: miR-218 has a regulation effect by stimulating the Wnt pathway (Hassan et al., 2012); activation of the NFAT factor is calcium-dependent, and hypocalcemia is associated with impaired insulin secretion (Pittas et al., 2007); the FOXO4 factor binds to insulin-response elements, and insulin can induce phosphorylation of FOXO4 and inhibit FOXO4-dependent gene transcription (Kops et al., 1999).
In recent years, GWAS has been widely applied to identify risk variants associated with diabetes, but it remains challenging to explain how these variants affect diabetes traits. We believe that this GWAS follow-up study will help to address the challenge and may play an important role in improving our understanding of the potential biological mechanisms of DNA variants that underlie diabetes pathogenesis. Our expression meta-analysis suggests that diabetes-associated variants are related to gene and pathway expression associations, which is consistent with previous investigations of expression quantitative trait loci (eQTLs) based on GWAS risk SNPs of diabetes, shown to influence gene expressions (Kang et al., 2012). A recent study that investigated enrichment of functional elements for GWAS-identified variants across tissues, including eQTL, protein binding sites, enhancers and promoters, observed that although a few comparisons were significantly tissue-specific for these functional elements, most tests tend to be tissue non-specific (Markunas et al., 2017). The findings are consistent with our pathway heterogeneity tests across tissues, in which only 0.6% of comparisons had statistically significant tissue-specific expression patterns. In contrast to these studies focused on functional roles of individual GWAS risk variants, our study was conducted to investigate expression associations between diabetes traits and pathways enriched for GWAS-identified SNP associations. We believe that our findings can be used to guide follow-up functional studies of GWAS SNPs and genetic pathways underlying diabetes pathogenesis.
Our study is not without limitations. All expression studies in the current meta-analysis were based on the microarray platform, which includes less transcriptome detail than is provided by next-generation sequencing. In addition, our meta-analysis was performed on curated GDS of gene expressions identified from the GEO that have a few limitations: (1) most diabetes studies are for T2D, with only two for T1D; (2) all expression datasets have a relatively small sample size (≤117); and (3) many tissue types were collected in only 1–3 studies. These limitations can affect the reliability of statistical tests and reduce the study power. It will be worthwhile to conduct replication studies on more expression studies with larger sample sizes and different tissue types in a future extension of the current meta-analysis. In addition, identification of tissue-non-specific gene and pathway expression associations were based on statistical tests which do not provide direct evidence for the roles of genes and pathways in diabetes pathogenesis. Therefore, future in vivo biological studies of these genes and pathways will be essential in improving our understanding of the genetic regulation mechanisms of diabetes.
In summary, we investigated expression associations of 7 candidate gene sets and their member genes with diabetes traits in 23 expression studies. Our analysis showed that these gene sets, enriched for SNP associations with diabetes traits, were also enriched for differential gene expressions, and the pathway expression pattern tended to be tissue-non-specific. The mapping analysis of KEGG pathways identified potential regulation mechanisms of these gene sets underlying the pathogenesis and development of diabetes. We believe that our findings will facilitate the discovery of novel regulation pathways for understanding diabetes genetics, and will advance the study of clinical biomarkers for early prevention and diagnosis of diabetes.
Author Contributions
HM and LL designed the experiment, carried out the analyses and prepared the manuscript. MG and TM prepared and revised the manuscript.
Funding
This study was supported in part by Grants N01-HC55021 and U01-HL096917 from the National Institutes of Health/National Heart, Lung, and Blood Institute, and a Mississippi INBRE Grant P20GM103476.
Conflict of Interest Statement
The authors declare that the research was conducted in the absence of any commercial or financial relationships that could be construed as a potential conflict of interest.
Supplementary Material
The Supplementary Material for this article can be found online at: https://www.frontiersin.org/articles/10.3389/fgene.2018.00052/full#supplementary-material
References
American Diabetes Association (2014). Diagnosis and classification of diabetes mellitus. Diabetes Care 37(Suppl. 1), S81–S90. doi: 10.2337/dc14-S081
Barrett, T., Troup, D. B., Wilhite, S. E., Ledoux, P., Evangelista, C., Kim, I. F., et al. (2011). NCBI GEO: archive for functional genomics data sets–10 years on. Nucleic Acids Res. 39, D1005–D1010. doi: 10.1093/nar/gkq1184
Bolstad, B. M., Irizarry, R. A., Astrand, M., and Speed, T. P. (2003). A comparison of normalization methods for high density oligonucleotide array data based on variance and bias. Bioinformatics 19, 185–193. doi: 10.1093/bioinformatics/19.2.185
Davis, S., and Meltzer, P. S. (2007). GEOquery: a bridge between the gene expression omnibus (GEO) and BioConductor. Bioinformatics 23, 1846–1847. doi: 10.1093/bioinformatics/btm254
Dozmorov, M. G., and Wren, J. D. (2011). High-throughput processing and normalization of one-color microarrays for transcriptional meta-analyses. BMC Bioinformatics 12(Suppl. 10):S2. doi: 10.1186/1471-2105-12-S10-S2
Harhaj, N. S., and Antonetti, D. A. (2004). Regulation of tight junctions and loss of barrier function in pathophysiology. Int. J. Biochem. Cell Biol. 36, 1206–1237. doi: 10.1016/j.biocel.2003.08.007
Hassan, M. Q., Maeda, Y., Taipaleenmaki, H., Zhang, W., Jafferji, M., Gordon, J. A., et al. (2012). miR-218 directs a Wnt signaling circuit to promote differentiation of osteoblasts and osteomimicry of metastatic cancer cells. J. Biol. Chem. 287, 42084–42092. doi: 10.1074/jbc.M112.377515
Hung, J. H., Yang, T. H., Hu, Z., Weng, Z., and DeLisi, C. (2012). Gene set enrichment analysis: performance evaluation and usage guidelines. Brief. Bioinform. 13, 281–291. doi: 10.1093/bib/bbr049
Hyttinen, V., Kaprio, J., Kinnunen, L., Koskenvuo, M., and Tuomilehto, J. (2003). Genetic liability of type 1 diabetes and the onset age among 22,650 young Finnish twin pairs: a nationwide follow-up study. Diabetes Metab. Res. Rev. 52, 1052–1055. doi: 10.2337/diabetes.52.4.1052
Jin, T. (2008). The WNT signalling pathway and diabetes mellitus. Diabetologia 51, 1771–1780. doi: 10.1007/s00125-008-1084-y
Kaizer, E. C., Glaser, C. L., Chaussabel, D., Banchereau, J., Pascual, V., and White, P. C. (2007). Gene expression in peripheral blood mononuclear cells from children with diabetes. J. Clin. Endocrinol. Metab. 92, 3705–3711. doi: 10.1210/jc.2007-0979
Kanehisa, M., Goto, S., Furumichi, M., Tanabe, M., and Hirakawa, M. (2010). KEGG for representation and analysis of molecular networks involving diseases and drugs. Nucleic Acids Res. 38, D355–D360. doi: 10.1093/nar/gkp896
Kang, H. P., Yang, X., Chen, R., Zhang, B., Corona, E., Schadt, E. E., et al. (2012). Integration of disease-specific single nucleotide polymorphisms, expression quantitative trait loci and coexpression networks reveal novel candidate genes for type 2 diabetes. Diabetologia 55, 2205–2213. doi: 10.1007/s00125-012-2568-3
Kops, G. J., de Ruiter, N. D., De Vries-Smits, A. M., Powell, D. R., Bos, J. L., and Burgering, B. M. (1999). Direct control of the Forkhead transcription factor AFX by protein kinase B. Nature 398, 630–634. doi: 10.1038/19328
Liberzon, A. (2014). A description of the molecular signatures database (MSigDB) web site. Methods Mol. Biol. 1150, 153–160. doi: 10.1007/978-1-4939-0512-6_9
Markunas, C. A., Johnson, E. O., and Hancock, D. B. (2017). Comprehensive evaluation of disease- and trait-specific enrichment for eight functional elements among GWAS-identified variants. Hum. Genet. 136, 911–919. doi: 10.1007/s00439-017-1815-6
Mei, H., Li, L., Jiang, F., Simino, J., Griswold, M., Mosley, T., et al. (2016). snpGeneSets: an r package for genome-wide study annotation. G3 6, 4087–4095. doi: 10.1534/g3.116.034694
Mei, H., Li, L., Liu, S., Jiang, F., Griswold, M., and Mosley, T. (2015). The uniform-score gene set analysis for identifying common pathways associated with different diabetes traits. BMC Genomics 16:336. doi: 10.1186/s12864-015-1515-3
Mei, H., Li, L., Liu, S., Jiang, F., Griswold, M., and Mosley, T. (2017). Tissue non-specific genes and pathways associated with diabetes: an expression meta-analysis. Genes 8:44. doi: 10.3390/genes8010044
Permutt, M. A., Wasson, J., and Cox, N. (2005). Genetic epidemiology of diabetes. J. Clin. Invest. 115, 1431–1439. doi: 10.1172/JCI24758
Pittas, A. G., Lau, J., Hu, F. B., and Dawson-Hughes, B. (2007). The role of vitamin D and calcium in type 2 diabetes. A systematic review and meta-analysis. J. Clin. Endocrinol. Metab. 92, 2017–2029. doi: 10.1210/jc.2007-0298
Roth, C., Schuierer, M., Gunther, K., and Buettner, R. (2000). Genomic structure and DNA binding properties of the human zinc finger transcriptional repressor AP-2rep (KLF12). Genomics 63, 384–390. doi: 10.1006/geno.1999.6084
Rozen, R., Vockley, J., Zhou, L., Milos, R., Willard, J., Fu, K., et al. (1994). Isolation and expression of a cDNA encoding the precursor for a novel member (ACADSB) of the acyl-CoA dehydrogenase gene family. Genomics 24, 280–287. doi: 10.1006/geno.1994.1617
Seaquist, E. R., Goetz, F. C., Rich, S., and Barbosa, J. (1989). Familial clustering of diabetic kidney disease. Evidence for genetic susceptibility to diabetic nephropathy. N. Engl. J. Med. 320, 1161–1165. doi: 10.1056/NEJM198905043201801
Smyth, G. K. (2004). Linear models and empirical Bayes methods for assessing differential expression in microarray experiments. Stat. Appl. Genet. Mol. Biol. 3, 1–25. doi: 10.2202/1544-6115.1027
Subramanian, A., Tamayo, P., Mootha, V. K., Mukherjee, S., Ebert, B. L., Gillette, M. A., et al. (2005). Gene set enrichment analysis: a knowledge-based approach for interpreting genome-wide expression profiles. Proc. Natl. Acad. Sci. U.S.A. 102, 15545–15550. doi: 10.1073/pnas.0506580102
van de Bunt, M., Manning Fox, J. E., Dai, X., Barrett, A., Grey, C., Li, L., et al. (2015). Transcript expression data from human islets links regulatory signals from genome-wide association studies for type 2 diabetes and glycemic traits to their downstream effectors. PLOS Genet. 11:e1005694. doi: 10.1371/journal.pgen.1005694
Varemo, L., Nielsen, J., and Nookaew, I. (2013). Enriching the gene set analysis of genome-wide data by incorporating directionality of gene expression and combining statistical hypotheses and methods. Nucleic Acids Res. 41, 4378–4391. doi: 10.1093/nar/gkt111
Vattikuti, S., Guo, J., and Chow, C. C. (2012). Heritability and genetic correlations explained by common SNPs for metabolic syndrome traits. PLOS Genet. 8:e1002637. doi: 10.1371/journal.pgen.1002637
Viechtbauer, W. (2010). Conducting meta-analyses in R with the metafor package. J. Stat. Softw. 36, 1–48. doi: 10.18637/jss.v036.i03
Welter, D., Macarthur, J., Morales, J., Burdett, T., Hall, P., Junkins, H., et al. (2014). The NHGRI GWAS Catalog, a curated resource of SNP-trait associations. Nucleic Acids Res. 42, D1001–D1006. doi: 10.1093/nar/gkt1229
Yadav, H., Quijano, C., Kamaraju, A. K., Gavrilova, O., Malek, R., Chen, W., et al. (2011). Protection from obesity and diabetes by blockade of TGF-beta/Smad3 signaling. Cell Metab. 14, 67–79. doi: 10.1016/j.cmet.2011.04.013
Zhang, W., Thompson, B. J., Hietakangas, V., and Cohen, S. M. (2011). MAPK/ERK signaling regulates insulin sensitivity to control glucose metabolism in Drosophila. PLOS Genet. 7:e1002429. doi: 10.1371/journal.pgen.1002429
Keywords: pathway, gene expression, diabetes, meta-analysis, GWAS, enrichment analysis, association study
Citation: Mei H, Li L, Griswold M and Mosley T (2018) Gene Expression Meta-Analysis of Seven Candidate Gene Sets for Diabetes Traits Following a GWAS Pathway Study. Front. Genet. 9:52. doi: 10.3389/fgene.2018.00052
Received: 14 July 2017; Accepted: 02 February 2018;
Published: 16 February 2018.
Edited by:
Robert Klein, Icahn School of Medicine at Mount Sinai, United StatesReviewed by:
Cristin Gregor Print, University of Auckland, New ZealandMadhuchhanda Bhattacharjee, University of Hyderabad, India
Copyright © 2018 Mei, Li, Griswold and Mosley. This is an open-access article distributed under the terms of the Creative Commons Attribution License (CC BY). The use, distribution or reproduction in other forums is permitted, provided the original author(s) and the copyright owner are credited and that the original publication in this journal is cited, in accordance with accepted academic practice. No use, distribution or reproduction is permitted which does not comply with these terms.
*Correspondence: Hao Mei, aG1laUB1bWMuZWR1
†These authors have contributed equally to this work.