 Polina Mamoshina1,2*
 Marina Volosnikova1
 Ivan V. Ozerov1Evgeny Putin1,3Ekaterina Skibina1Franco Cortese4
 Alex Zhavoronkov1,4,5
- 1Pharmaceutical Artificial Intelligence Department, Insilico Medicine, Inc., Baltimore, MD, United States
- 2Department of Computer Science, University of Oxford, Oxford, United Kingdom
- 3Computer Technologies Lab, Saint Petersburg State University of Information Technologies, Mechanics and Optics, Saint Petersburg, Russia
- 4Biogerontology Research Foundation, London, United Kingdom
- 5Buck Institute for Research on Aging, Novato, CA, United States
For the past several decades, research in understanding the molecular basis of human muscle aging has progressed significantly. However, the development of accessible tissue-specific biomarkers of human muscle aging that may be measured to evaluate the effectiveness of therapeutic interventions is still a major challenge. Here we present a method for tracking age-related changes of human skeletal muscle. We analyzed publicly available gene expression profiles of young and old tissue from healthy donors. Differential gene expression and pathway analysis were performed to compare signatures of young and old muscle tissue and to preprocess the resulting data for a set of machine learning algorithms. Our study confirms the established mechanisms of human skeletal muscle aging, including dysregulation of cytosolic Ca2+ homeostasis, PPAR signaling and neurotransmitter recycling along with IGFR and PI3K-Akt-mTOR signaling. Applying several supervised machine learning techniques, including neural networks, we built a panel of tissue-specific biomarkers of aging. Our predictive model achieved 0.91 Pearson correlation with respect to the actual age values of the muscle tissue samples, and a mean absolute error of 6.19 years on the test set. The performance of models was also evaluated on gene expression samples of the skeletal muscles from the Gene expression Genotype-Tissue Expression (GTEx) project. The best model achieved the accuracy of 0.80 with respect to the actual age bin prediction on the external validation set. Furthermore, we demonstrated that aging biomarkers can be used to identify new molecular targets for tissue-specific anti-aging therapies.
Introduction
As the world population is experiencing an unprecedented increase in the percentage of people over 65 years of age, the impact of age-related pathologies such as sarcopenia become greater. Sarcopenia significantly impacts quality of life and is one of the hallmarks of aging. The growing body of evidence and experimental data on life extension of model organisms suggests the feasibility of finding interventions promoting human longevity (Moskalev et al., 2015), and understanding the molecular mechanisms of sarcopenia could help in designing desirable interventions. However, the restricted experimental possibilities of studying human aging coupled with the overall low translation rate from model organisms to the human clinic in other therapeutic areas (Mak et al., 2014) complicates the search for desirable anti-aging therapies, with only a few geroprotectors (i.e., anti-aging molecules) having shown potential efficacy in humans to date (Aliper et al., 2016, 2017; Thomas and Gregg, 2017). Biomarkers of aging, or aging clocks, are promising tools empowering human aging research with the ability to track aging changes and evaluate possible rejuvenating treatments (Horvath, 2013; Peters et al., 2015; Putin et al., 2016; Mamoshina et al., 2018), without resorting to long and costly longitudinal clinical studies evaluating the effects of geroprotective interventions upon long-term incidence of age-related morbidity, or lifespan itself. As such, biomarkers of aging have the potential to substantially increase the feasibility of clinically evaluating possible geroprotective interventions.
To date, data-driven approaches have been utilized in a variety biomedical applications (Mamoshina et al., 2016), including drug discovery (Kadurin et al., 2017a,b), and biomarker development (Putin et al., 2016; Mamoshina et al., 2018), both of which provide an attractive alternative to more conventional types of data analysis as they do not require prior knowledge of biological dependencies. With this in mind, we have combined machine learning with a parametric signaling pathway analysis tool in order to identify and categorize the signaling pathway changes in aged skeletal muscles and to propose a muscle-tissue specific panel of aging biomarkers, along with a novel target identification tool for muscle anti-aging therapies.
We first applied a state of the art signaling pathway analysis algorithm, iPANDA, to compare transcriptomic signatures of “old” and “young” muscles. Then, we applied several machine learning methods widely used in bioinformatics including elastic net regression, support vector machines, random forest and neural networks to predict the age of samples based on their transcriptomic signatures. By incorporating feature importance analysis, we used trained age predictors to identify key genes associated with muscle aging. We propose elevation of cytosolic Ca2+, PPAR signaling and neurotransmitter recycling as the key signaling axes that contribute to the muscle aging process along with IGFR pathway activation accompanied by PI3K-Akt-mTOR signaling axis activation.
Materials and Methods
Data
Gene expression profiles were collected from the publicly available repositories Gene Expression Omnibus (https://www.ncbi.nlm.nih.gov/geo/) and ArrayExpress (https://www.ebi.ac.uk/arrayexpress/). In total, we analyzed 545 transcriptomic samples, labeled according to the chronological age of the tissue samples' donors, from 12 datasets GSE1428 (Giresi et al., 2005), GSE25941 (Raue et al., 2012), GSE28392 (Raue et al., 2012), GSE28422 (Raue et al., 2012), GSE38718 (Liu et al., 2013), GSE40645 (Gheorghe et al., 2014), GSE47881 (Phillips et al., 2013), GSE47969 (Sood, 2015), GSE59880 (Timmons et al., 2010; Keller et al., 2011; Sood, 2015), GSE80 (Welle et al., 2002) (Table S1).
As external validation data, we downloaded gene expression profiles of skeletal muscles from the Genotype-Tissue Expression (GTEx) project portal (www.gtexportal.org). Samples (n = 564) were mapped to the age bins and sex of donors.
Cross-Platform Normalization
We used the distran function with the number of assay clusters to use set to 6 and “kmeans” clustering algorithm from the R CONOR package (https://github.com/jcrudy/CONOR) for the cross-platform normalization of gene expression data of the GTEx data. Because most of samples belong to the 50–59 and 60–69 age bins, we performed it by age groups to avoid bias.
Supervised Machine Learning Models
Train and Test Set Design
Models were trained on expression values of 7,682 common genes (Table S2). The dataset was split into training and testing sets at an 80/20 ratio, and were normalized with “normalize.quantiles” from the “preprocessCore” package (Bolstad et al., 2003).
Regression Model Implementation
We adapted five machine learning methods for the age prediction task: ElasticNet, Support Vector Machines, k-Nearest Neighbors, Random Forests and feed-forward neural networks (Deep Feature Selection model, Li et al., 2016). For all shallow models we used their implementation in scikit-learn. To build and train deep models (i.e., networks with more than 3 layers) we used the Keras python library with tensorflow backend. All age predicting models were optimized using a grid search of the hyperparameter space. We trained the models with five-fold cross validation to compensate for overfitting and to receive more robust performance metrics. All optimized model parameters are supplied in Table 1.
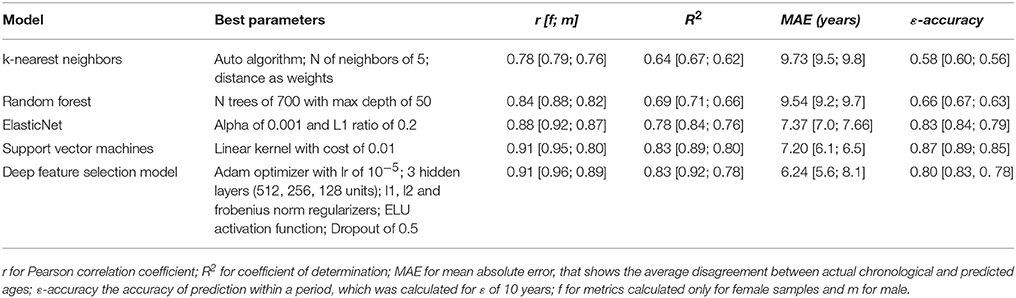
Table 1. The performance of age predicting models trained on expression profiles on the test set.
Model Evaluation
The following metrics were used to evaluate the accuracy of age prediction models:
1) Pearson correlation coefficient:
where xi is chronological age value x and is the mean of x, yi is predicted age value and y is the mean of y, N is number of samples. r shows the strength of a linear association between predicted and actual age.
2) Coefficient of determination: where yi is the real value, ŷi is the predicted value, and is the mean of y. R2 shows the percentage of variance explained by the regression between predicted and actual age.
3) Mean absolute error: where ŷi is a predicted age, yi is an age value, and N is a number of samples. MAE demonstrates average disagreement between the chronological age and the predicted age.
4) , where A = [yi−ε; yi+ε], ŷi is an age prediction of the model, and yi is a true age value. For instance, if epsilon (ε) is 5 and the DNN model predicts an age of 55 but the real age is 50 or 60, then according to epsilon accuracy, such a sample would be considered correctly classified.
We used multiclass.roc function from the pROC R package to calculate multiclass area under the receiver operating characteristic curve for the accuracy (mAUC) of age bin prediction.
Feature Importance Analysis
In the present study, we explore several methods to evaluate the importance of features (genes) on age prediction. We first ranked genes by absolute values of their regression coefficients for an ElasticNet model. We then applied the Random Forest feature importance algorithm to extract the Gini importance value of each gene. Next, we explored the relative importance values assigned to genes by the deep feature selection model, averaging the importance values of genes for the five-fold cross validation process.
In addition to feature importance ranking, we also explored the wrapper method, which we have successfully applied previously in the context of identifying the most important blood markers for age prediction (Putin et al., 2016; Mamoshina et al., 2018). We applied the same technique in the present study, with some modification. Here we explored random permutations of vectors of gene expression values along with increased (by log2 fold changes of 3) and decreased (log2 fold changes of −3) gene expression values.
In case of random permutations, , where x is a vector of expression of i gene.
In case of a direct increase or decrease, , where x is a vector of expression of i gene and f is a fold change of 3 and −3 respectively.
Therefore feature importance value for the gene i is calculated as , where is a vector of predicted value of age and is a vector predicted values of age after permutations, k is a number of cross-validation folds and, in this case, equals to 5.
We used Support Vector Machine algorithm as an age predicting model. Each model predicts age after a modification of gene expression values and assigns an importance coefficient to the gene based on the accuracy of age prediction. Afterwards, scores obtained on the validation sets are summed, and each gene-associated importance factor is averaged to yield a final value.
Borda count algorithm was applied to summarize all six ranks derived from age predicting models, and the rank of genes sorted by absolute log2 fold change values derived from differential expression analysis, in order to obtain the final importance rank of genes.
Signaling Pathway Analysis
Raw gene expression data were normalized with RMA method (Bolstad et al., 2003). Nine independent datasets from the NCBI GEO database, including GSE80, GSE1428, GSE28392, GSE47881, GSE47969, GSE59880, GSE28422, GSE38718, and GSE25941 were carefully selected for the analysis. For each dataset the groups corresponding to the samples from the “old” and the “young” individuals, respectively, were constructed. The samples from individuals 16–30 years old were considered “young,” while individuals over 60 years old were considered “old.” In all the following parts of the analysis the “old” group was used as a reference and the young group was compared to it. In order to obtain the list of differentially expressed genes, data were processed using the R “limma” package (Ritchie et al., 2015). Benjamini-Hochberg FDR adjustment was applied to the p-values (Benjamini and Hochberg, 1995). The pathway level analysis was performed using the iPANDA software suite (Ozerov et al., 2016). Positive and negative iPANDA scores indicated up- and down-regulation of the pathway, respectively. The pathway database used for the analysis included 1,856 annotated and manually curated signaling pathway maps from KEGG, Reactome and NCI-PID and SA Biosciences (http://saweb2.sabiosciences.com/pathwaycentral.php) collections (Kanehisa and Goto, 2000; Schaefer et al., 2009; Croft et al., 2014).
Results
In order to study the effects of aging in human skeletal muscle, we obtained 545 gene expression profiles of 19–89 age individuals from publicly-available datasets. We first split samples into “old” and “young” groups and analyzed them using differential gene expression analysis and pathway analysis (see Figure 1). We then trained a set of supervised models to predict the age of samples. Finally, we ranked genes according to their importance for age prediction using Borda count over rank values obtained by ElasticNet, Random Forest, Deep Feature Selection and wrapper algorithms.
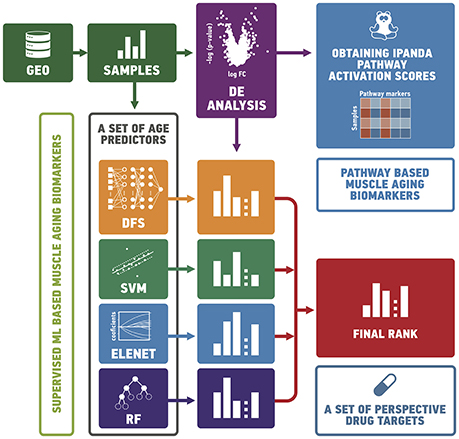
Figure 1. In order to study the effects of aging in human skeletal muscle, we collected gene expression profiles of 19–89 year old individuals from publicly-available datasets. We split samples into “old” and “young” groups and analyzed them using differential gene expression and pathway analysis. We then trained a set of supervised models to predict the age of samples. Finally, we ranked genes according to their importance for age prediction using Borda count over rank values obtained by ElasticNet, Random Forest, Deep Feature Selection and wrapper algorithms. GEO, gene expression omnibus; DE, differential expression analysis; DFS, deep feature selection model; SVM, support vector machines; ELNET, ElasticNet; RF, random forest.
Gene Expression and Signaling Pathway Analysis
To profile the signalome differences between young and old skeletal muscle, we applied the iPANDA algorithm (Ozerov et al., 2016) to normalized gene expression data. An analysis of 9 muscle datasets obtained from the publicly available NCBI GEO database has revealed various age-related effects.
It has been shown previously that muscle aging is strongly associated with compromised Ca2+ spark signaling and segregated intracellular Ca2+ release (Weisleder et al., 2006). Our data supports this observation. In particular, we observed a decreased expression of calcium ion binding protein EFEMP1 and sarcomeric protein MYOZ2 that binds to calcineurin, a phosphatase involved in calcium-dependent signal transduction, in the elderly group and corresponding activation of Elevation of cytosolic Ca2+ levels Main Pathway. Several other proteins directly or indirectly involved in sarcomere function and regulation are found in top20 perturbed gene list (Figure 2) including MYH8, EPB41L3 and SKAP2 (Pöllänen et al., 2010; Dreder et al., 2016). Interestingly, that decreased expression of tumor suppressor gene EPB41L3 that inhibits cell proliferation and promotes apoptosis was previously associated with cellular senescence in skin and lung (Yoon et al., 2004; Sembrat et al., 2016).
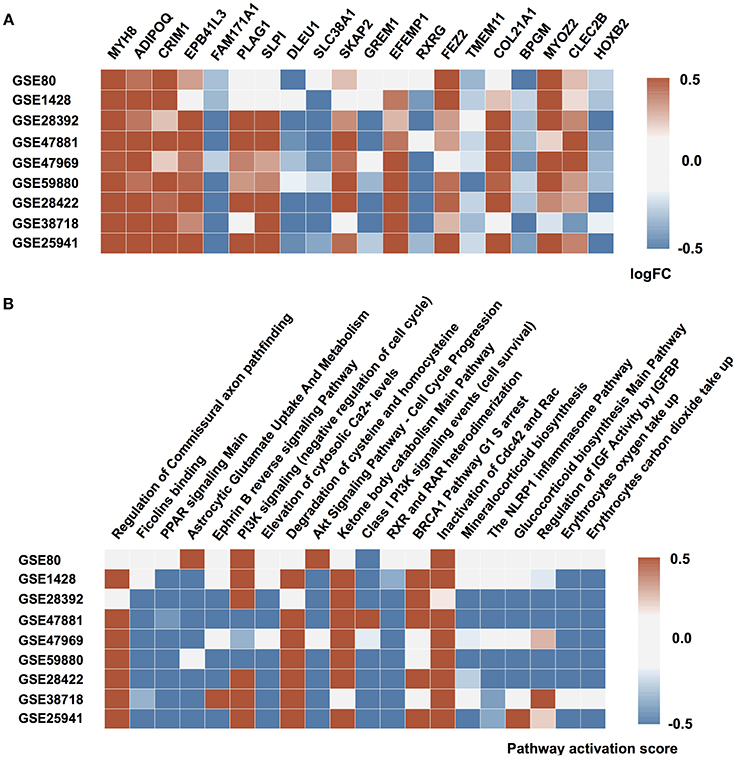
Figure 2. Molecular mechanisms of muscular aging. (A) Top 20 differentially expressed genes in “young” group against “old” group. (B) Signaling pathways perturbed in “young” group compared to “old” group. Up and down-regulated genes (pathways) are shown in red and blue respectively. The saturation of the color denotes to the perturbation amplitude.
Another notable mechanism underlying aging-associated changes in muscle function is the irreversible change in fiber innervation (Holloszy and Carlson, 1995; Luff, 1998; Edström et al., 2007). Both FEZ2 necessary for normal axonal bundling and elongation within axon bundles and glutamine transporter SLC38A1 necessary for glutamate neurotransmitter cycling are down-regulated in aged muscle along with up-regulation of Astrocytic Glutamate uptake and down-regulation of axon development on the pathway level. While the decrease in oxygen saturation and glucose uptake also a play significant role in muscle aging, elevated expression of BPGM gene may mediate this effect. Moreover, dysregulation in BPGM expression is thought to play the similar role in age-related dementia (Kaminsky et al., 2013). Besides, the reduction in oxygen uptake is closely-related to overall mitochondrial function decline and increase in expression of TMEM11 gene responsible for mitochondrial morphogenesis (Short et al., 2005). The significant perturbation of PPAR signaling in the majority of data sets is also connected to impairment in glucose uptake and lipid metabolism during aging.
Surprisingly, pro-survival branches of the metabolic master-regulator signaling networks including IGFR signaling and PI3K-Akt-mTOR axis were down-regulated in young muscle comparing to the old ones. At the same time, the pathways associated with G1/S checkpoint arrest (BRCA1 G1/S checkpoint arrest) and ensuring long-lasting G0 state of the muscle cells were elevated in the samples from young donors. Several developmental genes (CRIM1, PLAG1, GREM1, and HOXB2) are found on top of the differentially expressed gene list. This observation may point to the age-associated tissue transition, e.g., muscular fibrosis.
An important cluster of aging-associated changes in muscular tissue refers to inflammation (Zoico et al., 2013). Specifically, CLEC2B gene, member of CTL/CTLD superfamily and one of the key inflammation and immune response regulators, is significantly perturbed in the majority of the datasets along with several inflammation-related pathways. Besides, the expression of SLPI gene responsible for resistance to viral, bacterial and fungal infections is down-regulated in the muscle samples of elderly individuals. Inflammation itself is closely tied up with detrimental changes in the extracellular matrix that contribute to muscle function decline (Kragstrup et al., 2011). Specific genes involved in extracellular matrix maintenance and experiencing the highest changes in expression profile include ADIPOQ and COL21A1.
Interestingly, that several genes that were not yet extensively studied in the context of muscle aging such as retinoid receptor RXRG, non-protein coding DLEU1 and very poorly described FAM171A1 are encountered in top20. We believe that these genes and their products may potentially represent novel biomarkers or therapeutic targets for age-related conditions in muscle.
Age Prediction
To develop an age predictor of samples we first explored a set of regression models. We used linear regression as a baseline model, which was compared to other machine learning methods such as Elastic Net, Support Vector Machines, k-Nearest Neighbors, Random Forest, and Deep Feature Selection Model. All models achieved a strong correlation of predicted and chronological age; however, both Support Vector Machines with a linear kernel and Deep Feature Selection model outperformed the other methods in age prediction, achieving R2 values of 0.83 and 0.83 and MAE values of 7.20 and 6.24 years, respectively (Figure 3 and Table 1). In comparison, the ElasticNet and Random Forest models achieved R2 values of 0.78 and 0.69, and MAE values of 7.37 and 9.54 years respectively. Lastly, the K-Nearest Neighbors model demonstrated an R2 of 0.64 and MAE of 9.73 years. Interestingly, the age of female samples tends to be predicted more accurately compared to male samples by all age predicting models (Table 1).
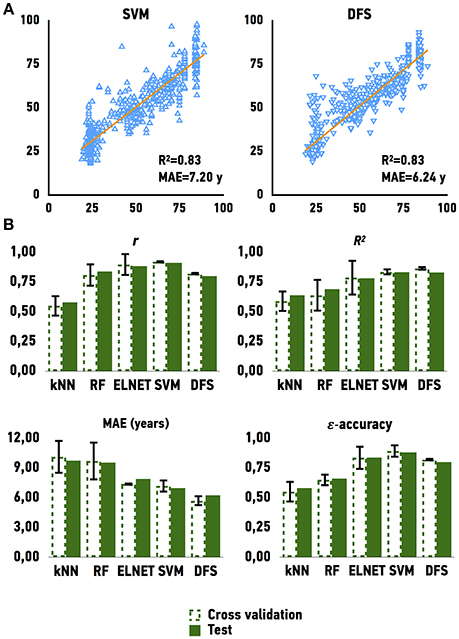
Figure 3. Performance of age predicting models (A) Actual chronological age vs. predicted age for Support Vector Machines model (SVM) and Deep Feature Selection Model (DFS) on validation and testing sets (B) Performance of models on validation and testing sets. r for Pearson correlation coefficient; R2 for coefficient of determination; MAE for mean absolute error, that shows the average disagreement between actual chronological and predicted ages; ε-accuracy the accuracy of prediction within a period, which was calculated for ε of 10 years, kNN, K Nearest Neighbors; RF, Random Forest; ELNET, ElasticNet; SVM, Support Vector Machines; DFS, Deep Feature Selection Models.
External Validation
The Genotype-Tissue Expression (GTEx) project dataset was used to validate our models. We predicted the age of skeletal muscle samples based on their gene expression profiles. Because GTEx project portal openly provide only age bin of donors, we have calculated mAUC (see Materials and Methods for details) to evaluate the accuracy of age group prediction. The previously best performing models, Support Vector Machines achieved mAUC of 0.80, compared to the mAUC of 0.90 on the original test set and Deep Feature Selection achieved mAUC of 0.80 and of respectively (Figure 4). The accuracy of age group prediction for male and female samples coincides with the performance on the test set and male samples tend to be predicted more accurately compare to female samples.
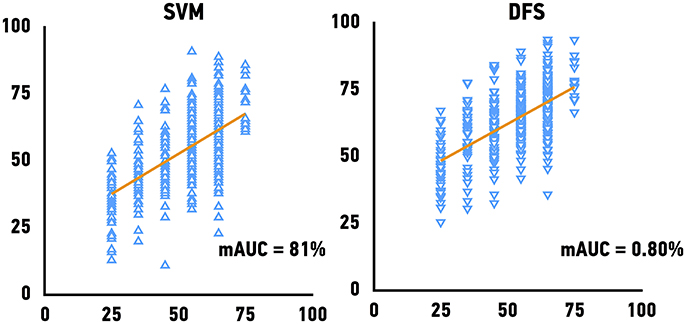
Figure 4. Performance of age predicting models on the external validation set. Mean of the actual chronological age bin vs. predicted age for Support Vector Machines models (SVM) and Deep Feature Selection Model (DFS).
Target Identification
Following results on age prediction, we applied several feature importance analysis procedures to identify the genes most important for age prediction (see Materials and Methods for details). As different ranking methods return different values of relative importance, we used Borda count algorithm to summarize ranks and obtain final importance values (Table 2, Figure 5). Despite the fact that ranks of the selected top 20 genes vary, they all belong to the top 25% ranks of all genes. Interestingly, Random Forest and Elastic Net assigned similar ranks to the same genes. The wrapper method (applied over random permutations) and the Deep Feature Selection model demonstrate the closest results to the final ranking (Figure 5). At the same time, the wrapper method used over increased and decreased values showed different importance values and rank for the same genes, suggesting that the direction of changes in expression is important in age prediction for most of the genes analyzed. However, a number of genes including Src kinase associated phosphoprotein 2 (SKAP2), Visin like 1 (VSNL1) and Growth regulation by estrogen in breast cancer 1 (GREB1) demonstrated similar ranks in the context of both up-regulation and down-regulation.
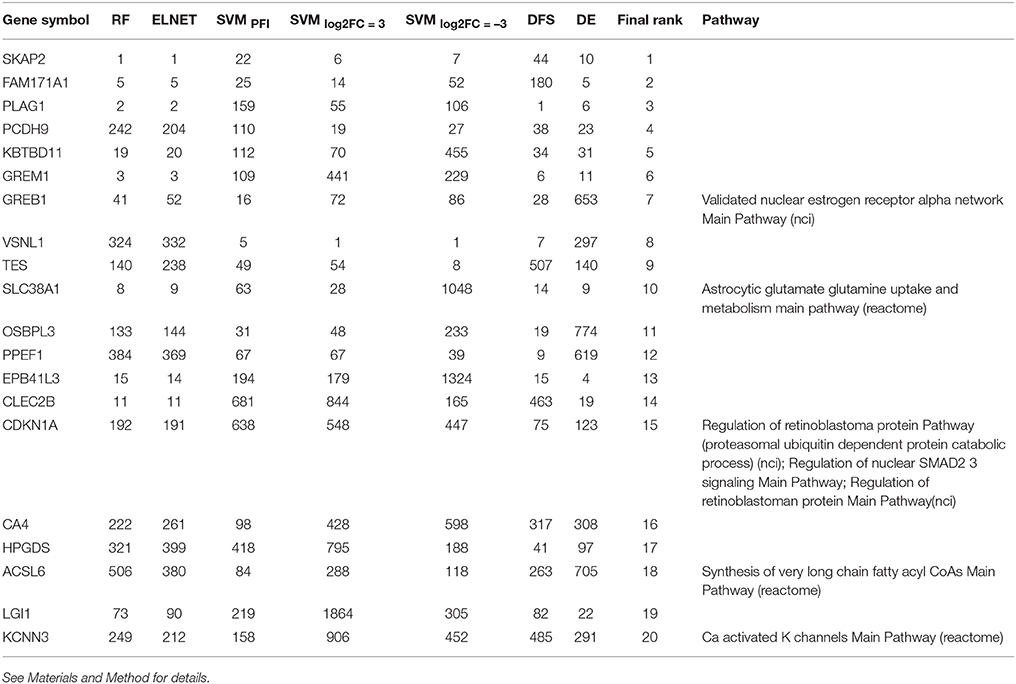
Table 2. List of the most important genes selected by the Borda count algorithm applied over ranks assigned by Random Forest, ElasticNet, wrapper method applied over randomly permuted vectors of gene expression values (SVMPFI), increased values (SVMlog2FC = 3) and decreased values (SVMlog2FC = −3), Deep Feature Selection model (DFS) and the differential gene expression analysis (DE).
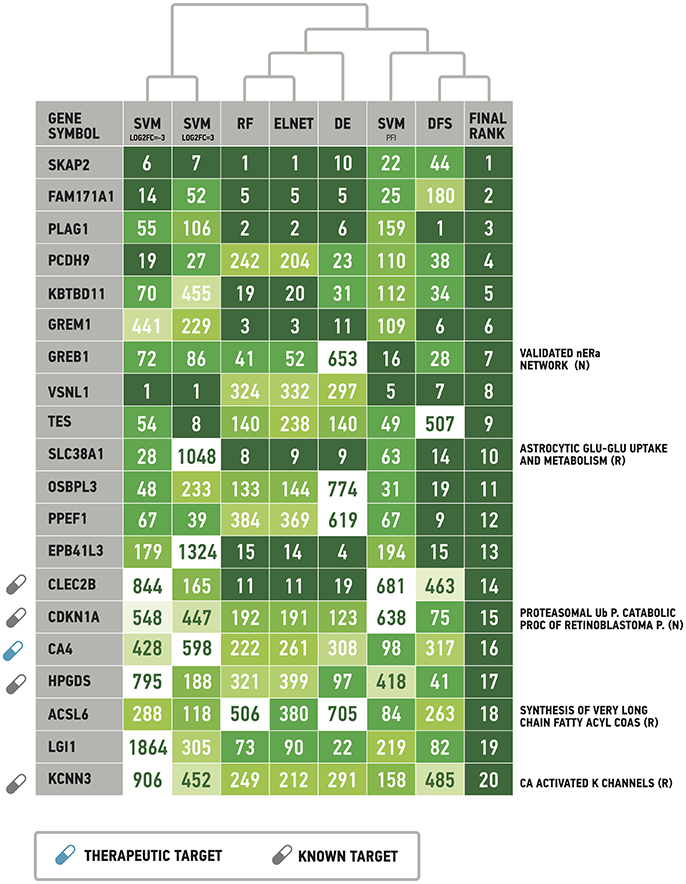
Figure 5. List of the most important genes selected by the Borda count algorithm applied over ranks assigned by Random Forest, ElasticNet, wrapper method applied over randomly permuted vectors of gene expression values (SVMPFI), increased values (SVMlog2FC = 3) and decreased values (SVMlog2FC = −3), Deep Feature Selection model (DFS) and the differential gene expression analysis (DE). See Materials and Method for details. Full signaling pathway names are supplied in the Table 2. Drug target information was obtained from DrugBank (www.drugbank.com). R, Reactome pathway database. N, NCI pathway database.
While 5 out of the top 20 genes are known drug targets, some of the selected genes are known therapeutic targets, including the Carbonic anhydrase 4 (CA4) a target of anticovosculant drug, Topiramate, and a group of diuretics such as Chlorothiazide and Methazolamide. Recently, it has been shown that inhibition of CA4 effects relaxation of skeletal muscles both in model organisms (Wetzel et al., 2002; Tricarico et al., 2004) and human cells (Eguchi et al., 2006), suggesting their importance as potential drug targets in neuromuscular diseases.
Discussion
This report described, to our knowledge, the first exhaustive signaling pathway analysis of skeletal human muscle that provides molecular insight into the differences among aged and young samples. Previously, transcriptomic analyses of muscle aging were conducted using the standard approach of gene expression analysis (Zahn et al., 2006; Sifakis et al., 2013). This study provides the first detailed pathway analysis involving the massive comparison of publicly available datasets consisting of both young and old muscle tissue. It also highlights the utility of pathway-based algorithms for dimension-reduction of high-dimensional transcriptomic data and for producing robust signatures of signaling pathway activation when comparing multiple cell states and types simultaneously.
Notably, the lists of important genes obtained using traditional differential expression analysis and machine learning methods while holding significant intersection, contain distinct genes that are both relevant for the condition under study. This emphasizes the potential benefits researchers could gain while using the proposed combined approach.
Hormonal imbalance and mitochondrial dysfunction are among the leading hallmarks of muscle aging identified by this study. On the signaling pathway level, elevation of cytosolic Ca2+, PPAR signaling and neurotransmitter recycling along with IGFR pathway activation accompanied by PI3K-Akt-mTOR signaling axis activation seen in the present analysis is believed to be key players in muscle growth, and as such dysregulation of these pathways very likely leads to a resulting decrease in muscle mass and regeneration ability (Yoon, 2017). Additionally, the impaired protein degradation demonstrated in the present analysis is also considered to be one of the key molecular mechanisms underlying sarcopenia (Lenk et al., 2010).
The best performing model used in the present analysis, a feed-forward neural network, achieved an MAE of 6.24 years, demonstrating reasonably good accuracy in terms of age prediction. Notably, female samples tend to be predicted more accurately, which is in line with our previous findings in age predction by blood biochemistry (Mamoshina et al., 2018). Indeed previous analysis highlighted sex-specificity of muscle aging transcriptional profiles (Liu et al., 2013) and at the same time model organisms and human studies also demonstrated the sex-dependent differences in aging rates (Waisman et al., 2013; Horvath et al., 2016).
Previously, Sood et al. applied supervised machine learning algorithm (K-Nearest Neighbors) in order to perform binary classification muscle gene expression profiles by “young” and “old” achieving an average AUC of 93% (70–100%) for independent muscle data (Sood, 2015). Here we present more complex approach, allowing to quantify aging changes. Our current results show that the best performing model could achieve 0.80 mAUC (for 6 age bin groups) on the massive external validation set provided by the GTEx project (n = 564).
Furthermore, our results show that age prediction models can be used as a tool for identifying perspective targets for anti-aging therapies, and can serve as a potential panel of companion biomarkers for evaluating the effect of such therapies. Using transcriptional signatures, the general approach encapsulated by the present study could be further applied to other tissues and other disease areas.
Author Contributions
AZ, IO, and PM planned the study. MV and ES conducted original data screening and preparation. IO conducted and interpreted gene and pathway analysis. PM, MV, and EP conducted and interpreted machine learning analysis. FC helped review the manuscript and references. PM, MV, IO, and AZ conducted further data evaluation and manuscript preparation.
Conflict of Interest Statement
PM, MV, IO, EP, ES, and AZ are associated with the company, Insilico Medicine, Inc., engaged in drug discovery and aging research.
The remaining author declares that the research was conducted in the absence of any commercial or financial relationships that could be construed as a potential conflict of interest.
Supplementary Material
The Supplementary Material for this article can be found online at: https://www.frontiersin.org/articles/10.3389/fgene.2018.00242/full#supplementary-material
Table S1. A list of datasets analyzed in this study.
Table S2. A list of genes analyzed in this study.
References
Aliper, A., Belikov, A. V., Garazha, A., Jellen, L., Artemov, A., Suntsova, M., et al. (2016). In search for geroprotectors: in silico screening and in vitro validation of signalome-level mimetics of young healthy state. Aging 8, 2127–2152. doi: 10.18632/aging.101047
Aliper, A., Jellen, L., Cortese, F., Artemov, A., Karpinsky-Semper, D., Moskalev, A., et al. (2017). Towards natural mimetics of metformin and rapamycin. Aging 9, 2245–2268. doi: 10.18632/aging.101319
Benjamini, Y., and Hochberg, Y. (1995). Controlling the false discovery rate: a practical and powerful approach to multiple testing. J. R. Stat. Soc. Series B Stat. Methodol. 57, 289–300.
Bolstad, B. M., Irizarry, R. A., Astrand, M., and Speed, T. P. (2003). A comparison of normalization methods for high density oligonucleotide array data based on variance and bias. Bioinformatics 19, 185–193. doi: 10.1093/bioinformatics/19.2.185
Croft, D., Mundo, A. F., Haw, R., Milacic, M., Weiser, J., Wu, G., et al. (2014). The reactome pathway knowledgebase. Nucleic Acids Res. 42, D472–D477. doi: 10.1093/nar/gkt1102
Dreder, A., Tahir, M., Seker, H., and Anwar, N. (2016). Discovering differences in gender-related skeletal muscle aging through the majority voting-based identification of differently expressed genes. Int. J. Bioinform. Biosci. 6, 1–14. doi: 10.5121/ijbb.2016.6201
Edström, E., Altun, M., Bergman, E., Johnson, H., Kullberg, S., Ramírez-León, V., et al. (2007). Factors contributing to neuromuscular impairment and sarcopenia during aging. Physiol. Behav. 92, 129–135. doi: 10.1016/j.physbeh.2007.05.040
Eguchi, H., Tsujino, A., Kaibara, M., Hayashi, H., Shirabe, S., Taniyama, K., et al. (2006). Acetazolamide acts directly on the human skeletal muscle chloride channel. Muscle Nerve 34, 292–297. doi: 10.1002/mus.20585
Gheorghe, M., Snoeck, M., Emmerich, M., Bäck, T., Goeman, J. J., and Raz, V. (2014). Major aging-associated RNA expressions change at two distinct age-positions. BMC Genomics 132:15. doi: 10.1186/1471-2164-15-132
Giresi, P. G., Stevenson, E. J., Theilhaber, J., Koncarevic, A., Parkington, J., Fielding, R. A., et al. (2005). Identification of a molecular signature of sarcopenia. Physiol. Genomics. 21:2. doi: 10.1152/physiolgenomics.00249.2004
Holloszy, J. O., and Carlson, B. M. (1995). Factors influencing the repair and adaptation of muscles in aged individuals: satellite cells and innervation. J. Gerontol. A. Biol. Sci. Med. Sci. 50A, 96–100. doi: 10.1093/gerona/50A.Special_Issue.96
Horvath, S. (2013). DNA methylation age of human tissues and cell types. Genome Biol. 14:R115. doi: 10.1186/gb-2013-14-10-r115
Horvath, S., Gurven, M., Levine, M. E., Trumble, B. C., Kaplan, H., Allayee, H., et al. (2016). An epigenetic clock analysis of race/ethnicity, sex, and coronary heart disease. Genome Biol. 17:171. doi: 10.1186/s13059-016-1030-0
Kadurin, A., Aliper, A., Kazennov, A., Mamoshina, P., Vanhaelen, Q., Khrabrov, K., et al. (2017a). The cornucopia of meaningful leads: applying deep adversarial autoencoders for new molecule development in oncology. Oncotarget 8, 10883–10890. doi: 10.18632/oncotarget.14073
Kadurin, A., Nikolenko, S., Khrabrov, K., Aliper, A., and Zhavoronkov, A. (2017b). druGAN: an advanced generative adversarial autoencoder model for de novo generation of new molecules with desired molecular properties in silico. Mol. Pharm. 14, 3098–3104. doi: 10.1021/acs.molpharmaceut.7b00346
Kaminsky, Y. G., Reddy, V. P., Ashraf, G. M., Ahmad, A., Benberin, V. V., Kosenko, E. A., et al. (2013). Age-related defects in erythrocyte 2,3-diphosphoglycerate metabolism in dementia. Aging Dis. 4, 244–255. doi: 10.14336/AD.2013.0400244
Kanehisa, M., and Goto, S. (2000). KEGG: kyoto encyclopedia of genes and genomes. Nucleic Acids Res. 28, 27–30. doi: 10.1093/nar/28.1.27
Keller, P., Vollaard, N. B., Gustafsson, T., Gallagher, I. J., Sundberg, C. J., Rankinen, T., et al. (2011). A transcriptional map of the impact of endurance exercise training on skeletal muscle phenotype. J. Appl. Physiol. 110:1. doi: 10.1152/japplphysiol.00634.2010
Kragstrup, T. W., Kjaer, M., and Mackey, A. L. (2011). Structural, biochemical, cellular, and functional changes in skeletal muscle extracellular matrix with aging. Scand. J. Med. Sci. Sports 21, 749–757. doi: 10.1111/j.1600-0838.2011.01377.x
Lenk, K., Schuler, G., and Adams, V. (2010). Skeletal muscle wasting in cachexia and sarcopenia: molecular pathophysiology and impact of exercise training. J. Cachexia Sarcopenia Muscle 1, 9–21. doi: 10.1007/s13539-010-0007-1
Li, Y., Chen, C. Y., and Wasserman, W. W. (2016). Deep feature selection: theory and application to identify enhancers and promoters. J. Comput. Biol. 23, 322–336. doi: 10.1089/cmb.2015.0189
Liu, D., Sartor, M. A., Nader, G. A., Pistilli, E. E., Tanton, L., Lilly, C., et al. (2013). Microarray analysis reveals novel features of the muscle aging process in men and women. J. Gerontol. Series A Biol. Sci.Med. Sci. 68:9. doi: 10.1093/gerona/glt015
Luff, A. R. (1998). Age-associated changes in the innervation of muscle fibers and changes in the mechanical properties of motor units. Ann. N. Y. Acad. Sci. 854, 92–101. doi: 10.1111/j.1749-6632.1998.tb09895.x
Mak, I. W., Evaniew, N., and Ghert, M. (2014). Lost in translation: animal models and clinical trials in cancer treatment. Am. J. Transl. Res. 6, 114–118.
Mamoshina, P., Kochetov, K., Putin, E., Cortese, F., Aliper, A., Lee, W. S., et al. (2018). Population specific biomarkers of human aging: a big data study using South Korean, Canadian and Eastern European patient populations. J. Gerontol. A Biol. Sci. Med. Sci. doi: 10.1093/gerona/gly005
Mamoshina, P., Vieira, A., Putin, E., and Zhavoronkov, A. (2016). Applications of deep learning in biomedicine. Mol. Pharm. 13, 1445–1454. doi: 10.1021/acs.molpharmaceut.5b00982
Moskalev, A. E., Chernyagina, E., de Magalhães, J. P., Barardo, D., Thoppil, H., Shaposhnikov, M., et al. (2015). Geroprotectors.org: a new, structured and curated database of current therapeutic interventions in aging and age-related disease. Aging 7, 616–628. doi: 10.18632/aging.100799
Ozerov, I. V., Lezhnina, K. V., Izumchenko, E., Artemov, A. V., Medintsev, S., Vanhaelen, Q., et al. (2016). In silico pathway activation network decomposition analysis (iPANDA) as a method for biomarker development. Nat. Commun. 7:13427. doi: 10.1038/ncomms13427
Peters, M. J., Joehanes, R., Pilling, L. C., Schurmann, C., Conneely, K. N., Powell, J., et al. (2015). The transcriptional landscape of age in human peripheral blood. Nat. Commun. 6:8570. doi: 10.1038/ncomms9570
Phillips, B. E., Williams, J. P., Gustafsson, T., Bouchard, C., et al. (2013). Molecular networks of human muscle adaptation to exercise and age. PLoS Genet 9:e1003389. doi: 10.1371/journal.pgen.1003389
Pöllänen, E., Fey, V., Törmäkangas, T., Ronkainen, P. H. A., Taaffe, D. R., Takala, T., et al. (2010). Power training and postmenopausal hormone therapy affect transcriptional control of specific co-regulated gene clusters in skeletal muscle. Age 32, 347–363. doi: 10.1007/s11357-010-9140-1
Putin, E., Mamoshina, P., Aliper, A., Korzinkin, M., Moskalev, A., Kolosov, A., et al. (2016). Deep biomarkers of human aging: application of deep neural networks to biomarker development. Aging 8, 1021–1033. doi: 10.18632/aging.100968
Raue, U., Trappe, T. A., Estrem, S. T., Qian, H.-R., Helvering, L. M., Smith, R. C., et al. (2012). Transcriptome signature of resistance exercise adaptations: mixed muscle and fiber type specific profiles in young and old adults. J. Appl. Physiol. 112, 1625–1636. doi: 10.1152/japplphysiol.00435.2011
Ritchie, M. E., Phipson, B., Wu, D., Hu, Y., Law, C. W., Shi, W., et al. (2015). Limma powers differential expression analyses for RNA-sequencing and microarray studies. Nucleic Acids Res. 43:e47. doi: 10.1093/nar/gkv007
Schaefer, C. F., Anthony, K., Krupa, S., Buchoff, J., Day, M., Hannay, T., et al. (2009). PID: the pathway interaction database. Nucleic Acids Res. 37, D674–D679. doi: 10.1093/nar/gkn653
Sembrat, J., Kapetanaki, M. G., and Rojas, M. (2016). “Acute respiratory distress syndrome: the role of mesenchymal stem cells and arising complications due to an aging lung,” in The Aging Lungs: Mechanisms and Clinical Sequelae, eds R. Bucala and P. J. Lee (Singapore: World Scientific), 181–196.
Short, K. R., Bigelow, M. L., Kahl, J., Singh, R., Coenen-Schimke, J., Raghavakaimal, S., et al. (2005). Decline in skeletal muscle mitochondrial function with aging in humans. Proc. Natl. Acad. Sci. U.S.A. 102, 5618–5623. doi: 10.1073/pnas.0501559102
Sifakis, E. G., Valavanis, I., Papadodima, O., and Chatziioannou, A. A. (2013). “Identifying gender independent biomarkers responsible for human muscle aging using microarray data,” in 13th IEEE International Conference on BioInformatics and BioEngineering (Chania: IEEE), 1–5.
Sood, S., Gallagher, I. J., Lunnon, K., Rullman, E., Keohane, A., Crossland, H., et al. (2015). A novel multi-tissue RNA diagnostic of healthy ageing relates to cognitive health status. Genome Biol. 16:185. doi: 10.1186/s13059-015-0750-x
Thomas, I., and Gregg, B. (2017). Metformin; a review of its history and future: from lilac to longevity. Pediatr. Diabetes 18, 10–16. doi: 10.1111/pedi.12473
Timmons, J. A., Knudsen, S., Rankinen, T., Koch, L. G., Sarzynski, M., Jensen, T., et al. (2010). Using molecular classification to predict gains in maximal aerobic capacity following endurance exercise training in humans. J. Appl. Physiol. 108:6. doi: 10.1152/japplphysiol.01295.2009
Tricarico, D., Barbieri, M., Mele, A., Carbonara, G., and Camerino, D. C. (2004). Carbonic anhydrase inhibitors are specific openers of skeletal muscle BK channel of K+-deficient rats. FASEB J. 18, 760–761. doi: 10.1096/fj.03-0722fje
Waisman, N. Y., Golubovsky, M. D., and Ilinskii, Y. Y. (2013). Differences in the parameters of longevity and its sex-specificity in human populations and modeling them in drosophila. Adv. Gerontol. 3, 268–276. doi: 10.1134/S2079057013040097
Weisleder, N., Brotto, M., Komazaki, S., Pan, Z., Zhao, X., Nosek, T., et al. (2006). Muscle aging is associated with compromised Ca2+ spark signaling and segregated intracellular Ca2+ release. J. Cell Biol. 174, 639–645. doi: 10.1083/jcb.200604166
Welle, S., Brooks, A. I., and Thornton, C. A. (2002). Computational method for reducing variance with Affymetrix microarrays. BMC Bioinform. 3:23. doi: 10.1186/1471-2105-3-23
Wetzel, P., Papadopoulos, S., and Gros, G. (2002). Inhibition of muscle carbonic anhydrase increases rise and relaxation times of twitches in rat skeletal muscle fibres. Pflugers Arch. 443, 762–770. doi: 10.1007/s00424-001-0777-6
Yoon, I. K., Kim, H. K., Kim, Y. K., Song, I. H., Kim, W., Kim, S., et al. (2004). Exploration of replicative senescence-associated genes in human dermal fibroblasts by cDNA microarray technology. Exp. Gerontol. 39, 1369–1378. doi: 10.1016/j.exger.2004.07.002
Yoon, M.-S. (2017). mTOR as a key regulator in maintaining skeletal muscle mass. Front. Physiol. 8:788. doi: 10.3389/fphys.2017.00788
Zahn, J. M., Sonu, R., Vogel, H., Crane, E., Mazan-Mamczarz, K., Rabkin, R., et al. (2006). Transcriptional profiling of aging in human muscle reveals a common aging signature. PLoS Genet. 2:e115. doi: 10.1371/journal.pgen.0020115
Keywords: aging, biomarkers of aging, deep learning, machine learning, pathway analysis, target identification
Citation: Mamoshina P, Volosnikova M, Ozerov IV, Putin E, Skibina E, Cortese F and Zhavoronkov A (2018) Machine Learning on Human Muscle Transcriptomic Data for Biomarker Discovery and Tissue-Specific Drug Target Identification. Front. Genet. 9:242. doi: 10.3389/fgene.2018.00242
Received: 26 March 2018; Accepted: 19 June 2018;
Published: 12 July 2018.
Edited by:
Junichi Sadoshima, University of Medicine and Dentistry of New Jersey, United StatesReviewed by:
Jun Yoshino, Washington University School of Medicine in St. Louis, United StatesGil Atzmon, University of Haifa, Israel
Copyright © 2018 Mamoshina, Volosnikova, Ozerov, Putin, Skibina, Cortese and Zhavoronkov. This is an open-access article distributed under the terms of the Creative Commons Attribution License (CC BY). The use, distribution or reproduction in other forums is permitted, provided the original author(s) and the copyright owner(s) are credited and that the original publication in this journal is cited, in accordance with accepted academic practice. No use, distribution or reproduction is permitted which does not comply with these terms.
*Correspondence: Polina Mamoshina, cG9seUBpbnNpbGljb21lZGljaW5lLmNvbQ==