 David P. Gavin1,2†
 Joel G. Hashimoto3,4†
 Nathan H. Lazar3
 Lucia Carbone3
 John C. Crabbe3,4
 Marina Guizzetti3,4*
- 1Jesse Brown Veterans Affairs Medical Center, Chicago, IL, United States
- 2Department of Psychiatry, Center for Alcohol Research in Epigenetics, University of Illinois at Chicago, Chicago, IL, United States
- 3Department of Behavioral Neuroscience, Oregon Health and Science University, Portland, OR, United States
- 4VA Portland Health Care System, Portland, OR, United States
Alcohol use disorder (AUD) is a chronic mental illness in which patients often achieve protracted periods of abstinence prior to relapse. Epigenetic mechanisms may provide an explanation for the persisting gene expression changes that can be observed even after long periods of abstinence and may contribute to relapse. In this study, we examined two histone modifications, histone 3 lysine 4 tri-methylation (H3K4me3) and histone 3 lysine 27 tri-methylation (H3K27me3), in the prefrontal cortex of Withdrawal Seizure Resistant (WSR) mice 21 days after 72 h of ethanol vapor exposure. These histone modifications were selected because they are associated with active promoters (H3K4me3) and repressed gene expression in a euchromatic environment (H3K27me3). We performed a genome-wide analysis to identify differences in H3K4me3 and H3K27me3 levels in post-ethanol exposure vs. control mice by ChIP-seq. We detected a global reduction in H3K4me3 peaks and increase in H3K27me3 peaks in post-ethanol exposure mice compared to controls, these changes are consistent with persistent reductions in gene expression. Pathway analysis of genes displaying changes in H3K4me3 and H3K27me3 revealed enrichment for genes involved in proteoglycan and calcium signaling pathways, respectively. Microarray analysis of 7,683 genes and qPCR analysis identified eight genes displaying concordant regulation of gene expression and H3K4me3/H3K27me3. We also compared changes in H3K4me3 and/or H3K27me3 from our study with changes in gene expression in response to ethanol from published literature and we found that the expression of 52% of the genes with altered H3K4me3 binding and 40% of genes with H3K27me3 differences are altered by ethanol exposure. The chromatin changes associated with the 21-day post-exposure period suggest that this period is a unique state in the addiction cycle that differs from ethanol intoxication and acute withdrawal. These results provide insights into the enduring effects of ethanol on proteoglycan and calcium signaling genes in the brain.
Introduction
Alcohol use disorder (AUD) is a chronic condition where sufferers may relapse even after periods of protracted abstinence (Olive, 2010). Gene expression and epigenetic changes following acute and chronic ethanol use and acute withdrawal have begun to be characterized (Gavin et al., 2016; Pandey et al., 2017). However, the mediators of persisting changes to gene expression caused by 72-h ethanol exposure have not been fully explored. The stable nature of some epigenetic marks could provide mechanisms to account for lasting changes in gene expression that mediate relapse to ethanol use following protracted abstinence (Wiren et al., 2006).
In this study, we examine changes in two durable histone modifications, histone 3 lysine 4 and lysine 27 trimethylation (H3K4me3 and H3K27me3). Histones have a half-life of months, and there is evidence that H3K4 and H3K27 methylation are mitotically inherited (Commerford et al., 1982; Chen and Dent, 2014). These two marks serve countervailing roles with H3K4me3 being present at active promoters and H3K27me3 being associated with repression of transcript elongation (Strahl et al., 1999; Schubeler et al., 2004; Guenther et al., 2007). We decided to focus on these histone modifications because they have the stability to encode changes in gene expression over a prolonged period (Robison and Nestler, 2011).
There is a growing literature regarding the association between histone modifications and ethanol. Studies of patients with alcohol dependence have identified ethanol-induced changes to histone modifications in the brain (Zhou et al., 2011; Ponomarev et al., 2012). In the rat amygdala, acute ethanol increases global and prodynorphin and pronociceptin promoter histone acetylation levels (Pandey et al., 2008; D’Addario et al., 2013), and reduces prodynophin and pronociceptin H3K27me3 binding (D’Addario et al., 2013). Moreover, in the hippocampus, ethanol-induced histone H3 acetylation and H3K4me3 have been found to regulate expression of brain derived neurotrophic factor (BDNF) exons (Stragier et al., 2015). Finally, acute ethanol withdrawal leads to decreased histone acetylation in the rat amygdala (Pandey et al., 2008; Sakharkar et al., 2012; Moonat et al., 2013).
A state of alcohol dependence must be inferred in rodents by the emergence of withdrawal signs when alcohol is discontinued. Most laboratory rodents will not voluntarily drink sufficient alcohol to become physically dependent (Crabbe, 2014). Even when exposure to drinking solutions is extended for months, blood alcohol values rarely reach intoxicating levels (Wahlstrom, 1987). A very common procedure used to produce chronic dependence is to expose animals continuously to vaporized alcohol (Goldstein and Pal, 1971; Rogers et al., 1979; Becker, 2014). Following vapor inhalation exposure to intoxicating blood levels, the subsequent withdrawal signs in rodents parallel those in human alcoholics very closely (Friedman, 1980). For example, depending on the vapor concentration, withdrawal from 72 h exposure to ethanol vapor can be lethal in mice (Goldstein, 1972). We have selectively bred Withdrawal Seizure-Prone (WSP) and -Resistant (WSR) mouse lines to display severe or mild withdrawal handling-induced convulsions, respectively, following 72 h continuous vapor exposure (Kosobud and Crabbe, 1986), and have characterized their withdrawal extensively (Metten and Crabbe, 1996). WSP and WSR mice both show many withdrawal signs, but differ on some due to their genetic constitutions. WSP mice show tremors, seizures, enhanced sensitivity to chemical convulsants, anxiety-like behavior and reduced activity, while WSR mice display enhanced backward walking, Straub tail (Kosobud and Crabbe, 1986) and a tendency to engage in relapse drinking (Hashimoto et al., 2011). In the current study, we exposed WSR to 72 h of ethanol vapor and measured the genome-wide distribution of H3K4me3 and H3K27me3 marks in the prefrontal cortex using chromatin immunoprecipitation followed by sequencing (ChIP-seq) 21 days after ethanol exposure. The prefrontal cortex is a critical site of ethanol’s rewarding effects, wherein it mediates approach/avoidant behavior through its communications with multiple brain regions, such as the nucleus accumbens, ventral tegmental area, and amygdala (Chandler et al., 1993; Harper and Matsumoto, 2005).
This study identifies, for the first time, the locations of differential H3K4me3 and H3K27me3 peaks in mice 21 days after ethanol exposure compared to control mice. We find that genes related to proteoglycans are enriched in H3K4me3 peaks and that genes related to calcium signaling are enriched in H3K27me3 binding, suggesting that these gene networks are differentially epigenetically regulated during protracted withdrawal and may have a role in relapse.
Materials and Methods
Animal Subjects and Ethanol Intoxication
The Withdrawal Seizure Resistant (WSR-1, -2) mice, derived from heterogeneous HS/Ibg mice by phenotypic selection for resistance to chronic ethanol withdrawal seizures (Crabbe and Kosobud, 1986), were used for this study. We have previously shown altered signaling of genes related to epigenetic regulation following chronic ethanol exposure and increased relapse drinking in these mice (Hashimoto et al., 2011, 2017). WSR-1 was used for the chromatin-immunoprecipitation followed by massively parallel DNA sequencing (ChIP-seq) experiments, and WSR-1 and -2 were used for microarray expression analysis. Mice were maintained with a lights-on and lights-off cycle at 6 a.m. and 6 p.m., respectively, and a room temperature of 22 ± 1°C. Purina Lab Diet chow and water were available ad libitum throughout routine husbandry and during experimentation. All animal procedures were in accordance with the US NIH guide for the care and use of laboratory animals and were approved by the Portland Oregon VAMC IACUC.
Four adult WSR-1 male mice per group (control and ethanol) were used for ChIP-seq analyses (H3K4me3 and H3K27me3 ChIP-seq analyses were carried out on the same animals). Four additional adult WSR-1 male mice per group were used in validation ChIP-qPCR experiments; the animals used in ChIP-seq and the animals used in ChIP-qPCR studies were from the same ethanol exposure studies.
Eight adult WSR-1 and -2 male mice per group (control and ethanol) were used for microarray experiments. For each array hybridization, the RNA from two animals from the same selected line and treatment group was pooled; the number of replicates (n) per treatment group is therefore 4. Four additional adult WSR-1 and -2 male mice per group were used in qPCR validation experiments; the animals used in microarray studies and the animals used in qPCR studies were from the same ethanol exposure studies.
Exposure to ethanol vapor was carried out as previously described (Wilhelm et al., 2014). Briefly, mice were injected i.p. with 1.5 g/kg ethanol and 68.1 mg/kg pyrazole HCl (to maintain elevated blood ethanol concentrations, BECs, by inhibiting alcohol dehydrogenase) immediately before being placed in the ethanol chambers. Control animals were injected with 68.1 mg/kg pyrazole HCl and placed in chambers identical to the ethanol chambers but with ambient air circulated instead of vaporized ethanol. Each day, mice were briefly removed from the chambers to record weights, administer 68.1 mg/kg pyrazole HCl, and to obtain a blood sample. BECs were monitored daily by sampling 20 μL of blood from the tail vein with ethanol concentrations determined by gas chromatography (Beadles-Bohling and Wiren, 2006). The WSR line and alcohol exposure paradigm used here has been found to induce dependence as documented in several prior publications (Kosobud and Crabbe, 1986; Hashimoto et al., 2011). After 72 h of ethanol exposure, all animals were returned to normal mouse cages for 21 days with daily monitoring of overall health but no further experimental manipulations.
ChIP-seq Library Generation, Sequencing, and Analysis
Twenty-one days after cessation of ethanol vapor or control exposure, mice were euthanized and the prefrontal cortex was rapidly isolated, snap-frozen in liquid nitrogen, and stored at -80°C as previously described (Hashimoto et al., 2017) until processing. Each prefrontal cortex was homogenized in a 10 mL Dounce homogenizer in RPMI buffer, cross-linked with a final concentration of 1.6% formaldehyde, and fragmented by sonication using a Bioruptor-Pico (Diagenode, Denville, NJ, United States) to achieve fragment sizes ranging from ∼100 to 500 bp. Protein A/G PLUS-Agarose Beads were used to pre-clear the fragmented chromatin samples for 2 h at 4°C with slow end-over-end rotation. Primary antibody [Millipore Anti-Trimethyl-Histone H3 (Lys4), Cat# 07-473; or Millipore Anti-Trimethyl-Histone H3 (Lys27), Cat# 07-449] was added to supernatant after clearing along with fresh agarose beads and incubated overnight at 4°C with gentle end-over-end rotation. The following day, beads were washed with low salt buffer, high salt buffer, lithium chloride buffer, and TE buffer followed by elution from the beads and DNA isolation using the ChIP DNA Clean and Concentrator Kit (Zymo Research, Irvine, CA, United States). DNA was quantitated using the Quant-iT PicoGreen dsDNA Assay Kit (Thermo Fisher Scientific, Waltham, MA, United States) according to the manufacturers protocol. Sequencing libraries were prepared using the NEBNext ChIP-seq Library Prep Master Mix Set and Multiplex Oligos for Illumina Index Primer Set 1 according to the manufacturer’s protocol using 10 ng of ChIP DNA and size selection for 150 bp inserts (New England Biolabs, Ipswich, MA, United States). Short read sequencing assays were performed by the OHSU Massively Parallel Sequencing Shared Resource.
Sequencing results consisting of 75 bp single-ended reads from the prefrontal cortex of 8 WSR-1 mice (four control and four ethanol-treated) and the pooled reads from the input material from all eight samples were obtained. Adapter sequences were removed using trimmomatic (v0.35) (Bolger et al., 2014), exact read copies were removed using fastx collapser (v0.0.13) (Hannon Lab, 2010), and reads were mapped to the GRCm38/mm10 mouse genome assembly with BWA-mem (v0.7.9.a) (Li and Durbin, 2009). After removing reads with mapping scores below 30 we used the R SPP package (Kharchenko et al., 2008) to calculate strand cross-correlation measures and all samples were exceeding or near recommended thresholds set by ENCODE. Two H3K4me3 samples (one control and one ethanol) were removed from further analysis because they contain a large fraction of duplicated reads compared to the other samples.
For the H3K4me3 and H3K27me3 ChIP-seq analysis, we counted the number of mapped reads, the number of unique mapping positions and estimated the library complexity using the non-redundant fraction (Landt et al., 2012). For genomic tracks of read coverage, we extended reads to the fragment length (150 bp) and computed the Pearson correlation coefficient between the mapping profiles of each pair of samples after removing ‘blacklisted’ regions obtained from the ENCODE consortium (Consortium, 2012). To identify peaks above background we used the irreproducibility discovery rate (IDR) analysis detailed by Li et al. (2011) with an IDR cutoff of 0.01. We then performed a differential binding analysis on the H3K4me3 data using the DiffBind package (v3.2) to run EdgeR (Robinson et al., 2010) with an FDR cutoff of 0.1. Finally, we associated all peaks with RefSeq (Pruitt et al., 2005) genes noting the distance to the nearest gene.
Because H3K27me3 ChIP-seq produces broad peaks that cover larger areas of the genome instead of the narrow peaks seen with H3K4me3 marks, we sequenced an additional Illumina lane of 75 base-pair single-ended reads and combined these reads for each sample. Peaks were called using MACS2 (Zhang et al., 2008; Feng et al., 2012) and the IDR analysis was not performed as this method is not applicable to broad peaks. Instead we used stringent overlap criteria requiring that peaks were found to overlap in all four samples of one condition and zero samples of the other condition.
RNA Isolation and Microarray Processing
Twenty-one days after cessation of ethanol vapor or control exposure, mice were euthanized and the prefrontal cortex was rapidly isolated, snap-frozen in liquid nitrogen, and stored at -80°C as previously described (Hashimoto et al., 2017) until processing. Total RNA was isolated using RNA STAT-60 (Tel Test Inc., Friendswood, TX, United States) with genomic DNA removal using the DNA-Free RNA Kit (Zymo Research) as described previously (Hashimoto et al., 2017) and RNA integrity was determined using a 1% agarose gel stained with SYBR Gold (Thermo Fisher Scientific, Waltham, MA, United States) and quantitated by UV spectroscopy.
Microarrays were purchased from the National Institute on Aging microarray facility which includes 16,897 features corresponding to 7,683 unique GenBank Gene IDs (Nadon et al., 2005). Complex probe was generated by linear synthesis with 33P-dCTP using SuperScript II Reverse Transcriptase (Thermo Fisher, Waltham, MA, United States) as previously described (Nadon et al., 2005). Complex probes were purified using Biospin P-30 columns (Bio-Rad, Hercules, CA, United States) and labeling efficiency determined using a Bioscan QC-4000 XER (Bioscan, Inc., Washington, DC, United States) and hybridized to arrays overnight with gentle mixing. Probe hybridization was measured using a Cyclone Phosphorimager and OptiQuant version 4.0 (Packard Instrument Company, Downers Grove, IL, United States). Spot identification and intensity measurements were carried out on exported data from OptiQuant using Array-Pro Analyzer 4.5 (MediaCybernetics, Rockville, MD, United States).
Spot hybridization intensities were analyzed using R. The microarray data presented here are part of a larger gene expression study to be published at a later date, which includes 62 total array hybridizations including samples derived from the two sexes of multiple mouse lines at 0 h, 8 h, and 21 days after ethanol exposure. In this study, we present the results from eight arrays that corresponded to the ChIP-seq experiments (i.e., WSR male mice prefrontal cortices 21 days after ethanol exposure). Clones with hybridization intensities below background on more than 10% of the arrays were excluded and batch effects were removed using the ‘sva’ package (Leek et al., 2012). Ethanol regulated genes were determined using the empirical Bayes function of the ‘LIMMA’ package (McCarthy and Smyth, 2009; Ritchie et al., 2015).
Bioinformatic Analysis of ChIP-seq and Gene Expression
Genes showing differential peaks of H3K4me3 or H3K27me3 in ChIP-seq analysis or identified as differentially regulated by post-ethanol were analyzed separately for Gene Ontology (GO) and pathway enrichment using The Database for Annotation, Visualization and Integrated Discovery (DAVID) v6.8 (Huang et al., 2009). The KEGG pathway schematic with ChIP-seq data integrated into a simplified pathway was created in Cytoscape (3.5.1) using the CytoKegg (1.0.1) application (Shannon et al., 2003). Sequencing data was visualized using the Integrated Genomics Viewer (IGV, 2.4.5).
Confirmation of ChIP-seq and Microarray Results
Peak regions identified in the ChIP-seq analyses were used in the design of primers using the NCBI Primer-BLAST on-line tools (Ye et al., 2012). Quantitative PCR (qPCR) was run on ChIP DNA using the SsoAdvanced Universal SYBR Green Supermix and CFX96 Real-Time System (Bio-Rad, Hercules, CA, United States) and data is presented as percent of input. Gene expression changes were measured by qRT-PCR using the iTaq Universal SYBR Green One-Step Kit (Bio-Rad, Hercules, CA, United States) using RNA from independent animals from the same studies as those used for the microarray experiment described here. Primers were designed using Primer-BLAST (Ye et al., 2012) for Alk and were down-loaded from PrimerBank (Wang et al., 2012) for Wnt5a, Camk2a, Dgkb, and Ezr. For each set of qPCR and qRT-PCR primers, primer efficiency was between 90 and 110% and resulted in a discreet single peak during melt analysis.
Results
ChIP-seq Analysis
Our analysis of the H3K4me3 ChIP-seq data identified 445 differentially bound peaks between the post-ethanol and control mice of which 271 (61%) were located within regulatory regions or gene bodies of 294 unique genes (Supplementary Table 1). Seven genes had multiple peaks associated (1700011I03Rik, Gm10921, Gm13152, Gm14345, Gm14346, Gm38437, Soga1). Furthermore, 29 peaks had two genes associated, and 4 peaks had three genes associated. We found that 92 (30%) of the gene-associated peaks were located within 100 bp of the transcription start site (TSS; 33 peaks) or proximal promoter region (59 peaks) defined here as 2,000 bp upstream of the TSS and 200 bp into the gene. Figure 1 shows representative examples of differential Integrative Genomics Viewer (IGV) tracks of H3K4me3 peaks associated with the TSS of two genes in control and post-ethanol mice. Of the genes showing differential H3K4me3 distribution, 52% (159 genes) have been previously shown to be differentially regulated by ethanol (Ponomarev et al., 2012; Wilhelm et al., 2014; Farris et al., 2015; Smith et al., 2016; van der Vaart et al., 2017). The majority of these gene-associated peaks (196, 64%) reported here showed decreased H3K4me3 in the post-ethanol samples compared to control, consistent with prevalent downregulation of gene expression (Table 1).
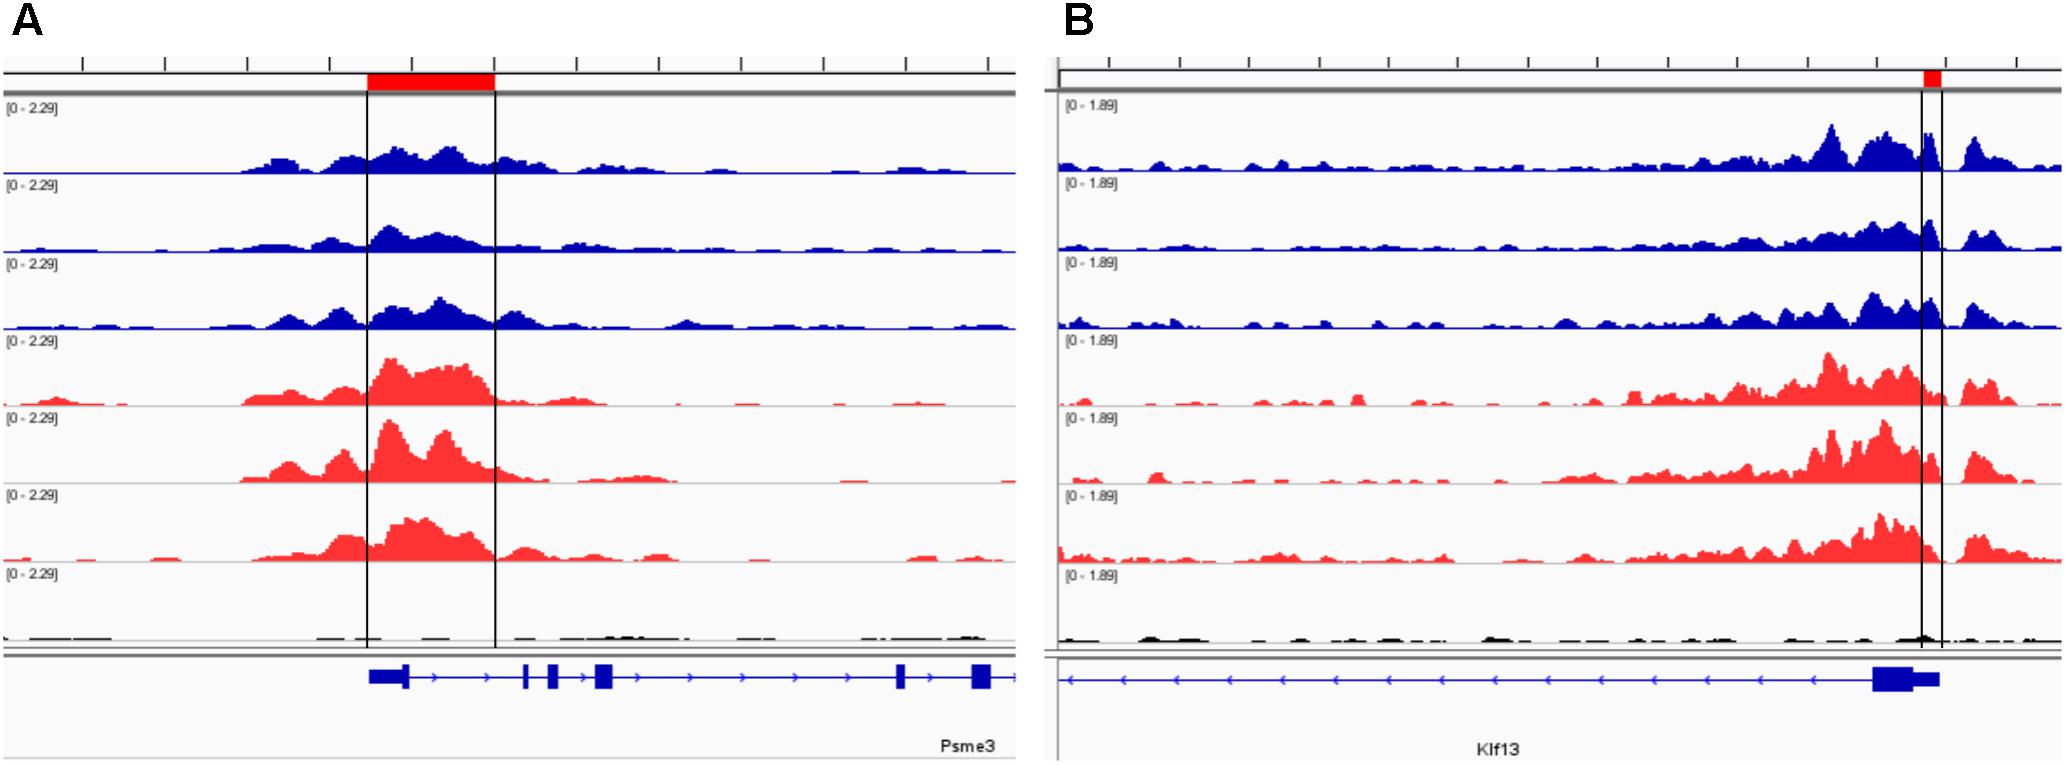
FIGURE 1. Representative Integrative Genomics Viewer (IGV) browser tracks of H3K4me3 peaks near the TSS following ethanol exposure. For each panel, blue tracks are from control animals, red tracks are from ethanol-treated animals, and black track is the input signal. All IGV tracks in a given comparison have the same scaling factor for the y-axis as indicated in the upper left hand region of each track. The region of the genome identified as differentially bound is indicated near the top of each panel in red and with black lines through the tracks. The RefSeq gene map is presented in blue at the bottom of each panel showing the overall gene structure. (A) Psme3 shows increased H3K4me3 in ethanol treated samples. (B) Klf13 shows decreased H3K4me3 in ethanol treated samples at one of the primary peaks at the gene TSS.
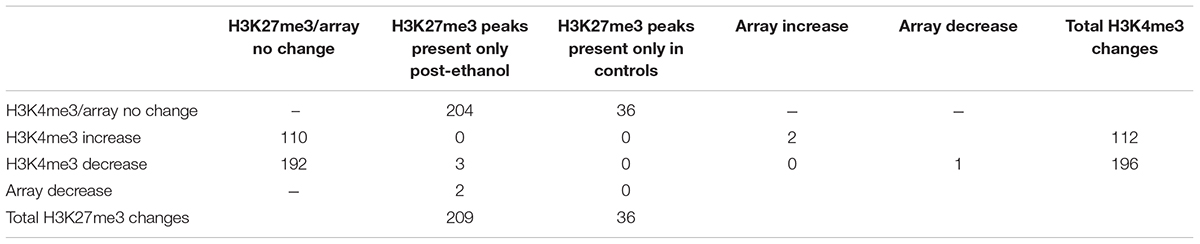
TABLE 1. Matrix of the changes in H3K4me3, H3K27me3, and microarray gene expression and their overlap during ethanol withdrawal in comparison to control.
To further our understanding of ethanol dysregulation of histone marks during this 21-day post-ethanol exposure period we also performed ChIP-seq for H3K27me3. H3K27me3 generally produces broad peaks often encompassing several kilobases of DNA, which makes analysis with traditional statistical approaches challenging, requiring a different strategy than the one described above for H3K4me3. We first looked at peaks present in all four samples of each group and found 35,710 peaks in the ethanol treatment group and 29,883 peaks in the control group. A large portion of the peaks identified completely or partially overlapped in the control and ethanol-treatment samples (Figure 2). To avoid false-positive results, we used a very stringent method for calling differential H3K27me3 peaks between control and post-ethanol samples. Only when peaks are present in all four replicates of one treatment group with no corresponding peaks present in any of the four replicate samples of the other treatment group do we identify them as differential H3K27me3 peaks. We identified 771 peaks that were present in one condition but not in the other. 640 peaks were present in all four post-ethanol samples but in none of the control samples; 131 peaks were present in all the control samples but in none of the post-ethanol samples (Figure 2). Two hundred forty of these differential peaks were associated with 231 unique genes. Five peaks were associated with two genes. Ten genes had two peaks present (Drd3, Gm5134, Gpr39, Rora, Sorcs2, Svep1, Syt9, Tspan18, Wwox, 2310007B03Rik), two genes (Alk, Sncaip) had three peaks. Supplementary Table 2 shows the list of the 245 genes associated with H3K27me3 differential peaks (genes with two or three peaks are listed duplicated in the table) and the gene region where the differential peak is located. Eight peaks are associated with the promoter region, eight are in the TSS region, and 229 are associated with the gene body. Of the 245 genes with differentially bound peak regions 85% (209) had H3K27me3 peaks only in the post-ethanol samples compared to control. These results, similarly to the results found for post-ethanol changes on H3K4me3 and described in the previous paragraph, are consistent with prevalent down-regulation of gene expression during the 21-day post-ethanol period (Table 1). Figure 3 shows representative examples of differential IGV tracks of H3K27me3 peaks associated with the TSS of two genes in control and post-ethanol mice. Comparison of our H3K27me3 ChIP-seq data with previously published ethanol data showed 40% (98 genes) of genes identified in this study have been previously identified as regulated by ethanol (Ponomarev et al., 2012; Wilhelm et al., 2014; Farris et al., 2015; Smith et al., 2016; van der Vaart et al., 2017).
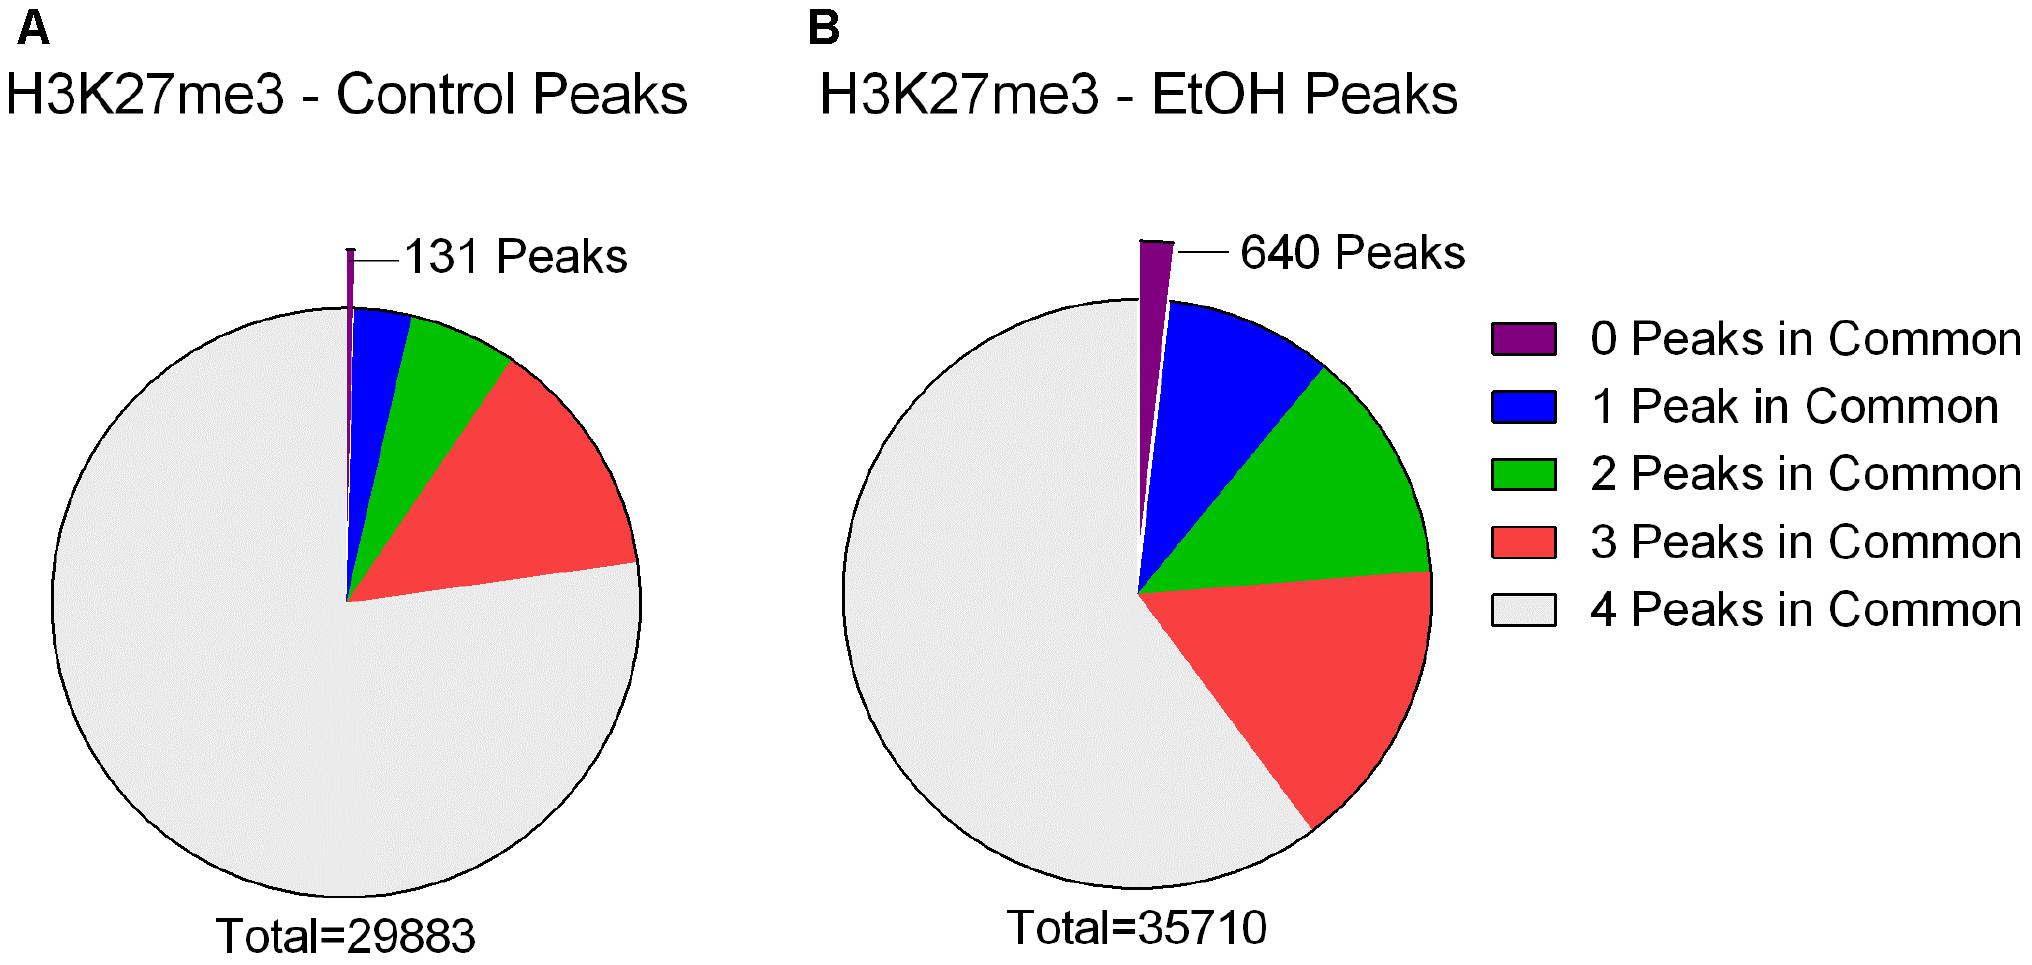
FIGURE 2. H3K27me3 peaks called in control and ethanol samples. (A) Out of a total of 29,883 peaks called in all four Control samples, 23,072 were also present in all four ethanol treated samples (77.21%), 3,972 were present in three of the ethanol treated samples (13.29%), 1,769 were present in two of the ethanol treated samples (5.92%), 939 were present in one of the ethanol treated samples (3.14%), and 131 were present in 0 of the ethanol-treated samples (0.44%). (B) Out of a total of 35,710 peaks called in all four ethanol samples, 21,477 were also present in all four Control samples (60.14%), 5,755 were present in three of the control samples (16.12%), 4,570 were present in two of the control samples (12.80%), 3,268 were present in one of the Control samples (9.15%), and 640 were present in 0 of the Control samples (1.79%).
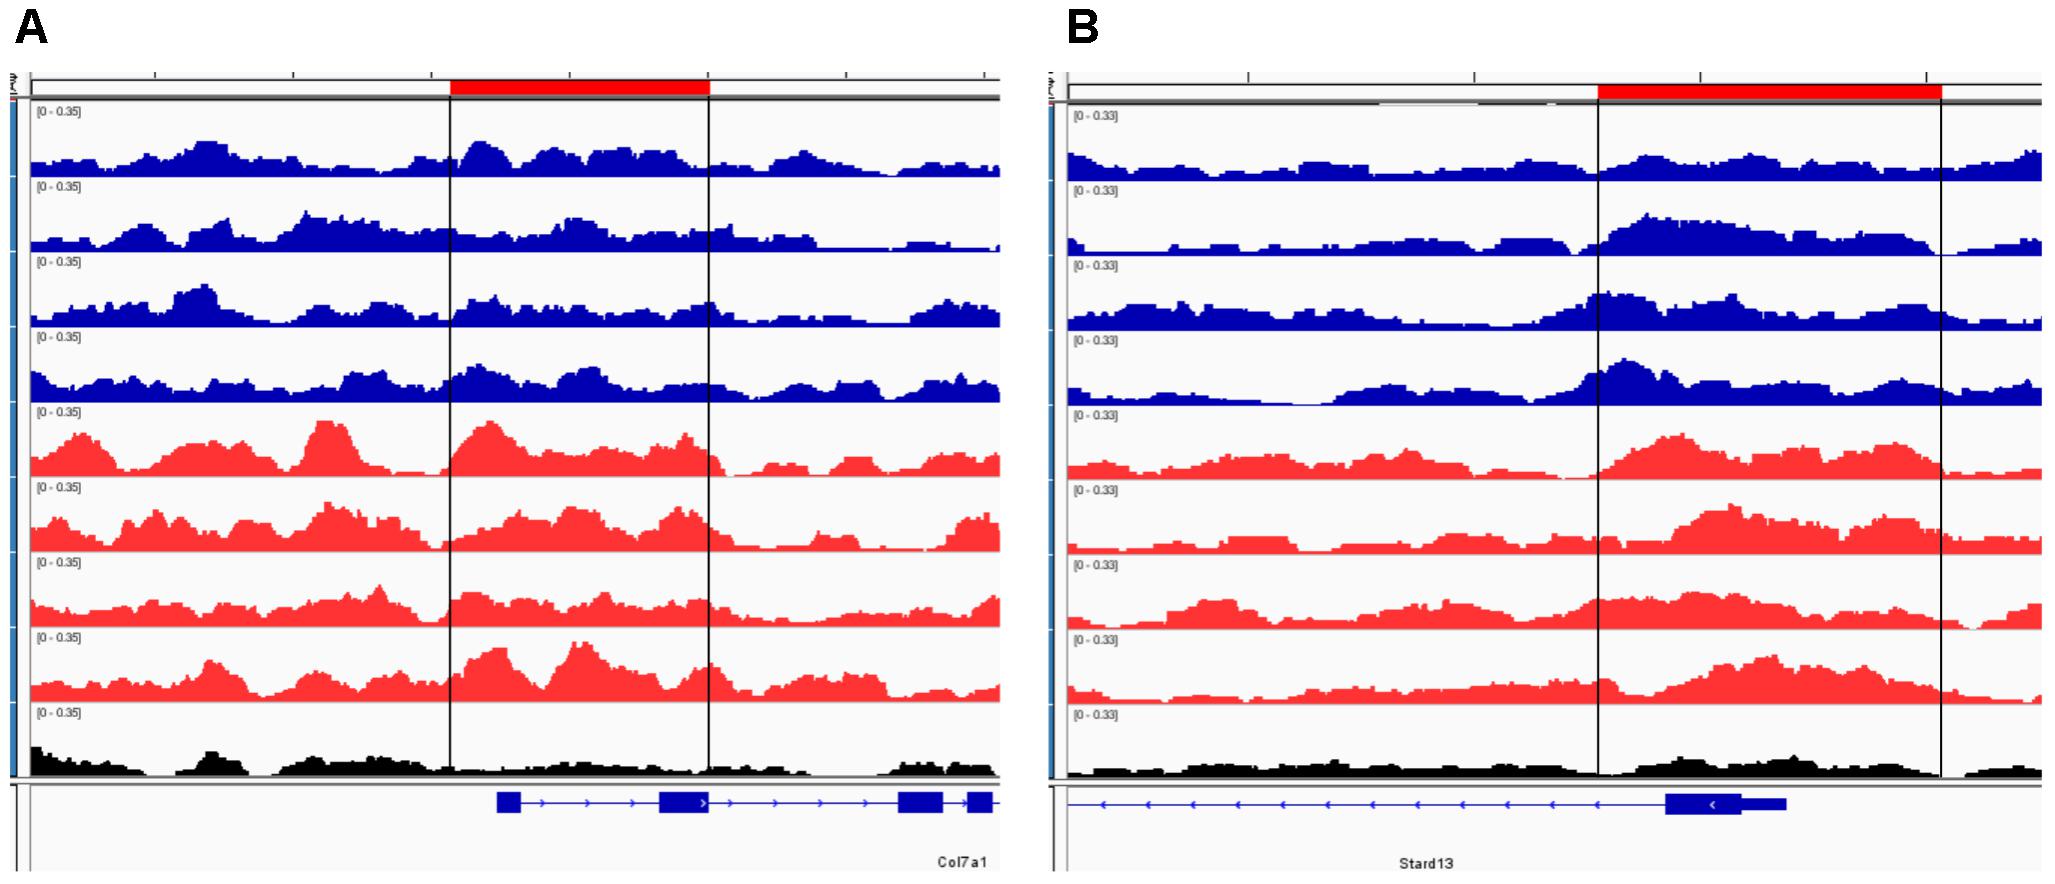
FIGURE 3. Representative IGV browser tracks of H3K27me3 peaks near the TSS following ethanol exposure. For each panel, the blue tracks are from control animals, red tracks are from ethanol-treated animals, and black track is the input signal. All IGV tracks in a given comparison have the same scaling factor for the y-axis as indicated in the upper left hand region of each track. The region of the genome identified as differentially bound is indicated near the top of each panel in red and with black lines through the tracks. The RefSeq gene map is presented in blue at the bottom of each panel showing the overall gene structure. (A) Col7a1 shows increased H3K27me3 in ethanol treated samples. (B) Stard13 shows increased H3K27me3 in ethanol treated samples.
Three genes had differential H3K4me3 and H3K27me3 peaks, Trp63 (transformation related protein 63); Wnt5a (wingless-type MMTV integration site family, member 5A); and Lhfpl3 (lipoma HMGIC fusion partner-like 3). All three genes had reduced H3K4me3 in the ethanol samples and the presence of H3K27me3 peaks in the post-ethanol samples suggesting expression of these genes is repressed during protracted ethanol withdrawal (Table 1 and Supplementary Tables 1, 2).
Pathway and Gene Ontology Analyses
Next we performed pathway and GO analyses on the genes showing differential histone marks. For H3K4me3, the top KEGG pathways identified were “proteoglycans in cancer,” “viral carcinogenesis,” and “viral myocarditis” (Table 2). The top GO categories were “dendrite,” “synapse,” and “cell junction” (Table 3). Interestingly, four genes that are part of the top KEGG pathway for H3K4me3, “proteoglycans in cancer,” were identified in the H3K27me3 analysis suggesting dysregulation of this pathway through multiple epigenetic mechanisms (Table 2 and Figure 4). For H3K27me3, the top KEGG pathways identified were “calcium signaling pathway” and “nicotinate and nicotinamide metabolism” (Table 2). We observed an additional six genes in the “calcium signaling pathway” in our H3K4me3 analysis suggesting an important role of calcium signaling during this post-ethanol period (Table 2). The top GO categories for H3K27me3 were “calcium ion binding,” “receptor complex,” and “transcriptional activator activity, RNA polymerase II core promoter proximal region sequence-specific binding” (Table 3).
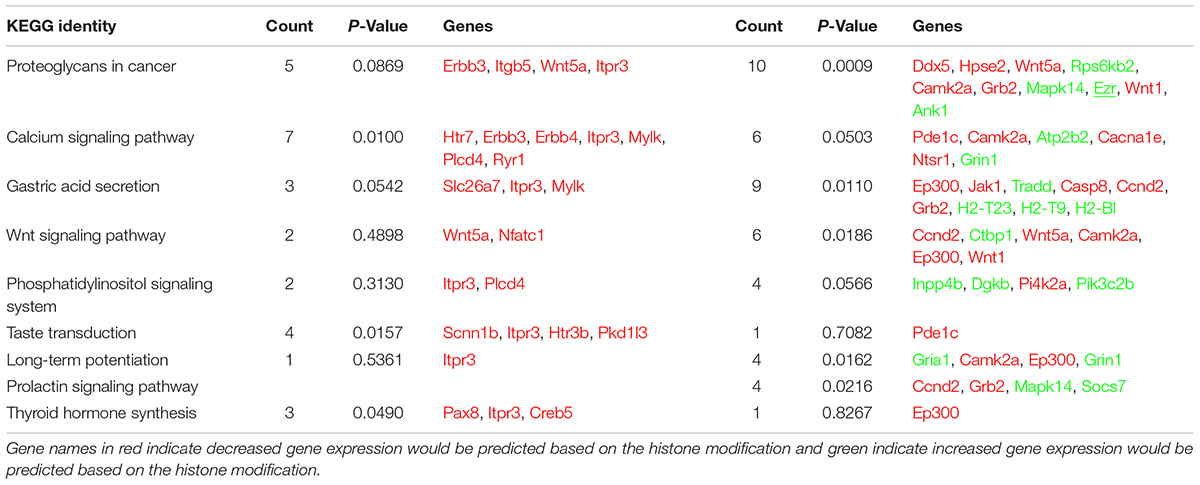
TABLE 2. Enriched KEGG pathways in genes with post-ethanol-induced changes in H3K4me3 and H3K27me3.
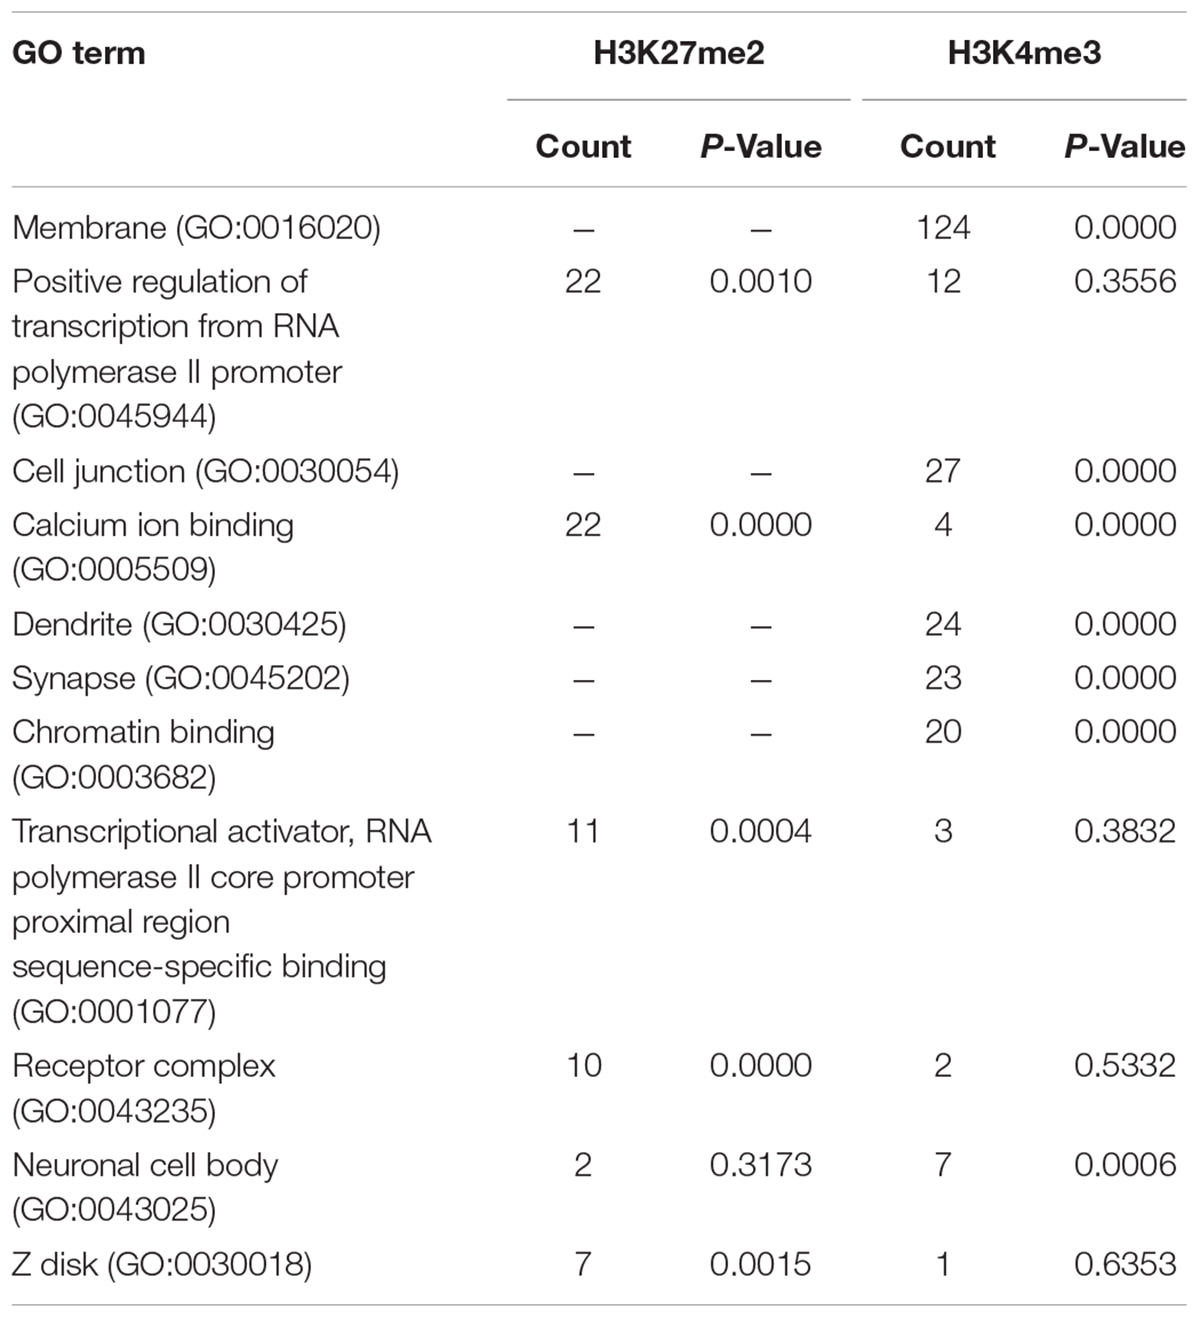
TABLE 3. Enriched GO categories in genes with post-ethanol-induced changes in H3K4me3 and H3K27me3.
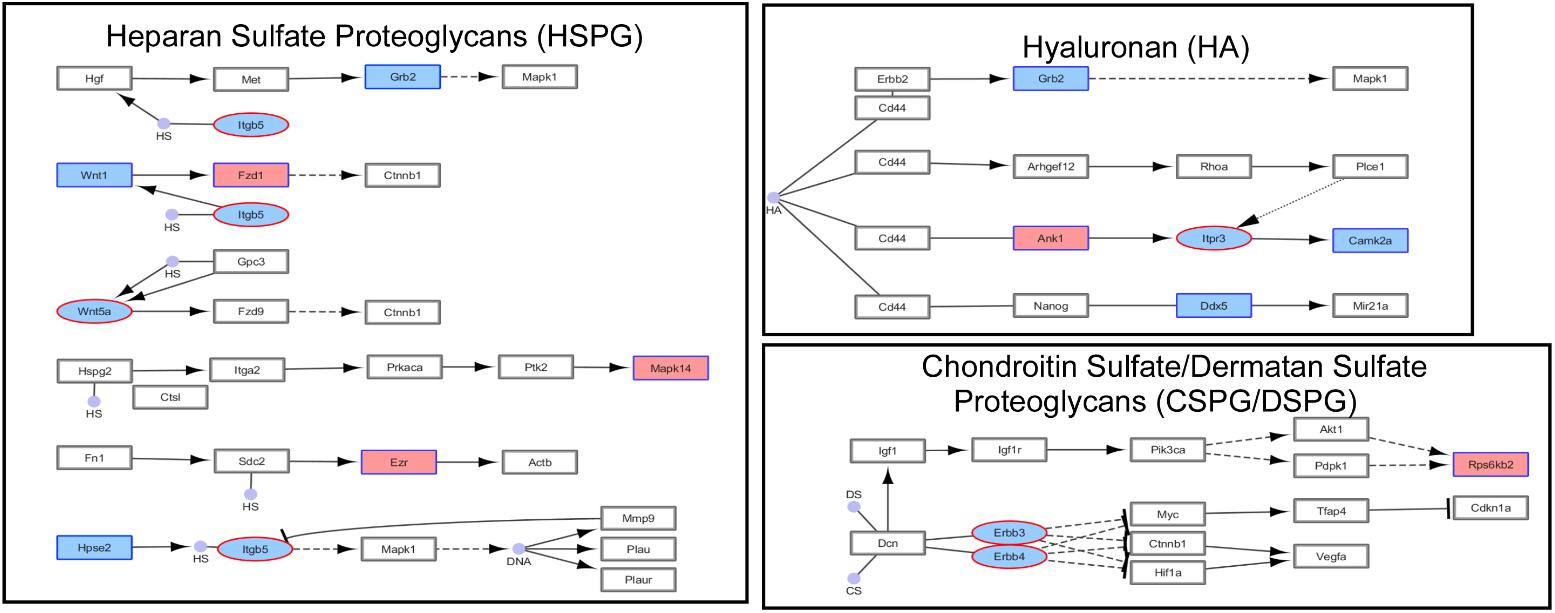
FIGURE 4. Simplified KEGG pathway “Proteoglycans in Cancer” with H3K4me3 and H3K27me3 enriched genes. The KEGG pathway was down-loaded into Cytoscape (3.5.1) using the CytoKegg (1.0.1) application. ChIP-seq data was overlaid on the pathway with H3K4me3 results shown in blue rectangles and H3K27me3 results shown in red ovals. Blue filled nodes indicate a predicted down-regulation with ethanol based on the ChIP-seq results and pink filled nodes indicate a predicted up-regulation. Proteoglycans play several crucial roles in modulating neuronal migration, axonal regeneration, and synaptic plasticity.
Gene Expression Analysis
Additionally, we carried out gene expression array analysis of the PFC of control and post-ethanol exposure mice. We found that 21 d after ethanol exposure 86 of the 7,683 genes present in the microarray platform were differentially expressed, with an unadjusted p-value < 0.01, 40% of the differentially expressed genes were downregulated and 60% were upregulated (Table 3). Notably, DNA methyltransferase 3A (Dnmt3a) was down-regulated during protracted withdrawal from alcohol and has been previously identified as dysregulated following ethanol exposure (Smith et al., 2016; van der Vaart et al., 2017). We then subjected the differentially expressed genes to pathway and GO analyses. The top KEGG pathway identified was “cell adhesion molecules.” The top GO categories were “protein binding,” “nucleoplasm,” and “coronary vasculature development.” The microarray platform used for this experiment contained 49% of the genes that showed changes in H3K4me3 and 18% of the genes that showed changes in H3K27me3. Five genes displaying changes in H3K4me3 or H3K27me3 also showed differential expression; in all five cases, the expression profile of the genes matched the predicted expression based on histone methylation with increased H3K4me3 associated with increased expression and increased H3K27me3 associated with decreased expression. Specifically, we found that genes Pard3 and Plagl1 showed increased H3K27me3 in ethanol samples and decreased expression compared to controls; the gene Calu displayed reduced H3K4me3 binding and reduced gene expression; genes Ezr and Dgkb had increased H3K4me3 and increased gene expression (Tables 1, 4 and Supplementary Tables 1, 2).
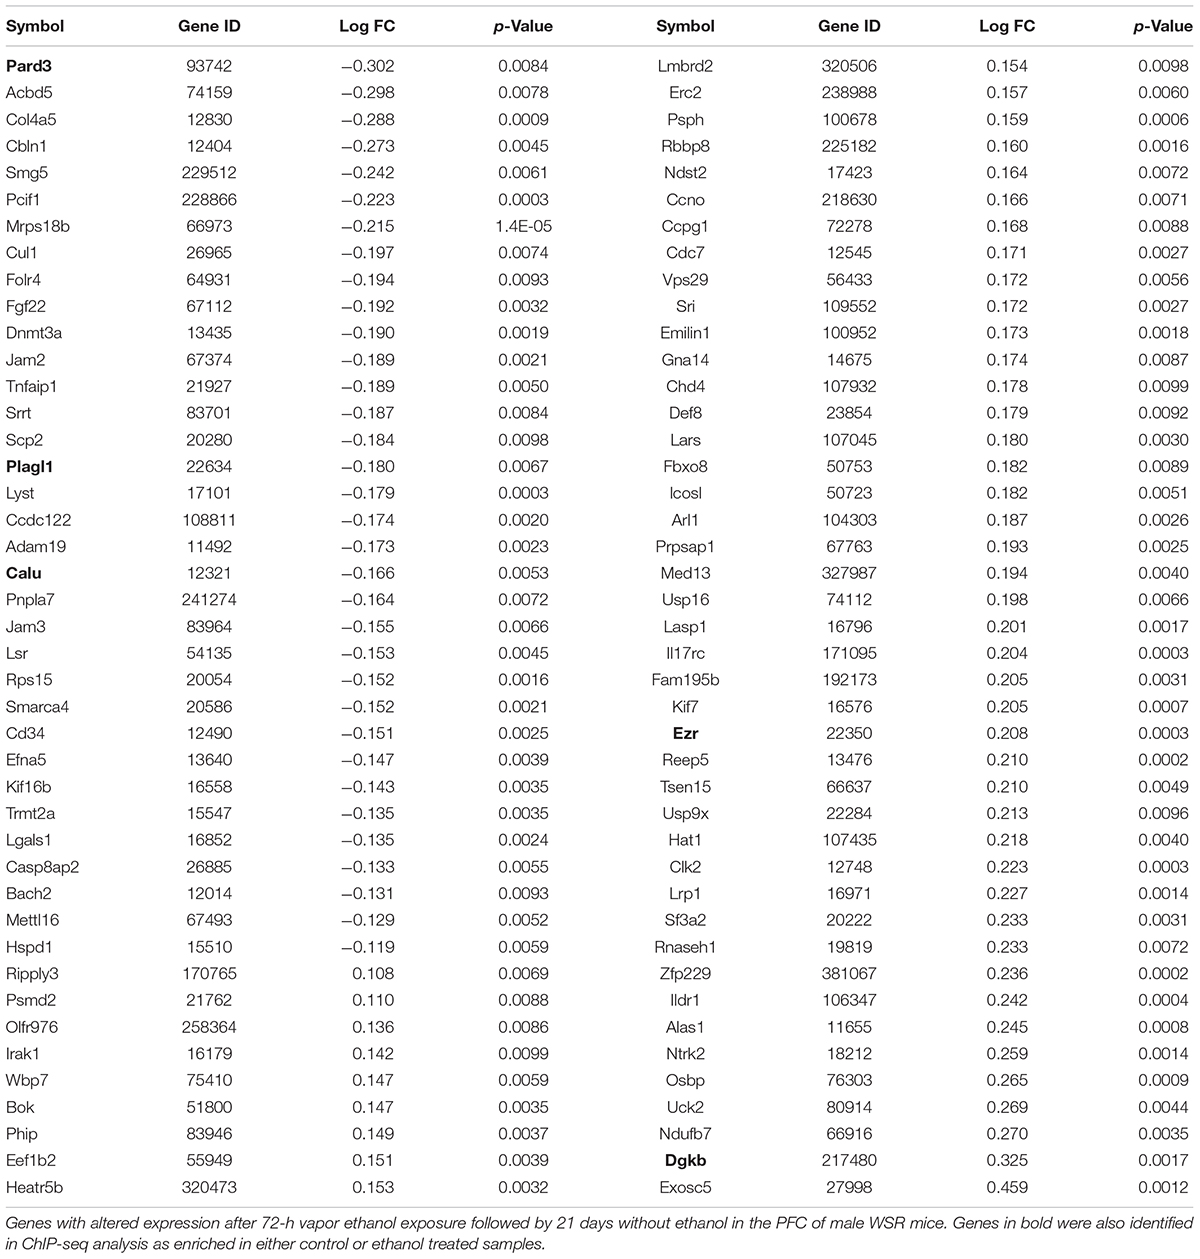
TABLE 4. Post-ethanol-induced gene expression differences in the PFC of male WSR mice.
Validation Experiments
We validated some of the changes observed in H3K4me3 and/or H3K27me3 analysis using ChIP followed by qPCR analysis of immunoprecipitated DNA in four additional samples per condition. Furthermore, we used qRT-PCR to validate differential expression detected by microarray and measure RNA expression of two genes (Alk and Camk2a) not present in the microarray platform but displaying H3K4me3 and/or H3K27me3 changes by ChIP-seq.
The five genes selected for validation were: Alk, Wnt5a, Camk2a, Ezr, and Dgkb. Alk was selected for validation as several previous studies have implicated this gene in modulating alcohol-drinking behavior (Heberlein et al., 2010; Lasek et al., 2011; Dutton et al., 2017); Wnt5a, Camk2a, and Ezr were selected for validation because components of the “Proteoglycans in Cancer” pathway identified as significantly altered by ethanol withdrawal by KEGG pathway analysis of our ChIP-seq results (Figure 4). In addition, Wnt5 displayed a concordant increase in H3K27me3 and decrease in H3K4me3 while Ezr and Dgkb displayed a concordant increase in H3K4me3 and in gene expression (Table 4).
We performed ChIP-qPCR for two regions of the Alk gene showing H3K27me3 differential peaks (region 1 at 538 kb downstream from the TSS and region 2 located 520 kb upstream of the TSS) but only found a significant difference for one of the regions (Figure 5A, left and middle). Consistent with the presence of the repressive mark, qRT-PCR revealed that Alk expression is reduced by ethanol withdrawal (Figure 5A, right). The ChIP-qPCR results of Wnt5a confirmed the ChIP-seq results, displaying increased H3K27me3 and decreased H3K4me3 (Figure 5B, left and middle) and its expression was decreased by ethanol, in agreement with its chromatin state (Figure 5B, right). In agreement with the ChIP-seq results, we observed a decrease in Camk2a H3K4me3, associated with a decrease in Camk2a gene expression measured by qRT-PCR (Figure 5C). Finally, we validated the increase in H3K4me3 in the Ezr and Dgkb genes associated with increased expression (Figures 5D,E), in agreement with ChIP-seq and miocroarray results.
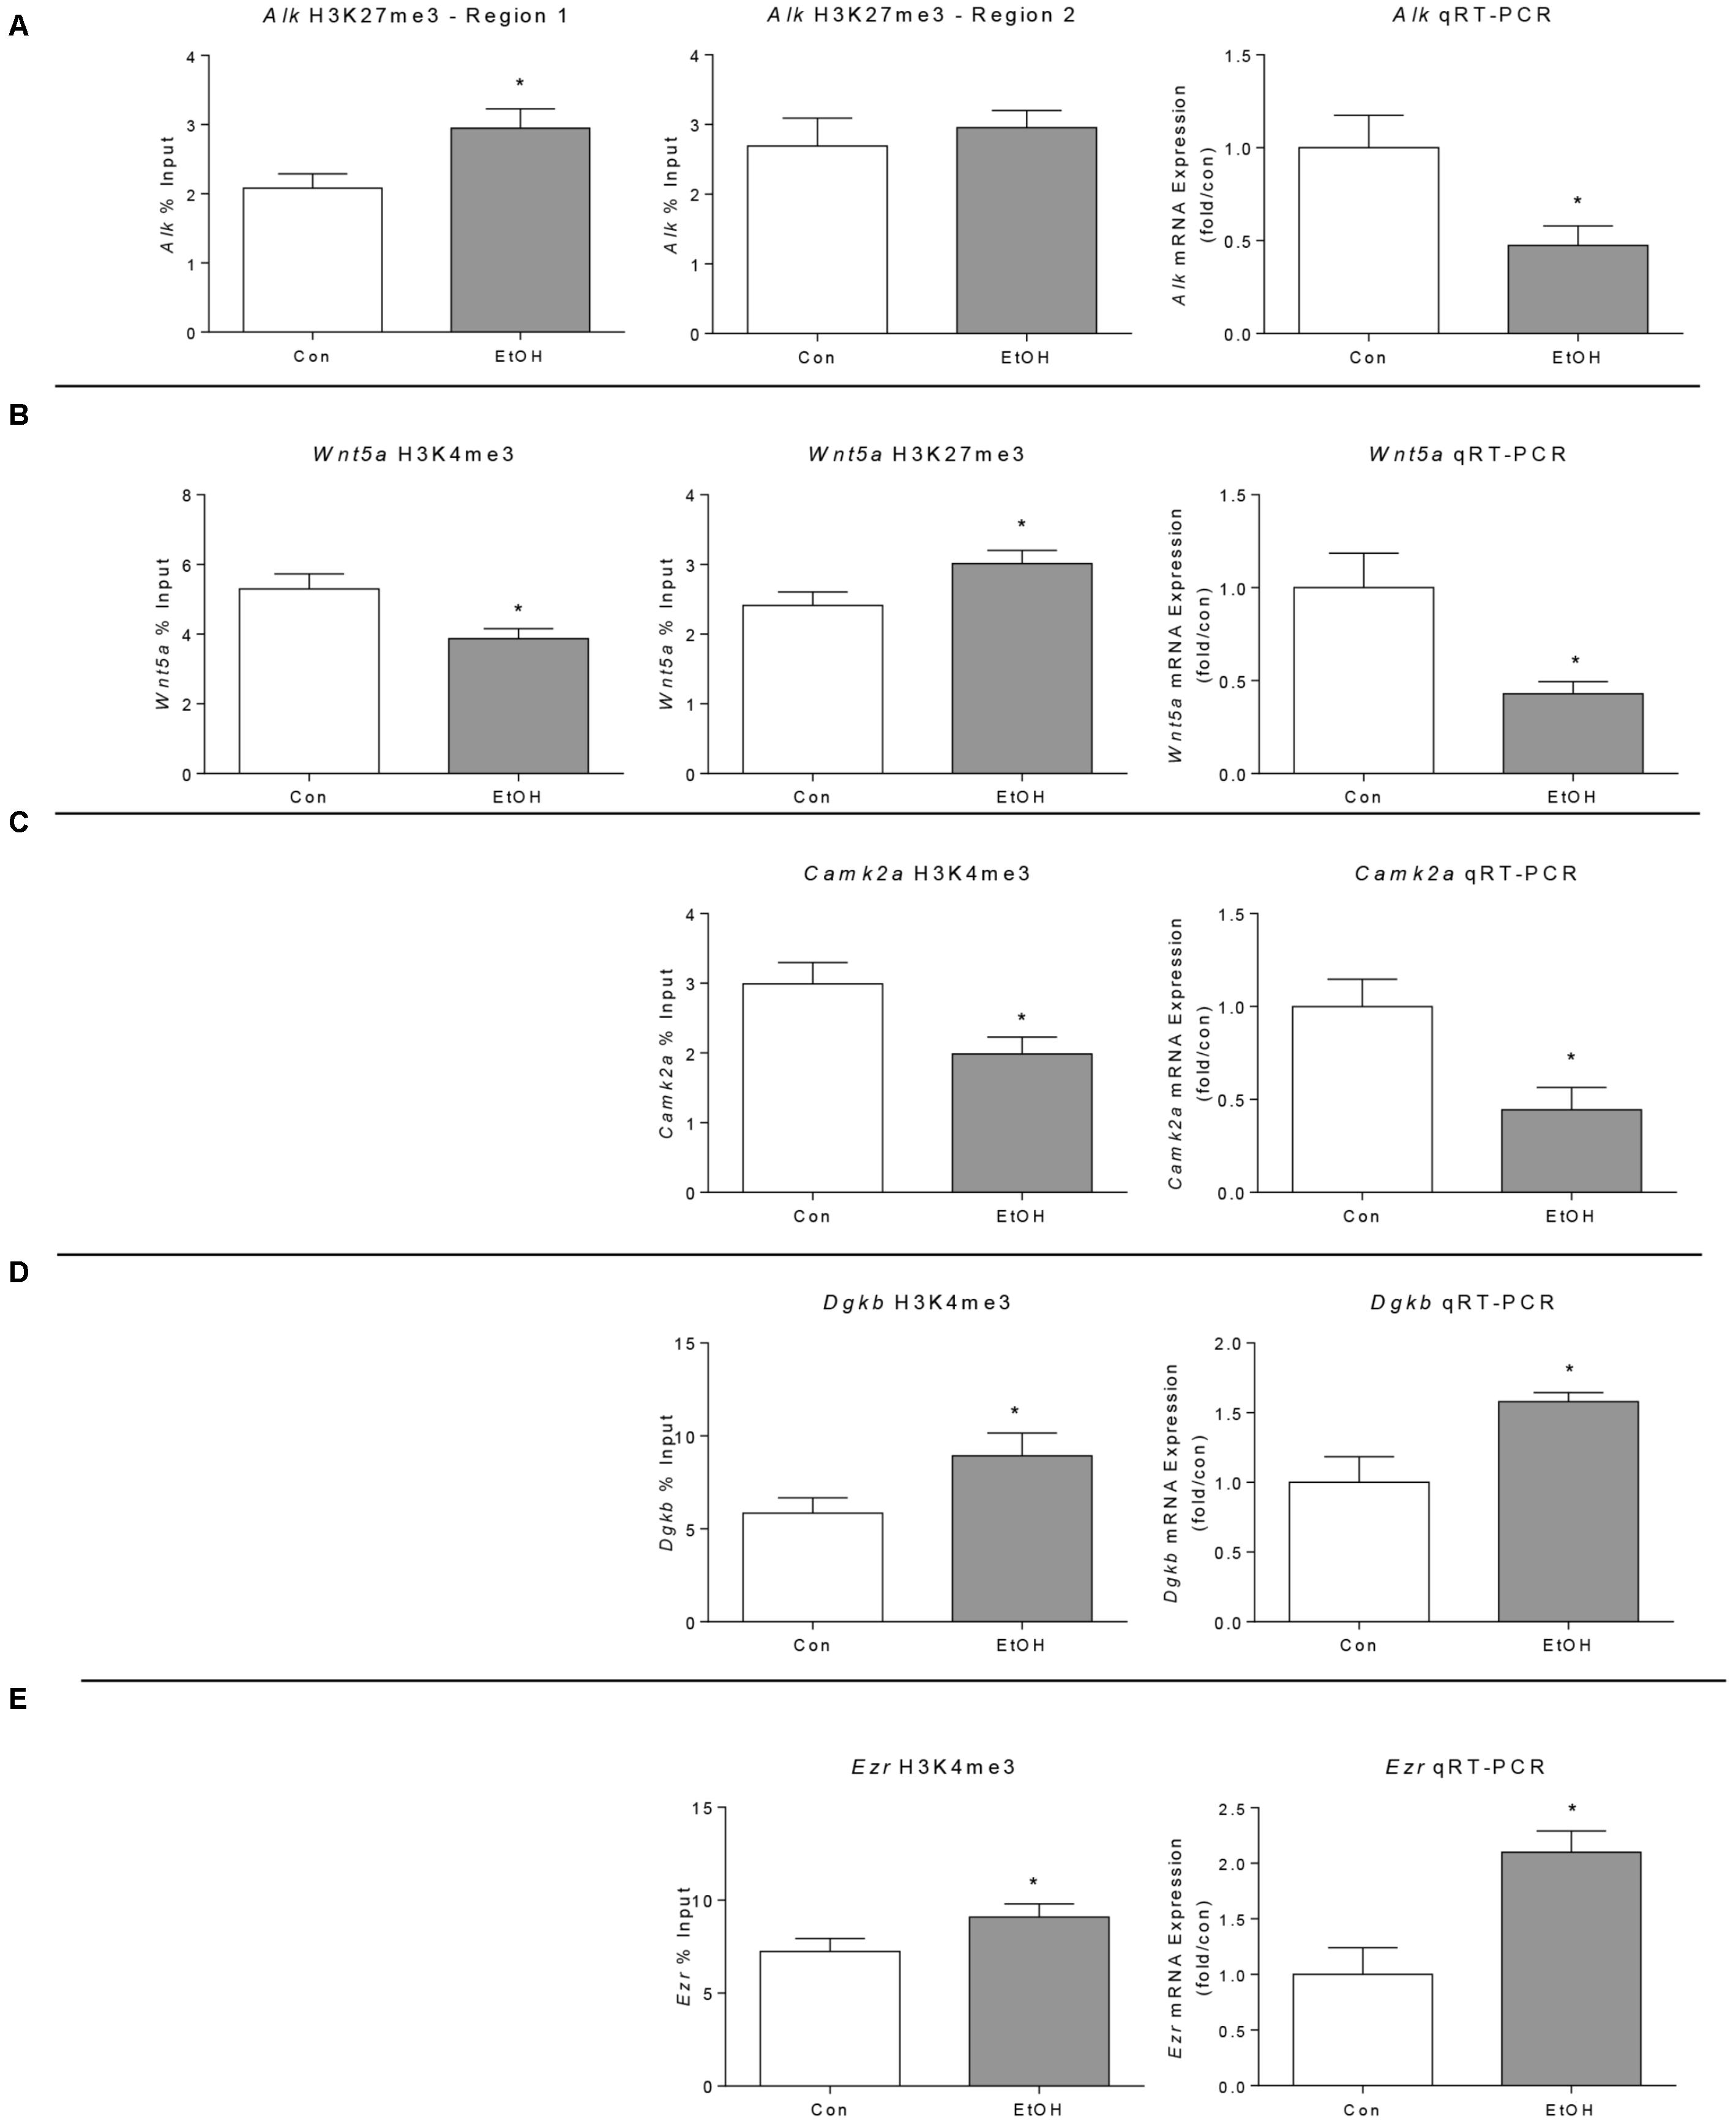
FIGURE 5. Validation of selected ChIP-seq and microarray results in the prefrontal cortex of WSR male rats 21 days after ethanol exposure by ChIP and qPCR analyses. (A) Alk genomic region 1 was significantly enriched for H3K27me3 in ethanol samples but region 2 was not significantly enriched. Alk gene expression was down-regulated by ethanol exposure as predicted by the H3K27me3 ChIP-seq analysis (Alk was not present in the microarray platform used in this study). (B) Wnt5a H3K4me3 was significantly decreased and H3K27me3 was significantly increased by ChIP-qPCR, in agreement with the ChIP-seq findings. In addition, expression analysis showed decreased Wnt5a expression. (C) Camk2a H3K4me3 was reduced by alcohol confirming ChIP-seq results; in agreement with this modification, its expression was also reduced (Camk2a was not present in the microarray platform used in this study). (D) Dgkb H3K4me3 and gene expression were increased in alcohol withdrawal samples analyzed by ChIP-qPCR and qPCR respectively, confirming the ChIP-seq and microarray results. (E) Ezr H3K4me3 and gene expression were increased in alcohol withdrawal samples analyzed by ChIP-qPCR and qPCR respectively, confirming the ChIP-seq and microarray results. ∗p < 0.05 by Student’s t-test.
Discussion
The current study examined stable changes in H3K4me3 and H3K27me3 following protracted withdrawal from ethanol. We performed ChIP-seq experiments in the prefrontal cortex of animals that 21 days previously had been exposed to ethanol. We found 445 H3K4me3 peaks and 771 H3K27me3 peaks that differed between control and ethanol treated mice, indicating persistent changes in chromatin state 21 days following high dose ethanol treatment. In particular, we observed that 64% of the H3K4me3 peaks that differed between the treatment group and the controls were reduced while 85% of the H3K27me3 peaks were increased, indicating a global repression of gene expression. Three genes showed simultaneous reduction of H3K4me3 and appearance of H3K27me3 in the ethanol-withdrawn samples: Trp63, Wnt5a, and Lhfpl3. We also found that five genes that were differentially expressed in our microarray analysis also displayed changes in H3K4me3 or H3K27me3 (Tables 1, 4). All changes in expression were in the direction that would be predicted based on the histone modifications.
We also compared changes in H3K4me3 and H3K27me3 to prior studies that examined gene expression and, interestingly, found that 52% (159 genes) of our differentially tri-methylated H3K4 and 40% (98 genes) of our differentially tri-methylated H3K27 genes have been previously identified as regulated by ethanol (Ponomarev et al., 2012; Wilhelm et al., 2014; Farris et al., 2015; Smith et al., 2016; van der Vaart et al., 2017). For example, we find H3K27me3 peaks following treatment in Glial cell line-derived neurotrophic factor (Gdnf) and Anaplastic lymphoma kinase (Alk) genes, and increased H3K4me3 peaks in the ethanol samples at the Glutamate Receptor, Ionotropic, AMPA 1 (Gria1) gene. These genes have been reported to be dysregulated by ethanol exposure (Carnicella et al., 2009; Heberlein et al., 2010; Lasek et al., 2011; Wolen et al., 2012; Reynolds et al., 2015; Dutton et al., 2017). With regard to H3K4me3 analysis, there is 0.004% chance of observing this level of overlap with the literature findings by chance using a hypergeometric test, suggesting a high level of correlation between H3K4me3 and gene expression. Notably, this overlap is despite myriad different models and ethanol exposure paradigms used in these prior studies. For example, the Ponomarev et al. (2012) and Farris et al. (2015) studies were conducted using human post-mortem samples, while Smith et al. (2016) used mice exposed to chronic intermittent ethanol exposure and measured gene expression 0 h, 8 h, 72 h, and 7 days post-treatment. On the other hand, we found that there is a high chance of randomly observing the level of overlap seen in the H3K27me3 analysis (58%).
We found that “proteoglycans in cancer” and “calcium signaling pathways” emerged as networks affected by ethanol during protracted withdrawal in the ChIP-seq analysis of H3K4me3 and H3K27me3, respectively. Ethanol and its metabolites, such as acetaldehyde have been shown to interfere with the synthesis, stability, and degradation of glycoconjugates, including proteoglycans in the brain and periphery (Waszkiewicz et al., 2012). Proteoglycans serve essential roles in the brain as part of the extracellular matrix (ECM). Most of the cells in the brain secrete ECM proteins, which provide structural support but can also activate or inhibit cell signaling involved in neuronal plasticity. The ECM can be divided into three main compartments: the basement membrane, the neural interstitial matrix, and perineuronal nets (PNs) (Lau et al., 2013; Lasek, 2016). The basement membrane is a component of the blood brain barrier, and the interstitial matrix and PNs help stabilize neural circuits and diffusion rates of membrane receptors, neurotransmitters, and ions (Celio et al., 1998; Yamaguchi, 2000; Pizzorusso et al., 2002; Gogolla et al., 2009; Dityatev et al., 2010; Gundelfinger et al., 2010; McRae and Porter, 2012). Several recent studies have indicated an important role for ECM factors in alcoholism (Zhang et al., 2014; Lasek, 2016).
Prior to the current study the status of ECM components and regulatory factors during protracted ethanol withdrawal were not well characterized. In the current study, we found Wnt5a, Wnt1, and Grb2, and integrin protein Itgb5 had histone modifications consistent with reduced gene expression. WNT signaling pathway is of particular interest considering the important role it plays in neuritogenesis (Ille and Sommer, 2005). In relation to the ECM, WNT1 has been shown to positively regulate a key component of PNs, aggrecan, in human adipose stem cell culture (Wang and Fawcett, 2012; Luo et al., 2013). In accord with an increase in H3K27me3 at Wnt5a reported here, ethanol treatment of neural stem cells reduced Wnt5a expression (Vangipuram and Lyman, 2012; Mandal et al., 2015a). WNT5A has been shown to induce the expression of the γ2 subunit of laminin, an important ECM protein in the brain parenchyma and in the epithelial basement membrane (Yamamoto et al., 2009). On the other hand, WNT1 and WNT5A promote the expression of enzymes that degrade the ECM, such as matrix metalloproteinases (MMPs) (Wu et al., 2007; Huang et al., 2017). The epidermal growth factor receptor adapter protein GRB2 also induces MMP expression (Crampton et al., 2009). In addition, we found an increase in H3K4me3 at the Mapk14 gene. MAPK14 promotes interstitial matrix component fibronectin mRNA expression in hepatic stem cells (Gu et al., 2016). Prior studies indicated that acute or chronic ethanol, for the most part, promote ECM degradation (Guizzetti et al., 2010; Giordano et al., 2011), in part perhaps due to increases in MMP-9 activity (Wright et al., 2003). A reduction of Wnt and Grb2 expression, together with increased Mapk14, as indicated by histone modifications found here, would be consistent with the notion that protracted ethanol withdrawal constitutes a period of ECM repair and growth.
Calcium signaling emerged as an overrepresented pathway in our pathway analyses of H3K4me3 and H3K27me3. Blocking certain types of calcium channel signaling has been shown to reduce rodent ethanol consumption (De Beun et al., 1996; Walter and Messing, 1999). In an ethanol exposure paradigm similar to the one used in this study in which rats were exposed to intermittent ethanol and their prefrontal cortex was analyzed 21 days after the last exposure, ion channels, including those that influence neurotransmitter release through effects on membrane potentials and calcium flux, emerged as one of the top GO categories in a miRNA and a DNA methylation study (Tapocik et al., 2013; Barbier et al., 2015). Calcium signaling also emerged as an important pathway following maternal binge-like ethanol doses in embryonic day 18 fetuses in a microarray study (Mandal et al., 2015b). Our results therefore further indicate an important role for calcium signaling in AUD, and suggest epigenetic mechanisms may encode persisting alterations in this pathway.
Some prior studies have examined H3K4me3 and H3K27me3 in relation to ethanol intake. Similar to our results, these studies have indicated that protracted withdrawal from ethanol produces global reductions in H3K4me3 levels (Govorko et al., 2012; Bekdash et al., 2013), although in these studies exposure was done in utero and measurements were done in the adult brain. In neonatal mice ethanol was found to increase H3K27me2 levels between 4 and 24 h following treatment (Subbanna et al., 2013). In contrast to our results, one study found that early post-natal ethanol exposure increased H3K4me3 and decreased H3K27me3 at adulthood (Chater-Diehl et al., 2016), and another reported a global increase in H3K4me3 6 h following a single ethanol exposure in adult mice (Finegersh and Homanics, 2014). Additionally, H3K4me3 levels were increased in postmortem human brain samples of subjects with alcoholism (Ponomarev et al., 2012). In light of these previous studies, our results suggest that protracted withdrawal is a unique state differing from controls, ethanol intoxication, and acute withdrawal, in which H3K4me3 remains low and H3K27me3 is high following high-dose ethanol exposure. Our results help clarify the dynamic changes in histone methylation in adulthood caused by ethanol as a function of time after exposure.
We found that differences in H3K4me3 and H3K27me3 in many cases did not lead to differences in gene expression. However, all changes in expression that did occur were in the direction that would be predicted based on the type(s) of chromatin modifications. For instance, we found two genes (Pard3 and Plagl1) with both an H3K27me3 peak in the ethanol-exposed mice and a decrease in expression based on microarray analysis. Moreover, one gene (Calu) showed a reduction in H3K4me3 and a decrease in mRNA expression, and two genes (Ezr and Dgkb) showed an increase in H3K4me3 and mRNA expression. In addition, we decided to validate H3K27me3 and H3K4me3 peaks identified by ChIP-seq in Alk and Camk2a genes, respectively, and because these two genes were not included in the microarray, we carried out qRT-PCR analysis and found a decreased expression of both genes, as expected by the increased H3K27me3 in Alk and the decreased H3K4me3 in Camk2a. One reason for the lack of overlap was a methodological limitation of our study as 51% of the genes in which there were H3K4me3 differences and 82% of the genes in which there were H3K27me3 differences were not present in the microarray platform used. A second reason may be inherent to the nature of the relationship between histone modifications and gene expression. In fact, a lack on concordance between H3K4me3 or H3K27me3 and gene expression has been reported by others (Zhou et al., 2011; Chater-Diehl et al., 2016). Specifically, Henikoff and Shilatifard (2011) argued that histone modifications reflect rather than drive transcriptional activity. This explanation is supported by observations that global loss of H3K4me3 does not cause an overall decline in gene expression. In addition, H3K4me3 is not required for transcription in in vitro models. Also, there are many instances in which H3K4me3 levels peak after gene expression has already begun (Pavri et al., 2006; Borde et al., 2009; Clouaire et al., 2012; Kuang et al., 2014). Based on these observations there is evidence that the function of some histone marks is to stabilize gene expression over the long term. Certain histone modifications may mark genes for faster or slower induction of gene expression upon re-exposure to a stimulus or at genes that require frequent or infrequent reactivation (Muramoto et al., 2010; Ding et al., 2012; Mosesson et al., 2014). Therefore, the lack of overlap between histone modifications and gene expression reported here is in fact an interesting observation in itself and its further investigation may contribute to the understanding of the role of histone modifications in gene expression.
Conclusion
Ours is the first study to examine enduring epigenetic changes following protracted withdrawal in adult mice. These results indicate that even in the fully mature brain prior heavy ethanol exposure can produce enduring changes in chromatin structure. Our results indicate an overall reduction in H3K4me3 and increase in H3K27me3. Several of the genes affected by these changes have been previously implicated in AUD. Finally, our results strongly point to alterations in proteoglycans and calcium channel signaling as persisting changes following ethanol exposure. Roles for ECM-related factors, such as proteoglycans, and calcium signaling in AUD have recently gained prominence due to several recent reports.
Data Availability Statement
The datasets generated for this study can be found in the Sequence Read Archive (SRP156323) and the Gene Expression Omnibus (GSE117925).
Author Contributions
MG and JH designed the study. DG, JH, NL, LC, JC, and MG analyzed the data and/or interpreted the results. JC developed the mouse strain and provided the expertise related to ethanol administration. JH prepared ChIP samples. NL and LC performed the initial sequencing data analysis. DG and JH performed the downstream pathway analyses. DG, JH, and MG wrote the manuscript. All authors reviewed the manuscript.
Funding
This work was supported by the Department of Veterans Affairs Merit Review Awards BX001819 (MG) and BX000313 (JC) and BX004091 (DG), National Institutes of Health (R01AA021468), (R01AA022948) (MG), (R01AA025035) (DG), R24AA020245, U01AA013519 (JC), and National Library of Medicine (LM007088) (NL).
Conflict of Interest Statement
The authors declare that the research was conducted in the absence of any commercial or financial relationships that could be construed as a potential conflict of interest.
Acknowledgments
We thank the OHSU ExaCloud Cluster Computational Resource, which allowed us to perform the intensive large-scale data workflows. Short read sequencing assays (ChIP-seq analysis) were performed by the OHSU Massive Parallel Sequencing Shared Resource. The contents do not represent the views of the United States Department of Veterans Affairs or the United States Government.
Supplementary Material
The Supplementary Material for this article can be found online at: https://www.frontiersin.org/articles/10.3389/fgene.2018.00346/full#supplementary-material
References
Barbier, E., Tapocik, J. D., Juergens, N., Pitcairn, C., Borich, A., Schank, J. R., et al. (2015). DNA methylation in the medial prefrontal cortex regulates alcohol-induced behavior and plasticity. J. Neurosci. 35, 6153–6164. doi: 10.1523/JNEUROSCI.4571-14.2015
Beadles-Bohling, A. S., and Wiren, K. M. (2006). Anticonvulsive effects of kappa-opioid receptor modulation in an animal model of ethanol withdrawal. Genes Brain Behav. 5, 483–496. doi: 10.1111/j.1601-183X.2005.00200.x
Becker, H. C. (2014). “Alcohol dependence, withdrawal and relapse,” in Neurobiology of Alcohol Dependence, eds A. B. C. Noronha, C. Cui, R. A. Harris, and J. C. Crabbe (San Diego, CA: Academic Press), 337–410.
Bekdash, R. A., Zhang, C., and Sarkar, D. K. (2013). Gestational choline supplementation normalized fetal alcohol-induced alterations in histone modifications, DNA methylation, and proopiomelanocortin (POMC) gene expression in beta-endorphin-producing POMC neurons of the hypothalamus. Alcohol. Clin. Exp. Res. 37, 1133–1142. doi: 10.1111/acer.12082
Bolger, A. M., Lohse, M., and Usadel, B. (2014). Trimmomatic: a flexible trimmer for Illumina sequence data. Bioinformatics 30, 2114–2120. doi: 10.1093/bioinformatics/btu170
Borde, V., Robine, N., Lin, W., Bonfils, S., Geli, V., and Nicolas, A. (2009). Histone H3 lysine 4 trimethylation marks meiotic recombination initiation sites. EMBO J. 28, 99–111. doi: 10.1038/emboj.2008.257
Carnicella, S., Amamoto, R., and Ron, D. (2009). Excessive alcohol consumption is blocked by glial cell line-derived neurotrophic factor. Alcohol 43, 35–43. doi: 10.1016/j.alcohol.2008.12.001
Celio, M. R., Spreafico, R., De Biasi, S., and Vitellaro-Zuccarello, L. (1998). Perineuronal nets: past and present. Trends Neurosci. 21, 510–515. doi: 10.1016/S0166-2236(98)01298-3
Chandler, L. J., Newsom, H., Sumners, C., and Crews, F. (1993). Chronic ethanol exposure potentiates NMDA excitotoxicity in cerebral cortical neurons. J. Neurochem. 60, 1578–1581. doi: 10.1111/j.1471-4159.1993.tb03326.x
Chater-Diehl, E. J., Laufer, B. I., Castellani, C. A., Alberry, B. L., and Singh, S. M. (2016). Alteration of gene expression, DNA methylation, and histone methylation in free radical scavenging networks in adult mouse hippocampus following fetal alcohol exposure. PLoS One 11:e0154836. doi: 10.1371/journal.pone.0154836
Chen, T., and Dent, S. Y. (2014). Chromatin modifiers and remodellers: regulators of cellular differentiation. Nat. Rev. Genet. 15, 93–106. doi: 10.1038/nrg3607
Clouaire, T., Webb, S., Skene, P., Illingworth, R., Kerr, A., Andrews, R., et al. (2012). Cfp1 integrates both CpG content and gene activity for accurate H3K4me3 deposition in embryonic stem cells. Genes Dev. 26, 1714–1728. doi: 10.1101/gad.194209.112
Commerford, S. L., Carsten, A. L., and Cronkite, E. P. (1982). Histone turnover within nonproliferating cells. Proc. Natl. Acad. Sci. U.S.A. 79, 1163–1165. doi: 10.1073/pnas.79.4.1163
Consortium, E. P. (2012). An integrated encyclopedia of DNA elements in the human genome. Nature 489, 57–74. doi: 10.1038/nature11247
Crabbe, J. C. (2014). “Use of animal models of alcohol-related behavior,” in Alcohol and the Nervous System, eds E. V. Sullivan and A. Pfefferbaum (Cambridge, MA: Elsevier), 71–86.
Crabbe, J. C., and Kosobud, A. (1986). Sensitivity and tolerance to ethanol in mice bred to be genetically prone or resistant to ethanol withdrawal seizures. J. Pharmacol. Exp. Ther. 239, 327–333.
Crampton, S. P., Wu, B., Park, E. J., Kim, J. H., Solomon, C., Waterman, M. L., et al. (2009). Integration of the beta-catenin-dependent Wnt pathway with integrin signaling through the adaptor molecule Grb2. PLoS One 4:e7841. doi: 10.1371/journal.pone.0007841
D’Addario, C., Caputi, F. F., Ekstrom, T. J., Di Benedetto, M., Maccarrone, M., Romualdi, P., et al. (2013). Ethanol induces epigenetic modulation of prodynorphin and pronociceptin gene expression in the rat amygdala complex. J. Mol. Neurosci. 49, 312–319. doi: 10.1007/s12031-012-9829-y
De Beun, R., Schneider, R., Klein, A., Lohmann, A., and De Vry, J. (1996). Effects of nimodipine and other calcium channel antagonists in alcohol-preferring AA rats. Alcohol 13, 263–271. doi: 10.1016/0741-8329(95)02054-3
Ding, Y., Fromm, M., and Avramova, Z. (2012). Multiple exposures to drought ’train’ transcriptional responses in Arabidopsis. Nat. Commun. 3:740. doi: 10.1038/ncomms1732
Dityatev, A., Schachner, M., and Sonderegger, P. (2010). The dual role of the extracellular matrix in synaptic plasticity and homeostasis. Nat. Rev. Neurosci. 11, 735–746. doi: 10.1038/nrn2898
Dutton, J. W. III, Chen, H., You, C., Brodie, M. S., and Lasek, A. W. (2017). Anaplastic lymphoma kinase regulates binge-like drinking and dopamine receptor sensitivity in the ventral tegmental area. Addict. Biol. 22, 665–678. doi: 10.1111/adb.12358
Farris, S. P., Harris, R. A., and Ponomarev, I. (2015). Epigenetic modulation of brain gene networks for cocaine and alcohol abuse. Front. Neurosci. 9:176. doi: 10.3389/fnins.2015.00176
Feng, J., Liu, T., Qin, B., Zhang, Y., and Liu, X. S. (2012). Identifying ChIP-seq enrichment using MACS. Nat. Protoc. 7, 1728–1740. doi: 10.1038/nprot.2012.101
Finegersh, A., and Homanics, G. E. (2014). Acute ethanol alters multiple histone modifications at model gene promoters in the cerebral cortex. Alcohol. Clin. Exp. Res. 38, 1865–1873. doi: 10.1111/acer.12465
Friedman, H. J. (1980). “Assessment of physical dependence on and withdrawal from ethanol in animals,” in Alcohol Tolerance and Dependence, eds H. Rigter and J. C. Crabbe (Amsterdam, NL: Elsevier), 93–121.
Gavin, D. P., Kusumo, H., Zhang, H., Guidotti, A., and Pandey, S. C. (2016). Role of growth arrest and DNA damage-inducible, beta in alcohol-drinking behaviors. Alcohol. Clin. Exp. Res. 40, 263–272. doi: 10.1111/acer.12965
Giordano, G., Guizzetti, M., Dao, K., Mattison, H. A., and Costa, L. G. (2011). Ethanol impairs muscarinic receptor-induced neuritogenesis in rat hippocampal slices: role of astrocytes and extracellular matrix proteins. Biochem. Pharmacol. 82, 1792–1799. doi: 10.1016/j.bcp.2011.08.014
Gogolla, N., Caroni, P., Luthi, A., and Herry, C. (2009). Perineuronal nets protect fear memories from erasure. Science 325, 1258–1261. doi: 10.1126/science.1174146
Goldstein, D. B. (1972). Alcohol dependence produced in mice by inhalation of ethanol: grading the withdrawal reaction. Science 172, 288–290. doi: 10.1126/science.172.3980.288
Goldstein, D. B., and Pal, N. (1971). Relationship of alcohol dose to intensity of withdrawal signs in mice. J. Pharmacol. Exp. Ther. 180, 203–215.
Govorko, D., Bekdash, R. A., Zhang, C., and Sarkar, D. K. (2012). Male germline transmits fetal alcohol adverse effect on hypothalamic proopiomelanocortin gene across generations. Biol. Psychiatry 72, 378–388. doi: 10.1016/j.biopsych.2012.04.006
Gu, L., Tao, X., Xu, Y., Han, X., Qi, Y., Xu, L., et al. (2016). Dioscin alleviates BDL- and DMN-induced hepatic fibrosis via Sirt1/Nrf2-mediated inhibition of p38 MAPK pathway. Toxicol. Appl. Pharmacol. 292, 19–29. doi: 10.1016/j.taap.2015.12.024
Guenther, M. G., Levine, S. S., Boyer, L. A., Jaenisch, R., and Young, R. A. (2007). A chromatin landmark and transcription initiation at most promoters in human cells. Cell 130, 77–88. doi: 10.1016/j.cell.2007.05.042
Guizzetti, M., Moore, N. H., Giordano, G., Vandemark, K. L., and Costa, L. G. (2010). Ethanol inhibits neuritogenesis induced by astrocyte muscarinic receptors. Glia 58, 1395–1406. doi: 10.1002/glia.21015
Gundelfinger, E. D., Frischknecht, R., Choquet, D., and Heine, M. (2010). Converting juvenile into adult plasticity: a role for the brain’s extracellular matrix. Eur. J. Neurosci. 31, 2156–2165. doi: 10.1111/j.1460-9568.2010.07253.x
Hannon Lab, G. J. (2010). FASTX-Toolkit. Available at: http://hannonlab.cshl.edu/fastx_toolkit/index.html
Harper, C., and Matsumoto, I. (2005). Ethanol and brain damage. Curr. Opin. Pharmacol. 5, 73–78. doi: 10.1016/j.coph.2004.06.011
Hashimoto, J. G., Forquer, M. R., Tanchuck, M. A., Finn, D. A., and Wiren, K. M. (2011). Importance of genetic background for risk of relapse shown in altered prefrontal cortex gene expression during abstinence following chronic alcohol intoxication. Neuroscience 173, 57–75. doi: 10.1016/j.neuroscience.2010.11.006
Hashimoto, J. G., Gavin, D. P., Wiren, K. M., Crabbe, J. C., and Guizzetti, M. (2017). Prefrontal cortex expression of chromatin modifier genes in male WSP and WSR mice changes across ethanol dependence, withdrawal, and abstinence. Alcohol 60, 83–94. doi: 10.1016/j.alcohol.2017.01.010
Heberlein, A., Muschler, M., Wilhelm, J., Frieling, H., Lenz, B., Groschl, M., et al. (2010). BDNF and GDNF serum levels in alcohol-dependent patients during withdrawal. Prog. Neuropsychopharmacol. Biol. Psychiatry 34, 1060–1064. doi: 10.1016/j.pnpbp.2010.05.025
Henikoff, S., and Shilatifard, A. (2011). Histone modification: cause or cog? Trends Genet. 27, 389–396. doi: 10.1016/j.tig.2011.06.006
Huang, D. W., Sherman, B. T., and Lempicki, R. A. (2009). Systematic and integrative analysis of large gene lists using DAVID bioinformatics resources. Nat. Protoc. 4, 44–57. doi: 10.1038/nprot.2008.211
Huang, G., Chubinskaya, S., Liao, W., and Loeser, R. F. (2017). Wnt5a induces catabolic signaling and matrix metalloproteinase production in human articular chondrocytes. Osteoarthritis Cartilage 25, 1505–1515. doi: 10.1016/j.joca.2017.05.018
Ille, F., and Sommer, L. (2005). Wnt signaling: multiple functions in neural development. Cell. Mol. Life Sci. 62, 1100–1108. doi: 10.1007/s00018-005-4552-2
Kharchenko, P. V., Tolstorukov, M. Y., and Park, P. J. (2008). Design and analysis of ChIP-seq experiments for DNA-binding proteins. Nat. Biotechnol. 26,1351–1359. doi: 10.1038/nbt.1508
Kosobud, A., and Crabbe, J. C. (1986). Ethanol withdrawal in mice bred to be genetically prone or resistant to ethanol withdrawal seizures. J. Pharmacol. Exp. Ther. 238, 170–177.
Kuang, Z., Cai, L., Zhang, X., Ji, H., Tu, B. P., and Boeke, J. D. (2014). High-temporal-resolution view of transcription and chromatin states across distinct metabolic states in budding yeast. Nat. Struct. Mol. Biol. 21, 854–863. doi: 10.1038/nsmb.2881
Landt, S. G., Marinov, G. K., Kundaje, A., Kheradpour, P., Pauli, F., Batzoglou, S., et al. (2012). ChIP-seq guidelines and practices of the ENCODE and modENCODE consortia. Genome Res. 22, 1813–1831. doi: 10.1101/gr.136184.111
Lasek, A. W. (2016). Effects of ethanol on brain extracellular matrix: implications for alcohol use disorder. Alcohol. Clin. Exp. Res. 40, 2030–2042. doi: 10.1111/acer.13200
Lasek, A. W., Lim, J., Kliethermes, C. L., Berger, K. H., Joslyn, G., Brush, G., et al. (2011). An evolutionary conserved role for anaplastic lymphoma kinase in behavioral responses to ethanol. PLoS One 6:e22636. doi: 10.1371/journal.pone.0022636
Lau, L. W., Cua, R., Keough, M. B., Haylock-Jacobs, S., and Yong, V. W. (2013). Pathophysiology of the brain extracellular matrix: a new target for remyelination. Nat. Rev. Neurosci. 14, 722–729. doi: 10.1038/nrn3550
Leek, J. T., Johnson, W. E., Parker, H. S., Jaffe, A. E., and Storey, J. D. (2012). The sva package for removing batch effects and other unwanted variation in high-throughput experiments. Bioinformatics 28, 882–883. doi: 10.1093/bioinformatics/bts034
Li, H., Brown, B., Huang, H., and Bickel, P. (2011). Measuring reproducibility of high-throughput experiments. Ann. Appl. Stat. 5, 1752–1779. doi: 10.1214/11-AOAS466
Li, H., and Durbin, R. (2009). Fast and accurate short read alignment with Burrows-Wheeler transform. Bioinformatics 25, 1754–1760. doi: 10.1093/bioinformatics/btp324
Luo, S., Shi, Q., Zha, Z., Yao, P., Lin, H., Liu, N., et al. (2013). Inactivation of Wnt/beta-catenin signaling in human adipose-derived stem cells is necessary for chondrogenic differentiation and maintenance. Biomed. Pharmacother. 67, 819–824. doi: 10.1016/j.biopha.2013.03.008
Mandal, C., Park, J. H., Choi, M. R., Kim, S. H., Badejo, A. C., Chai, J. C., et al. (2015a). Transcriptomic study of mouse embryonic neural stem cell differentiation under ethanol treatment. Mol. Biol. Rep. 42, 1233–1239. doi: 10.1007/s11033-015-3862-1
Mandal, C., Park, K. S., Jung, K. H., and Chai, Y. G. (2015b). Ethanol-related alterations in gene expression patterns in the developing murine hippocampus. Acta Biochim. Biophys. Sin. 47, 581–587. doi: 10.1093/abbs/gmv050
McCarthy, D. J., and Smyth, G. K. (2009). Testing significance relative to a fold-change threshold is a TREAT. Bioinformatics 25, 765–771. doi: 10.1093/bioinformatics/btp053
McRae, P. A., and Porter, B. E. (2012). The perineuronal net component of the extracellular matrix in plasticity and epilepsy. Neurochem. Int. 61, 963–972. doi: 10.1016/j.neuint.2012.08.007
Metten, P., and Crabbe, J. C. (1996). “Dependence and withdrawal,” in Pharmacological Effects of Ethanol on the Nervous System, eds R. A. Deitrich and V. G. Erwin (Boca Ranton, FL: CRC Press), 269–290.
Moonat, S., Sakharkar, A. J., Zhang, H., Tang, L., and Pandey, S. C. (2013). Aberrant histone deacetylase2-mediated histone modifications and synaptic plasticity in the amygdala predisposes to anxiety and alcoholism. Biol. Psychiatry 73, 763–773. doi: 10.1016/j.biopsych.2013.01.012
Mosesson, Y., Voichek, Y., and Barkai, N. (2014). Divergence and selectivity of expression-coupled histone modifications in budding yeasts. PLoS One 9:e101538. doi: 10.1371/journal.pone.0101538
Muramoto, T., Muller, I., Thomas, G., Melvin, A., and Chubb, J. R. (2010). Methylation of H3K4 Is required for inheritance of active transcriptional states. Curr. Biol. 20, 397–406. doi: 10.1016/j.cub.2010.01.017
Nadon, N. L., Mohr, D., and Becker, K. G. (2005). National Institute on aging microarray facility–resources for gerontology research. J. Gerontol. A Biol. Sci. Med. Sci. 60, 413–415. doi: 10.1093/gerona/60.4.413
Olive, M. F. (2010). Pharmacotherapies for alcoholism: the old and the new. CNS Neurol. Disord. Drug Targets 9, 2–4. doi: 10.2174/187152710790966722
Pandey, S. C., Kyzar, E. J., and Zhang, H. (2017). Epigenetic basis of the dark side of alcohol addiction. Neuropharmacology 122, 74–84. doi: 10.1016/j.neuropharm.2017.02.002
Pandey, S. C., Ugale, R., Zhang, H., Tang, L., and Prakash, A. (2008). Brain chromatin remodeling: a novel mechanism of alcoholism. J. Neurosci. 28, 3729–3737. doi: 10.1523/JNEUROSCI.5731-07.2008
Pavri, R., Zhu, B., Li, G., Trojer, P., Mandal, S., Shilatifard, A., et al. (2006). Histone H2B monoubiquitination functions cooperatively with FACT to regulate elongation by RNA polymerase II. Cell 125, 703–717. doi: 10.1016/j.cell.2006.04.029
Pizzorusso, T., Medini, P., Berardi, N., Chierzi, S., Fawcett, J. W., and Maffei, L. (2002). Reactivation of ocular dominance plasticity in the adult visual cortex. Science 298, 1248–1251. doi: 10.1126/science.1072699
Ponomarev, I., Wang, S., Zhang, L., Harris, R. A., and Mayfield, R. D. (2012). Gene coexpression networks in human brain identify epigenetic modifications in alcohol dependence. J. Neurosci. 32, 1884–1897. doi: 10.1523/JNEUROSCI.3136-11.2012
Pruitt, K. D., Tatusova, T., and Maglott, D. R. (2005). NCBI Reference Sequence (RefSeq): a curated non-redundant sequence database of genomes, transcripts and proteins. Nucleic Acids Res. 33, D501–D504. doi: 10.1093/nar/gki025
Reynolds, P. M., Mueller, S. W., and Maclaren, R. (2015). A comparison of dexmedetomidine and placebo on the plasma concentrations of NGF, BDNF, GDNF, and epinephrine during severe alcohol withdrawal. Alcohol 49, 15–19. doi: 10.1016/j.alcohol.2014.11.006
Ritchie, M. E., Phipson, B., Wu, D., Hu, Y., Law, C. W., Shi, W., et al. (2015). limma powers differential expression analyses for RNA-sequencing and microarray studies. Nucleic Acids Res. 43:e47. doi: 10.1093/nar/gkv007
Robinson, M. D., Mccarthy, D. J., and Smyth, G. K. (2010). edgeR: a Bioconductor package for differential expression analysis of digital gene expression data. Bioinformatics 26, 139–140. doi: 10.1093/bioinformatics/btp616
Robison, A. J., and Nestler, E. J. (2011). Transcriptional and epigenetic mechanisms of addiction. Nat. Rev. Neurosci. 12, 623–637. doi: 10.1038/nrn3111
Rogers, J., Wiener, S. G., and Bloom, F. E. (1979). Long-term ethanol administration methods for rats: advantages of inhalation over intubation or liquid diets. Behav. Neural. Biol. 27, 466–486. doi: 10.1016/S0163-1047(79)92061-2
Sakharkar, A. J., Zhang, H., Tang, L., Shi, G., and Pandey, S. C. (2012). Histone deacetylases (HDAC)-induced histone modifications in the amygdala: a role in rapid tolerance to the anxiolytic effects of ethanol. Alcohol. Clin. Exp. Res. 36, 61–71. doi: 10.1111/j.1530-0277.2011.01581.x
Schubeler, D., Macalpine, D. M., Scalzo, D., Wirbelauer, C., Kooperberg, C., Van Leeuwen, F., et al. (2004). The histone modification pattern of active genes revealed through genome-wide chromatin analysis of a higher eukaryote. Genes Dev. 18, 1263–1271. doi: 10.1101/gad.1198204
Shannon, P., Markiel, A., Ozier, O., Baliga, N. S., Wang, J. T., Ramage, D., et al. (2003). Cytoscape: a software environment for integrated models of biomolecular interaction networks. Genome Res. 13, 2498–2504. doi: 10.1101/gr.1239303
Smith, M. L., Lopez, M. F., Archer, K. J., Wolen, A. R., Becker, H. C., and Miles, M. F. (2016). Time-course analysis of brain regional expression network responses to chronic intermittent ethanol and withdrawal: implications for mechanisms underlying excessive ethanol consumption. PLoS One 11:e0146257. doi: 10.1371/journal.pone.0146257
Stragier, E., Massart, R., Salery, M., Hamon, M., Geny, D., Martin, V., et al. (2015). Ethanol-induced epigenetic regulations at the Bdnf gene in C57BL/6J mice. Mol. Psychiatry 20, 405–412. doi: 10.1038/mp.2014.38
Strahl, B. D., Ohba, R., Cook, R. G., and Allis, C. D. (1999). Methylation of histone H3 at lysine 4 is highly conserved and correlates with transcriptionally active nuclei in Tetrahymena. Proc. Natl. Acad. Sci. U.S.A. 96, 14967–14972. doi: 10.1073/pnas.96.26.14967
Subbanna, S., Shivakumar, M., Umapathy, N. S., Saito, M., Mohan, P. S., Kumar, A., et al. (2013). G9a-mediated histone methylation regulates ethanol-induced neurodegeneration in the neonatal mouse brain. Neurobiol. Dis. 54, 475–485. doi: 10.1016/j.nbd.2013.01.022
Tapocik, J. D., Solomon, M., Flanigan, M., Meinhardt, M., Barbier, E., Schank, J. R., et al. (2013). Coordinated dysregulation of mRNAs and microRNAs in the rat medial prefrontal cortex following a history of alcohol dependence. Pharmacogenomics J. 13, 286–296. doi: 10.1038/tpj.2012.17
van der Vaart, A. D., Wolstenholme, J. T., Smith, M. L., Harris, G. M., Lopez, M. F., Wolen, A. R., et al. (2017). The allostatic impact of chronic ethanol on gene expression: a genetic analysis of chronic intermittent ethanol treatment in the BXD cohort. Alcohol 58, 93–106. doi: 10.1016/j.alcohol.2016.07.010
Vangipuram, S. D., and Lyman, W. D. (2012). Ethanol affects differentiation-related pathways and suppresses Wnt signaling protein expression in human neural stem cells. Alcohol. Clin. Exp. Res. 36, 788–797. doi: 10.1111/j.1530-0277.2011.01682.x
Wahlstrom, G. (1987). Ethanol exposure as inducer of stable voluntary ethanol drinking in the male rat. Drug Alcohol Depend. 20, 105–114. doi: 10.1016/0376-8716(87)90059-7
Walter, H. J., and Messing, R. O. (1999). Regulation of neuronal voltage-gated calcium channels by ethanol. Neurochem. Int. 35, 95–101. doi: 10.1016/S0197-0186(99)00050-9
Wang, D., and Fawcett, J. (2012). The perineuronal net and the control of CNS plasticity. Cell Tissue Res. 349, 147–160. doi: 10.1007/s00441-012-1375-y
Wang, X., Spandidos, A., Wang, H., and Seed, B. (2012). PrimerBank: a PCR primer database for quantitative gene expression analysis, 2012 update. Nucleic Acids Res. 40, D1144–D1149. doi: 10.1093/nar/gkr1013
Waszkiewicz, N., Szajda, S. D., Zalewska, A., Szulc, A., Kepka, A., Minarowska, A., et al. (2012). Alcohol abuse and glycoconjugate metabolism. Folia Histochem. Cytobiol. 50, 1–11. doi: 10.2478/18690
Wilhelm, C. J., Hashimoto, J. G., Roberts, M. L., Sonmez, M. K., and Wiren, K. M. (2014). Understanding the addiction cycle: a complex biology with distinct contributions of genotype vs. sex at each stage. Neuroscience 279, 168–186. doi: 10.1016/j.neuroscience.2014.08.041
Wiren, K. M., Hashimoto, J. G., Alele, P. E., Devaud, L. L., Price, K. L., Middaugh, L. D., et al. (2006). Impact of sex: determination of alcohol neuroadaptation and reinforcement. Alcohol. Clin. Exp. Res. 30, 233–242. doi: 10.1111/j.1530-0277.2006.00032.x
Wolen, A. R., Phillips, C. A., Langston, M. A., Putman, A. H., Vorster, P. J., Bruce, N. A., et al. (2012). Genetic dissection of acute ethanol responsive gene networks in prefrontal cortex: functional and mechanistic implications. PLoS One 7:e33575. doi: 10.1371/journal.pone.0033575
Wright, J. W., Masino, A. J., Reichert, J. R., Turner, G. D., Meighan, S. E., Meighan, P. C., et al. (2003). Ethanol-induced impairment of spatial memory and brain matrix metalloproteinases. Brain Res. 963, 252–261. doi: 10.1016/S0006-8993(02)04036-2
Wu, B., Crampton, S. P., and Hughes, C. C. (2007). Wnt signaling induces matrix metalloproteinase expression and regulates T cell transmigration. Immunity 26, 227–239. doi: 10.1016/j.immuni.2006.12.007
Yamaguchi, Y. (2000). Lecticans: organizers of the brain extracellular matrix. Cell. Mol. Life Sci. 57, 276–289. doi: 10.1007/PL00000690
Yamamoto, H., Kitadai, Y., Yamamoto, H., Oue, N., Ohdan, H., Yasui, W., et al. (2009). Laminin gamma2 mediates Wnt5a-induced invasion of gastric cancer cells. Gastroenterology 137, e241–e246. doi: 10.1053/j.gastro.2009.02.003
Ye, J., Coulouris, G., Zaretskaya, I., Cutcutache, I., Rozen, S., and Madden, T. L. (2012). Primer-BLAST: a tool to design target-specific primers for polymerase chain reaction. BMC Bioinformatics 13:134. doi: 10.1186/1471-2105-13-134
Zhang, X., Bhattacharyya, S., Kusumo, H., Goodlett, C. R., Tobacman, J. K., and Guizzetti, M. (2014). Arylsulfatase B modulates neurite outgrowth via astrocyte chondroitin-4-sulfate: dysregulation by ethanol. Glia 62, 259–271. doi: 10.1002/glia.22604
Zhang, Y., Liu, T., Meyer, C. A., Eeckhoute, J., Johnson, D. S., Bernstein, B. E., et al. (2008). Model-based analysis of ChIP-Seq (MACS). Genome Biol. 9:R137. doi: 10.1186/gb-2008-9-9-r137
Keywords: alcohol withdrawal, alcohol dependence, calcium signaling, ChIP-seq, histone methylation, proteoglycans
Citation: Gavin DP, Hashimoto JG, Lazar NH, Carbone L, Crabbe JC and Guizzetti M (2018) Stable Histone Methylation Changes at Proteoglycan Network Genes Following Ethanol Exposure. Front. Genet. 9:346. doi: 10.3389/fgene.2018.00346
Received: 01 March 2018; Accepted: 09 August 2018;
Published: 30 August 2018.
Edited by:
Kristin Hamre, University of Tennessee Health Science Center, United StatesReviewed by:
Sarven Sabunciyan, Johns Hopkins University, United StatesRobert Philibert, University of Iowa, United States
Copyright © 2018 Gavin, Hashimoto, Lazar, Carbone, Crabbe and Guizzetti. This is an open-access article distributed under the terms of the Creative Commons Attribution License (CC BY). The use, distribution or reproduction in other forums is permitted, provided the original author(s) and the copyright owner(s) are credited and that the original publication in this journal is cited, in accordance with accepted academic practice. No use, distribution or reproduction is permitted which does not comply with these terms.
*Correspondence: Marina Guizzetti, Z3VpenpldHRAb2hzdS5lZHU=
†These authors have contributed equally to this work