 Wansheng Jiang1†
 Ying Qiu2,3†
 Xiaofu Pan1†Yuanwei Zhang1Xiaoai Wang1Yunyun Lv2,3
 Chao Bian2,3
 Jia Li3
 Xinxin You2,3Jieming Chen2,3Kunfeng Yang1Jinlong Yang4Chao Sun1Qian Liu1
 Le Cheng4*Junxing Yang1*
 Qiong Shi2,3*
- 1State Key Laboratory of Genetic Resources and Evolution, Kunming Institute of Zoology, Chinese Academy of Sciences, Kunming, China
- 2BGI Education Center, University of Chinese Academy of Sciences, Shenzhen, China
- 3Shenzhen Key Lab of Marine Genomics, Guangdong Provincial Key Lab of Molecular Breeding in Marine Economic Animals, BGI Academy of Marine Sciences, BGI Marine, BGI, Shenzhen, China
- 4BGI-Yunnan, BGI-Shenzhen, Kunming, China
A Yunnan-Guizhou Plateau fish, the Kanglang white minnow (Anabarilius grahami), is a typical “3E” (Endangered, Endemic, and Economic) species in China. Its distribution is limited to Fuxian Lake, the nation’s second deepest lake, with a significant local economic value but a drastically declining wild population. This species has been evaluated as VU (Vulnerable) in the China Species Red List. As one of the “Four Famous Fish” in Yunnan province, the artificial breeding has been achieved since 2003. It has not only re-established its wild natural populations by reintroduction of the artificial breeding stocks, but also brought a wide and popular utilization of this species to the local fish farms. A. grahami has become one of the main native aquaculture species in Yunnan province, and the artificial production has been emerging in steady growth each year. To promote the conservation and sustainable utilization of this fish, we initiated its whole genome sequencing project using an Illumina Hiseq2500 platform. The assembled genome size of A. grahami is 1.006 Gb, accounting for 98.63% of the estimated genome size (1.020 Gb), with contig N50 and scaffold N50 values of 26.4 kb and 4.41 Mb, respectively. Approximately about 50.38% of the genome was repetitive. A total of 25,520 protein-coding genes were subsequently predicted. A phylogenetic tree based on 4,580 single-copy genes from A. grahami and 18 other cyprinids revealed three well-supported subclades within the Cyprinidae. This is the first inter-subfamily relationship of cyprinids at genome level, providing a simple yet useful framework for understanding the traditional but popular subfamily classification systems. Interestingly, a further population demography of A. grahami uncovered a historical relationship between this fish and Fuxian Lake, suggesting that range expansion or shrinkage of the habitat has had a remarkable impact on the population size of endemic plateau fishes. Additionally, a total of 33,836 simple sequence repeats (SSR) markers were identified, and 11 loci were evaluated for a preliminary genetic diversity analysis in this study, thus providing another useful genetic resource for studying this “3E” species.
Introduction
The Yunnan-Guizhou Plateau (or Yungui Plateau) is a highland region primarily located in the Yunnan and Guizhou provinces in the southwest part of China. This mountain area harbors large numbers of plants and terrestrial vertebrates, and contains 4 of the 10 hotspot ecoregions in China (the Xishuangbanna area, and the Hengduan, Wumeng, and Wuling mountains, Tang et al., 2006). It also holds an abundance of aquatic species, as it encompasses the headwaters of many of the great rivers in Asia that originate on the Qinghai-Tibet Plateau (e.g., the Salween, Mekong and Yangtze rivers). As a consequence, Yunnan province possesses the greatest diversity of fishes in China, accounting for 40% of the nation’s freshwater fish species (Chen, 2013).
Most of the native fishes in Yunnan province are locally endemic. The Kanglang white minnow (Anabarilius grahami) is but one example. It is a cyprinoid fish with restricted distribution in Fuxian Lake, a typical Yunnan-Guizhou plateau lake and also the second deepest lake in China. The species is one of the “Four Famous Fish” in Yunnan that has a special value and popularity. Although it is a small-sized fish, it has long been the major economic fish species in Fuxian Lake, accounting for 70–80% of the natural fishery production before 1990s (Li et al., 2003a). This fish is historically famous because of its good taste and flavor – attribute to its special muscle nutrition compositions (Deng et al., 2013) – as well as some folkloric medicinal functions and in appealing to fishing cultures. Along with the long-term formation of Fuxian Lake, A. grahami has many special biological characters that were thought to be a result of adaptation of the fish to the lake (Yang, 1992). For instance, because of the limited food resources in the oligotrophic Fuxian Lake, it has a very low absolute fecundity (number of mature eggs: 2,175–3,840) relative to its sister species, the Anabarilius andersoni (13,971–15,770) in the adjacent Xinyun Lake (Yang, 1992). As a way of compensating, it has a long annual breeding period from March to October, and shows unusual spawning behaviors, such as a temporally regular interval (ca. 7 days) between two sequentially spawnings (Yang, 1992; Ma et al., 2008). It would also be an adaptation to the limited spawning sites that are only available at some cave or hill springs around the Fuxian Lake. In addition, the larvae and adults of A. grahami occupy distinct habitats, with the larvae and juveniles occurring in the shallow coastal regions and the adults in the middle and upper layers of open water (Yang, 1992; Ma et al., 2008). This seems to be a response to the limited food resources in the whole lake (Yang, 1994). As the second deepest lake of China, Fuxian Lake has a relatively broad niche in terms of water depth. Correspondingly, the adults of A. grahami can frequently be found in water depths down to 20 m, and may occasionally be seen as deep as 50 m (Yang, 1992). Thus A. grahami is unusual among other species of the Cultrinae, because most of them are thought to live in the upper to middle levels (probably less them 5 m) of shallow lakes or rivers (Chen, 1998). The spatial dichotomy strategy of A. grahami might be also a crucial reason enabling it to maintain the largest natural fish stocks in Fuxian Lake. However, all of the interesting biological questions on A. grahami are hypothetical, and have not been empirically explored.
In recent decades, however, the wild population of A. grahami has decreased sharply. It has been triggered by the introduction in 1982 of the exotic icefish, Neosalanx taihuensis. The annual production of A. grahami declined from about 400 tons before the 1990s, to 10.4 tons in the 1998, and finally to less than 1 ton in the early 2000s; while the annual production of N. taihuensis has increased since 1990s, from about 200 tons during the early colonized years (1986–1990) to an average of 1,554 tons during 1990–2004 (Xiong et al., 2006). Competitive disadvantage has been ascribed for the population decline of A. grahami, because the exotic N. taihuensis and the endemic A. grahami have significant food and space overlaps (Qin et al., 2007). However, other anthropogenic causes, such as overfishing of A. grahami, destruction of the spawning sites, and the collateral damage by catching N. taihuensis, should also be considered (Li et al., 2003a). At the same time, the low fecundity of A. grahami itself (Yang, 1992) might also make it vulnerable in the changing environment. The drastic population decline of A. grahami shifted it from an abundant economic species to an endangered fish. This valuable fish was evaluated as VU (vulnerable) in the China Species Red List in 2004 (Wang and Xie, 2004) and 2015 (Jiang et al., 2016), and among the threatened fishes of the world (Liu et al., 2009). Fortunately, artificial breeding was achieved in 2003 (Li et al., 2003b), and reintroduction of the breeding stocks has become almost the only way to re-establish its wild populations. However, the adaptability and sustainability of the re-established wild population, as well as the current genetic diversity (after serious population fluctuation) are unexplored areas that await evaluation; lack of effective genetic markers might be one reason for this situation. On the other hand, artificial breeding has also created the chance of aquaculture utilization of this valuable species. Although the artificial cultivation is still a small-scale operation, the annual production has gradually increased since 2005, and reached about 15 tons in 2014 from the fish farms around Fuxian Lake (Li, 2015). At present, A. grahami has been one of the main native aquaculture species in Yunnan province, and the utilization of this species in local aquaculture has been exhibiting in steady growth each year.
Anabarilius grahami is a typical species with “3E” (Endangered, Endemic, and Economic) status and priorities. We therefore initiated the whole genome sequencing (WGS) project of this valuable species. The WGS would promote the aspect of many biological and conservational enquiries, and also provide extensive opportunities for its utilization in aquaculture. Based on the WGS information, we also aimed to carry out three evolutionary and genetic applications in this study: (1) reconstruction of the inter-subfamily phylogenetic relationship within the Cyprinidae from a genomic view, (2) reconstruction of the demographic history of A. grahami along with the formation of Fuxian Lake, and (3) development of massive simple sequence repeats (SSR) markers for the future genetic evaluation of this “3E” plateau fish species.
Materials and Methods
Sample Preparation and Genome Sequencing
Samples of A. grahami were collected from artificial cultivated stocks in the Endangered Fish Conservation Center (EFCC) of the Kunming Institute of Zoology, Chinese Academy of Sciences (KIZ), Kunming, China. The research protocol and treatment of experimental fishes was reviewed and approved by the internal review board of KIZ (approval ID: 2015-SMKX026).
Genomic DNA was extracted from a pool of muscle tissue from two individuals. Three short paired-end (200, 500, and 800 bp) and four long paired-end (2, 5, 10, and 20 kb, respectively) sequencing libraries were constructed with the standard protocol provided by Illumina (San Diego, United States), and then sequenced on an Illumina Hiseq2500 platform. Low-quality and duplicated reads were filtered out through SOAPfilter (v2.2) software (Li R. et al., 2009).
For transcriptome-based prediction, RNA was extracted from four tissues (brain, liver, gonad and muscle) of the same two individuals. All the libraries were prepared using the Illumina TruSeq RNA sample preparation kit (San Diego, United States) and then sequenced by Illumina Hiseq4000.
Genome Assembly
The genome size was estimated using the 17-mer depth frequency distribution formula (Liu et al., 2013) as follows: G (Genome size) = k-mer_number/k-mer_depth, where k-mer_number is the total number of k-mer, and k-mer_depth indicates the peak frequency that is higher than others. The clean reads were used to construct contigs and original scaffolds by assembler, Platanus (v1.2.4, Kajitani et al., 2014) with default parameters. Subsequently, intra-scaffold gaps were filled using the reads of short-insert libraries by GapCloser 1.12 (Li R. et al., 2009). BUSCO (Benchmarking Universal Single-Copy Orthologs; v3.0.2, Simao et al., 2015) was employed to evaluate the completeness of achieved genome assembly.
Genome Annotation
We identified repetitive sequences using the following pipeline. At first, Tandem Repeats Finder (v4.07, Benson, 1999) was used to search tandem repeats in the genome assembly. Subsequently, we combined both homology-based and de novo predictions to identify transposable elements (TEs). We utilized RepeatMask (v1.323, Tarailo-Graovac and Chen, 2009) to detect known TEs against the Repbase TE library (release 21.01, Jurka et al., 2005) and RepeatProteinMask (v2.1) to identify the TE correlated proteins. Subsequently, we used LTR_FINDER (Xu and Wang, 2007) and RepeatModeler (v1.73, Abrusan et al., 2009) to construct a de novo repeat library with default parameters. Finally, we employed RepeatMask (Tarailo-Graovac and Chen, 2009) to identify known and novel TEs against Repbase TE and the de novo repeat library.
We combined de novo, homology-based and transcriptome-based prediction methods to predict protein-coding genes. For the de novo prediction, AUGUSTUS 3.0.1 (Stanke et al., 2006) and GenScan 1.0 (Burge and Karlin, 1997) were employed to predict gene structures of the repeat-masked genome assembly. For the homology-based prediction, the reference protein sequences were from five fishes, including zebrafish (Danio rerio, Howe et al., 2013), medaka (Oryzias latipes, Kasahara et al., 2007), a Chinese cavefish (Sinocyclocheilus grahami, Yang et al., 2016), grass carp (Ctenopharyngodon idella, Wang et al., 2015) and common carp (Cyprinus carpio, Xu et al., 2014). These downloaded protein sequences were mapped onto the assembled genome using tBlastn (v22.19, Mount, 2007) with E-value threshold of 1e-5. Genewise (v2.2.0) was employed to predict gene structures. The RNA-Seq data were aligned to the genome assembly using TopHat (v2.0, Trapnell et al., 2009) and searched transcript structures with Cufflinks (Trapnell et al., 2010). Finally, all gene models from the above three methods were integrated to form a comprehensive and non-redundant gene set using GLEAN (Elsik et al., 2007).
Functional Assignment
All protein sequences from the GLEAN results were aligned to TrEMBL and SwissProt databases (Boeckmann et al., 2003) using BlastP at E-value ≤ 1e-5. The gene pathways were mapped to the KEGG database (Kanehisa and Goto, 2000). We also used the InterProScan software (Hunter et al., 2009) to annotate the protein sequences by searching publically available databases including Pfam (Finn et al., 2014), PRINTS (Attwood, 2002), PANTHER (Thomas et al., 2003), ProDom (Bru et al., 2005) and SMART (Letunic et al., 2004). In summary, approximately 87.08% of the genes were supported by at least one related function assignments from the public databases (TrEMBL, SwissProt, KEGG and InterPro).
Phylogenetic Analysis
To understand the phylogenetic status of A. grahami within the Cyprinidae, we reconstructed a phylogenetic tree with A. grahami and other 18 cyprinids, using channel catfish (Ictalurus punctatus) as the out group. These selected species covered 11 of the 12 broadly recognized subfamilies in Cyprinidae (Chen, 1998); however, no data of the remainder Gobiobotinae are available yet. Among these cyprinid species (Table 1), if the whole-genome gene sets were available, we directly adopted them; if only transcriptome data were available, we downloaded the submitted reads from NCBI and employed a de-novo assembled method to assembly them into gene sets. Generally, each single-copy gene in diploid species would have two corresponding copies in tetraploid genomes. We therefore randomly separated the two copies into two gene sets and then combined each of the gene sets in tetraploid species with the single gene set in diploid species to produce two final single-copy datasets (dataset I and II).
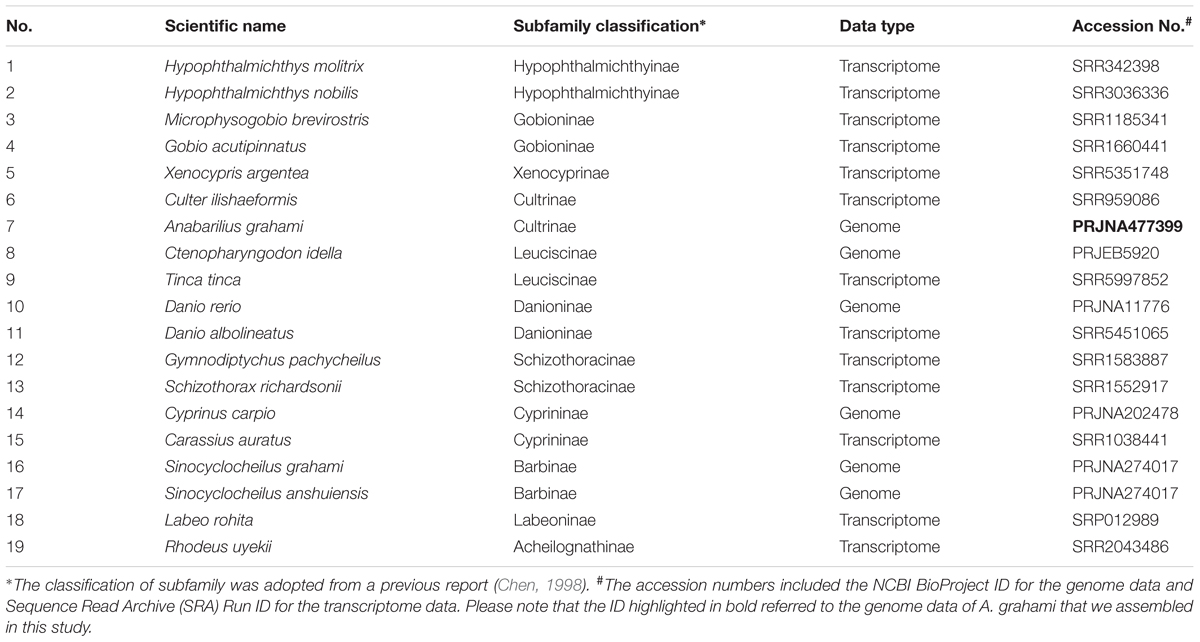
TABLE 1. Fish species selected for the phylogenetic analysis of Cyprinidae in the present study.
In dataset I and II, 229 single-copy families including 4,580 single-copy genes were collected; however, the alignment yielded 247,500 and 256,839 sites, respectively. These two datasets were subsequently employed to construct phylogenetic trees using both maximum likelihood (ML) method in PhyML (v3.0, Guindon and Gascuel, 2003) and Bayes Inference (BI) method in Mrbayes (v3.1, Ronquist and Huelsenbeck, 2003).
Heterozygous SNP Calling and Demographic History
Firstly, we identified heterozygous single-nucleotide polymorphisms (SNPs) in the A. grahami genome. We mapped 500-bp insert-sized reads against our assembled genome with BWA (v0.7.12-r1039, Li and Durbin, 2009). The SNPs were called by SAMtools (v0.1.19, Li H. et al., 2009) and filtered by read depth across the genome. In total, approximately 1,733,343 heterozygous sites were identified and the diploid consensus genome sequences were generated by these SNPs. Secondly, the distribution of the time since the most recent common ancestor (TMRCA) between two alleles in an individual was used to predict the history of change in population size. We employed the pairwise sequentially Markovian coalescent (PSMC) model (Li and Durbin, 2011) on heterozygous sites of A. grahami genome with the putative generation time (g = 2 years) and the mutation rate (μ = 3.51 × 10⁻⁹ per year per nucleotide, Graur and Li, 2000) to estimate historical effective population sizes over a range from 104 to 107 years ago. Finally, we used gnuplot4.4 (Janert, 2010) to draw a curve for the reconstructed population history.
SSR Searching and Identification
We searched for SSR loci with motifs ranging from di- to hexa-nucleotides in the assembled genome scaffolds of A. grahami. Our mining criteria included (i) scaffolds extracted with the length ≥1 kb and the average sequence coverage >20×; (ii) SSR identified from the selected scaffolds using MISA script1 with default settings at (2/6) (3/5) (4/5) (5/5) (6/5), and >100 bp between two SSRs; (iii) repeat motifs and the 200-bp flanking sequences used for Blastn search against the genome sequence with E-value ≤ 1e-5; (iv) SSR developed through filtering with >90% identity and >85% alignment length of the flanking sequences; (v) final SSR loci identified as candidates for marker development with single hit when mapped back to the genome.
SSR Evaluation and Genetic Diversity Analysis
Three steps were conducted in evaluating the efficiencies of SSR development in this study, and a preliminary genetic diversity of A. grahami was also assessed based on the final optimized SSR markers. We named the three steps as polymerase chain reactions (PCRs), polymorphism and parameters evaluation, respectively. Firstly, we selected a random set of 50 SSR loci for primer design using PRIMER3 (Koressaar and Remm, 2007), with expected PCR products ranging from 100 to 200 bp. Amplification effectiveness was tested on two geographically separated individuals of A. grahami. Secondly, we chose those good loci with correct and bright electrophoretic bands for a polymorphism evaluation, which was realized from 7 populations with three individuals in each population. Those SSR loci without any polymorphism among all the 21 samples were discarded. Thirdly, we filtered the SSR loci by means of an evaluation of the parameters that could affect the reliability of SSR analysis. This evaluation included null allele detection and linkage disequilibrium tests, based on the genotyping data matrix from four populations (30 samples in each population). These four populations, named EFCC1, EFCC2, Huoyanshan and Luchong, respectively, were artificially preserved populations from three different fish breeding farms. They were the main sources for artificial reintroduction each year to the current wild population in Fuxian Lake.
Polymerase chain reaction in the first step were carried out in 12.5-μL reaction volumes using the amplification profile as follows: 4 min at 94°C, 35 cycles of 30 s at 94°C, 35 s at 57°C, 40 s at 72°C, followed by a final extension step of 10 min at 72°C. The PCR procedures in the second and third steps were performed with the same conditions as those in the first step, except using fluorescent labeled reverse primers (6-FAM, HEX) instead of the regular primers, and using 1:(40–100) dilution of the first PCR product as the DNA template according to the brightness relative to the standard DNA marker-referred electrophoretic stripes. All PCR products were then genotyped on an ABI 3730xl genetic analyzer with Gene-Scan LIZ-500 (Applied Biosystems, United States) as the internal size standard, and scored with GeneMarker (SoftGenetics, United States). Genotyping errors associated with SSR analysis such as stutter bands, large allele dropout and null alleles were detected using MICRO-CHECKER (v2.2.3, Van Oosterhout et al., 2004). CERVUS (v3.0.7, Kalinowski et al., 2007) was employed to find matching pairs of genotypes and calculate the basic genetic parameters, including number of alleles (Na), polymorphism information content (PIC), the observed and expected heterozygosities (Ho and He), and null allele frequencies. The inbreeding coefficient (Fis), deviations from Hardy-Weinberg equilibrium (HWE), and linkage disequilibrium tests were performed with GENEPOP (v4.7.0, Rousset, 2008).
Results
Summary of Genome Assembly and Annotation for A. grahami
A total of 279.6-Gb raw data were generated by sequencing seven libraries on the Illumina HiSeq 2500 platform (Supplementary Table S1). The k-mer depth distributes with a main peak at 40× (Figure 1A), and therefore the genome size of A. grahami was estimated to be 1.020 Gb (Table 2). In addition, a minor curve at the right tail showed a low level of possible repetitive sequences (Figure 1A). After filtering low-quality reads, 188.9 Gb of clean reads were assembled using Platanus (Supplementary Table S2). The final assembled genome size of A. grahami is 1.006 Gb, accounting for 98.63% of the estimated genome size (1.020 Gb). The assembled contig number is 250,527 and the scaffold number is 178,229, with contig N50 and scaffold N50 values of 26.4 kb and 4.41 Mb, respectively (Table 2). The length of scaffold N50 of A. grahami is greater than these in all fishes but grass carp within Cyprinidae with published genomes, and also greater than these in most other non-cyprinid teleosts (see more details in Supplementary Table S3).
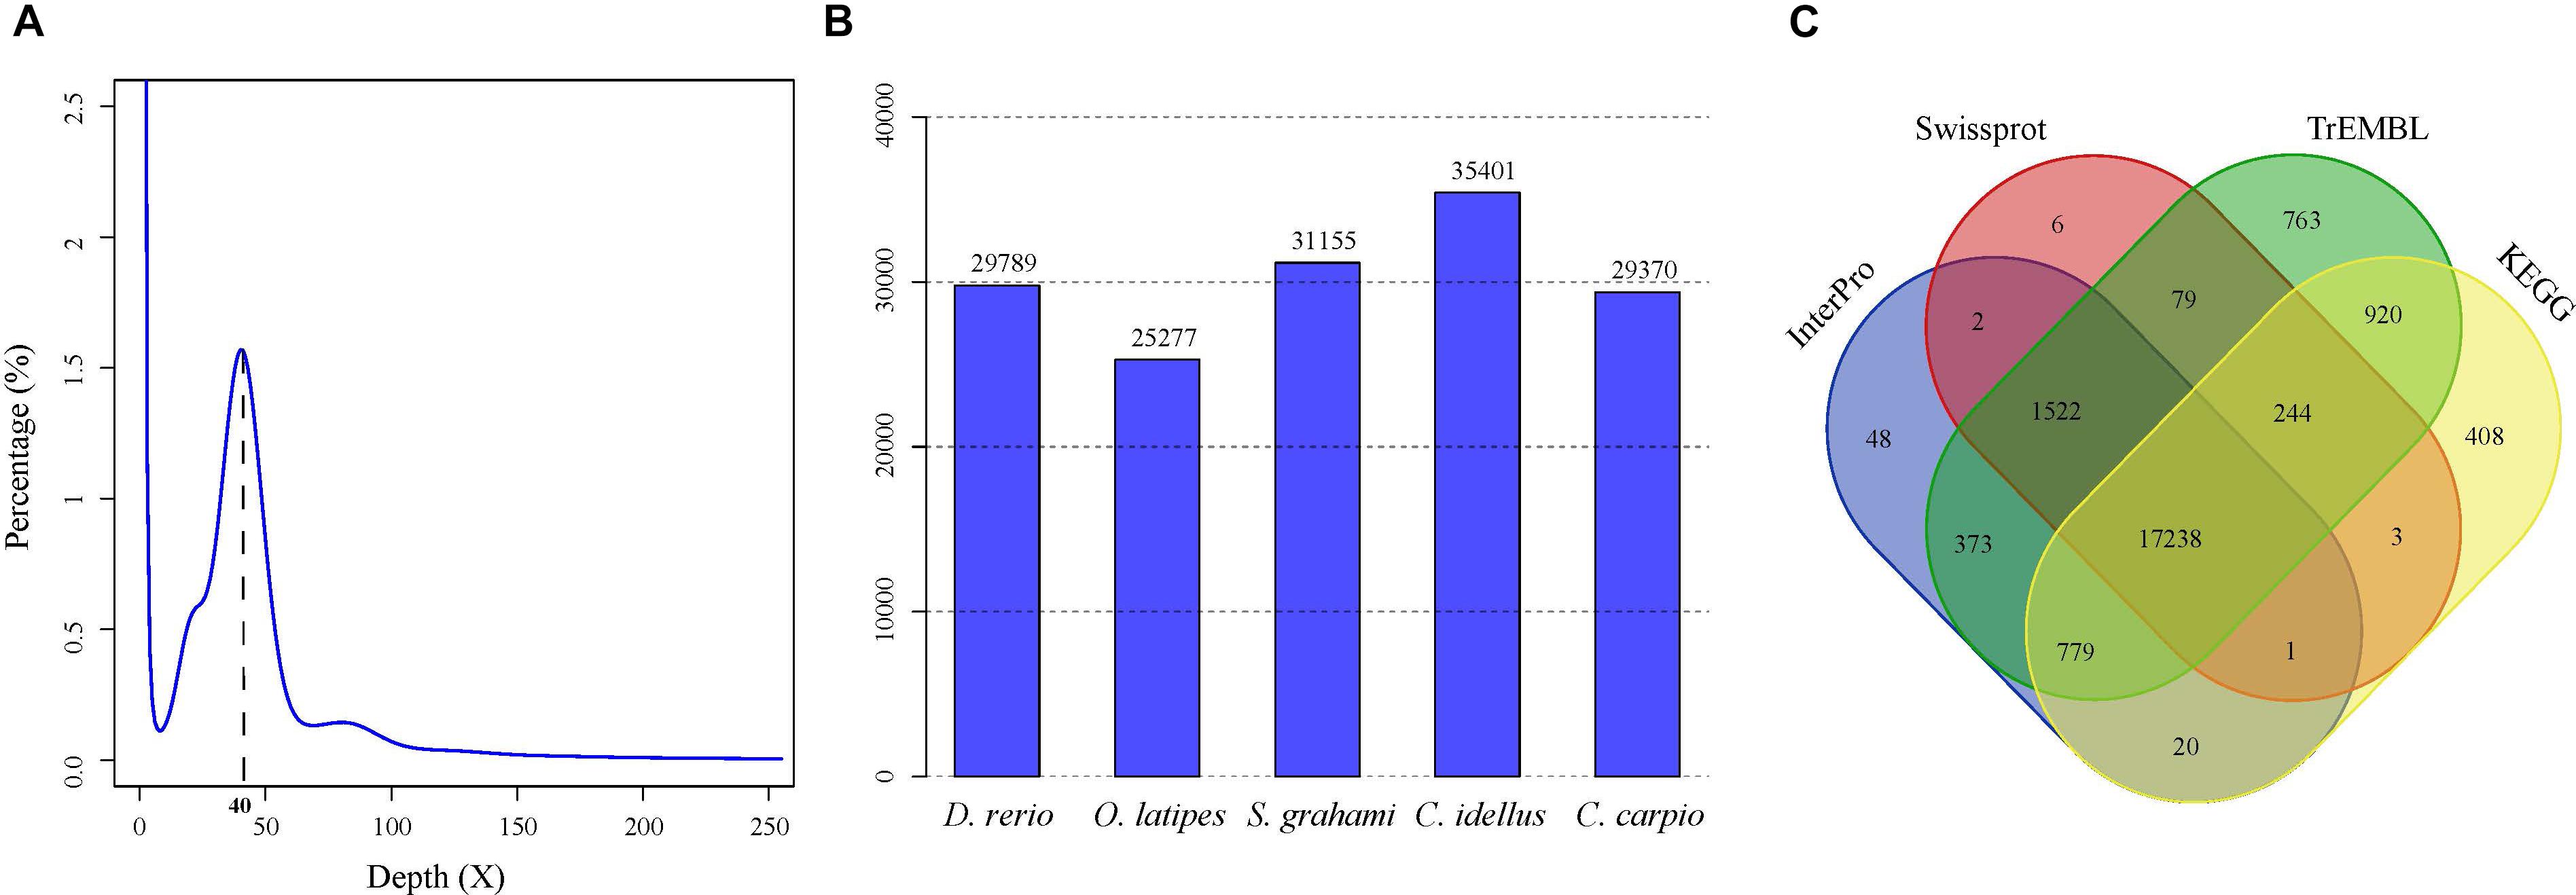
FIGURE 1. Genome-size estimation and genome annotation of A. grahami. (A) 17-mer frequency distribution of sequenced reads. (B) The number of predicted genes in A. grahami reciprocally homologous to other five representative fishes. (C) 22,406 predicted protein-coding genes with matching entries in the four popular public databases.
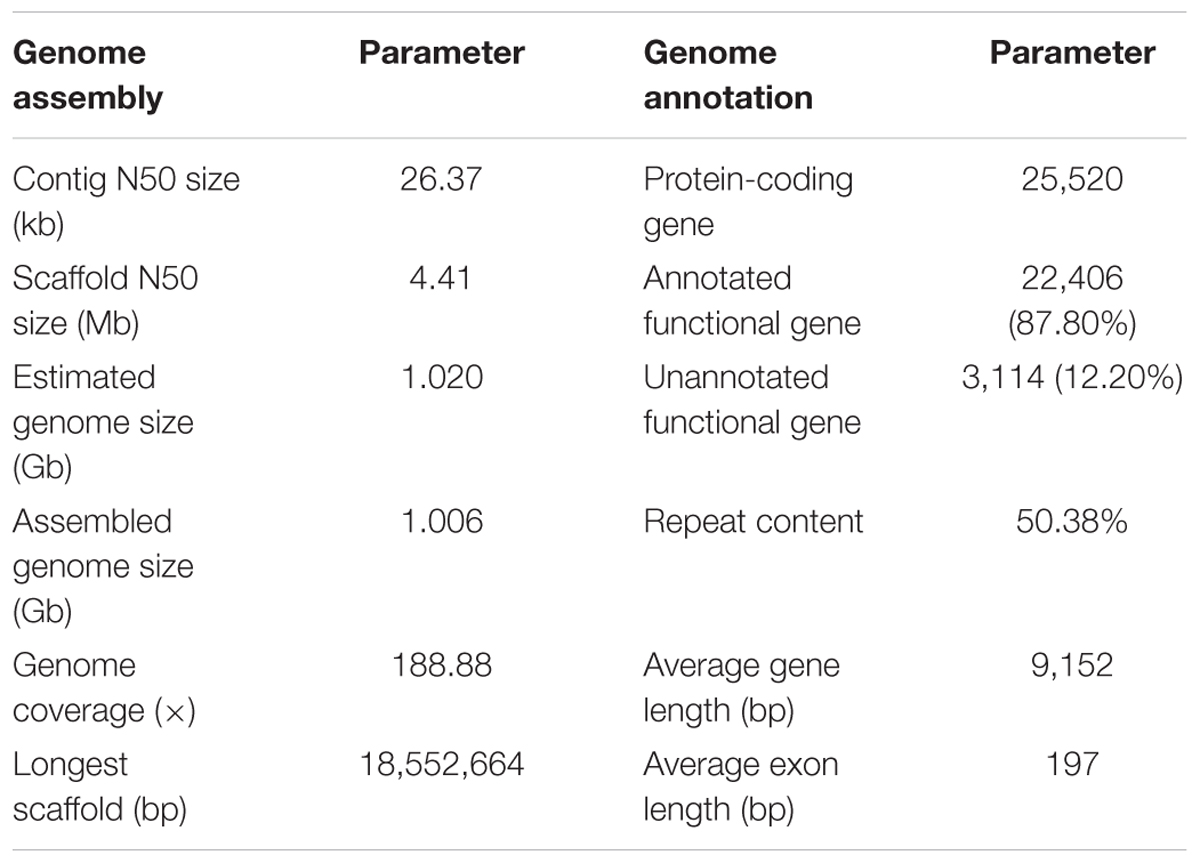
TABLE 2. Summary of the genome assembly and annotation for A. grahami.
Using BUSCO software, we chose the single-copy orthologs (N = 4,584) obtained from the phylogenetic analysis to assess the completeness of our genome assembly. The result showed that 93.2% of BUSCO genes were complete, in which 89.6% were single-copy BUSCOs while 3.6% were duplicated BUSCOs; 4.0% were fragmental BUSCOs, and 2.8% were missing. These data confirmed that our assembled genome was comparatively high quality and complete.
The genome comprised approximately 50.38% repetitive sequences (Table 2), which was comparable to the repeat content (52.2%) of the zebrafish genome (Howe et al., 2013, Supplementary Table S4). Additionally, the most abundant type of TE was class II DNA transposon (31.37%; Supplementary Table S5).
The number of predicted genes in A. grahami, reciprocally homologous to five representative fish genomes (D. rerio, O. latipes, S. grahami, C. idella and C. carpio), was more than 25,000 (Figure 1B). With a combination of de novo, homology-based and transcriptome-based annotation methods, we finally predicted a total of 25,520 protein-coding genes from the present A. grahami genome assembly, and 22,406 (87.80%) genes matched entries in the public databases (TrEMBL, SwissProt, KEGG and InterPro, Table 2 and Figure 1C). The total number of protein-coding genes identified in A. grahami (25,520) was similar to the sequenced diploid cyprinids, such as zebrafish (26,000, Howe et al., 2013) and grass carp (27,263, Wang et al., 2015), and approximately half of the tetraploid cyprinids, such as common carp (52,610, Xu et al., 2014) and the golden-line barbel fish (42,109, Yang et al., 2016). These data provided evidence to support the diploid nature of A. grahami from a genomic view.
Phylogenetic Position and Population History of A. grahami
Based on two datasets (dataset I and II) and two methods (ML and BI), four phylogenetic trees (ML-I, ML-II, BI-I and BI-II) were obtained. All the four trees revealed an identical topology of the 19 species in the Cyrpinidae involved in the study, representing 11 of the 12 recognized subfamilies (Chen, 1998; Figure 2). Within this group, the closest relative of A. grahami is Culter ilishaedormis; both of them belong to the subfamily of Cultrinae. The 11 subfamilies were all recovered as monophyletic groups except Leuciscinae, in which the Tinca tinca was not nested with C. idella, but had a closer relationship with the species representing the Gobioninae and the Acheilognathinae.
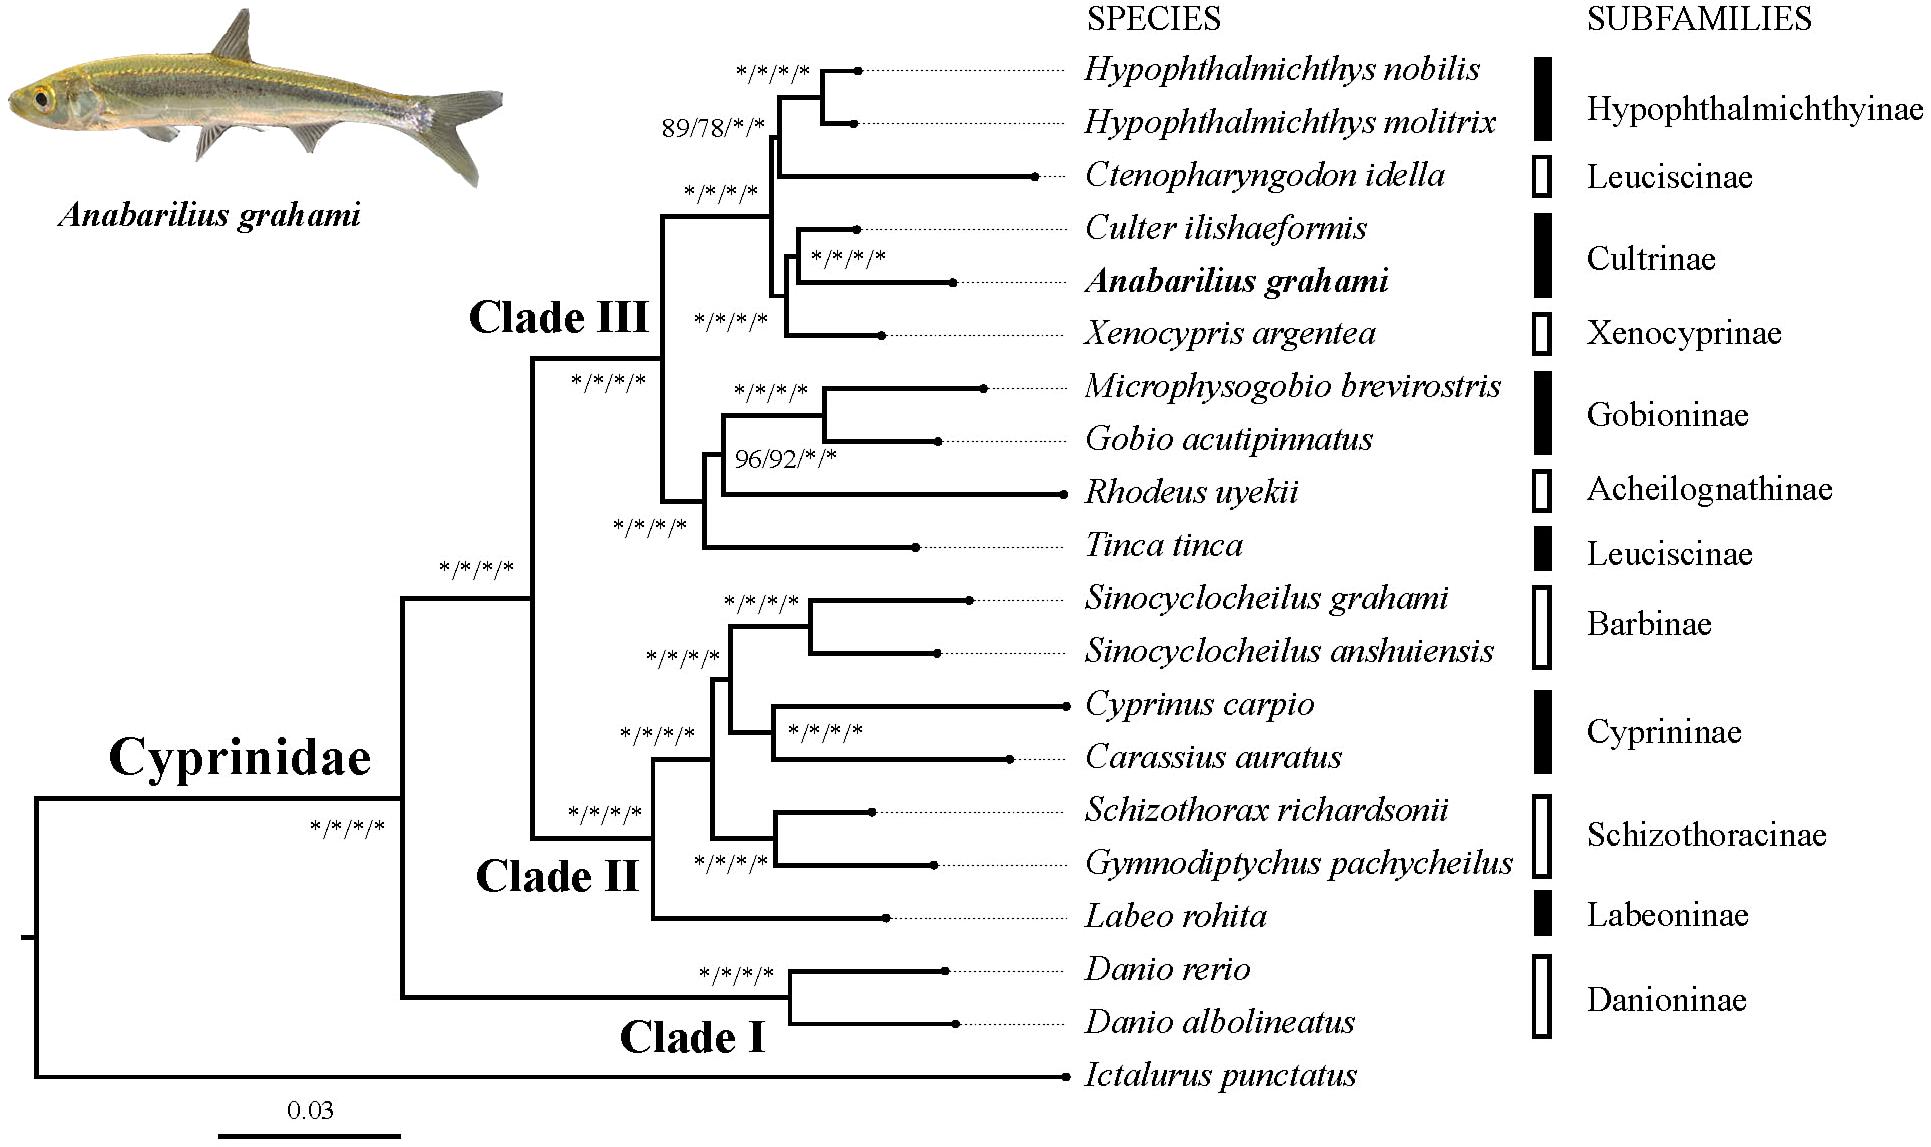
FIGURE 2. Inter-subfamily phylogenetic relationships within the Cyprinidae. The analysis was based on the 4,580 single-copy genes of two datasets (dataset I and II) using the ML and BI methods. Supporting values are presented as ML-I/ML-II/BI-I/BI-II at each node, where asterisks (∗) denote bootstrap value (ML) or posterior probability (BI) of 100%. The position of A. grahami is marked in bold, and a photo of a live specimen of this species is shown on the top left.
Three major subclades (Clade I, II and III) were recovered in the Cyprinidae with strong supporting values (Figure 2). In summary, the Clade I represented the subfamily Danioninae, which was resolved as the basal-most subfamily within the Cyprinidae. The Clade II was recovered in a relationship of [Labeoninae, (Schizothoracinae, (Cyprininae, Barbinae))], and the Clade III was recovered in a relationship of [(Tinca, (Acheilognathinae, Gobioninae)), ((Leuciscinae, Hypophthalmichthyinae), (Xenocyprinae, Cultrinae))].
Using the heterozygous SNPs from the genome data of A. grahami, we reconstructed the population demography based on the PSMC model. As shown in Figure 3, the population of A. grahami had been maintaining in a relative stable size for a long time (0.6–3 Ma), then increasing since 0.6 Ma, reaching to a peak at about 0.03–0.04 Ma, and then declining in the subsequent phase.
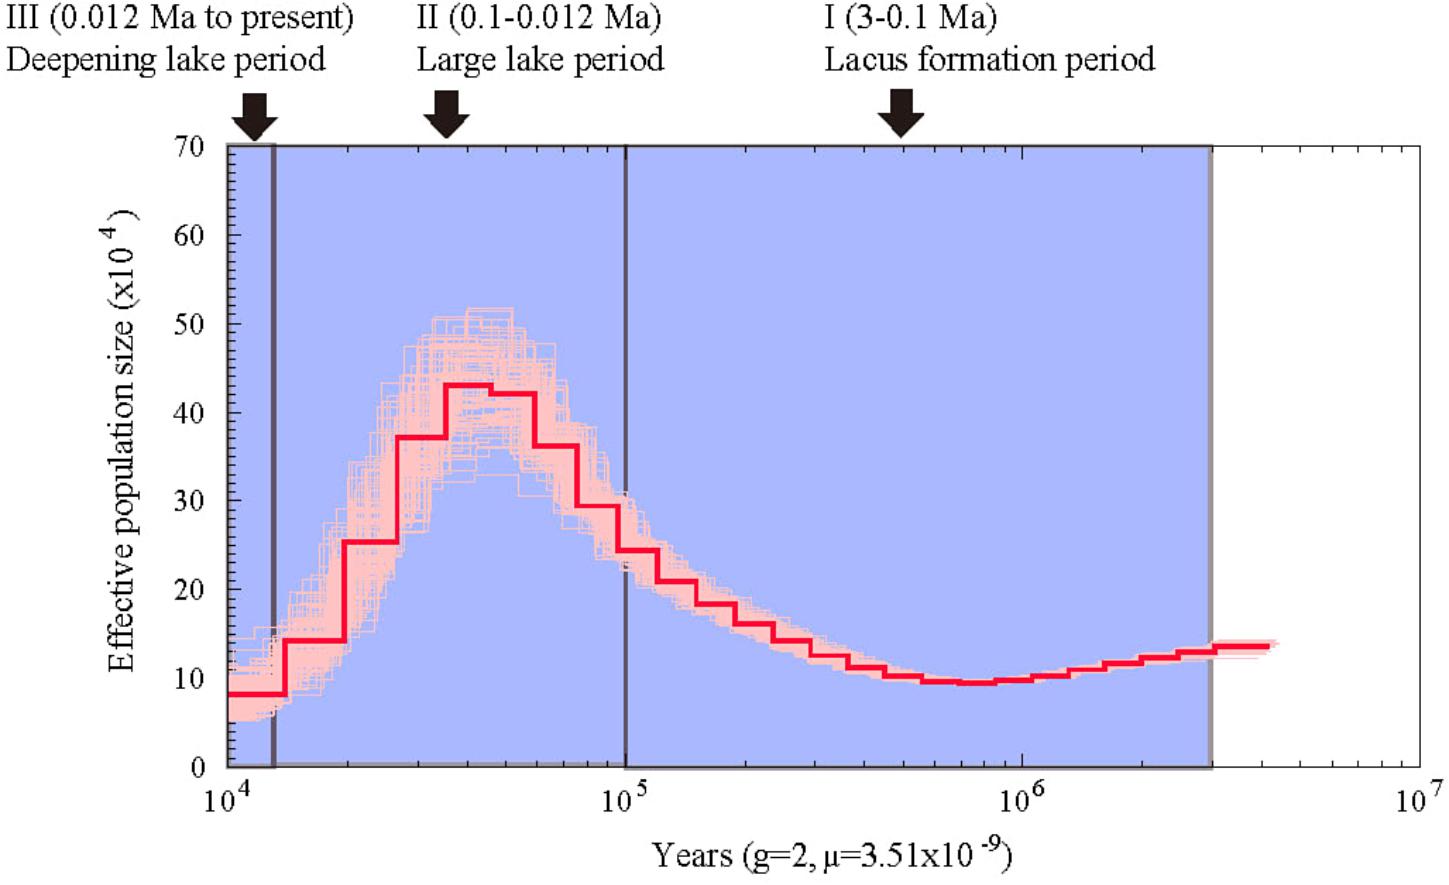
FIGURE 3. Estimated population demography of A. grahami using the PSMC model. The bold red line represents the estimated effective population size changes of A. grahami, and the thin pink lines represent 100 bootstrap estimations. The demarcated blue blocks denote three main periods during the development of Fuxian Lake, including (I) lacus formation period (3–0.1 Ma), (II) large lake period (0.1–0.012 Ma), and (III) deepening lake period (0.012 Ma to present).
SSR Identification, Evaluation and Application
A flowchart depicting the process used for SSR markers identification, evaluation and application is presented in Figure 4. In brief, a total of 144,693 SSR were developed using the criteria from (i) to (iv), and 33,836 were identified as final SSR loci after (v) (Supplementary Table S6). The numbers of both the developed SSR loci (144,693) and those finally identified loci (33,836) gradually decreased from di- to hexa-nucleotides motifs, while the di- plus tri-nucleotide SSRs accounted for over 98% of all the final identified SSR loci (Supplementary Table S7). For the 50 randomly selected SSR loci, 47 loci (94%) were successfully amplified PCR products with a single band and expected size (Step I: PCR evaluation). Using 27 SSR loci (22 di-, 4 tri-, and 1 tetra-nucleotide SSRs) in seven different populations (n = 3 in each population), only 17 of the 22 di-nucleotide loci were detected with SSR polymorphism (Step II: polymorphism evaluation), and thus retained to the next step. After excluding three loci with detection of null alleles (using MICRO-CHECK), two loci with null allele frequency greater than 0.2 (using CERVUS), two loci involved in linkage disequilibrium (using GENPOP, Supplementary Table S8), only 11 loci were finally retained (Step III: parameters evaluation). These 11 optimized SSR markers (Supplementary Table S9) were then used for a subsequent genetic diversity analysis.
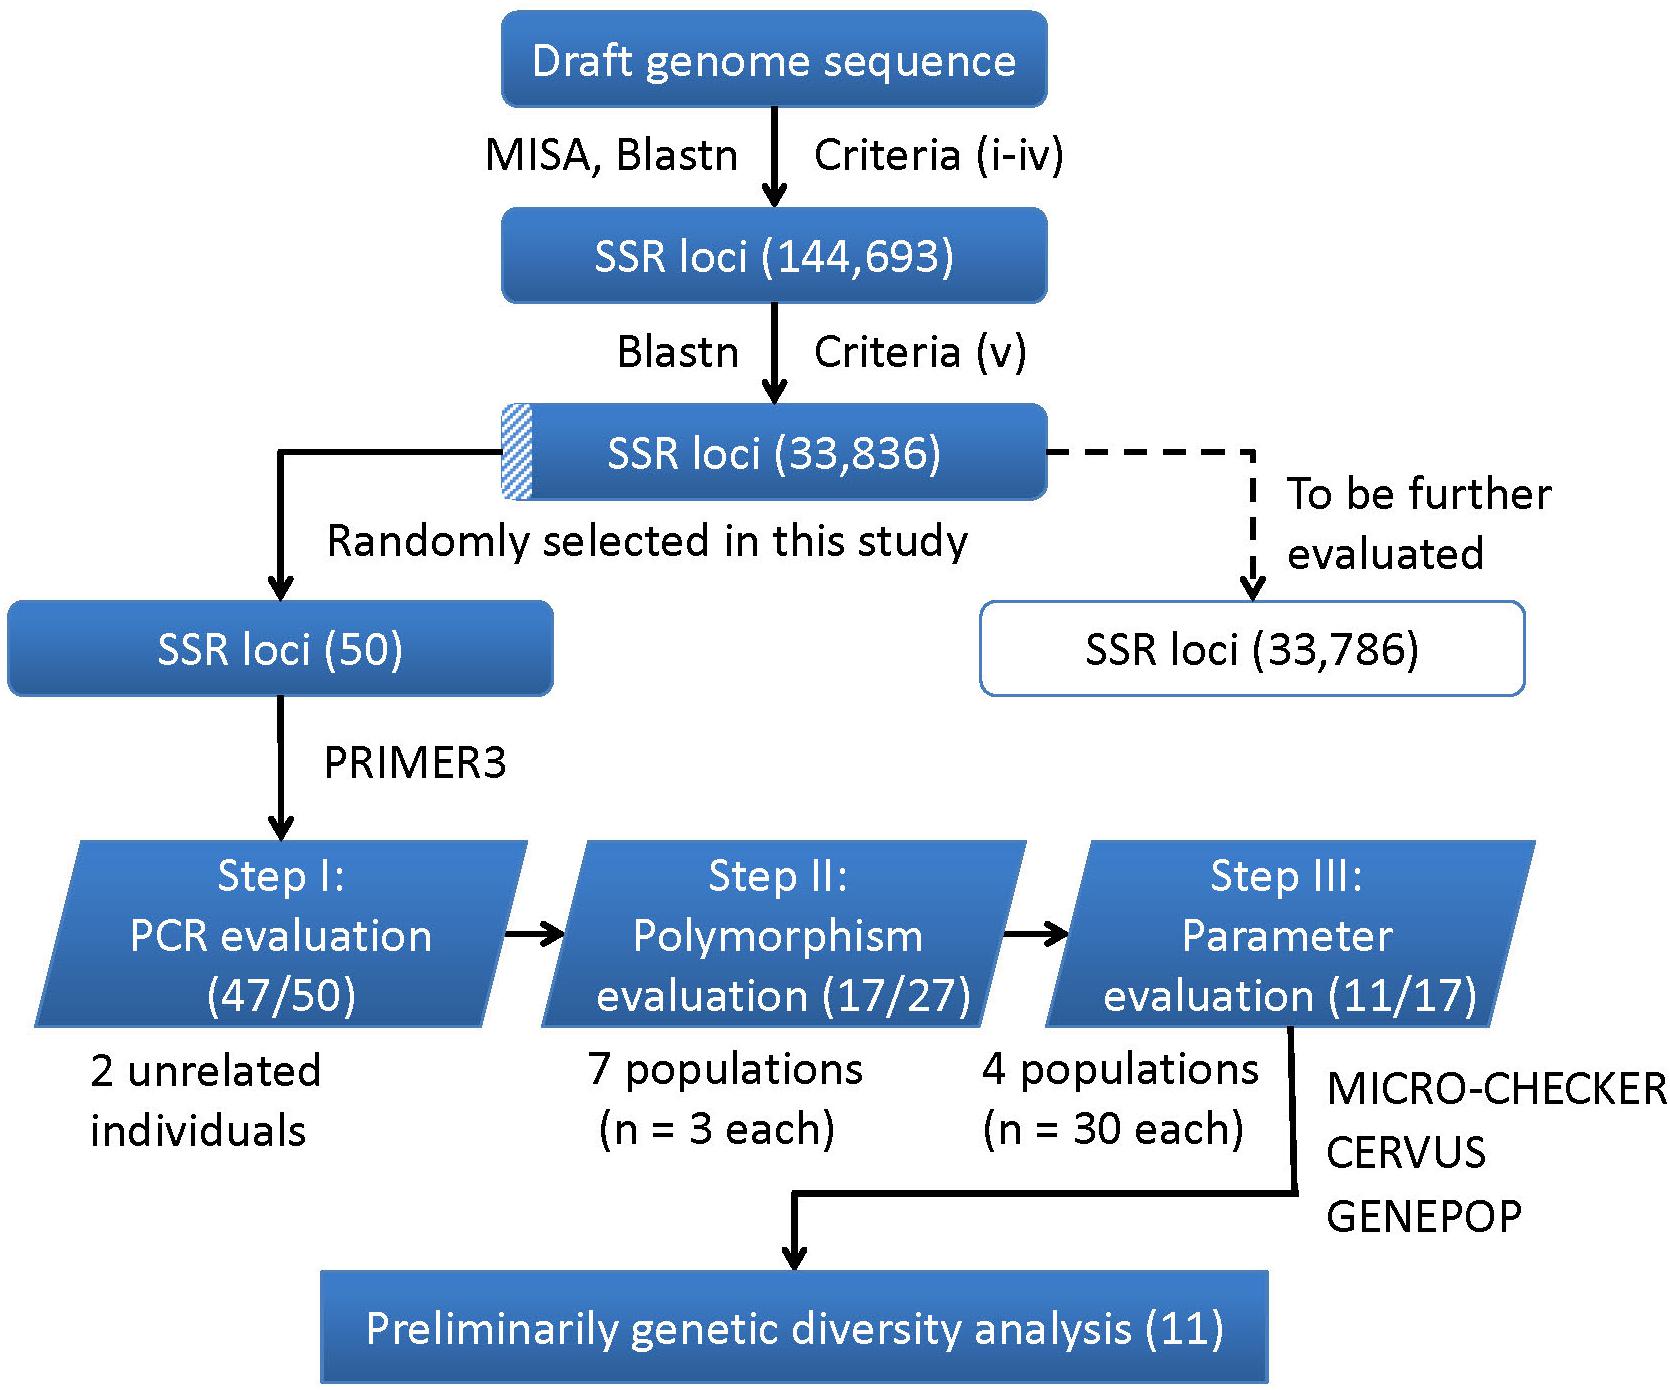
FIGURE 4. A flowchart for the process of SSR loci identification, evaluation, and application in this study. The corresponding numbers of loci retained after each step are presented in brackets.
Basic genetic parameters of four different populations in A. grahami based on the 11 SSR markers are summarized in Table 3 (more details in Supplementary Table S10). In all the four populations, the mean Ho (0.391∼0.467) was higher than the mean He (0.354∼0.411). The PIC values decreased in the order EFCC2 > Huoyanshan > EFCC2 > Luchong, and the average value was about 0.3 among all four populations, which indicated a moderate polymorphism in A. grahami. The majority of the Fis values were negative, indicating that the inbreeding level was relatively low. Based on the 11 SSR markers, significant deviation from HWE was observed only in the EFCC2 population (P < 0.05), and the heterozygosity excess may contribute somehow as Ho was relatively higher than He in this population.
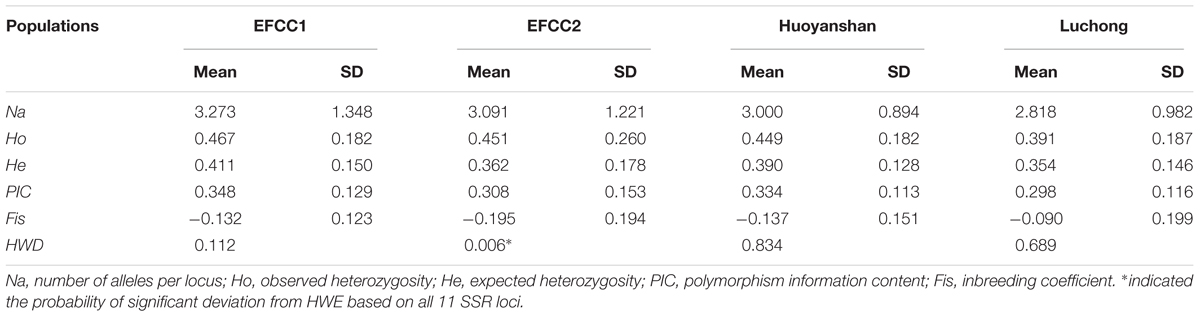
TABLE 3. The average genetic parameters at 11 SSR loci of A. grahami in four different populations (n = 30 per population).
Discussion
The WGS of A. grahami Provides a Useful Genetic Resource
If the initial discovery of a species can be treated as the first milestone for enabling people to know it, the WGS of a species would be another landmark to promote further applications. The advent of next-generation sequencing (NGS) has revolutionized genomics research by bringing the sequencing of entire genomes in a way of ever-increasing throughput and ever-decreasing cost (Van Dijk et al., 2014). This revolution has not only radically changed the paradigm of biological research, shifting it to a genome-wide scale, but also broadly opened up a new age in the whole biological sciences (Koboldt et al., 2013). Since the first completion of the human genome sequence in 2004, many WGS projects have been launched, such as the Genomes 10K Project (David et al., 2009), involving the sequencing of thousands or even millions of genomes (Van Dijk et al., 2014). The WGS is the basic genetic heritage for a species; WGS has ushered in a new era of investigation in biological sciences to the new sequenced species, allowing it to touch nearly every aspect of the biological enquiry (David et al., 2009).
Fishes account for over one-half of the world’s living species of vertebrates, exhibiting an incomparable diversity in their morphology, physiology, behavior, and ecological adaptations (Nelson et al., 2016). Fishes are also important food sources for humans, comprising 49.8 million tonnes of products, with an estimated first-sale value of US $99.2 billion in 2014 (FAO, 2016). The NGS-based WGS brings new opportunities to fish research and utilization; however, the current WGS projects on fishes, do not approach their diversity and application needs. The published genome data up to June 2018 was only available to 60 fish species (Hughes et al., 2018). These sequenced species are predominantly from the economically important fishes, such as Atlantic salmon (Davidson et al., 2010), common carp (Xu et al., 2014), and channel catfish (Liu et al., 2016); other sequenced species are either model organisms, including zebrafish (Howe et al., 2013) and medaka (Kasahara et al., 2007), or evolutionary interesting nodes, such as the coelacanth (Amemiya et al., 2013) and cavefishes (McGaugh et al., 2014).
In this study, we reported the WGS of a Yunnan-Guizhou plateau “3E” fish, A. grahami, which is a typical species with endangered, endemic, and economic status and priorities. Corresponding genome assembly of this teleost has been evaluated with good quality (Figure 1 and Table 2), and it was expected to provide a useful genetic resource for the further studies of this valuable fish.
Inter-Subfamily Phylogenetic Relationships Within the Cyprinidae
In this study, we reconstructed for the first time the phylogenetic relationships within the Cyprinidae from a genomic viewpoint, combining the genomic data of A. grahami we obtained here with 18 other genomic and transcriptomic data of cyprinids that were downloaded from NCBI (Table 1). As we know, Cypriniformes is the largest monophyletic group of freshwater fishes in the world, with 4,000+ species recognized as well as 2,000+ species still awaiting for description (Mayden et al., 2009; Stout et al., 2016). Cyprinidae contains the vast majority of taxa in the Cypriniformes, and it is also the largest family of freshwater fishes on the earth (Nelson et al., 2016). Classification of subfamilies can facilitate the taxonomic, evolutionary and many other studies of this big group; however, the recognition of the subfamilies remains controversial in spite of some systematic studies. With 4,000+ recognized species, the ambition to reconstruct a tree of life at the species-level is largely impractical; however, using phylogeny-based subfamily classification could provide a simple but useful taxonomic system for broader studies.
A putative subfamily classification system, including 2 series and 10 subfamilies using skeletal characters, has been proposed (Chen et al., 1984). It was a fundamental framework for most of the ensuing taxonomic literature about Cyprinidae, such as in the books of “Fauna Sinica, Osteichthyes, Cypriniformes II & III” (Chen, 1998); and “Fishes of the World” (5th ed.), as well as some previous versions (Nelson et al., 2016). The previous classification (Chen et al., 1984) has been updated to a 12-subfamily system for the Cyprinidae, namely, Danioninae, Leuciscinae, Cultrinae, Xenocyprinae, Hypophthalmichthyinae, Cobioninae, Gobiobotinae, Acheilognathinae, Barbinae, Labeoninae, Schizothoracinae, and Cyprininae (Chen, 1998). This 12-subfamily classification has become one of the most useful and popular systems for subsequent studies (Chen, 2013), and due to its popularity, the inter-subfamily relationships under this classification system has also been testified by some of the molecular phylogenetic studies, mainly based on PCR-targeted DNA sequences (Wang et al., 2007, 2012).
The phylogenetic relationship in this study revealed three well-supported subclades of Cyprinidae (Figure 2). The subfamily Danioninae (herein as Clade I) was resolved as the basal-most subfamily within the Cyprinidae, which is consistent with some previous molecular phylogenetic studies (Gilles et al., 2001; Wang et al., 2007) but disagrees with some others (Chen and Mayden, 2009; Wang et al., 2012). Morphologically, Danioninae is a large assemblage containing mostly taxa unaccommodated by the other subfamilies (Wang et al., 2007). The sister group relationship of Clade II and III, in line with most of the previous studies based on PCR-targeted DNA sequences, supported two well-accepted major lineages within Cyprinidae, namely, barbeled cyprinines (herein as Clade II) and (usually) non-barbeled leuciscines (herein as Clade III, Wang et al., 2012). It was also largely consistent with the two series classification – the fundamental framework of (Chen et al., 1984) based on skeletal characters – except for the position of Tinca. Clade II was recovered with a relationship of [Labeoninae, (Schizothoracinae, (Cyprininae, Barbinae))], which was largely consistent with most previous studies based on more species but less sequence lengths (Wang et al., 2007, 2012), and this subclade has now been suggested to be a named Cyprininae (see review in Yang et al., 2015). Clade III was comprised of the species usually called as “the Endemic Clade of East Asian Cyprinidae” (Tao et al., 2010), even though the inter-group relationships were controversial based on previous PCR-targeted DNA sequences (Wang et al., 2007, 2012). Based on genome-level sequences used in this study, Clade III was recovered in a relationship of [(Tinca, (Acheilognathinae, Gobioninae)), ((Leuciscinae, Hypophthalmichthyinae), (Xenocyprinae, Cultrinae))]. Two sister group relationships among Clade III, the Acheilognathinae + Gobioninae, and the Xenocyprinae + Cultrinae, were broadly consistent with most of the previous studies; however, recovering Tinca as the sister group of other Leuciscinae from some other studies (Wang et al., 2007, 2012; Stout et al., 2016) was not supported in this study. Tinca has long been treated as Incertae sedis from both morphological and molecular studies (Wang et al., 2007). Due to its controversial phylogenetic position, the monotypic genus Tinca has been frequently suggested to be an independent subfamily as Tincinae (Wang et al., 2012; Stout et al., 2016).
The classification of subfamilies in the Cyprinidae and the subgroups embodied in each subfamily have varied among different studies, which has been inevitable in the progress toward the ultimate tree of life among 4,000+ cyprinids. During this process, many taxonomic levels, such as series, lineages, subfamilies, and tribes, were proposed to designate newly recognized groups (Yang et al., 2015; Stout et al., 2016); however, these complicated terms make the phylogenetic relationships of Cyprinidae inaccessible for most people without in-depth knowledge of this group. The phylogenetic relationship revealed in this study (Figure 2), in spite of the limited number of species included, is expected to provide a simple but useful framework of the inter-subfamily phylogeny of Cyprinidae.
Historical Relationship Between A. grahami and Its Habitat Fuxian Lake
As one of the Yunnan-Guizhou plateau lakes, Fuxian Lake is the sole habitat of A. grahami. Interestingly, the species exhibits many special biological characters, which were believed to be a result of adaptation along with the long-term formation of Fuxian Lake (Yang, 1992). Fuxian Lake, similar to most of the other Yunnan-Guizhou plateau lakes, is a kind of rift lake that formed and evolved under long, periodic and complex tectonic events during the rising of Qinghai-Tibet plateau (Zhu et al., 1989).
From the evidence of lake sediments, we know that the Fuxian Lake was formed by fault-subsidence tectonics in the late Tertiary, and then sustained from pond to basin since late Pliocene (ca. 3.0–3.4 Ma). It experienced a large paleo-Fuxian Lake period in the late Pleistocene to Holocene (ca. 0.126–0.012 Ma), where the superficial area was approximately 1.6-fold greater and the surface elevation was 30–40 m higher than the lake at present (Zhu et al., 1989). Afterward, the lake body rapidly sunk and the mountains around gradually lifted, which finally shaped Fuxian Lake to be the second deepest lake in China, with an extreme depth at over 150 m and average depth at about 87 m. Along with the process of deepening, Fuxian lake has also been undergoing a copiotrophic to oligotrophic transformation (Yang, 1994). In summary, there are three periods during the development of Fuxian Lake (Figure 3): (I) lacus formation period since late Pliocene (ca. 3 Ma), (II) large lake period since late Pleistocene (ca. 0.1 Ma), and (III) a deepening period of the lake accompanied by oligotrophic development since early Holocene (ca. 0.012 Ma).
Interestingly, the population demography of A. grahami matched well with the three periods during the development of Fuxian Lake (Figure 3). The population of A. grahami maintained a relatively stable level at the early period (0.6–3 Ma), which would reflect the long time of the lacus formation since late Pliocene (ca. 3 Ma, in Period I). During this time, the ancestors of A. grahami colonized the lake and shifted gradually from lotic to lentic habitats. The population increase of A. grahami since 0.6 Ma would possibly be a response of the expansion of Fuxian Lake. When the fish reached the maximal population size (0.03–0.04 Ma), the lake was also had its largest ponding area (ca. 0.1 Ma, in Period II). A similar pattern was also detected by us in another adjacent Yunnan-Guizhou plateau lake, Dianchi Lake, when the endemic fish, S. grahami, exhibited a noteworthy population expansion congruent with a period when the paleo-Dianchi Lake had a three times larger area (Yang et al., 2016). In considering of the similar patterns between A. grahami in Fuxian Lake and S. grahami in Dianchi Lake, range expansion served as a crucial factor in increasing the population sizes of plateau endemic fishes, and vice versa. In A. grahami, the later shrinking and deepening of Fuxian Lake (ca. 0.012, Period III) might be the key reason for its population declining after the maximal population size (0.03–0.04 Ma). The oligotrophizing along with the deepening of Fuxian Lake would, synchronously and substantially, accelerate the speed of its population decline afterward.
SSR Development and Utilization for Genetic Diversity Analysis
Molecular markers have been widely used to study the genetic diversity of a species. Because of the abundantly polymorphic, selectively neutral, highly repeatable, and unambiguously genotyping, SSR is one of the most useful molecular markers that can easily explore and apply in this post-genomic area. Compared to the traditionally expensive, time-consuming and labor-intensive in construction of the enriched libraries, identifying SSR markers based on high-throughput sequencing is much faster and more cost-effective (Liu et al., 2017). Identification of SSR markers provided valuable resources for further studies of each newly sequenced taxon (Stoll et al., 2017).
In this study, we identified 33,836 SSR loci of A. grahami after genomic searching under five criteria, which can serve as a SSR resource pool for studies on this species (Supplementary Table S6). We designed a three-step approach, namely, PCR, polymorphism and parameters evaluation (Figure 4), to assess this identified SSR resource pool by randomly selected 50 SSR loci for primer design and marker screening. After three steps evaluating and filtering, we retained 11 optimized SSR markers that can be used for a preliminary genetic diversity analysis (Supplementary Tables S8, S9). The PIC of each marker usually reveals the general diversity in the genetic analysis of a species. According to the PIC values of the 11 SSR markers in four populations (30 samples in each population), the average PIC value was calculated to be 0.322 among these four artificially cultivated populations (Table 3), which indicated the general genetic diversity of A. grahami was reasonably informative (Botstein et al., 1980).
Maintenance of genetic diversity is the major objective of most projects for conservation and utilization, so that population can face environmental challenges in the future and can respond to long-term selection, either natural or artificial for traits of economic and cultural interest (Sharma et al., 2016). From the perspective of conservation, reintroduction is the most popular technique for endangered species to re-establish populations within their historic range (IUCN, 1998). However, success of such projects largely depends on the correspondingly long-term management for the genetic diversity, population structure, levels of inbreeding and other relevant parameters (Tollington et al., 2013). As an endangered fish that has undergone drastic population decline in these decades, reintroduction of A. grahami to the Fuxian Lake has become the major way to re-establish its wild populations. Therefore, the artificial cultivated populations from fish breeding farms have been the main sources for the present and future wild populations. Based on the four artificial cultivated populations, we revealed that the general genetic diversity of A. grahami was moderate, and the inbreeding level within each of the four populations was relatively low (Table 3). It would suggest that the genetic diversity of A. grahami at present is not necessarily a cause for pessimism; however, a whole picture of its genetic diversity and population structure based on a broader sample coverage has yet to be uncovered.
In summary, besides the new assembled genome resource, the identified 33,836 SSR loci provided another useful genetic resource for long-term explorations of this “3E” species. Especially, the 11 optimized SSR loci screened from this study will provide practical genetic tools for further near-term genetic and conservation studies.
Data Availability
This Whole Genome Shotgun project has been deposited at DDBJ/ENA/GenBank under the accession RJVU00000000 with a BioProject ID of PRJNA477399. The version described in this paper is version RJVU01000000.
Author Contributions
JXY, WJ, QS, and LC conceived the project and designed the scientific objectives. WJ, XP, YZ, XW, KY, CS, and QL collected and prepared the fish samples. YQ, YL, CB, JL, XY, JC, and JLY conducted bioinformatics analysis. WJ and YZ performed the SSR development and experiments. WJ, YQ, and XP prepared the manuscript. QS, JXY, and LC revised the manuscript. All authors have read and approved the final manuscript.
Funding
This work was supported by the Innovation and Enhancement Program (2016AB024), Basic Research Program (2018FB047 and 2016FA044), and construction and people program (2015DA008 and 2014HB053) of Yunnan Provincial Science and Technology Department; and National Natural Science Foundation of China (31672282 and U1702233).
Conflict of Interest Statement
The authors declare that the research was conducted in the absence of any commercial or financial relationships that could be construed as a potential conflict of interest.
Acknowledgments
We would like to thank Prof. Richard Winterbottom (Royal Ontario Museum, Toronto, ON, Canada) for reviewing and revising the writing of this paper; and we also acknowledge Mr. Zaiyun Li and Mr. Yapeng Zhao for their assistances in sample collections.
Supplementary Material
The Supplementary Material for this article can be found online at: https://www.frontiersin.org/articles/10.3389/fgene.2018.00614/full#supplementary-material
Footnotes
References
Abrusan, G., Grundmann, N., DeMester, L., and Makalowski, W. (2009). TEclass-a tool for automated classification of unknown eukaryotic transposable elements. Bioinformatics 25, 1329–1330. doi: 10.1093/bioinformatics/btp084
Amemiya, C. T., Alföldi, J., Lee, A. P., Fan, S., Philippe, H., MacCallum, I., et al. (2013). The African coelacanth genome provides insights into tetrapod evolution. Nature 496, 311–316. doi: 10.1038/nature12027
Attwood, T. K. (2002). The PRINTS database: a resource for identification of protein families. Brief Bioinform. 3, 252–263. doi: 10.1093/bib/3.3.252
Benson, G. (1999). Tandem repeats finder: a program to analyze DNA sequences. Nucleic Acids Res. 27, 573–580. doi: 10.1093/nar/27.2.573
Boeckmann, B., Bairoch, A., Apweiler, R., Blatter, M. C., Estreicher, A., Gasteiger, E., et al. (2003). The SWISS-PROT protein knowledgebase and its supplement TrEMBL in 2003. Nucleic Acids Res. 31, 365–370. doi: 10.1093/nar/gkg095
Botstein, D., White, R. L., Skolnick, M., and Davis, R. W. (1980). Construction of a genetic linkage map in man using restriction fragment length polymorphisms. Am. J. Hum. Genet. 32:314.
Bru, C., Courcelle, E., Carrere, S., Beausse, Y., Dalmar, S., and Kahn, D. (2005). The ProDom database of protein domain families: more emphasis on 3D. Nucleic Acids Res. 33, D212–D215. doi: 10.1093/nar/gki034
Burge, C., and Karlin, S. (1997). Prediction of complete gene structures in human genomic DNA. J. Mol. Biol. 268, 78–94. doi: 10.1006/jmbi.1997.0951
Chen, W. J., and Mayden, R. L. (2009). Molecular systematics of the Cyprinoidea (Teleostei: Cypriniformes), the world’s largest clade of freshwater fishes: further evidence from six nuclear genes. Mol. Phylogenet. Evol. 52, 544–549. doi: 10.1016/j.ympev.2009.01.006
Chen, X., Yue, P., and Lin, R. (1984). Major groups within the family Cyprinidae and their phylogenetic relationships. Acta Zootaxonom. Sin. 9, 424–440.
David, H., O’Brien, S. J., Ryder, O. A., Barker, F. K., Clamp, M., Hanner, R., et al. (2009). Genome 10K: a proposal to obtain whole-genome sequence for 10,000 vertebrate species. J. Hered. 100, 659–674. doi: 10.1093/jhered/esp086
Davidson, W. S., Koop, B. F., Jones, S. J., Iturra, P., Vidal, R., Maass, A., et al. (2010). Sequencing the genome of the Atlantic salmon (Salmo salar). Genome Biol. 11:403. doi: 10.1186/gb-2010-11-9-403
Deng, J., Kang, B., Zhang, X., Long, X., Kong, L., and Bi, B. (2013). Analysis and evaluation of nutritional composition in whole-body of Sinocyclocheilus grahami and Anabarilius grahami. Acta Nutrimenta Sin. 35, 607–609.
Elsik, C. G., Mackey, A. J., Reese, J. T., Milshina, N. V., Roos, D. S., and Weinstock, G. M. (2007). Creating a honey bee consensus gene set. Genome Biol. 8:R13. doi: 10.1186/gb-2007-8-1-r13
FAO (2016). The State of World Fisheries and Aquaculture 2016. Rome: Food and Agriculture Organization of the United Nations.
Finn, R. D., Bateman, A., Clements, J., Coggill, P., Eberhardt, R. Y., Eddy, S. R., et al. (2014). Pfam: the protein families database. Nucleic Acids Res. 42, D222–D230. doi: 10.1093/nar/gkt1223
Gilles, A., Lecointre, G., Miquelis, A., Loerstcher, M., Chappaz, R., and Brun, G. (2001). Partial combination applied to phylogeny of European cyprinids using the mitochondrial control region. Mol. Phylogenet. Evol. 19, 22–33. doi: 10.1006/mpev.2000.0916
Graur, D., and Li, W. H. (2000). Fundamentals of Molecular Evolution. Sunderland, MA: Sinauer Associates.
Guindon, S., and Gascuel, O. (2003). A simple, fast, and accurate algorithm to estimate large phylogenies by maximum likelihood. Syst. Biol. 52, 696–704. doi: 10.1080/10635150390235520
Howe, K., Clark, M. D., Torroja, C. F., Torrance, J., Berthelot, C., Muffato, M., et al. (2013). The zebrafish reference genome sequence and its relationship to the human genome. Nature 496, 498–503. doi: 10.1038/nature12111
Hughes, L. C., Ortí, G., Huang, Y., Sun, Y., Baldwin, C. C., Thompson, A. W., et al. (2018). Comprehensive phylogeny of ray-finned fishes (Actinopterygii) based on transcriptomic and genomic data. Proc. Natl. Acad. Sci. U.S.A. 115, 6249–6254. doi: 10.1073/pnas.1719358115
Hunter, S., Apweiler, R., Attwood, T. K., Bairoch, A., Bateman, A., Binns, D., et al. (2009). InterPro: the integrative protein signature database. Nucleic Acids Res. 37, D211–D215. doi: 10.1093/nar/gkn785
IUCN (1998). IUCN Guidelines for Re-introductions. Gland: IUCN/SSC Re-introduction Specialist Group.
Janert, P. K. (2010). Gnuplot in Action: Understanding Data with Graphs. Greenwich, CT: Manning Publications.
Jiang, Z., Jiang, J., Wang, Y., Zhang, E., Zhang, Y., Li, L., et al. (2016). Red list of China’s vertebrates. Biodiver. Sci. 24, 500–551. doi: 10.17520/biods.2016076
Jurka, J., Kapitonov, V. V., Pavlicek, A., Klonowski, P., Kohany, O., and Walichiewicz, J. (2005). Repbase update, a database of eukaryotic repetitive elements. Cytogenet. Genome Res. 110, 462–467. doi: 10.1159/000084979
Kajitani, R., Toshimoto, K., Noguchi, H., Toyoda, A., Ogura, Y., Okuno, M., et al. (2014). Efficient de novo assembly of highly heterozygous genomes from whole-genome shotgun short reads. Genome Res. 24, 1384–1395. doi: 10.1101/gr.170720.113
Kalinowski, S. T., Taper, M. L., and Marshall, T. C. (2007). Revising how the computer program CERVUS accommodates genotyping error increases success in paternity assignment. Mol. Ecol. 16, 1099–1106. doi: 10.1111/j.1365-294X.2007.03089.x
Kanehisa, M., and Goto, S. (2000). KEGG: kyoto encyclopedia of genes and genomes. Nucleic Acids Res. 28, 27–30. doi: 10.1093/nar/28.1.27
Kasahara, M., Naruse, K., Sasaki, S., Nakatani, Y., Qu, W., Ahsan, B., et al. (2007). The medaka draft genome and insights into vertebrate genome evolution. Nature 447, 714–719. doi: 10.1038/nature05846
Koboldt, D. C., Steinberg, K. M., Larson, D. E., Wilson, R. K., and Mardis, E. R. (2013). The next-generation sequencing revolution and its impact on genomics. Cell 155, 27–38. doi: 10.1016/j.cell.2013.09.006
Koressaar, T., and Remm, M. (2007). Enhancements and modifications of primer design program Primer3. Bioinformatics 23, 1289–1291. doi: 10.1093/bioinformatics/btm091
Letunic, I., Copley, R. R., Schmidt, S., Ciccarelli, F. D., Doerks, T., Schultz, J., et al. (2004). SMART 4.0: towards genomic data integration. Nucleic Acids Res. 32, D142–D144. doi: 10.1093/nar/gkh088
Li, H., and Durbin, R. (2009). Fast and accurate short read alignment with Burrows-Wheeler transform. Bioinformatics 25, 1754–1760. doi: 10.1093/bioinformatics/btp324
Li, H., and Durbin, R. (2011). Inference of human population history from individual whole-genome sequences. Nature 475, 493–496. doi: 10.1038/nature10231
Li, H., Handsaker, B., Wysoker, A., Fennell, T., Ruan, J., Homer, N., et al. (2009). The sequence alignment/map format and SAMtools. Bioinformatics 25, 2078–2079. doi: 10.1093/bioinformatics/btp352
Li, R., Yu, C., Li, Y., Lam, T. W., Yiu, S. M., Kristiansen, K., et al. (2009). SOAP2: an improved ultrafast tool for short read alignment. Bioinformatics 25, 1966–1967. doi: 10.1093/bioinformatics/btp336
Li, M. (2015). The status, problems and developmental strategies of artificial breeding of Anabarilius grahami in Fuxian Lake. Primary Agric. Tech. Exten. 3, 86–88.
Li, Z., Chen, Y., and Yang, J. (2003a). Reason of population degradation and biology of Anabarilius grahami Regan. Freshw. Fish. 33, 26–27.
Li, Z., Chen, Y., Yang, J., Zhang, P., and Huang, M. (2003b). The artificial hatching of fish egges and fingerlings cultivation of Anabarilius grahami. Freshw. Fish. 33, 29–31.
Liu, B., Shi, Y., Yuan, J., Hu, X., Zhang, H., Li, N., et al. (2013). Estimation of genomic characteristics by analyzing k-mer frequency in de novo genome projects. Quant. Biol. 35, 62–67.
Liu, S., Hou, W., Sun, T., Xu, Y., Li, P., Yue, B., et al. (2017). Genome-wide mining and comparative analysis of microsatellites in three macaque species. Mol. Genet. Genomics 292, 537–550. doi: 10.1007/s00438-017-1289-1
Liu, S. W., Chen, X. Y., and Yang, J. X. (2009). Threatened fishes of the world: Anabarilius grahami Regan, 1908 (Cyprinidae). Environ. Biol. Fish. 86:399. doi: 10.1007/s10641-009-9529-9
Liu, Z., Liu, S., Yao, J., Bao, L., Zhang, J., Li, Y., et al. (2016). The channel catfish genome sequence provides insights into the evolution of scale formation in teleosts. Nat. Commun. 7:11757. doi: 10.1038/ncomms11757
Ma, L., Pan, X., Wei, Y., Li, Z., Li, C., Yang, J., et al. (2008). Embryonic stages and eye-specific gene expression of the local cyprinoid fish Anabarilius grahami in Fuxian Lake, China. J. Fish Biol. 73, 1946–1959. doi: 10.1111/j.1095-8649.2008.01998.x
Mayden, R. L., Chen, W.-J., Bart, H. L., Doosey, M. H., Simons, A. M., Tang, K. L., et al. (2009). Reconstructing the phylogenetic relationships of the earth’s most diverse clade of freshwater fishes—order Cypriniformes (Actinopterygii: Ostariophysi): a case study using multiple nuclear loci and the mitochondrial genome. Mol. Phylogenet. Evol. 51, 500–514. doi: 10.1016/j.ympev.2008.12.015
McGaugh, S. E., Gross, J. B., Aken, B., Blin, M., Borowsky, R., Chalopin, D., et al. (2014). The cavefish genome reveals candidate genes for eye loss. Nat. Commun. 5:5307. doi: 10.1038/ncomms6307
Mount, D. W. (2007). Using the basic local alignment search tool (BLAST). CSH Protoc 2007:pdb.top17. doi: 10.1101/pdb.top17
Nelson, J. S., Grande, T. C., and Wilson, M. V. (2016). Fishes of the World. Hoboken, NJ: John Wiley & Sons. doi: 10.1002/9781119174844
Qin, J., Xu, J., and Xie, P. (2007). Diet overlap between the endemic fish Anabarilius grahami (Cyprinidae) and the exotic noodlefish neosalanx taihuensis (Salangidae) in Lake Fuxian, China. J. Freshw. Ecol. 22, 365–370. doi: 10.1080/02705060.2007.9664165
Ronquist, F., and Huelsenbeck, J. P. (2003). MrBayes 3: bayesian phylogenetic inference under mixed models. Bioinformatics 19, 1572–1574. doi: 10.1093/bioinformatics/btg180
Rousset, F. (2008). genepop’007: a complete re-implementation of the genepop software for Windows and Linux. Mol. Ecol. Resour. 8, 103–106. doi: 10.1111/j.1471-8286.2007.01931.x
Sharma, R., Kumar, B., Arora, R., Ahlawat, S., Mishra, A., and Tantia, M. (2016). Genetic diversity estimates point to immediate efforts for conserving the endangered Tibetan sheep of India. Meta Gene 8, 14–20. doi: 10.1016/j.mgene.2016.01.002
Simao, F. A., Waterhouse, R. M., Ioannidis, P., Kriventseva, E. V., and Zdobnov, E. M. (2015). BUSCO: assessing genome assembly and annotation completeness with single-copy orthologs. Bioinformatics 31, 3210–3212. doi: 10.1093/bioinformatics/btv351
Stanke, M., Keller, O., Gunduz, I., Hayes, A., Waack, S., and Morgenstern, B. (2006). AUGUSTUS: ab initio prediction of alternative transcripts. Nucleic Acids Res. 34, W435–W439. doi: 10.1093/nar/gkl200
Stoll, A., Harpke, D., Schütte, C., Stefanczyk, N., Brandt, R., Blattner, F. R., et al. (2017). Development of microsatellite markers and assembly of the plastid genome in Cistanthe longiscapa (Montiaceae) based on low-coverage whole genome sequencing. PLoS One 12:e0178402. doi: 10.1371/journal.pone.0178402
Stout, C. C., Tan, M., Lemmon, A. R., Lemmon, E. M., and Armbruster, J. W. (2016). Resolving Cypriniformes relationships using an anchored enrichment approach. BMC Evol. Biol. 16:244. doi: 10.1186/s12862-016-0819-5
Tang, Z., Wang, Z., Zheng, C., and Fang, J. (2006). Biodiversity in China’s mountains. Front. Ecol. Environ. 4:347–352. doi: 10.1890/1540-92952006004
Tao, W., Zou, M., Wang, X., Gan, X., Mayden, R. L., and He, S. (2010). Phylogenomic analysis resolves the formerly intractable adaptive diversification of the endemic clade of east Asian Cyprinidae (Cypriniformes). PLoS One 5:e13508. doi: 10.1371/journal.pone.0013508
Tarailo-Graovac, M., and Chen, N. (2009). Using RepeatMasker to identify repetitive elements in genomic sequences. Curr. Protoc. Bioinform. 4:Unit4.10. doi: 10.1002/0471250953.bi0410s25
Thomas, P. D., Kejariwal, A., Campbell, M. J., Mi, H., Diemer, K., Guo, N., et al. (2003). PANTHER: a browsable database of gene products organized by biological function, using curated protein family and subfamily classification. Nucleic Acids Res. 31, 334–341. doi: 10.1093/nar/gkg115
Tollington, S., Jones, C. G., Greenwood, A., Tatayah, V., Raisin, C., Burke, T., et al. (2013). Long-term, fine-scale temporal patterns of genetic diversity in the restored Mauritius parakeet reveal genetic impacts of management and associated demographic effects on reintroduction programmes. Biol. Conserv. 161, 28–38. doi: 10.1016/j.biocon.2013.02.013
Trapnell, C., Pachter, L., and Salzberg, S. L. (2009). TopHat: discovering splice junctions with RNA-Seq. Bioinformatics 25, 1105–1111. doi: 10.1093/bioinformatics/btp120
Trapnell, C., Williams, B. A., Pertea, G., Mortazavi, A., Kwan, G., van Baren, M. J., et al. (2010). Transcript assembly and quantification by RNA-Seq reveals unannotated transcripts and isoform switching during cell differentiation. Nat. Biotechnol. 28, 511–515. doi: 10.1038/nbt.1621
Van Dijk, E. L., Auger, H., Jaszczyszyn, Y., and Thermes, C. (2014). Ten years of next-generation sequencing technology. Trends Genet. 30, 418–426. doi: 10.1016/j.tig.2014.07.001
Van Oosterhout, C., Hutchinson, W. F., Wills, D. P., and Shipley, P. (2004). MICRO-CHECKER: software for identifying and correcting genotyping errors in microsatellite data. Mol. Ecol. Notes 4, 535–538. doi: 10.1111/j.1471-8286.2004.00684.x
Wang, X., Gan, X., Li, J., Mayden, R. L., and He, S. (2012). Cyprinid phylogeny based on Bayesian and maximum likelihood analyses of partitioned data: implications for Cyprinidae systematics. Sci. China Life Sci. 55, 761–773. doi: 10.1007/s11427-012-4366-z
Wang, X., Li, J., and He, S. (2007). Molecular evidence for the monophyly of East Asian groups of Cyprinidae (Teleostei: Cypriniformes) derived from the nuclear recombination activating gene 2 sequences. Mol. Phylogenet. Evol. 42, 157–170. doi: 10.1016/j.ympev.2006.06.014
Wang, Y., Lu, Y., Zhang, Y., Ning, Z., Li, Y., Zhao, Q., et al. (2015). The draft genome of the grass carp (Ctenopharyngodon idellus) provides insights into its evolution and vegetarian adaptation. Nat. Genet. 47, 625–631. doi: 10.1038/ng.3280
Xiong, F., Li, W., Pan, J., Li, A., and Xia, T. (2006). Status and changes of fish resources in Lake Fuxian, Yunnan Province. J. Lake Sci. 18, 305–311. doi: 10.18307/2006.0318
Xu, P., Zhang, X., Wang, X., Li, J., Liu, G., Kuang, Y., et al. (2014). Genome sequence and genetic diversity of the common carp, cyprinus carpio. Nat. Genet. 46, 1212–1219. doi: 10.1038/ng.3098
Xu, Z., and Wang, H. (2007). LTR_FINDER: an efficient tool for the prediction of full-length LTR retrotransposons. Nucleic Acids Res. 35, W265–W268. doi: 10.1093/nar/gkm286
Yang, J. (1992). Origin and evolution of some biological characters of Anabarilius grahami as referred to geological development of Fuxian Lake. Zool. Res. 13, 353–360.
Yang, J. (1994). The biological characters of fishes of Fuxian Lake, Yunnan, with comments on their adaptations to the lacustrine environments. Zool. Res. 15, 1–9.
Yang, J., Chen, X., Bai, J., Fang, D., Qiu, Y., Jiang, W., et al. (2016). The Sinocyclocheilus cavefish genome provides insights into cave adaptation. BMC Biol. 14:1. doi: 10.1186/s12915-015-0223-4
Yang, L., Sado, T., Hirt, M. V., Pasco-Viel, E., Arunachalam, M., Li, J., et al. (2015). Phylogeny and polyploidy: resolving the classification of cyprinine fishes (Teleostei: Cypriniformes). Mol. Phylogenet. Evol. 85, 97–116. doi: 10.1016/j.ympev.2015.01.014
Keywords: genome sequencing, population history, SSR, plateau fish, Cyprinidae
Citation: Jiang W, Qiu Y, Pan X, Zhang Y, Wang X, Lv Y, Bian C, Li J, You X, Chen J, Yang K, Yang J, Sun C, Liu Q, Cheng L, Yang J and Shi Q (2018) Genome Assembly for a Yunnan-Guizhou Plateau “3E” Fish, Anabarilius grahami (Regan), and Its Evolutionary and Genetic Applications. Front. Genet. 9:614. doi: 10.3389/fgene.2018.00614
Received: 26 July 2018; Accepted: 21 November 2018;
Published: 04 December 2018.
Edited by:
Lior David, Hebrew University of Jerusalem, IsraelReviewed by:
Chuanju Dong, Henan Normal University, ChinaJie Mei, Huazhong Agricultural University, China
Copyright © 2018 Jiang, Qiu, Pan, Zhang, Wang, Lv, Bian, Li, You, Chen, Yang, Yang, Sun, Liu, Cheng, Yang and Shi. This is an open-access article distributed under the terms of the Creative Commons Attribution License (CC BY). The use, distribution or reproduction in other forums is permitted, provided the original author(s) and the copyright owner(s) are credited and that the original publication in this journal is cited, in accordance with accepted academic practice. No use, distribution or reproduction is permitted which does not comply with these terms.
*Correspondence: Le Cheng, Y2hlbmdsZUBnZW5vbWljcy5jbg== Junxing Yang, eWFuZ2p4QG1haWwua2l6LmFjLmNu Qiong Shi, c2hpcWlvbmdAZ2Vub21pY3MuY24=
†These authors have contributed equally to this work