 Zhu Bin
 Pan Qi2†
 Cai Bowei
 Ge Xianhong
 Li Zaiyun
- 1School of Life Sciences, Guizhou Normal University, Guiyang, China
- 2National Key Laboratory of Crop Genetic Improvement, National Center of Oil Crop Improvement, College of Plant Science and Technology, Huazhong Agricultural University, Wuhan, China
- 3Research Center of Buckwheat Industry Technology, Guizhou Normal University, Guiyang, China
Establishing the whole set of aneuploids, for one naturally evolved allopolyploid species, provides a unique opportunity to elucidate the transcriptomic response of the constituent subgenomes to serial aneuploidy. Previously, the whole set of monosomic alien addition lines (MAALs, C1-C9) with each of the nine C subgenome chromosomes, added to the extracted A subgenome, was developed in the context of the allotetraploid Brassica napus donor “Oro,” after the restitution of the ancestral B. rapa (RBR Oro) was realized. Herein, transcriptomic analysis using high-throughput technology was conducted to detect gene expression alterations in these MAALs and RBR. Compared to diploid RBR, the genes of all of the MAALs showed various degrees of dysregulated expressions that resulted from cis effects and more prevailing trans effects. In addition, the trans-effect on gene expression in MAALs increased with higher levels of homology between the recipient A subgenome and additional C subgenome chromosomes, instead of gene numbers of extra chromosomes. A total of 10 trans-effect dysregulated genes, among all pairwise comparisons, were mainly involved in the function of transporter activity. Furthermore, highly expressed genes were more prone to downregulation and vice-versa, suggesting a common trend for transcriptional pattern responses to aneuploidy. These results provided a comprehensive insight of the impact of gene expression of individual chromosomes, in one subgenome, on another intact subgenome for one allopolyploid with a long evolutionary history.
Introduction
As a deviation from the normal genome, by either gaining or losing entire chromosomes or chromosomal segments, aneuploidy disrupts the genome balance, which generally results in profoundly and severely impaired phenotypes (Antonarakis et al., 2004; Birchler and Veitia, 2007; Huettel et al., 2008; Henry et al., 2010; Siegel and Amon, 2012; Zhu et al., 2015). Some syndromes and diseases, which lead to severe developmental defects and even death in humans, have been associated with variants of entire chromosomes or chromosomal segments (Antonarakis et al., 2004; Morrow, 2010), such as trisomy 21 (Down syndrome) (Letourneau et al., 2014). Moreover, typical chromosomal structural changes, which occur extensively in the majority of solid tumor cells, are believed to induce tumor development (Matzke et al., 2003; Sheltzer and Amon, 2011; Gordon et al., 2012). Since aneuploid studies that involve a single or few chromosomes are limited, genome-wide transcriptional response patterns to aneuploidy remains unclear. Next-generation sequencing, which has been extensively applied to transcriptional analysis, provides a robust means to elucidate gene expression in aneuploid organisms.
Researchers initially believed that phenotypic consequences of aneuploidy are mainly influenced by gene dosage effects of altered chromosomes, which is supported by the correlation between chromosome copy numbers and relative gene expression levels in Down syndrome (Mao et al., 2003), aneuploid yeast (Torres et al., 2008), as well as various types of cancer cells (Gao et al., 2007; Xu et al., 2010; Lu et al., 2011). However, studies on aneuploids in Drosophila and plants showed that changes in the gene expression levels were observed along altered copy numbers (cis-effects) as well as in unaltered disomic chromosomes (trans-effects) (Guo and Birchler, 1994; Birchler and Veitia, 2007; Huettel et al., 2008; Malone et al., 2012; Zhu et al., 2015, 2018; Zhang et al., 2017; Rey et al., 2018). In addition, the phenotypic consequences of aneuploidy are believed to result from either the contribution of altered dosages or the impact of a genome imbalance involving the rest of the genome (Guo and Birchler, 1994; Birchler and Veitia, 2007). Aneuploids exhibit a more severe degree of perturbation in gene expression than changes in ploidy (Birchler and Newton, 1981; Guo et al., 1996), indicating a disruption in the dosage-sensitive gene products (Birchler et al., 2001; Henry et al., 2006).
Plants have better tolerance to chromosomal changes than animals do (Siegel and Amon, 2012). The frequency of aneuploidy increases in polyploids, and the whole set of aneuploids with the loss of each chromosome was established in allohexaploid wheat (Sears, 1954), which may be attributed to a significantly higher capacity to buffer dosage imbalance. Moreover, the aneuploidy with whole-chromosome and structural alterations extensively occurs in nascent allopolyploids (Mestiri et al., 2010; Xiong et al., 2011; Chester et al., 2012; Zhang et al., 2013), implying that aneuploidy is a continuously occurring process until a stable polyploid status is attained. Recent studies have suggested that aneuploidy serves as a rapid mechanism for the adaptation to rare cases of strong selective pressure (Pavelka et al., 2010; Siegel and Amon, 2012).
The whole set of aneuploids in one species is of great value to elucidate the genome structure, relationships and functional interplay from a classical genetic analysis to genome sequencing (Sears, 1954; Mayer et al., 2014; Zhang et al., 2017). However, the establishment of a complete stock of aneuploids is relatively time consuming and has only been achieved for a few species, such as bread wheat (Sears, 1954) and tobacco (Clausen and Cameron, 1944). The allotetraploid Brassica napus L. (2n = 4x = 38, AACC), which originated only 7500 years ago from natural hybridization between the ancestors of two extant diploids, B. rapa L. (2n = 2x = 20, AA) and B. oleracea L. (2n = 2x = 18, CC) (Nagaharu, 1935; Chalhoub et al., 2014), has been used as a model system to investigate the genomic alterations and interactions during allopolyploidization (Albertin et al., 2006; Szadkowski et al., 2010; Zhang et al., 2015). In particular, the ancestral B. rapa (RBR Oro) was restituted from natural B. napus genotype “Oro” by successively inducing the preferential elimination of the C subgenome chromosomes in intertribal crosses with another crucifer (Tu et al., 2010). Then, by crossing and backcrossing RBR Oro with B. napus donor “Oro,” the C subgenome was dissected in situ by adding each of its nine chromosomes to RBR Oro and establishing the whole set of B. rapa-oleracea monosonic alien addition lines (MAALs) (Zhu et al., 2016). These MAALs, with the genetic context of the same natural B. napus, provide a unique avenue to decipher the gene expression interaction of two constituent subgenomes under aneuploidy situations.
In view of this, we performed a RNA-Seq to detect the changes in the global gene expression in these nine MAALs, compared to RBR Oro, to reveal transcriptional aneuploidy response patterns associated with the disomic A subgenome chromosomes. The results of this study provide new insights into the impact of individual chromosomes, from one subgenome on another complete subgenome, for one natural allopolyploid.
Materials and Methods
Plant Materials
The ancestral B. rapa (RBR Oro) was restituted from a natural B. napus cultivar “Oro,” by inducing the preferential elimination of the C subgenome chromosomes in intertribal crosses between B. napus and another crucifer Isatis indigotica (Tu et al., 2010). Then, a complete set of nine B. rapa-oleracea MAALs (2n = 21, AA+1C1-9) was established to dissect the C subgenome in the A subgenome background through crossing and successive backcrossing between Oro and RBR Oro (Zhu et al., 2016), which was designed, for convenience, as C1-C9. Due to severe self-incompatibility and variable transmission rates of extra chromosomes in MAALs, MAALs plants were pollinated by RBR Oro to generate sufficient progeny seeds. Seedlings were grown in the greenhouse at the Huazhong Agriculture University (Wuhan, China). Fifty progeny plants were established for C1, C2, C3, C5–C8, respectively, and 100 plants for MAALs C4 and C9, due to the much lower transmission rate of these two C subgenome chromosomes via female gametes (Zhu et al., 2016). At least six additional progeny plants for each of the nine MAALs were identified for further analysis.
To screen the additional plants with extra chromosomes of the C subgenome, these progeny plants were first investigated by PCR amplification of the chromosome-specific gene markers that were distributed on both arms of the target chromosomes, and 6 to 21 target plants were identified. Then, a chromosome counting and fluorescence in situ hybridization (FISH) analysis with the C subgenome-specific probe (Zhu et al., 2016) was conducted to determine the karyotype integrity of the target plants (Supplementary Figure S1). The ovaries of young flower buds were collected and treated with 2 mM 8-hydroxyquinoline for 3 h at ∼20°C, and then fixed in Carnoy’s solution (3:1 ethanol: glacial acetic acid, v/v) and stored at -20°C for cytological analysis. A cytological observation and FISH analysis was conducted according to Li et al. (1995) and Cui et al. (2012), respectively.
RNA Extraction and Preparation of cDNA Libraries
Since there were minimal phenotypic differences between RBR and MAAL plants at the three-leaf stage, the third newly expanded leaves, without petioles, from target plants were collected and immediately stored in liquid nitrogen for RNA extraction. Three biological replicates, per MAAL and RBR Oro, were prepared to assess gene expression. Briefly, young leaves from two target plants per MAAL were pooled equally and ground in liquid nitrogen. Total RNA was extracted using a commercial RNA kit (Tiangen, China) according to the manufacturer’s protocol. The quality and quantity of the isolated RNA was assessed using a Qubit (Invitrogen, Life Technologies), and the RNA integrity number (RIN) was then assessed with an Agilent Technologies 2100 Bioanalyzer (Agilent). Samples with RIN < 8 were excluded from further analysis. For the cDNA library construction, 1.5 μg of total RNA per biological replicate was prepared according to the TruSeq RNA Sample Prep v2 protocol (Illumina). Subsequently, 30 libraries were sequenced on an Illumina HiSeqTM 3000 platform (Illumina), to generate 150-bp paired-end reads. The raw sequence data were subjected to data quality control checks based on per base sequence quality scores, per sequence quality scores, per sequence GC content, sequence length distribution, and overrepresented sequences, which are implemented in the FastQC1.
Differentially Expressed Genes (DEGs) Analysis
Trimmomatic version 0.332 (Bolger et al., 2014) was used to remove adapters and low-quality reads, to generate clean reads with the following parameters: LEADING: 3, TRAILING: 3, SLIDINGWINDOW: 4:15, MINLEN: 36, LEADING: 3, TRAILING: 3, SLIDINGWINDOW: 4:15, MINLEN: 36, and TOPHRED: 33. Clean reads were then aligned to the B. napus reference genome with 101,040 predicted genes3 (Chalhoub et al., 2014) using HISAT version 0.1.64 (Kim et al., 2015). Considering the homologous regions between the A sub-genome and by adding chromosomes of the C subgenome, we performed a strict mismatch tolerance (one-base mismatch) to determine the affiliation of these clean reads according to the following criterion: specifying -L, 0, -0.15, and only using the uniquely mapped reads, in gene expression profiling. The fragments per kilobase per million mapped reads (FPKM) value was calculated using Cufflinks version 2.2.15 with default parameters (-p -G –multi-read-correct) to assess gene expression (Trapnell et al., 2012). To identify differences in gene expression between MAALs and euploid RBR Oro, the package of Deseq2 in the R-project version 3.4.36, with a fold change of at least 2 in the gene expression and false discovery rate of q < 0.05 (Trapnell et al., 2013), was employed to identify DEGs. Because one replicate for C3 and C8 showed a low pairwise correlation coefficient (0.44 and 0.67 in C3, 0.47 and 0.65 in C8) with the remaining two replicates, respectively, only two replicates for C3 and C8 were performed to calculate the DEGs. For GO enrichment, because of the lack of gene annotation information in B. napus, we used Blast2GO7 to retrieve the B. napus GO annotation file, by searching the protein database of the GenBank (Conesa et al., 2005). The gene ontology (GO) enrichment analysis was then performed by hypergeometric distribution in R, with an adjusted p-value under 0.05 as a cutoff, to determine significantly enriched GO terms (Conesa et al., 20058). Another tool for GO analysis, AgBase GoAnna version 2.009 (McCarthy et al., 2006) was used to annotate the co-regulated trans-effected DEGs (adjusted p < 0.05).
Data Statistics and Visualization
To check the statistical significance of the dysregulated expression between each MAAL vs. RBR Oro, a Chi-square test was used with a 0.05 q-value as the cutoff. To determine whether the trans-acting effects on gene expression were associated with the gene number of extra chromosomes, Pearson correlation coefficient (PCC) with an FDR-adjusted p-value < 0.05 as the cutoff was used. To check whether the different expression levels of the genes were similarly impacted by these extra chromosomes of the C subgenome, a Wilcoxon signed-rank test was used with 0.05 q-value as the cutoff. Statistical analyses were conducted using the R-project. All of the RNA-Seq data, including raw data and process documentation used in this study is available at the Gene Expression Omnibus (GEO), accession number GSE111510.
Fluorescence in situ hybridization images were captured using a computer-assisted fluorescence microscope with a CCD camera (Axio Scope A1, Zeiss, Oberkochen, Germany). Images of the gene expression analysis were generated by plotting functions of the R-project and then composed by Adobe Illustrator version CC.
Results
DEGs Between MAALs and RBR
After trimming, to remove adapters and low-quality reads (Q < 20), 7.04–14.76 million clean reads from each replicate were obtainestructural variants at the correspondingd (Supplementary Table S1). Since MAALs and RBR Oro were derived from one natural B. napus cultivar, the clean reads for all of the samples were aligned to the B. napus reference genome (Chalhoub et al., 2014). In total, 74.27-77.94% clean reads per replicate were obtained, which included 67.58-70.83% unique mapping reads and 6.33-7.83% multiple mapping reads (Supplementary Table S1). Due to the close relationship between the A and C subgenomes, or within the C subgenome chromosomes (Prakash et al., 2009; Chalhoub et al., 2014), a small proportion of the clean reads were aligned to the missing chromosomes in all MAALs and RBR Oro. To reduce the noise of homologous genes, these reads and multiple mapping reads were excluded from further analysis.
e DEseq2 package software was employed to determine DEGs. Compared to RBR Oro, 2,099–3,556 DEGs were identified in nine MAALs (Table 1). Briefly, RBR vs. C1 (3556 DEGs, 3.52%) and RBR vs. C4 (3430 DEGs, 3.39%) showed the highest and comparable DEGs (χ2 test, p = 0.128), followed by RBR vs. C7 (2,959 DEGs, 2.93%), RBR vs. C3 (2,660 DEGs, 2.63%), RBR vs. C2 (2,469 DEGs, 2.44%) and RBR vs. C5 (2,461 DEGs, 2.44%). RBR vs. C6 (2,177 DEGs, 2.15%), RBR vs. C8 (2114 DEGs, 2.09%), and RBR vs. C9 (2,099 DEGs, 2.08%) exhibited the lowest DEGs. Additionally, as expected, due to the existence of extra C subgenome chromosomes, the genes in the MAALs, except C1, remained upregulated (occupying 71.81-86.92% of DEGs) (χ2 test, p < 0.01). However, compared to RBR Oro, C1 presented a higher number of downregulated genes (1,895 DEGs vs. 1,661 DEGs) (χ2 test, p < 0.01), which indicated that the chromosomes of the A subgenome exhibit downregulated gene expression. The details on the DEGs in all pairwise comparisons are listed in Table 1.
Table 1. Summary of up- and down-regulated genes in all pairwise comparisons between RBR Oro and MAALs.
Pairwise Comparisons of Cis- and Trans-Effects on Gene Expression
In the present study, 14.76-60.78% of the DEGs were directly attributed to the extra chromosomes of the C subgenome (cis-effects), and the majority consisted of upregulated genes, primarily due to the genome dosage. However, several downregulated genes on additional chromosomes of the C subgenome were observed in eight MAALs, except for C7, probably as a result of the failure to distinguish noise caused by the high expression of their homeologs in RBR.
Furthermore, after DEGs in the additional chromosome were ruled out, all of the pairwise comparisons of each MAAL vs. RBR Oro indicated widespread trans-effected dysregulated genes, but at substantially variable magnitudes (Table 2). Briefly, 686–2,899 DEGs in the A subgenome of the MAALs (occupying 1.54-6.52% of all 44,452 assembled genes, representing 23.04-65.13% of total DEGs) were dysregulated. C1 showed the most widespread trans-effects with 2,899 DEGs (6.52% of the total 44,452 assembled genes), followed by C4 (1773 DEGs, 3.99% of the 44,452 assembled genes), C2 (1275 DEGs, 2.87% of the 44,452 assembled genes) and C7 (1147 DEGs, 2.58% of the 44,452 assembled genes), whereas the remaining five MAALs (C6, C5, C3, C8, and C9) exhibited lower but similar trans-effects (686–818 DEGs, occupying 1.54-1.84% of the 44,452 total number of assembled genes) (χ2 test, p < 0.001, Table 2).
Table 2. Cis-and trans-effected dysregulated genes in all pairwise comparisons between MAALs and RBR Oro.
Trans-Effect Dysregulation Genes Not Associated With the Gene Number of Extra Chromosomes, and Different Transcriptional Responses of Disomic Chromosomes to Aneuploidy
Analysis of the Pearson correlation coefficient (PCC) did not detect any correlations (R2 = 0.11, p = 0.39) between the number of genes along the additional C chromosomes and corresponding dysregulated genes on the A subgenome. Furthermore, no strong relationship between the expressed genes (FPKM > 0.1) of the extra chromosomes of the C subgenome and changes in gene expression profiles in the A subgenome, were observed (R2 = 0.27, p = 0.15). Inversely, the gene expression along each chromosome of the A subgenome was distinctly impacted by different additional chromosomes in MAALs, as the extent of the trans-effects on each of its 10 chromosomes, were uneven in all comparisons except for RBR vs. C3, and the genes on some chromosomes were more prone to transcriptional perturbation, indicating that the identity of additional chromosomes could affect gene expression throughout the A subgenome in a specific manner (Supplementary Table S2). However, MAAL C3 exhibited a similar change in the expression of genes in the A subgenome chromosomes (1.10-2.03% of the genes were dysregulated). To further test the relationship between trans-effects on the A subgenome and extra chromosomes of the C subgenome, we then calculated the PCC values of all of the genes in the A subgenome, between any two of the nine MAALs and RBR Oro, and screened for pairwise transcriptome differences (Supplementary Table S3). Compared with other MAALs, C1 always showed significantly lower pairwise correlation coefficients, followed by C2 (Supplementary Table S3). As the homoeologous pairs (A1/C1 and A2/C2) showed the most extensive homoeology, which could frequently be replaced and compensated (Xiong et al., 2011; Chalhoub et al., 2014), we concluded that a higher similarity between the additional chromosome and the recipient genome (chromosome) induced more severe changes in gene expression of the recipient genome.
The differential impacts of different additional chromosomes on gene expression in the A subgenome were also reflected by a hierarchical analysis of the similarities in terms of overall expression patterns (Figure 1A). The differences of a global average of all gene expressions showed that MAALs C1 and C2 were most divergent in the overall expression patterns from the rest, which was in line with the result of the pairwise PCC values. Furthermore, the two MAALs were clustered together into an independent group (Figure 1A). Box plots of all expressed gene profiles (FPKM > 0.1) on the recipient A subgenome, in all of the pairwise comparisons, showed that medians of the gene expressions in MAALs C1 and C2 were far from that in RBR Oro and other MAALs, confirming the observed divergence in gene expression (Figure 1B). In addition, the remaining seven MAALs and RBR Oro were divided into another group (Figure 1A). It was determined that MAAL C9 was closely related to RBR Oro and a subgroup was formed. It did however, exhibited a divergent phenotype from RBR Oro (Zhu et al., 2016).
Figure 1. Impact of different additional chromosomes on gene expression patterns in the A subgenome. (A) Hierarchical analysis of the global average of all of the gene expression differences in the A subgenome shows that different additional chromosomes result in distinct impacts on gene expression perturbation in the A subgenome, and a higher level of similarity of gene content between the remainder genome and the additional chromosome likely gives rise to greater divergence in gene expression. Two major groups of clusters are identified. (B) Box plot of gene expressions along the A subgenome (FPKM > 0.1) also demonstrates that the similarity between the remaining genome and the additional chromosome affects the gene expression levels of the A subgenome in MAALs. The dotted line represents the median of gene expression of the A subgenome in RBR. The y axis represents the log2(FPKM).
Another interesting result was that among these trans-effected DEGs in the pairwise comparisons of each MAAL vs. RBR Oro (Table 2), only the DEGs in RBR vs. C6 showed significantly enhanced expression (χ2 test, p < 0.01). Considering that C6 was the only MAAL that flowered earlier than RBR Oro (Zhu et al., 2016), we questioned whether flowering genes constituted a large fraction of genes that were found to be highly expressed. However, only three genes related to the flowering time in B. napus, from the public Brassica Database10 were dysregulated, including one downregulated (BnaA03g39820D) and two upregulated DEGs (BnaA01g15350D and BnaA07g13990D).
Putative Functions of Differently Regulated Gene Groups
To determine whether some core genes or biological pathways of the recipient A subgenome in MAALs responded to additional chromosomes, Venn diagrams were constructed to determine the specific DEGs and co-regulated DEGs. Due to the ambiguous results in one diagram and because of too many pairwise comparisons, the Venn diagrams were divided into four sections, including three groups based on the results of divergent gene expressions and one group comprising of the co-dysregulated genes from the former three groups (Supplementary Figure S2). Each pairwise comparison uniquely detected 22.80-46.29% of trans-effected DEGs (Figure 2). Among these pairwise comparisons, RBR vs. C1 had a significantly higher number of specific DEGs (1,342 DEGs, occupying 46.29% of trans-effected DEGs) (χ2 test, p = 2.60e-10), followed by RBR vs. C8 (225 DEGs, 32.80%), RBR vs. C6 (206 DEGs 31.54%), and RBR vs. C4 (504 DEGs, 28.43%), whereas the remaining five MAALs were within the lower ranges of 22.80-26.75%. However, only 10 trans-effected dysregulated genes, including one downregulated gene and nine upregulated genes, were always observed in all pairwise comparisons. These results indicate that, despite the uniformity of the global transcriptional aneuploidy response patterns, there was no significant overlap in individual dysregulated genes between different pairwise comparisons of each MAAL vs. RBR Oro. To elucidate whether these 10 co-dysregulated genes were involved in one or specific biological pathway(s), in response to the consequences of aneuploidy on gene expression, we annotated these co-dysregulated genes into the public Gene Ontology (GO) database. However, these genes failed to be clustered into any GO terms or KEGG pathways, probably due to the low number of genes used in the analysis. Therefore, we had to deduce the putative functions of the co-dysregulated genes (Table 3). According to their ortholog gene functions in A. thaliana, the upregulated DEGs were mainly involved in “copper ion binding,” “transporter activity,” as well as “protein transporter activity,” implying that MAALs responded to stress by increasing their levels of gene expression. In addition, the downregulated DEG was involved in “rRNA binding” and “structural constituent of ribosome,” which agreed with the reported decrease in protein synthesis in aneuploids (Sheltzer et al., 2012; Stingele et al., 2012).
Figure 2. Frequency of specific DEGs and co-regulated DEGs in the A subgenome in all pairwise comparisons. The red box represents the proportion of co-regulated trans-effect DEGs that are detected in at least two pairwise comparisons. The blue box represents the proportion of specific trans-effect DEGs uniquely observed in a comparison. The y axis represents the number of DEGs.
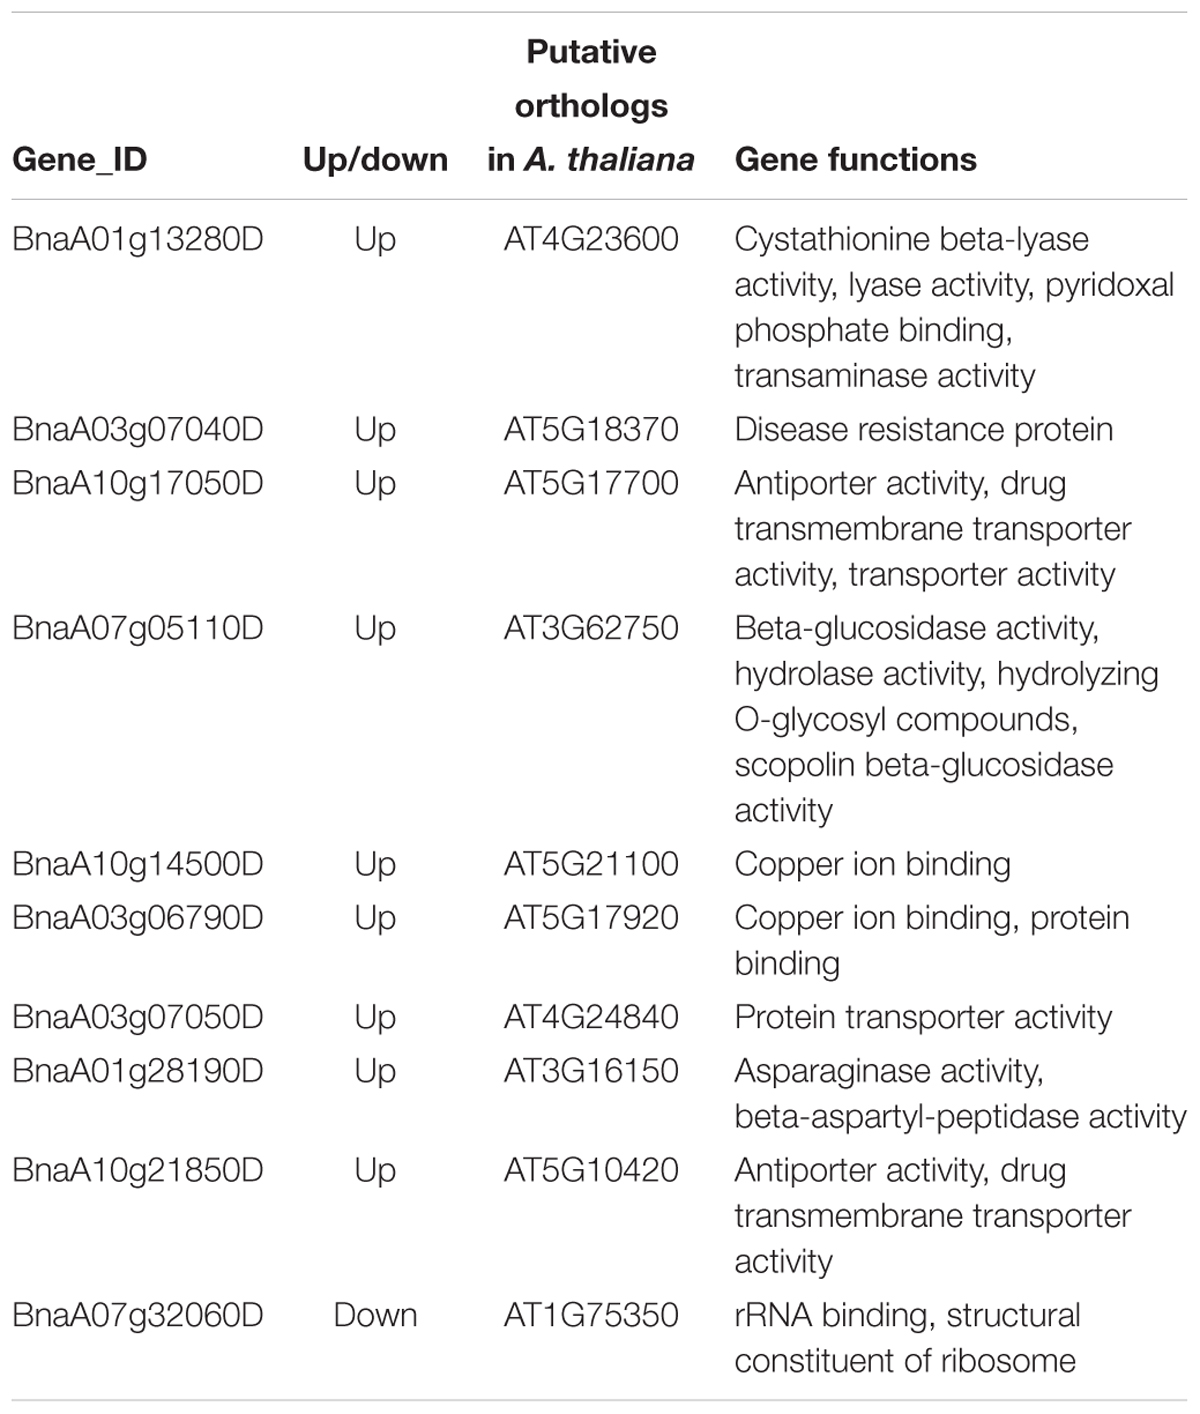
Table 3. The putative gene functions of co-dysregulated genes in all pairwise comparisons of MAALs vs. RBR Oro.
We then performed gene annotation to investigate the functions of specific and co-regulated DEGs that were detected in at least two pairwise comparisons in all pairwise comparisons, to reveal whether these different gene groups were involved in distinct or similar biological pathways. We found that 17 GO terms were enriched with these co-regulated DEG groups in all comparisons (p < 0.05, Figure 3A) and were mainly involved in responses to stress (all p < 0.0007), abiotic stimulus (all p < 5.91e-5) and oxidoreductase activity (all p < 0.003), particularly in the chloroplast (all p < 4.12e-8). As expected, the GO terms enriched by the specific DEGs for each pairwise comparison did not significantly overlap with each other. No GO terms that were enriched in all of the comparisons were observed, and very few terms were detected in most of the comparisons. Since DEGs that were often perturbed in many pairwise comparisons probably represented common features of aneuploidy, 650 trans-affected DEGs were identified in more than four pairwise comparisons. The AgBase GoAnna website tool was then employed to analyze the gene ontology annotation of these DEGs (McCarthy et al., 2006). The majority of GO terms (Figure 3B) enriched with these DEGs were associated with a photosynthetic process, such as “photosynthesis” (p < 3.81e-19), “photosynthesis, light harvesting” (p < 0.00015), “chloroplast” (p < 1.33e-47), and “chlorophyll binding” (p < 1.38e-5). The terms of “rRNA binding” (p < 0.05) and “ribosome” (p < 0.0027) were also detected, suggesting that additional C chromosomes generally had a consequence on protein synthesis. Altogether, these results indicated that dysregulated genes, in all comparisons belonging to distinct groups, were involved in diverse cellular pathways.
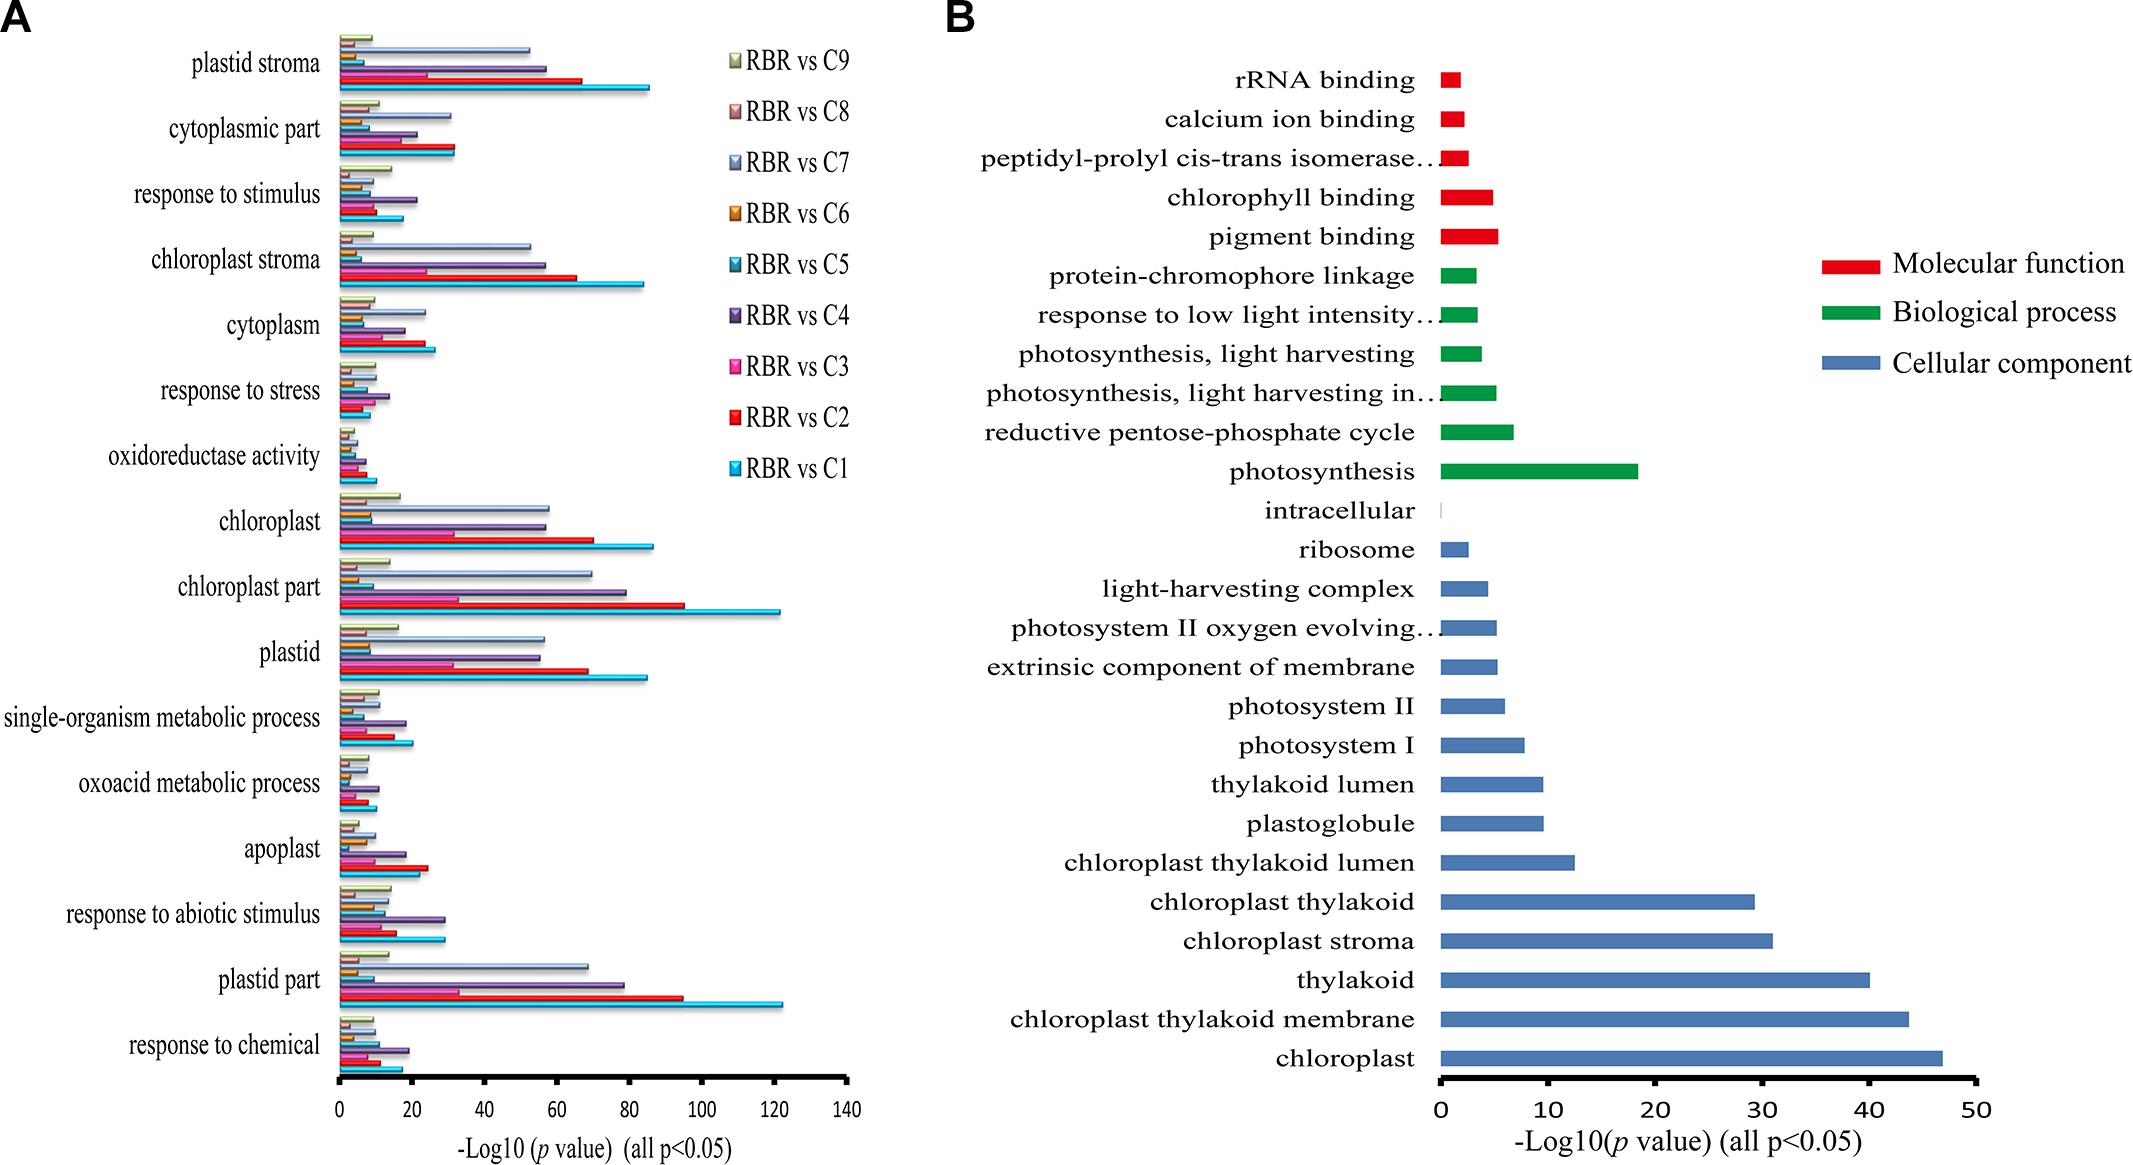
Figure 3. GO enrichments for co-regulated DEGs in all pairwise comparisons and DEGs identified in more than four comparisons. (A) A total of 17 GO terms that are particularly involved in biotic and abiotic stresses are enriched with DEGs in all pairwise comparisons (FDR, p < 0.05). The x axis represents the value of –log10(p-value). (B) GO analysis of DEGs that are identified in more than four pairwise comparisons exhibiting these DEGs are predominantly associated with photosynthetic process and protein synthesis. The x axis represents the value of –log10(p-value).
Highly Expressed Genes Are Prone to Downregulation and Lowly Expressed Genes to Upregulation
To analyze the transcriptional aneuploidy response patterns in MAALs, we detected whether the different expression levels of the genes were similarly impacted by these extra chromosomes of the C subgenome. Based on the gene expression level (FPKM > 0.1) in RBR Oro, we classified the genes of the A subgenome into three groups according to low (0.1 < FPKM < 10), medium (10 < FPKM < 100), and high (FPKM > 100) expression levels. About two thirds of the expressed genes (16,714 genes, representing 62.53% of the genes with RPKM > 0.1) belonged to the first group, nearly one third of these (8,699 genes, 32.55%) were in the medium expression level group, and relatively few genes (1,315 genes, 4.92%) were in the high expression level group. Compared to RBR Oro, the lowly expressed genes group gave rise to the lowest proportion of trans-effected DEGs (consisting of 1.58-7.04% of the total number of low expression genes with the average of 2.88%), indicating that the lowly expressed genes group was less susceptible to the impact of extra chromosomes of the C subgenome. Both the highly and moderately expressed genes exhibited escalating contributions to the trans-effected DEGs (comprising 3.03-13.39% of the medium-level expression genes with an average of 5.29% and occupying 5.78-36.2% of high expression genes with an average of 14.04%), suggesting that these genes were more prone to transcriptional perturbation in aneuploidy (Supplementary Table S4 and Figure 4A).
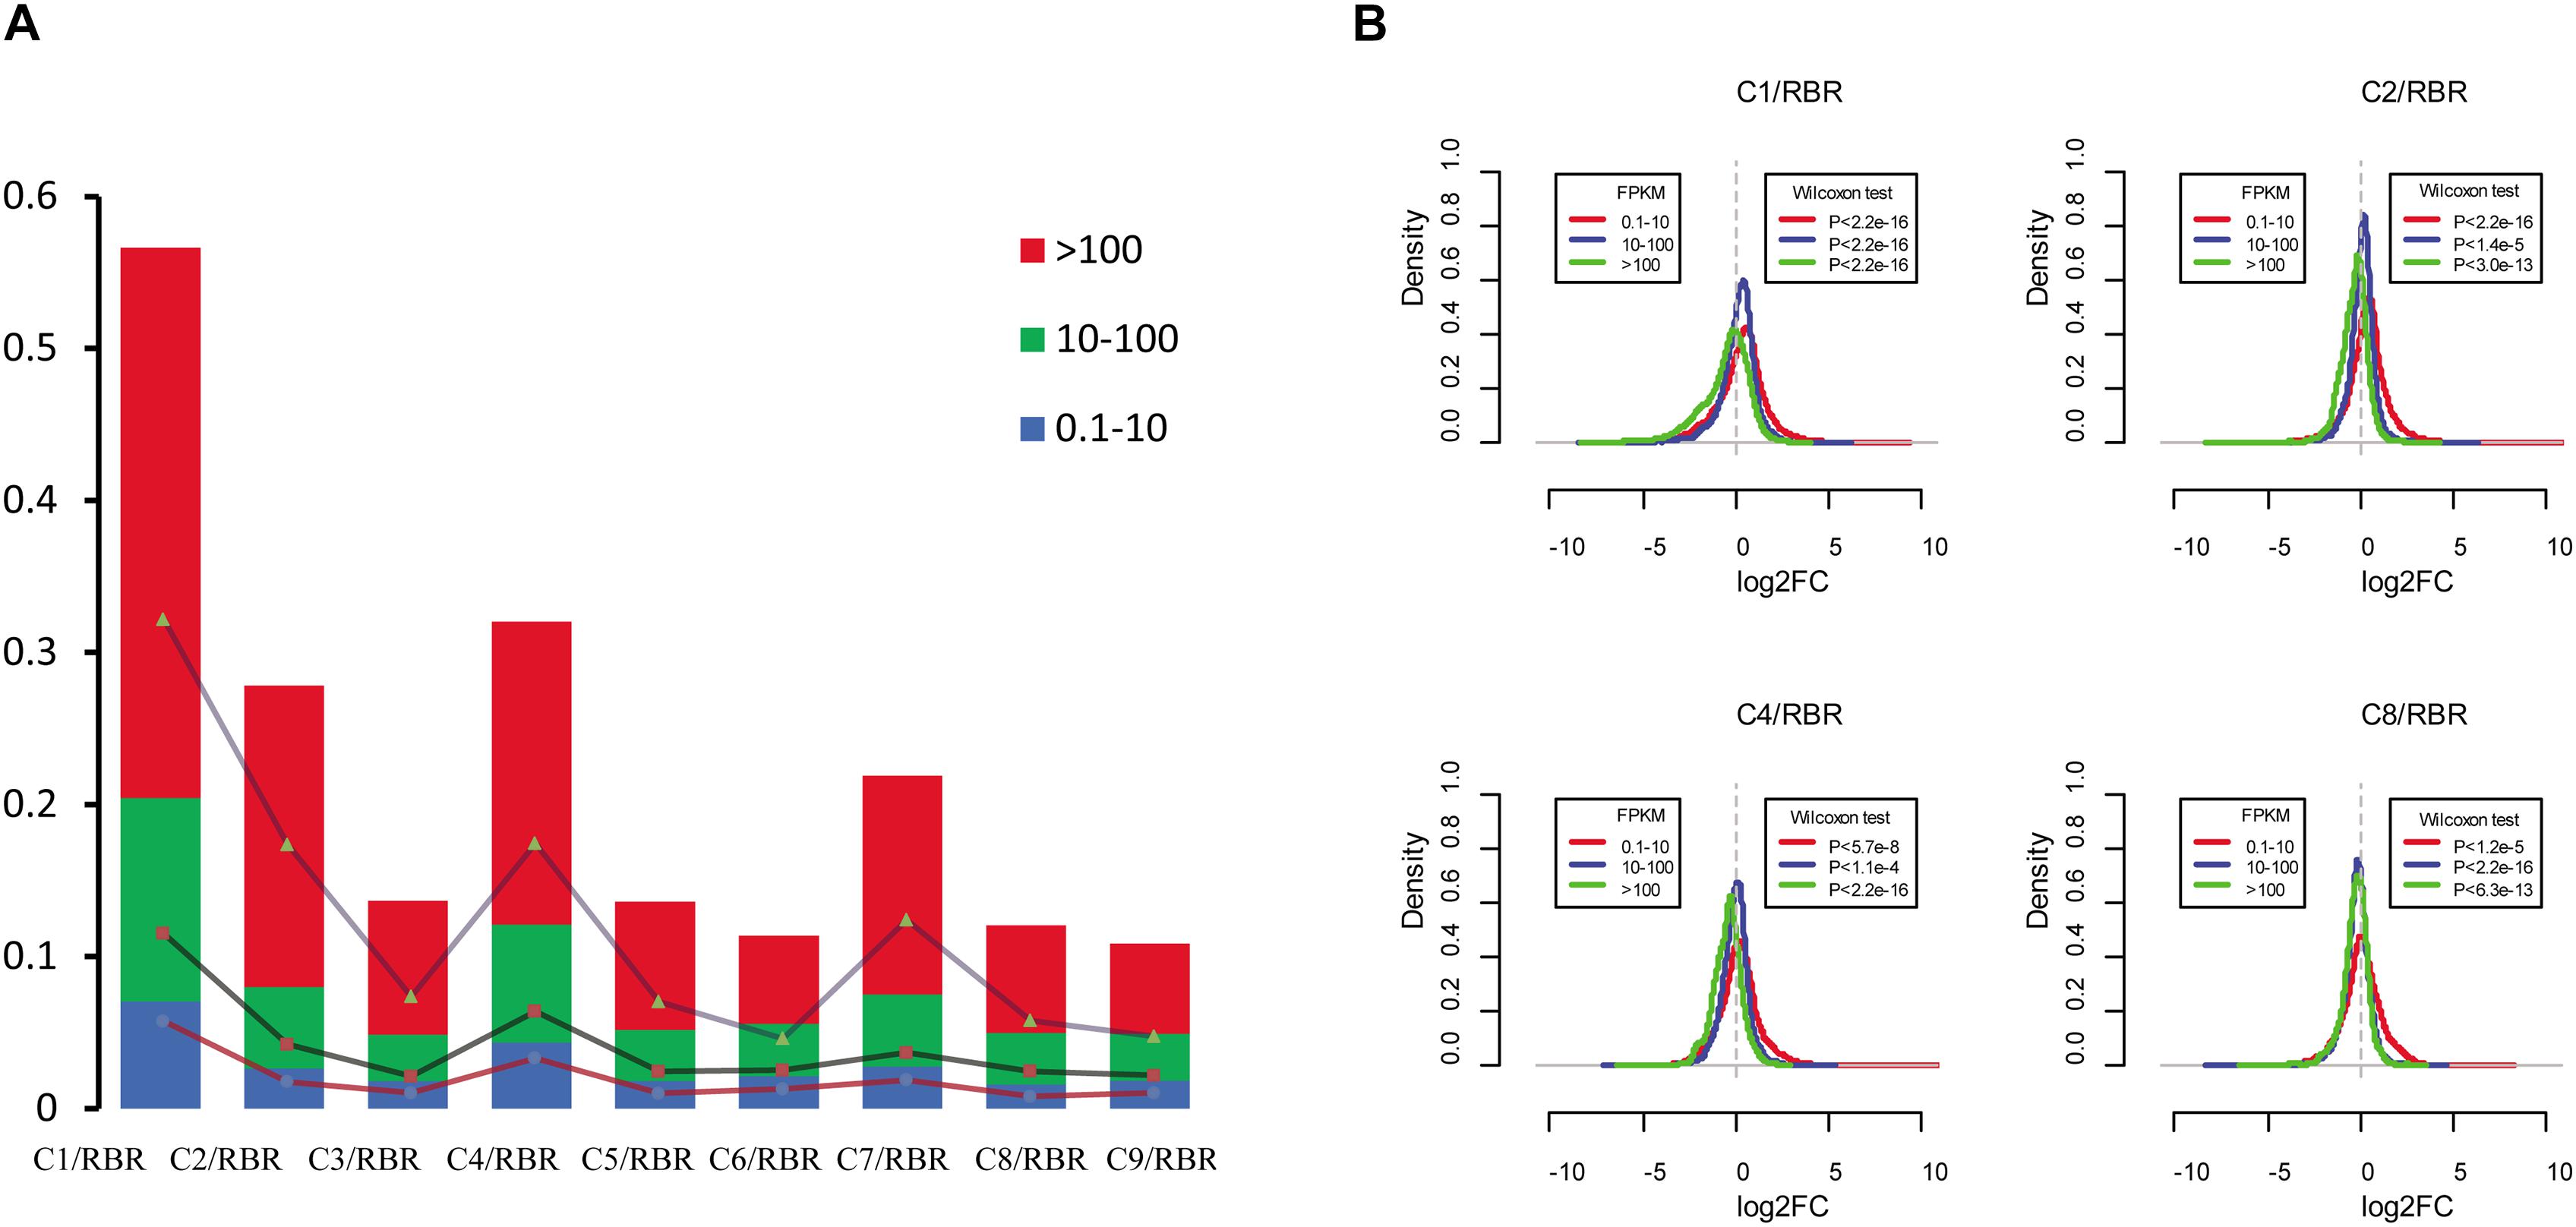
Figure 4. Impact of additional C subgenome chromosomes on changes in gene expression changes in the A subgenome. (A) Proportions of trans-effect DEGs in different gene expression levels. Based on the gene expression level, genes in the A subgenome are divided into three categories: low-expression level genes (0.1 < FPKM < 10), medium-expression level genes (10 < FPKM < 100), and high-expression level genes (FPKM > 100). For all pairwise comparisons, dysregulated genes consistently show the highest frequency in the high-expression level group, second in the medium-expression level group, and last in the low-expression level group. The y axis represents the frequency of the gene groups. (B) Frequency distribution of log2(fold change) in four MAALs indicate differences in transcriptional response patterns to aneuploidy in various gene expression groups. High-expression level genes are more prone to be downregulated while the opposite is true for low-expression level genes (Wilcoxon test, q < 0.05). The x axis represents the log2(fold-change) in gene expression levels between the MAALs and euploid RBR in three gene groups and the y axis represents frequency distribution of log2(fold-change).
Intriguingly, it was observed that upregulated genes predominantly accumulated in lowly expressed genes for all pairwise comparisons (χ2 test, p < 0.05), whereas the downregulated DEGs were more prevalent in the medium expression and the high expression level (χ2 test, p < 0.05) groups (Supplementary Table S4). These findings probably indicated some transcriptional patterns in response to extra chromosomes of the C subgenome. To substantiate this hypothesis, we compared the gene expression fold-change distributions of all of the pairwise comparisons for each group, with the expected distribution exhibited by RBR Oro (Supplementary Figure S3 and Figure 4B). As expected, the highly and moderately expressed genes (except in C7, Wilcoxon signed-rank test, p = 0.88) were generally biased toward the reduced expression in MAALs (all p < 0.05). However, the low expression level genes showed increased expression in all MAALs (Figure 4A). This result agreed with the observation that highly expressed genes contributed substantially to the downregulated and lowly expressed genes, mainly associated with upregulation in a pair of monozygotic twins, discordant for trisomy 21 (Letourneau et al., 2014), suggesting that there might be a common feature in transcriptional pattern responses to aneuploidy.
No Obvious Dysregulation Domains in MAALs
Gene expression dysregulation domains (GEDDs), wherein dysregulated genes were clustered as domains on chromosomes, were reported in human trisomy 21 (Letourneau et al., 2014) and a nullisomics in B. napus (Zhu et al., 2015). In the present study, we smoothed the distribution of gene expression fold changes (log2 ratios) along each normal chromosome for each MAAL, using the Lowess function of R to identify potential GEDDs. Unexpectedly, only three dysregulated regions on different chromosomes were observed in different comparisons (Figure 5), indicating that these GEDDs might not be a common feature for aneuploidy. Furthermore, we couldn’t exclude the possibility that these three dysregulation domains resulted from macroscopic structural variants at the corresponding chromosomes.
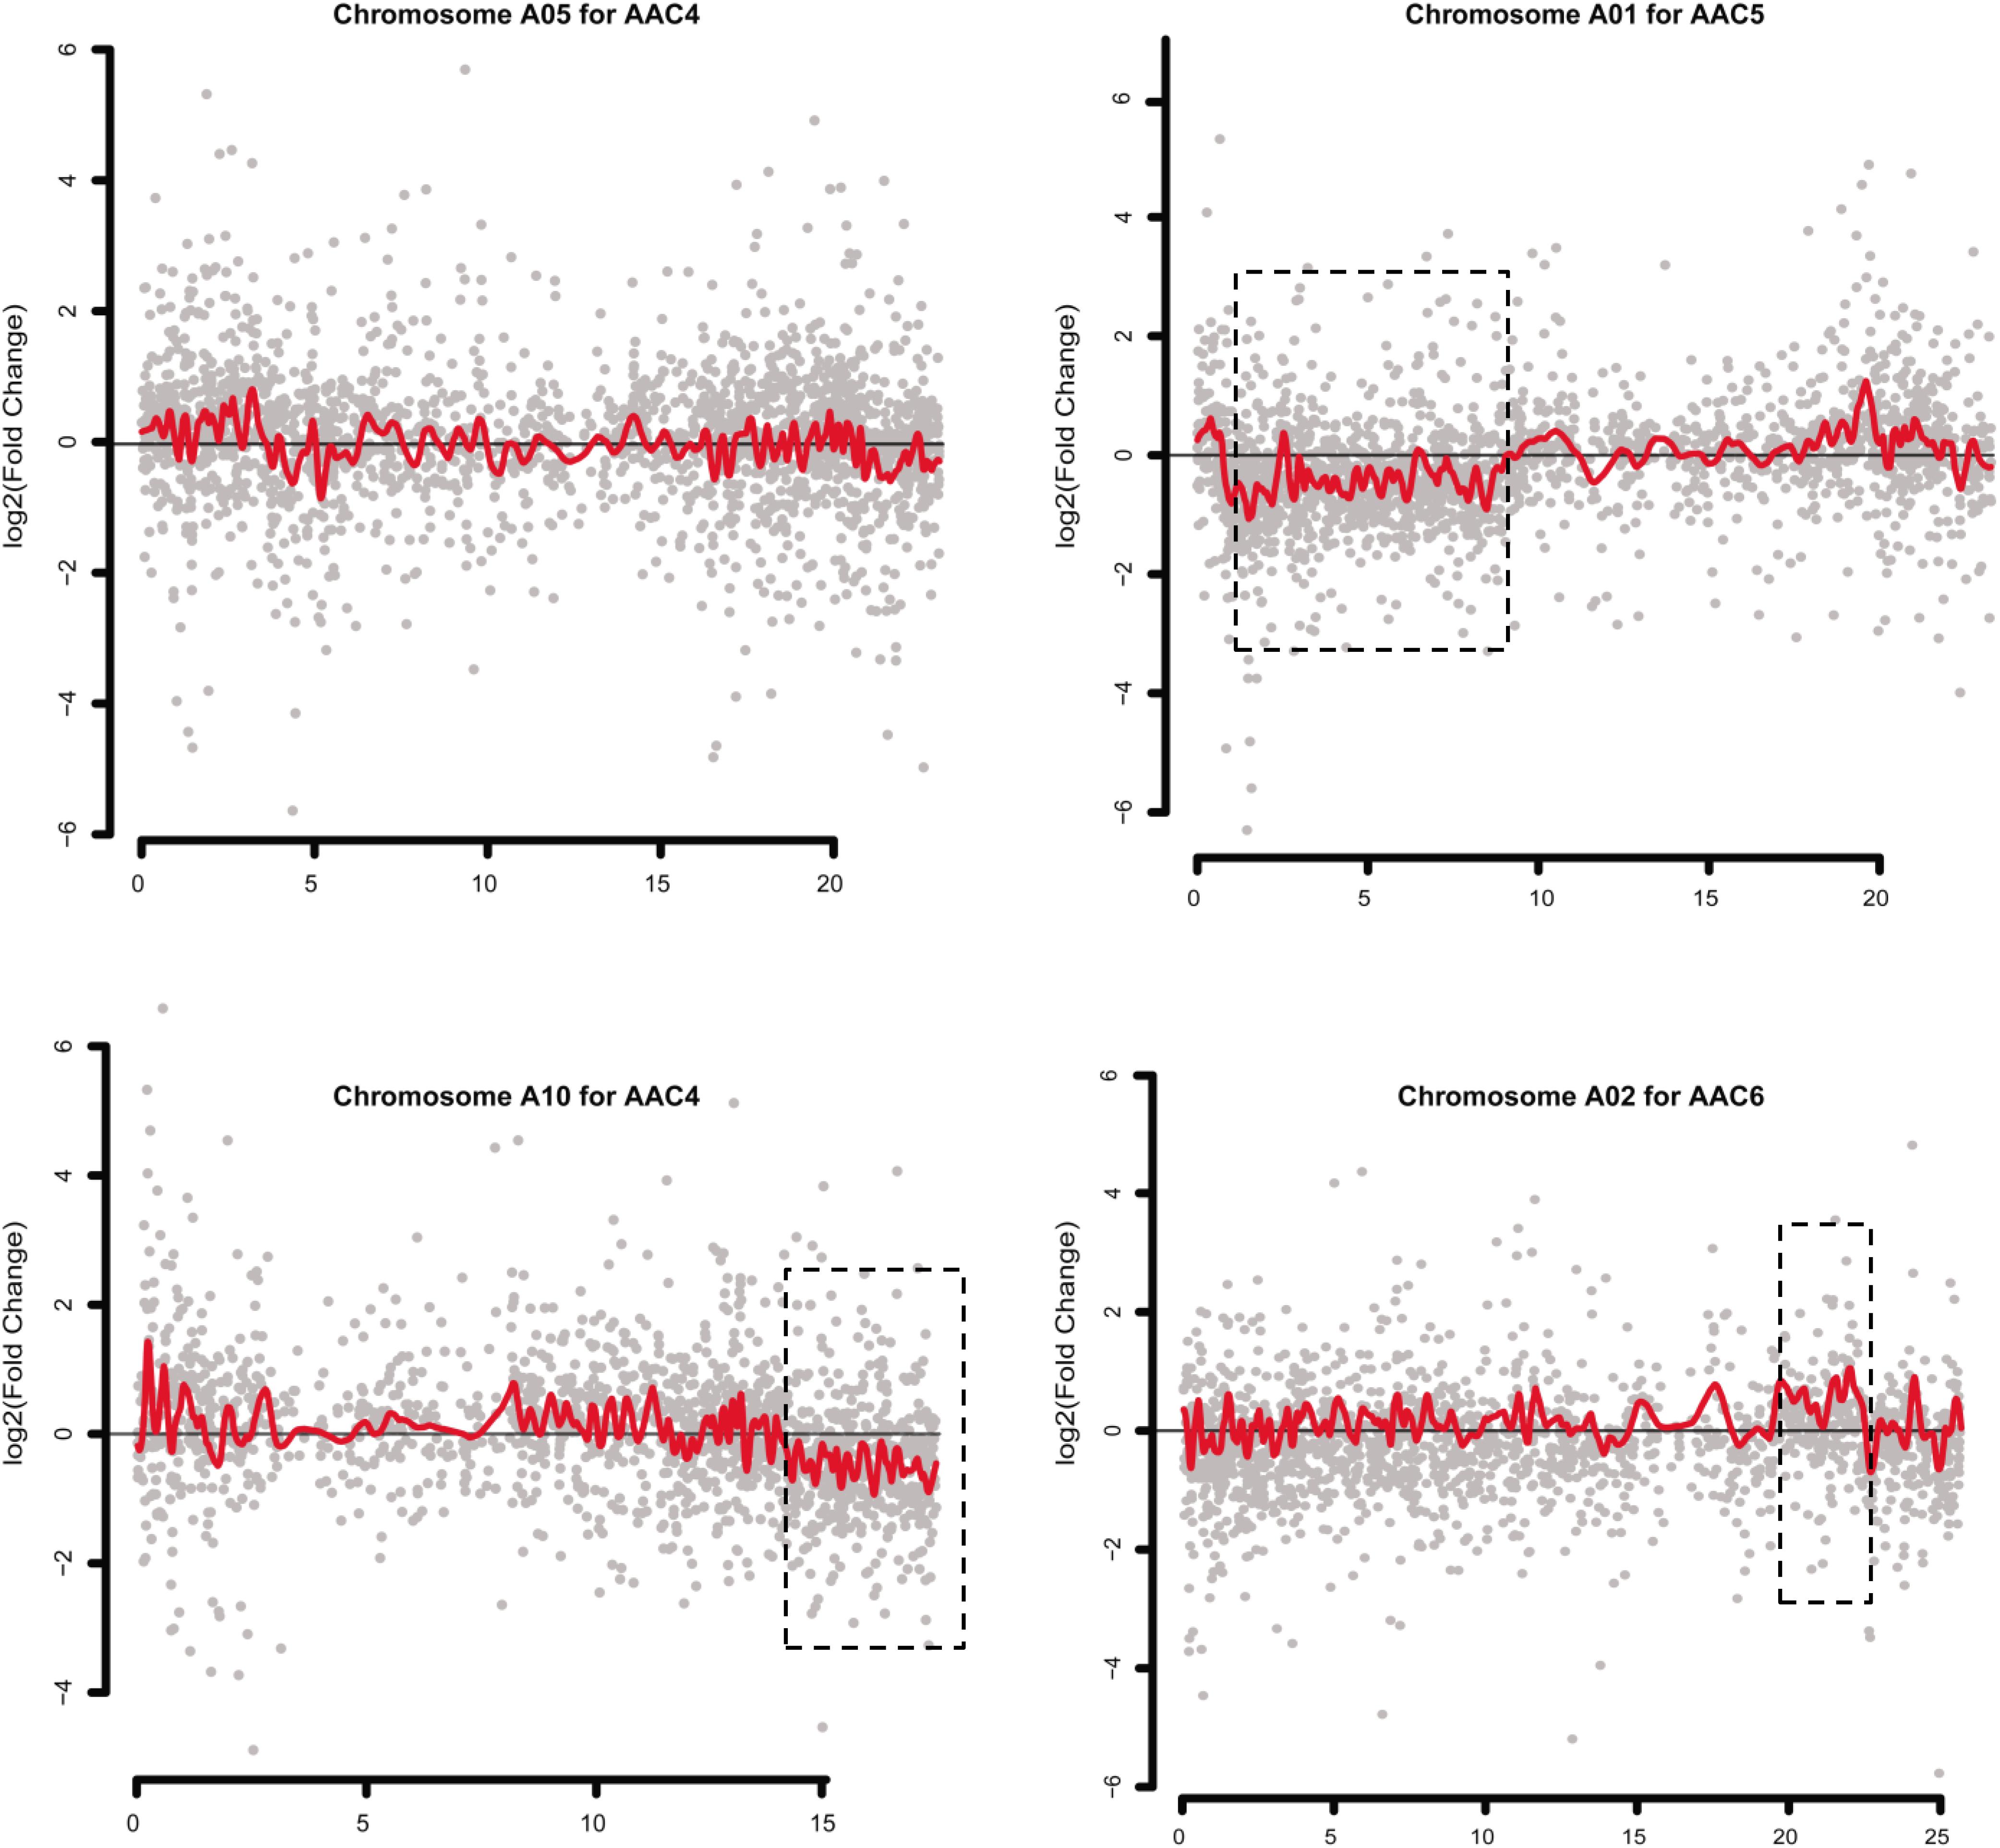
Figure 5. Dysregulated domains of gene expression in different chromosomes in some pairwise comparisons. Log2(fold-change) value in the gene expression between one of the MAALs and RBR in the chromosomes is depicted in gray. Red lines denote the smoothed distribution for the differentially expressed genes in these selected chromosomes, as representatives, using the Lowess function of R. Dysregulated domains that are exhibited in dotted boxes are clearly observed in only three chromosomes in three pairwise comparisons (chromosome A1 in C5/RBR, chromosome A10 in C4/RBR and chromosome A02 in C6/RBR). The y axis represents the log2(fold change) value of FPKM between the MAALs and euploid RBR. The x axis represents the sorted positions of genes on these chromosomes.
Discussion
The advent of high-throughput sequencing technologies has facilitated the analysis of genome-wide gene expressions involving aneuploids. Recently, numerous studies demonstrated that dysregulated genes in aneuploidy are not only restricted to altered chromosome but also disomic chromosomes (Huettel et al., 2008; Makarevitch and Harris, 2010; Letourneau et al., 2014; Zhu et al., 2015, 2018; Zhang et al., 2017), suggesting that this dysregulation in gene expression may be a collective transcriptional response to aneuploidy (Sheltzer et al., 2012). Phenotypic consequences in aneuploidy might result from cis-effects or trans-effects or global alterations of the entire regulatory system (Prestel et al., 2010). This theory of genome imbalance involves disruptions in the dosage-sensitive gene products (Birchler et al., 2001; Henry et al., 2006). It is therefore essential to detect whether changes in transcriptional expression are in direct proportion to alterations in the DNA copy number, or whether dosage compensation minimizes the effects of aneuploidy. Our results clearly showed that when compared to parental RBR, all of the MAALs exhibited prevalent trans-effect gene expression. However, no strong correlations were observed between trans-effects and levels of the chromosome genes number or the expressed gene number. Intriguingly, the MAALs harboring chromosome C1 or C2, showed a significantly higher number of trans-effect dysregulated genes (Table 2) and also provided the closest transcriptional responses based on gene expression divergence (Figure 1A). From the extensive homoeology between chromosome pairs (A1/C1 and A2/C2) (Chalhoub et al., 2014), we proposed that the levels of transcriptional responses to aneuploidy were associated with the similarity of the gene content between the remainder of the genome and the altered chromosome(s), rather than with the extent (gene number) of gene alterations. Another intriguing observation was that significantly different levels of gene expressions were observed in the recipient A subgenome, in response to different extra chromosomes of the C subgenome, wherein a higher number of dysregulated genes were observed in more similar chromosomes, such as A1 and A2, than those of other chromosomes.
A landmark study on gene expression from aneuploidy cells in diverse organisms demonstrated that aneuploids of various chromosomes and in different organisms, impacted similar cellular pathways and resulted in stereotypical anti-proliferative responses (Sheltzer et al., 2012). Although different pairwise comparisons between MAALs revealed no significant overlap of individual dysregulated genes in the A subgenome and only 10 co-regulated genes were detected, their functions were clearly involved in either negative proliferation or enhanced stress. GO analysis of co-regulated DEGs, which were identified in more than one comparison, also suggested that similar cellular pathways were related to changes in transcription profiles due to trans-effects.
In our study it was observed that highly expressed genes, on disomic chromosomes of the A subgenome, were more prone to transcriptional perturbation in all pairwise comparisons. Furthermore, the set of highly expressed genes seemed to be downregulated in response to aneuploidy. Inversely the set of naturally lowly expressed genes was likely upregulated. A similar phenomenon has been observed in one B. napus nullisomics, that lost the chromosome C2 (Zhu et al., 2015) as well as in monozygotic twins discordant for trisomy 21 (Letourneau et al., 2014). Interestingly, in these monozygotic twins, either upregulated or downregulated genes, between the twins, were clustered in the domains along all of the chromosomes (GEDDs), in which the highly expressed genes were mainly distributed in downregulated domains while lowly expressed genes were distributed in upregulated domains (Letourneau et al., 2014).
It was speculated that these dysregulation domains were associated with some phenotypic features of trisomy 21 (Letourneau et al., 2014; Pope and Gilbert, 2014), or that they could be the result of extra chromosomal material (Letourneau et al., 2014). Similar dysregulation domains observed in nullisomic B. napus likely supported the latter hypothesis (Zhu et al., 2015), although a transcriptome analysis of trisomy 5 in Arabidopsis thaliana (Huettel et al., 2008) and a series aneuploidy in hexaploid wheat (Zhang et al., 2017) did not detect these domains. These results, however, were derived from aneuploid organisms involving only one or a few chromosomes. Among our nine MAALs, only three dysregulated regions on different chromosomes were observed in three comparisons, indicating that the dysregulation domains were likely specific to particular aneuploid organisms.
Altogether, transcriptomic analysis of MAALs provided a comprehensive insight into transcriptional aneuploidy response patterns and allowed a deeper understanding of the functional interplay between the intact A subgenome and the extra C subgenome chromosomes in the natural allopolyploid B. napus.
Author Contributions
ZB designed this study and wrote the manuscript. PQ analyzed the RNA-Seq data. ZP, CB, and HD phenotyped and identified parental RBR “Oro” and MAALs. GX provided the analysis of FISH for all materials. LZ edited the manuscript. All authors have commented and approved the final manuscript.
Funding
The work was supported by the Project for Young Growth of GPED [qianjiaoheKYzi(2017)127], NSFC (Grant Nos. 31471530 and 31801391), Doctoral Foundation of Guizhou Normal University (11904-0517061), and Collaborative Fund of Guizhou Science and Technology [QKHLHZ(2017)7368].
Conflict of Interest Statement
The authors declare that the research was conducted in the absence of any commercial or financial relationships that could be construed as a potential conflict of interest.
Acknowledgments
We thank Dr. Susan J. Armstrong (The University of Birmingham, Birmingham, United Kingdom) for providing clone BoB014O06.
Supplementary Material
The Supplementary Material for this article can be found online at: https://www.frontiersin.org/articles/10.3389/fgene.2019.00067/full#supplementary-material
FIGURE S1 | Identification of target plants in progeny populations of MAALs. (A) FISH using a C genome-specific probe demonstrates the target plant with the chromosome complement of 20A+1C. Blue indicates the DAPI counterstaining of chromosomes, and the red signal indicates the labeled BAC BoB014O06 probe specifically for the C genome chromosome (Bar, 10 mm). (B) PCR amplification of four chromosome-specific gene primers for the two arms of chromosome C1 to screen the backcrossing population of MAAL C1. The results show that these target plants harbor an integrated chromosome C1.
FIGURE S2 | Venn diagram of trans-effect DEGs in all pairwise comparisons. Due to the ambiguity of all nine pairwise comparisons in one picture, we divide the nine comparisons into three groups based on the results of a hierarchical analysis of gene expression divergence.
FIGURE S3 | Frequency distribution of log2(fold change) values in all MAALs. High-expression level genes are more prone to be downregulated while the opposite is true for low-expression level genes in all pairwise comparisons (Wilcoxon test, q < 0.05). The x axis represents the log2(fold change) value in gene expression between the MAALs and euploid RBR in the three gene groups, and the y axis represents the frequency distribution of log2(fold-change).
TABLE S1 | Summary of clean reads of MAALs and RBR Oro aligned to the reference genome (B. napus).
TABLE S2 | Uneven distribution of DEGs of trans-effects across all chromosomes in each of the comparisons between RBR and the serial MAALs.
TABLE S3 | Pairwise Pearson correlation coefficient (PCC) values of transcriptomic differences among all genes in the A subgenome between any two of the nine MAALs and RBR (The FPKM values of all 44,452 genes in the A genome per sample is used as the dataset, then the PPC values of these datasets are calculated using the correlation function of the R-project).
TABLE S4 | The distribution of dysregulated genes in different gene expression levels.
Abbreviations
DEGs, differentially expressed genes; FISH, fluorescence in situ hybridization; GEDDs, gene expression dysregulation domains; MAAL, monosomic alien addition line; RBR, restituted B. rapa.
Footnotes
- ^http://www.bioinformatics.babraham.ac.uk/projects/fastqc/
- ^http://www.usadellab.org/cms/index.php?page=trimmomatic
- ^http://www.genoscope.cns.fr/brassicanapus/
- ^http://www.ccb.jhu.edu/software/hisat/
- ^http://cufflinks.cbcb.umd.edu/
- ^https://www.r-project.org/
- ^https://www.blast2go.com/
- ^https://academic.oup.com/bioinformatics/article/21/18/3674/202517
- ^http://agbase.arizona.edu/cgi-bin/tools/GOanna.cgi
- ^http://brassicadb.org/brad/index.php
References
Albertin, W., Balliau, T., Brabant, P., Chevre, A. M., Eber, F., Malosse, C., et al. (2006). Numerous and rapid nonstochastic modifications of gene products in newly synthesized Brassica napus allotetraploids. Genetics 173, 1101–1113. doi: 10.1534/genetics.106.057554
Antonarakis, S. E., Lyle, R., Dermitzakis, E. T., Reymond, A., and Deutsch, S. (2004). Chromosome 21 and down syndrome: from genomics to pathophysiology. Nat. Rev. Genet. 5, 725–738. doi: 10.1038/nrg1448
Birchler, J. A., Bhadra, U., Bhadra, M. P., and Auger, D. L. (2001). Dosage-dependent gene regulation in multicellular eukaryotes: implications for dosage compensation, aneuploid syndromes, and quantitative traits. Dev. Biol. 234, 275–288. doi: 10.1006/dbio.2001.0262
Birchler, J. A., and Newton, K. J. (1981). Modulation of protein levels in chromosomal dosage series of maize: the biochemical basis of aneuploid syndromes. Genetics 99, 247–266.
Birchler, J. A., and Veitia, R. A. (2007). The gene balance hypothesis: from classical genetics to modern genomics. Plant Cell 19, 395–402. doi: 10.1105/tpc.106.049338
Bolger, A. M., Lohse, M., and Usadel, B. (2014). Trimmomatic: a flexible trimmer for Illumina sequence data. Bioinformatics 30, 2114–2120. doi: 10.1093/bioinformatics/btu170
Chalhoub, B., Denoeud, F., Liu, S., Parkin, I. A., Tang, H., Wang, X., et al. (2014). Plant genetics. Early allopolyploid evolution in the post-Neolithic Brassica napus oilseed genome. Science 345, 950–953. doi: 10.1126/science.1253435
Chester, M., Gallagher, J. P., Symonds, V. V., Cruz Da Silva, A. V., Mavrodiev, E. V., Leitch, A. R., et al. (2012). Extensive chromosomal variation in a recently formed natural allopolyploid species, Tragopogon miscellus (Asteraceae). Proc. Natl. Acad. Sci. U.S.A. 109, 1176–1181. doi: 10.1073/pnas.1112041109
Clausen, R. E., and Cameron, D. R. (1944). Inheritance in Nicotiana tabacum. Xviii. monosomic analysis. Genetics 29, 447–477.
Conesa, A., Götz, S., García-Gómez, J. M., Terol, J., Talón, M., and Robles, M. (2005). Blast2GO: a universal tool for annotation, visualization and analysis in functional genomics research. Bioinformatics 21, 3674–3676. doi: 10.1093/bioinformatics/bti610
Cui, C., Ge, X., Gautam, M., Kang, L., and Li, Z. (2012). Cytoplasmic and genomic effects on meiotic pairing in Brassica hybrids and allotetraploids from pair crosses of three cultivated diploids. Genetics 191, 725–738. doi: 10.1534/genetics.112.140780
Gao, C., Furge, K., Koeman, J., Dykema, K., Su, Y., Cutler, M. L., et al. (2007). Chromosome instability, chromosome transcriptome, and clonal evolution of tumor cell populations. Proc. Natl. Acad. Sci. U.S.A. 104, 8995–9000. doi: 10.1073/pnas.0700631104
Gordon, D. J., Resio, B., and Pellman, D. (2012). Causes and consequences of aneuploidy in cancer. Nat. Rev. Genet. 13, 189–203. doi: 10.1038/nrg3123
Guo, M., and Birchler, J. A. (1994). Trans-acting dosage effects on the expression of model gene systems in maize aneuploids. Science 266, 1999–2002. doi: 10.1126/science.266.5193.1999
Guo, M., Davis, D., and Birchler, J. A. (1996). Dosage effects on gene expression in a maize ploidy series. Genetics 142, 1349–1355.
Henry, I. M., Dilkes, B. P., and Comai, L. (2006). Molecular karyotyping and aneuploidy detection in Arabidopsis thaliana using quantitative fluorescent polymerase chain reaction. Plant J. 48, 307–319. doi: 10.1111/j.1365-313X.2006.02871.x
Henry, I. M., Dilkes, B. P., Miller, E. S., Burkart-Waco, D., and Comai, L. (2010). Phenotypic consequences of aneuploidy in Arabidopsis thaliana. Genetics 186, 1231–1245. doi: 10.1534/genetics.110.121079
Huettel, B., Kreil, D. P., Matzke, M., and Matzke, A. J. (2008). Effects of aneuploidy on genome structure, expression, and interphase organization in Arabidopsis thaliana. PLoS Genet. 4:e1000226. doi: 10.1371/journal.pgen.1000226
Kim, D., Langmead, B., and Salzberg, S. L. (2015). HISAT: a fast spliced aligner with low memory requirements. Nat. Methods 12, 357–360. doi: 10.1038/nmeth.3317
Letourneau, A., Santoni, F. A., Bonilla, X., Sailani, M. R., Gonzalez, D., Kind, J., et al. (2014). Domains of genome-wide gene expression dysregulation in Down’s syndrome. Nature 508, 345–350. doi: 10.1038/nature13200
Li, Z. Y., Liu, H. L., and Luo, P. (1995). Production and cytogenetics of intergeneric hybrids between Brassica napus and Orychophragmus violaceus. Theor. Appl. Genet. 91, 131–136. doi: 10.1007/BF00220869
Lu, T. P., Lai, L. C., Tsai, M. H., Chen, P. C., Hsu, C. P., Lee, J. M., et al. (2011). Integrated analyses of copy number variations and gene expression in lung adenocarcinoma. PLoS One 6:e24829. doi: 10.1371/journal.pone.0024829
Makarevitch, I., and Harris, C. (2010). Aneuploidy causes tissue-specific qualitative changes in global gene expression patterns in maize. Plant Physiol. 152, 927–938. doi: 10.1104/pp.109.150466
Malone, J. H., Cho, D. Y., Mattiuzzo, N. R., Artieri, C. G., Jiang, L., Dale, R. K., et al. (2012). Mediation of Drosophila autosomal dosage effects and compensation by network interactions. Genome Biol. 13:r28. doi: 10.1186/gb-2012-13-4-r28
Mao, R., Zielke, C. L., Zielke, H. R., and Pevsner, J. (2003). Global up-regulation of chromosome 21 gene expression in the developing Down syndrome brain. Genomics 81, 457–467. doi: 10.1016/S0888-7543(03)00035-1
Matzke, M. A., Florian Mette, M., Kanno, T., and Matzke, A. J. M. (2003). Does the intrinsic instability of aneuploid genomes have a causal role in cancer? Trends Genet. 19, 253–256. doi: 10.1016/s0168-9525(03)00057-x
Mayer, K. F., Rogers, J., Doležel, J., Pozniak, C., Eversole, K., Feuillet, C., et al. (2014). A chromosome-based draft sequence of the hexaploid bread wheat (Triticum aestivum) genome. Science 345:1251788. doi: 10.1126/science.1251788
McCarthy, F. M., Wang, N., Magee, G. B., Nanduri, B., Lawrence, M. L., Camon, E. B., et al. (2006). Agbase: a functional genomics resource for agriculture. BMC Genomics 7:229. doi: 10.1186/1471-2164-7-229
Mestiri, I., Chague, V., Tanguy, A. M., Huneau, C., Huteau, V., Belcram, H., et al. (2010). Newly synthesized wheat allohexaploids display progenitor-dependent meiotic stability and aneuploidy but structural genomic additivity. New Phytol. 186, 86–101. doi: 10.1111/j.1469-8137.2010.03186.x
Morrow, E. M. (2010). Genomic copy number variation in disorders of cognitive development. J. Am. Acad. Child Adolesc. Psychiatry 49, 1091–1104. doi: 10.1016/j.jaac.2010.08.009
Nagaharu, U. (1935). Genome analysis in Brassica with special reference to the experimental formation of B. napus and peculiar mode of fertilization. Jap. J. Bot. 7, 389–452.
Pavelka, N., Rancati, G., Zhu, J., Bradford, W. D., Saraf, A., Florens, L., et al. (2010). Aneuploidy confers quantitative proteome changes and phenotypic variation in budding yeast. Nature 468, 321–325. doi: 10.1038/nature09529
Pope, B. D., and Gilbert, D. M. (2014). Genetics: up and down in down’s syndrome. Nature 508, 323–324. doi: 10.1038/508323a
Prakash, S., Bhat, S. R., Quiros, C. F., Kirti, P. B., Chopra, V. L., Quiros, C. R., et al. (2009). “Brassica and its close allies: cytogenetics and evolution”, in Plant Breeding Reviews, Vol. 31, ed. J. Janick (Hoboken, NJ: John Wiley & Sons, Inc.), 21–187. doi: 10.1002/9780470593783.ch2
Prestel, M., Feller, C., and Becker, P. B. (2010). Dosage compensation and the global re-balancing of aneuploid genomes. Genome Biol. 11:216. doi: 10.1186/gb-2010-11-8-216
Rey, E., Abrouk, M., Keeble-Gagnère, G., Karafiátová, M., Vrána, J., Balzergue, S., et al. (2018). Transcriptome reprogramming due to the introduction of a barley telosome into bread wheat affects more barley genes than wheat. Plant Biotechnol. J. 16, 1767–1777. doi: 10.1111/pbi.12913
Sears, E. R. (1954). The aneuploids of common wheat. Missouri Agr. Expt. Stat. Res. Bull. 572, 1–59.
Sheltzer, J. M., and Amon, A. (2011). The aneuploidy paradox: costs and benefits of an incorrect karyotype. Trends Genet. 27, 446–453. doi: 10.1016/j.tig.2011.07.003
Sheltzer, J. M., Torres, E. M., Dunham, M. J., and Amon, A. (2012). Transcriptional consequences of aneuploidy. Proc. Natl. Acad. Sci. U.S.A. 109, 12644–12649. doi: 10.1073/pnas.1209227109
Siegel, J. J., and Amon, A. (2012). New Insights into the troubles of aneuploidy. Annu. Rev. Cell Dev. Biol. 28, 189–214. doi: 10.1146/annurev-cellbio-101011-155807
Stingele, S., Stoehr, G., Peplowska, K., Cox, J., Mann, M., and Storchova, Z. (2012). Global analysis of genome, transcriptome and proteome reveals the response to aneuploidy in human cells. Mol. Syst. Biol. 8:608. doi: 10.1038/msb.2012.40
Szadkowski, E., Eber, F., Huteau, V., Lodé, M., Huneau, C., Belcram, H., et al. (2010). The first meiosis of resynthesized Brassica napus, a genome blender. New Phytol. 186, 102–112. doi: 10.1111/j.1469-8137.2010.03182.x
Torres, E. M., Williams, B. R., and Amon, A. (2008). Aneuploidy: cells losing their balance. Genetics 179, 737–746. doi: 10.1534/genetics.108.090878
Trapnell, C., Hendrickson, D. G., Sauvageau, M., Goff, L., Rinn, J. L., and Pachter, L. (2013). Differential analysis of gene regulation at transcript resolution with RNA-seq. Nat. Biotechnol. 31, 46–53. doi: 10.1038/nbt.2450
Trapnell, C., Roberts, A., Goff, L., Pertea, G., Kim, D., Kelley, D. R., et al. (2012). Differential gene and transcript expression analysis of RNA-seq experiments with TopHat and Cufflinks. Nat. Protoc. 7, 562–578. doi: 10.1038/nprot.2012.016
Tu, Y., Sun, J., Ge, X., and Li, Z. (2010). Production and genetic analysis of partial hybrids from intertribal sexual crosses between Brassica napus and Isatis indigotica and progenies. Genome 53, 146–156. doi: 10.1139/G09-093
Xiong, Z., Gaeta, R. T., and Pires, J. C. (2011). Homoeologous shuffling and chromosome compensation maintain genome balance in resynthesized allopolyploid Brassica napus. Proc. Natl. Acad. Sci. U.S.A. 108, 7908–7913. doi: 10.1073/pnas.1014138108
Xu, C., Liu, Y., Wang, P., Fan, W., Rue, T. C., Upton, M. P., et al. (2010). Integrative analysis of DNA copy number and gene expression in metastatic oral squamous cell carcinoma identifies genes associated with poor survival. Mol. Cancer 9:143. doi: 10.1186/1476-4598-9-143
Zhang, A., Li, N., Gong, L., Gou, X., Wang, B., Deng, X., et al. (2017). Global analysis of gene expression in response to whole-chromosome aneuploidy in hexaploid wheat. Plant Physiol. 175, 828–847. doi: 10.1104/pp.17.00819
Zhang, D., Pan, Q., Cui, C., Tan, C., Ge, X., Shao, Y., et al. (2015). Genome-specific differential gene expressions in resynthesized Brassica allotetraploids from pair-wise crosses of three cultivated diploids revealed by RNA-seq. Front. Plant Sci. 6:957. doi: 10.3389/fpls.2015.00957
Zhang, H., Bian, Y., Gou, X., Zhu, B., Xu, C., Qi, B., et al. (2013). Persistent whole-chromosome aneuploidy is generally associated with nascent allohexaploid wheat. Proc. Natl. Acad. Sci. U.S.A. 110, 3447–3452. doi: 10.1073/pnas.1300153110
Zhu, B., Shao, Y., Pan, Q., Ge, X., and Li, Z. (2015). Genome-wide gene expression perturbation induced by loss of C2 chromosome in allotetraploid Brassica napus L. Front. Plant Sci. 6:763. doi: 10.3389/fpls.2015.00763
Zhu, B., Tu, Y., Zeng, P., Ge, X., and Li, Z. (2016). Extraction of the constituent subgenomes of the natural allopolyploid rapeseed (Brassica napus L.). Genetics 204, 1015–1027. doi: 10.1534/genetics.116.190967
Keywords: allopolyploid, Brassica napus, Brassica rapa, monosomic alien addition lines, aneuploidy, transcriptome
Citation: Bin Z, Qi P, Dongao H, Pan Z, Bowei C, Xianhong G and Zaiyun L (2019) Transcriptional Aneuploidy Responses of Brassica rapa-oleracea Monosomic Alien Addition Lines (MAALs) Derived From Natural Allopolyploid B. napus. Front. Genet. 10:67. doi: 10.3389/fgene.2019.00067
Received: 09 April 2018; Accepted: 28 January 2019;
Published: 13 February 2019.
Edited by:
Manja Marz, Friedrich-Schiller-Universität Jena, GermanyReviewed by:
David Arnosti, Michigan State University, United StatesMainá Bitar, Federal University of Minas Gerais, Brazil
Copyright © 2019 Bin, Qi, Dongao, Pan, Bowei, Xianhong and Zaiyun. This is an open-access article distributed under the terms of the Creative Commons Attribution License (CC BY). The use, distribution or reproduction in other forums is permitted, provided the original author(s) and the copyright owner(s) are credited and that the original publication in this journal is cited, in accordance with accepted academic practice. No use, distribution or reproduction is permitted which does not comply with these terms.
*Correspondence: Li Zaiyun, bGl6YWl5dW5AbWFpbC5oemF1LmVkdS5jbg==
†These authors have contributed equally to this work