 Chenghao Zhou
 Cong Li
 Wentao Cai
 Hongwei Yin
 Shengli Zhang
- Key Laboratory of Animal Genetics, Breeding and Reproduction, Ministry of Agriculture & National Engineering Laboratory for Animal Breeding, College of Animal Science and Technology, China Agricultural University, Beijing, China
Genome-wide association studies (GWASs) have been widely used to determine the genetic architecture of quantitative traits in dairy cattle. In this study, with the aim of identifying candidate genes that affect milk protein composition traits, we conducted a GWAS for nine such traits (αs1-casein, αs2-casein, β-casein, κ-casein, α-lactalbumin, β-lactoglobulin, casein index, protein percentage, and protein yield) in 614 Chinese Holstein cows using a single-step strategy. We used the Illumina BovineSNP50 Bead chip and imputed genotypes from high-density single-nucleotide polymorphisms (SNPs) ranging from 50 to 777 K, and subsequent to genotype imputation and quality control, we screened a total of 586,304 informative high-quality SNPs. Phenotypic observations for six major milk proteins (αs1-casein, αs2-casein, β-casein, κ-casein, α-lactalbumin, and β-lactoglobulin) were evaluated as weight proportions of the total protein fraction (wt/wt%) using a commercial enzyme-linked immunosorbent assay kit. Informative windows comprising five adjacent SNPs explaining no < 0.5% of the genomic variance per window were selected for gene annotation and gene network and pathway analyses. Gene network analysis performed using the STRING Genomics 10.0 database revealed a co-expression network comprising 46 interactions among 62 of the most plausible candidate genes. A total of 178 genomic windows and 194 SNPs on 24 bovine autosomes were significantly associated with milk protein composition or protein percentage. Regions affecting milk protein composition traits were mainly observed on chromosomes BTA 1, 6, 11, 13, 14, and 18. Of these, several windows were close to or within the CSN1S1, CSN1S2, CSN2, CSN3, LAP3, DGAT1, RPL8, and HSF1 genes, which have well-known effects on milk protein composition traits of dairy cattle. Taken together with previously reported quantitative trait loci and the biological functions of the identified genes, we propose 19 novel candidate genes affecting milk protein composition traits: ARL6, SST, EHHADH, PCDHB4, PCDHB6, PCDHB7, PCDHB16, SLC36A2, GALNT14, FPGS, LARP4B, IDI1, COG4, FUK, WDR62, CLIP3, SLC25A21, IL5RA, and ACADSB. Our findings provide important insights into milk protein synthesis and indicate potential targets for improving milk quality.
Introduction
Milk products are a fundamental component of many diets. Given the increasing development and variety of milk products, manufacturers, and scholars alike have placed a focus on understanding milk protein content and the importance of various milk proteins. The primary protein components of milk include αs1-casein (αs1-CN), αs2-casein (αs2-CN), β-casein (β-CN), κ-casein (κ-CN), α-lactalbumin (α-LA), and β-lactoglobulin (β-LG), each of which plays different roles in protein synthesis and metabolism in the human body. For example, casein intake affects vascular health (Fekete et al., 2013) and heart health (Miluchová et al., 2013), improves sleep quality (Brennan et al., 2013), and enhances immunity (Konstantinou et al., 2014).
Milk protein composition is a complex trait that is influenced by both genetic and non-genetic factors, including cattle breed, herd, and stage of lactation. Previous studies have shown that bovine milk protein composition is heritable, with heritability estimates ranging from 0.26 to 0.86 (Schopen et al., 2011) and 0.05 to 0.77 (Huang et al., 2012). In recent years, a number of genes and quantitative trait loci (QTL) for milk composition traits have been detected using candidate gene and QTL mapping methods. The effects of milk protein variants on αs1-CN, αs2-CN, β-CN, κ-CN, α-LA, and β-LG content have been examined in a number of studies (Heck et al., 2009; Sanchez et al., 2017; Viale et al., 2017). Variants of the β-CN and κ-CN genes located on bovine chromosome (BTA) 6 and variants of the β-LG gene located on BTA 11 have been associated with alterations in milk protein composition (Heck et al., 2009). A further β-LG protein variant has been associated with higher casein content (Lundén et al., 1997; Heck et al., 2009) and a higher cheese yield (Tsiaras et al., 2005). A previously reported genome-wide linkage study identified important QTLs for milk protein composition and content on BTA 1, 5, 6, 10, and 14 (Schopen et al., 2011).
Since the first application of genome-wide association studies (GWASs) to livestock research in 2008 (Daetwyler et al., 2008), a series of GWASs have been published on important economic traits. Such studies are of particular value with respect to livestock species, for which pedigrees are complex and nuclear families are the exception rather than the rule. Misztal et al. (2009) and Christensen and Lund (2010) proposed a single-step genomic best linear unbiased prediction (ssGBLUP) method that incorporates phenotypes, genotypes, and pedigree information. The use of this information in conjunction with genomic data allows more precise estimations and increased detection power through implementation of a scaled and properly augmented relationship matrix (Legarra et al., 2009; Misztal et al., 2009). Compared with multiple-step approaches, the ssGBLUP method yields more accurate and consistent solutions (Forni et al., 2011; Wang et al., 2012, 2014). In the present study, we applied the ssGBLUP method to identify genomic regions affecting bovine milk composition and protein content in the Chinese Holstein cow.
Materials and Methods
Animals and Phenotypes
The Chinese Holstein population used in this study included 614 cows from 19 farms of the Beijing Sanyuan Dairy Farm Center and the offspring of 19 sire families. For most individuals, we had access to both genotype data and traditional pedigree information. Genealogical information was available for all individuals and 598 individuals were genotyped. A total of 50 mL of milk was collected from each cow by the Dairy Herd Improvement System (DHI) laboratory of the Beijing Dairy Cattle Center. Samples were transported to the laboratory and stored at −20°C until use (Li et al., 2014). The concentrations of αs1-CN, αs2-CN, β-CN, κ-CN, α-LA, and β-LG in each sample were quantified using commercial ELISA kits in accordance with manufacturer instructions and expressed as the weight proportion of total protein (wt/wt%). Furthermore, protein percentage data were obtained from DHI reports and the casein index was calculated as [Σ casein/(Σ casein + Σ whey)] × 100 (Schopen et al., 2009).
Genotyping, Imputation, and Quality Control
Genotyping was performed using one of two versions of the Illumina BovineSNP50 BeadChip (Illumina Inc., San Diego, CA, USA). Version 1 contains 54,001 SNPs and version 2 contains 54,609 SNPs. In order to improve the accuracy of the study results, we imputed genotypes from high-density (HD) single-nucleotide polymorphisms (SNPs) ranging from 50 to 777 K using BEAGLE version 3.3.1 (Browning and Browning, 2007). The data used in imputation included those for 85 Chinese Holstein bulls genotyped with both 54 and 777 K (HD) chips, 598 Chinese cows genotyped with a 54 K chip, and 510 Nordic Holstein bulls genotyped with an HD chip. This analysis enabled us to validate the imputation accuracy for the Chinese Holstein population in seven scenarios for cows and bulls using different reference populations (Ma et al., 2014). Following genotype imputation, the panel included a total of 644,400 SNPs. We excluded SNPs with a < 90% genotype call rate, minor allele frequency (MAF) < 0.05, and an absence of Hardy–Weinberg equilibrium (P < 10−6). Subsequent to quality control, a total of 586,304 SNPs were used for the association study. The position of each SNP was determined using the reference bovine genome sequence UMD_3.1.66 (http://www.ncbi.nlm.nih.gov/genome/guide/cow/).
Genome-Wide Association Study
We conducted an association study in accordance with the single-step genomic-BLUP approach (Aguilar et al., 2010; Christensen and Lund, 2010; Misztal et al., 2013a). The Bayesian inference method was used to estimate variance components, and a Monte Carlo Markov Chain was completed for 100,000 rounds with Gibbs sampling, of which the first 9,000 rounds were discarded as burn-in. Within each Gibbs sample cycle, Metropolis–Hastings samples were run for 20 iterations. Trace plots were also inspected visually to ensure convergence had been reached. BLUPf90 family software was used to perform related analyses (Tiezzi et al., 2015; Parker Gaddis et al., 2018). The ssGBLUP model used was as follows:
where y is the observation vector; X represents the corresponding incidence matrix for fixed effects; β is a vector of fixed effects, including overall mean, farm, lactation, and parity; W represents a corresponding incidence matrix for random additive genetic effects; a is the vector of additive genetic effects; and e is a vector of residuals. The genetic variance and residual variance were calculated using the following formula:
where and are the total additive genetic variance and residual variance, respectively. The model accounted for additive genetic relationships among different individuals and the pedigree as well as genomic information by integration into matrix H (Misztal et al., 2013b):
where A is a numerator (pedigree) relationship matrix applied for all animals, and A22 is a numerator (pedigree) relationship matrix applied for genotyped animals. G represents a genomic relationship matrix. Matrix G assumed the allele frequency of the current population and was adjusted for compatibility with A22 (Vanraden et al., 2009):
where D represents a diagonal matrix in which elements contain the inverse of the expected maker variance (D = I for GBLUP) and Z represents a matrix containing genotypes under the correction of allele frequency (Prado et al., 2003). The animal effects of genotyped animals were a function of SNP effects:
where ag represents animal effects decomposed in genotype, u denotes a vector of marker effects, and Z is a matrix related to the genotype of each locus. Thus, the variance of animal effects is expressed as
and the genetic additive variance can be captured by each SNP marker provided that the weighted relationship matrix (G*) is not weighted. Subsequently,
where λ is a normalization constant or variance ratio. Following Vanraden et al. (2009), we defined λ as follows:
where is the genetically additive variance captured by each SNP marker provided that G* is not weighted, is the overall genetic additive effect, M is the quantity of SNPs, and pi is the allele frequency of the 2nd allele of the ith marker. SNP effects and the individual variance of each SNP were obtained using the following equation as described by Zhang et al. (2010):
Wang et al. (2012) have previously described the “Scenario 1” process for iterative re-weighting. In the first round of the iterative process in the above formulae, we used D = I to predict SNP effects and the variance of each SNP by virtue of G*. In this study, the procedure was run for one iteration based on the realized accuracies of GEBV according to Wang et al. (2012). The weighted SNPs were used to construct the G matrices, update the GEBV, and, consequently, the estimated SNP effects. New marker effects were calculated in continuous iterations on the basis of the weighted G* matrix proposed in the abovementioned formula.
The percentage of genetic variance explained by the i-th region was calculated as follows:
where ai is the genetic value of the i-th region that consists of five continuous adjacent SNPs, is the total genetic variance, Zj is the vector of gene content of the j-th SNP for all individuals, and ûj is the marker effect of the i-th SNP within the i-th region (Zhang et al., 2010).
A significance test for SNP effects was performed using a two-sided t-test, and the P-value of each SNP was calculated as follows:
where Pt is the distribution function of t distribution, ûi is the ith SNP effect, is the genetic variance of the ith SNP, n is the number of animals with the ith SNP. A Bonferroni correction was applied to control for false positive associations, and the genome significance level was defined as P < 0.01/N, where N is the number of SNP loci analyzed. Thus, in the present study, the significance threshold value of –log10(P) for all studied traits was 6.52 (586,304 SNP markers) (Wu et al., 2017).
Gene Functional Annotation, Gene Network, and Pathway Analyses
The successive calculation of variance absorbed by 5-SNP moving windows was based on the whole genome. Windows explaining no < 0.5% of the genomic variance were selected for gene annotation, network, and pathway analyses (Fragomeni et al., 2014; Medeiros de Oliveira Silva et al., 2017). We used the Biomart platform of Ensemble (Flicek et al., 2013) to obtain gene annotations through the Biomart R package on the basis of the starting and ending coordinates of each window (http://www.bioconductor.org). A pathway-enrichment analysis, visualization, and integrated discovery (DAVID) analysis (Huang Da et al., 2009a,b) was performed using the Kyoto Encyclopedia of Genes and Genomes (KEGG) database (Kanehisa et al., 2014) for annotation. Manhattan plots of genome-wide association analyses were produced in R using the CMplot package. For candidate genes, we investigated functional protein–protein interactions (PPIs) and the enrichment of gene ontology (GO) using the STRING Genomics 10.0 database (Szklarczyk et al., 2015). This analysis evaluated two types of PPI: PPIs obtained from laboratory and curated databases and predicted PPIs based on gene neighborhood, fusion, gene co-occurrence, protein homology, co-expression, or text mining in the literature. A global PPI network was constructed and limited to interactions exhibiting high confidences with scores > 0.4.
Results
In this study, we quantified milk protein composition using ELISA kits. The descriptive statistics of the phenotypes of milk protein composition traits are shown in Table 1. The mean concentrations of αs1-CN, αs2-CN, β-CN, κ-CN, α-LA, and β-LG were 35.45, 16.64, 31.23, 7.51, 2.25, and 6.93%, respectively. These results are similar to those previously obtained using capillary zone electrophoresis (CZE) (Schopen et al., 2011) and mid-infrared (MIR) spectra (Sanchez et al., 2017). The most abundant protein in milk was αs1-CN and the least abundant was α-LA. The allele correct rate was >96.0%, as determined through genotype imputation. A total of 178 informative windows of five adjacent SNPs were obtained for association with 586,304 SNPs using ssGWAS for all chromosomes and traits studied (Table 2 and Figures 1, 2). The main regions associated with milk protein composition traits were found on chromosomes BTA 1, 6, 7, 11, 13, 14, and 18. There were no significant associations on BTA 4, 19, 25, 27, or 28. A range of 11–31 significant windows was associated with all studied traits, and windows were located on 24 of the 29 bovine autosomes. A range of 1–31 windows per chromosome and 9–47% genetic variance were identified. Figures 3, 4 show the –log10(P-values) for association of the 586,304 SNPs obtained using ssGWAS for all the chromosomes and all the studied traits. Additional details relating to the SNPs associated with milk protein composition are shown in Table 2. We compared the results with the cattle QTL database (http://aaa.animalgenome.org/cgi-bin/QTLdb/BT/index) and found 118 reported QTLs related to milk protein composition traits. Relatively concentrated areas related to milk proteins were noted on chromosomes 6, 13, and 14. Twenty-eight QTLs related to four milk caseins (αs1-CN, αs2-CN, β-CN, and κ-CN) and protein yield were found on BTA 6, and 23 QTLs related to milk protein yield were found on BTA 13. Furthermore, 41 QTLs related to αs2-CN, α-LA, and milk protein yield were found on BTA 14 (Figure S19).
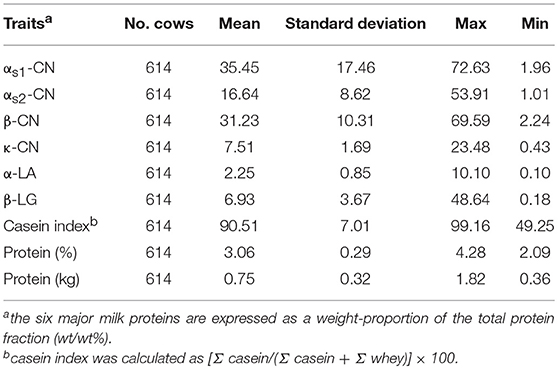
Table 1. Descriptive statistics of milk protein composition traits in a Chinese Holstein population.
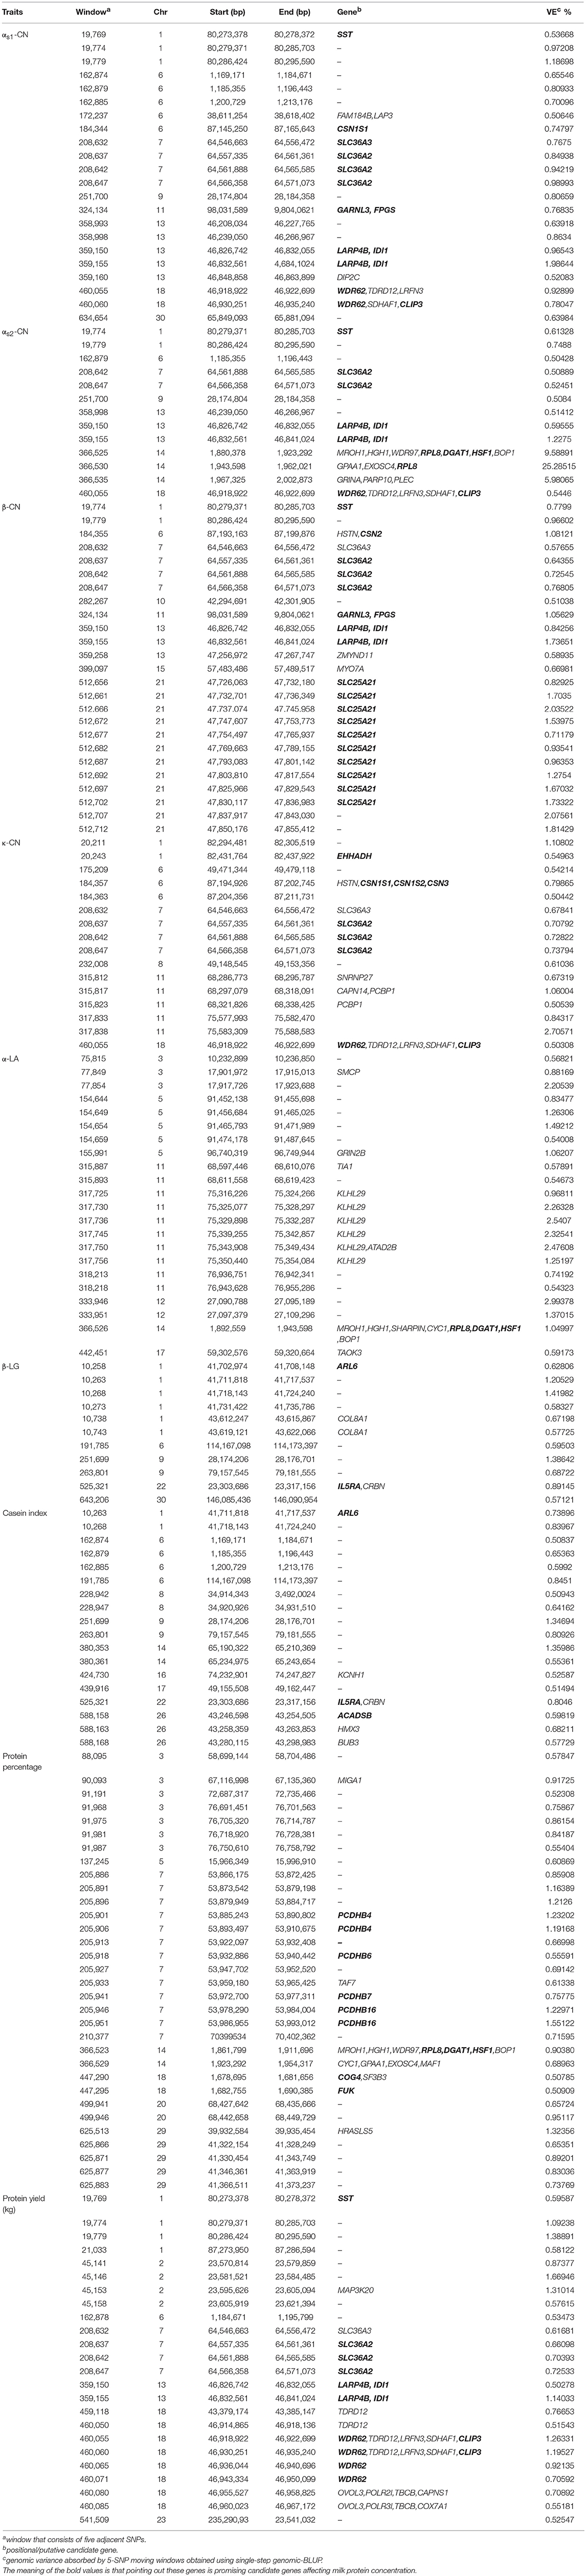
Table 2. Genomic regions associated with milk protein composition traits in a Chinese Holstein population.
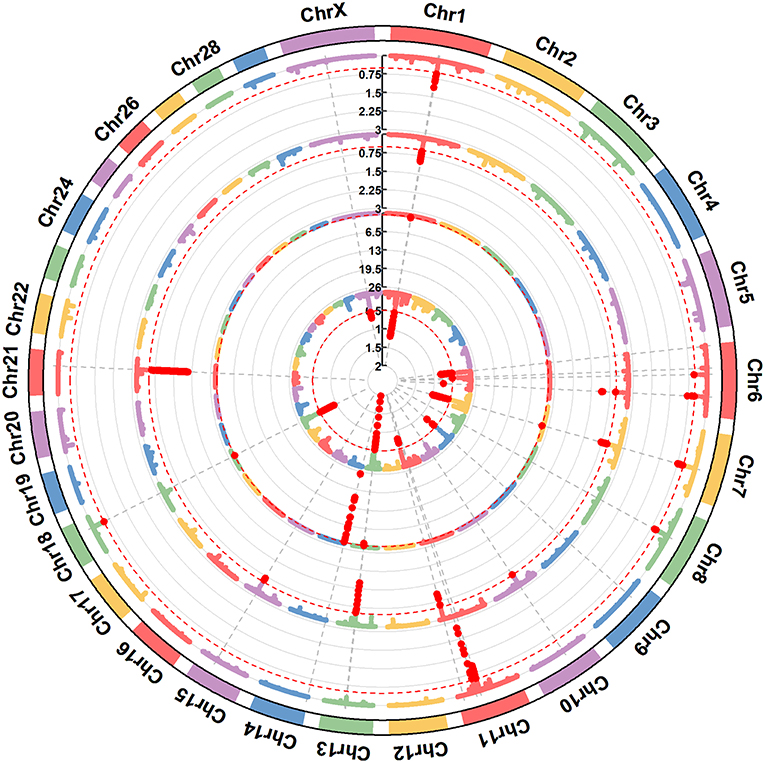
Figure 1. A circular-Manhattan plot for the proportion of genetic variance explained by the 5-SNP moving windows associated with the milk protein composition traits αs1-CN, αs2-CN, β-CN, and κ-CN. The horizontal line represents windows explaining no < 0.5% of the genomic variance. The four milk protein composition traits were plotted from inside to outside, respectively. A rectangular-Manhattan version of the plot is shown in the Supplementary Figures.
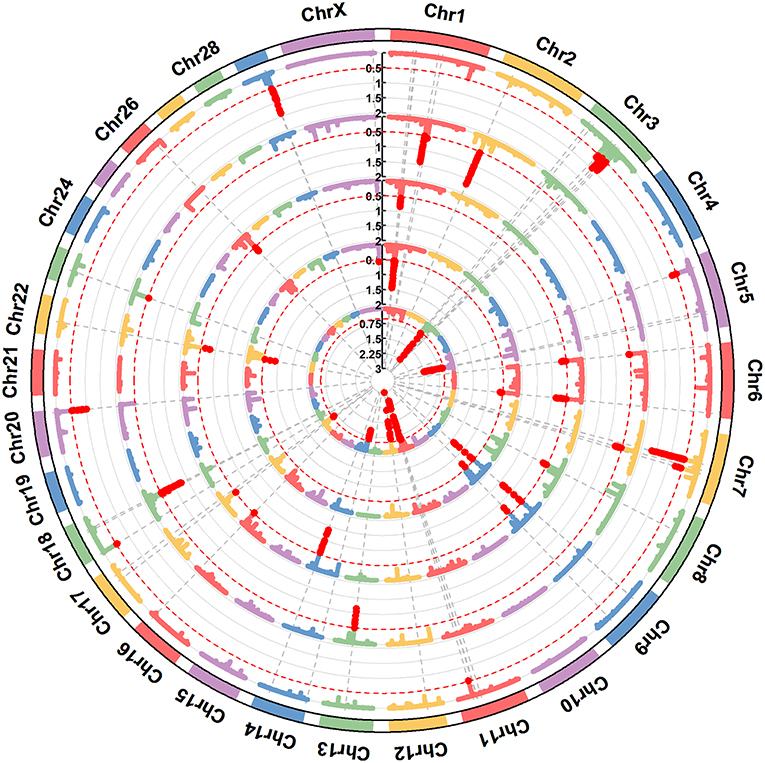
Figure 2. A circular-Manhattan plot for the proportion of genetic variance explained by the 5-SNP moving windows associated with the milk protein composition traits α-LA, β-LG, casein index, protein percentage, and protein yield. The horizontal line represents windows explaining no < 0.5% of the genomic variance. The five milk protein composition traits were plotted from inside to outside, respectively. A rectangular-Manhattan version of the plot is shown in the Supplementary Figures.
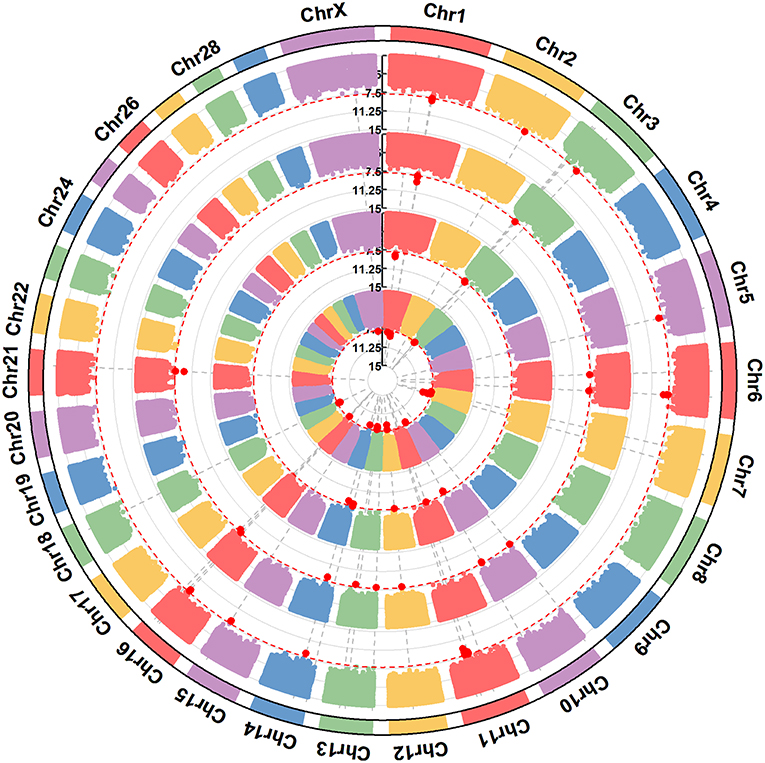
Figure 3. A circular-Manhattan plot for significance [–log10(P-values)] of the association of 586,304 SNPs based on analyses using ssGWAS located on 24 Bos taurus autosomes and the X chromosome with the milk protein composition traits αs1-CN, αs2-CN, β-CN, and κ-CN. The horizontal line represents a false discovery rate of 1%. The four milk protein composition traits were plotted from inside to outside, respectively. A rectangular-Manhattan version of the plot is shown in the Supplementary Figures.
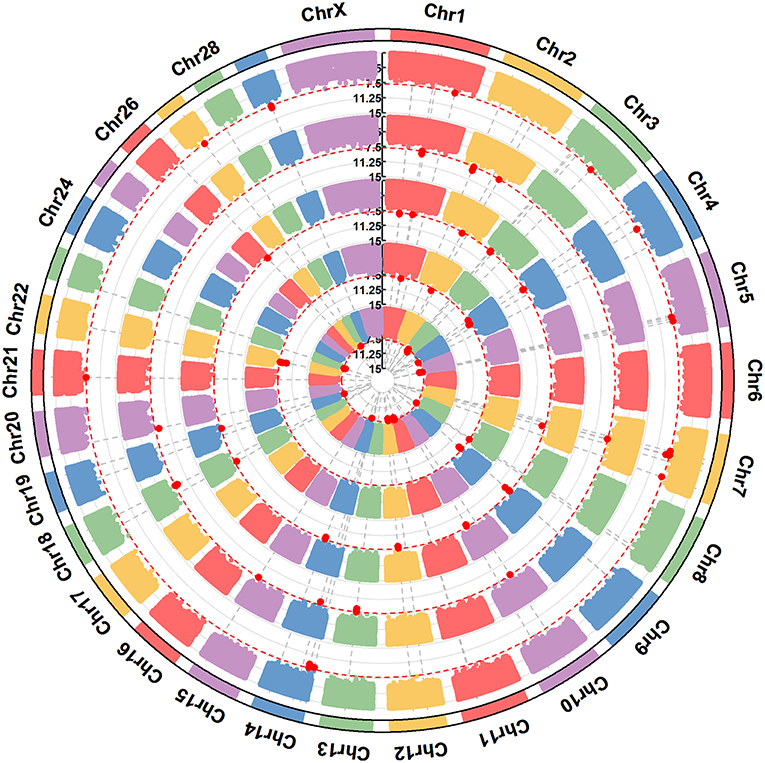
Figure 4. A circular-Manhattan plot for significance [–log10(P-values)] of the association of 586,304 SNPs based on analyses using ssGWAS located on 24 Bos taurus autosomes and the X chromosome with αs1-CN, αs2-CN, β-CN, and κ-CN. The horizontal line represents a false discovery rate of 1%. Five milk protein composition traits (α-LA, β-LG, casein index, protein percentage, and protein yield) were plotted from inside to outside, respectively. A rectangular-Manhattan version of the plot is shown in the Supplementary Figures.
Genome-Wide Association Study
Several informative windows on BTA 1 and 6 showed highly significant associations with five major milk proteins (αs1-CN, αs2-CN, β-CN, κ-CN, and β-LG), casein index, protein yield, and protein percentage. We identified a continuous genomic region on BTA 7 associated with αs1-CN, αs2-CN, β-CN, κ-CN, protein yield, and protein percentage. Additionally, BTA 11, 13, and 14 each had significant associations with four studied traits (BTA 11: αs1-CN, β-CN, κ-CN, and α-LA; BTA 13: αs1-CN, αs2-CN, β-CN, and protein yield; and BTA 14: αs2-CN, α-LA, casein index, and protein percentage). A number of windows of BTA 18 also had associations with αs1-CN, αs2-CN, κ-CN, protein yield, and protein percentage.
In total, we detected 22, 13, 25, 16, 22, 11, 18, 30, and 24 informative windows for αs1-CN, αs2-CN, β-CN, κ-CN, α-LA, 11 β-LG, casein index, protein percentage, and protein yield, respectively. Four windows (64.54–64.57 Mbp) explained 3.55% of the genetic variance in total and the most significant SNP (BovineHD0700018734) associated with αs1-CN was located in a 64.5-Mbp region on BTA 7 within the SLC36A2 gene. An important window from 87.14 to 87.16 Mbp was located on BTA 6 within the CSN1S1 gene, which is a major gene affecting αs1-CN in dairy cattle. The three most informative windows explaining 40.85% of the genetic variance associated with αs2-CN were located within a region from 18.80 to 20.02 Mbp on BTA 14. In this region, the SNP BovineHD1400000256 showing the strongest association was located 0.9 Mbp from the DGAT1 gene, which influences milk composition in dairy cattle. Twelve of 25 informative windows explaining 17.29% of the genetic variance for β-CN were clustered on BTA 21 in a region from 47.72 to 47.85 Mbp that contains the SLC25A21 gene. A significant SNP, BovineHD2100013628, located at 87.19 Mbp on BTA 6 was located 0.01 Mbp from the CSN2 gene, which is a major gene influencing αs2-CN. Four windows associated with κ-CN were located within a region from 64.54 to 64.57 Mbp on BTA 7 containing the SLC36A2 gene. A significant SNP, BovineHD0600023887, within an informative window from 87.19 to 87.21 Mbp on BTA 6 was located 0.21 Mbp from the CSN3 gene. A region containing 10 windows explaining 14.23% of the genetic variance from 68.59 to 76.95 Mbp on BTA 11 was strongly associated with α-LA. The most informative window for β-LG was identified within a region containing six windows from 41.70 to 43.62 Mbp on BTA 1.
The two most informative windows associated with casein index were located within a region from 65.19 to 65.24 Mbp on BTA 14. The most significant associations with protein percentage and protein yield were clustered on BTA 7 within a 16.50-Mbp segment that included 13 windows (53.86–70.40 Mbp) that explained 12.44% of the genetic variance and a 3.70-Mbp segment that included eight windows (43.37–46.96 Mbp) that explained 6.63% of the genetic variance.
Candidate Genes and Functional Analyses
A total of 62 functional genes were located in or close to windows that explained no < 0.5% of the genomic variance. PPI and GO enrichment analyses were performed for the 62 most plausible candidate genes. The interaction network of proteins encoded by these genes was more extensive and significant than expected (46 edges identified; PPI enrichment P = 2.7 e−14; Figure 5). We also identified significantly enriched GO terms (false discovery rate < 0.05) for four biological processes and 12 cellular components with four to 24 of these genes for milk protein composition traits (Table 3). On the basis of the functional annotation results, PPI findings, and the biological processes shown in the DAVID analysis, we finally identified 27 prospective candidate genes for milk composition traits with biological functions, including amino acid metabolism, amino acid transport, protein metabolism, and Golgi transport and subsequent modification: ARL6, SST, EHHADH (BTA 1), CSN1S1, CSN1S2, CSN2, CSN3, LAP3 (BTA 6), PCDHB4, PCDHB6, PCDHB7, PCDHB16, SLC36A2 (BTA 7), GALNT14, FPGS (BTA 11), LARP4B, IDI1 (BTA 13), RPL8, HSF1, DGAT1 (BTA 14), COG4, FUK, WDR62, CLIP3 (BTA 18), SLC25A21 (BTA 21), IL5RA (BTA 22), and ACADSB (BTA 26).
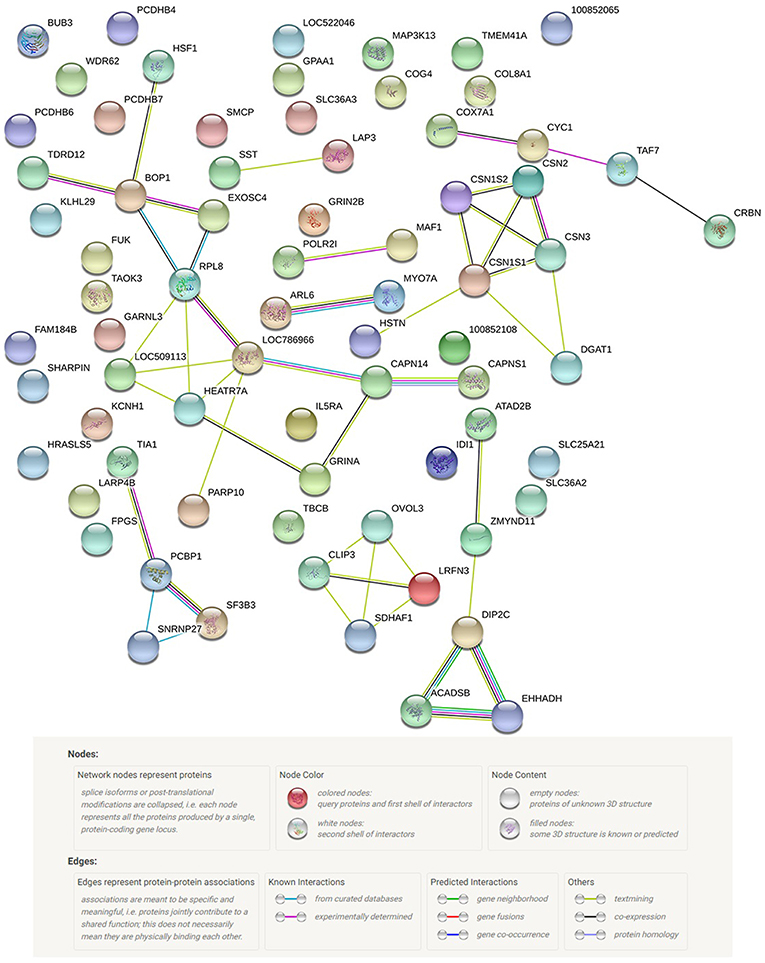
Figure 5. Protein network of the 62 most probable candidate genes detected, according to STRING v10.0 action view.
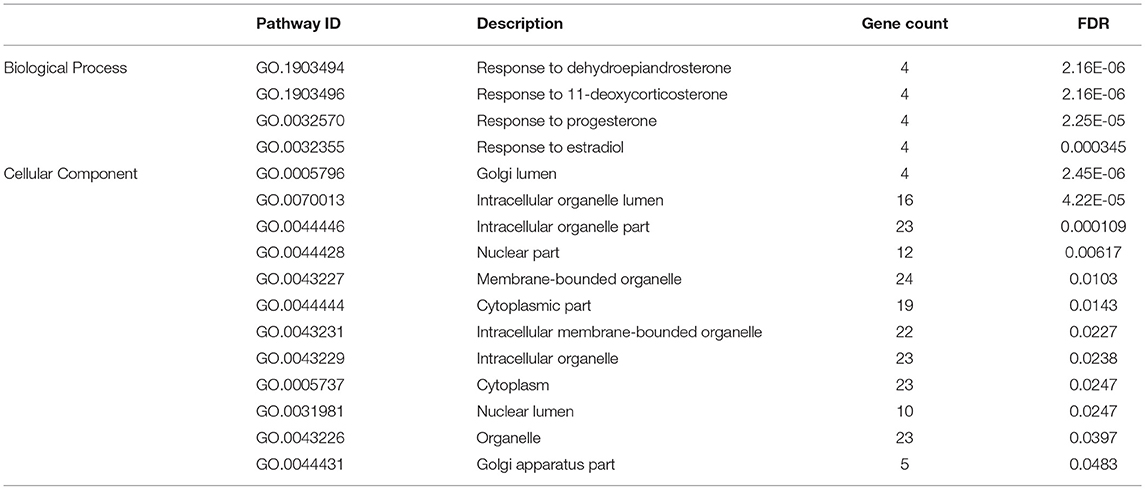
Table 3. Gene Ontology (GO) functional enrichment with false discovery rate (FDR) < 0.05.
Discussion
In this study, we quantified milk protein composition using ELISA kits, and we conducted a single-step GWAS using imputed 777 K chips of 614 Chinese Holstein cows. A total of 178 significant windows for all studied milk composition traits were detected, among which some windows are located within known QTL regions on BTA 1, 6, 14, and 11 (Schopen et al., 2011; Sanchez et al., 2017). However, in the present study, we found no associations between regions on BTA 6 and αs2-CN or between regions on BTA 11 and β-LG, probably due to the different dairy populations that were selected. Several regions were found to be located within or close to genes that are known to have functions related to milk composition. In addition, 25 promising candidate genes for milk protein composition were identified.
Chromosomes Containing Novel Candidate Genes for Milk Composition Traits
On chromosome BTA 1, a total of 21 windows were associated with αs1-CN, αs2-CN, β-CN, κ-CN, β-LG, casein index, and protein yield. Windows associated with β-LG and casein index were located 0.23 Mbp from the ARL6 gene, which encodes ADP ribosylation factor like GTPase 6 and is involved in membrane protein trafficking. ARL6 has been implicated in mammary gland cell membrane trafficking and microtubule dynamics (Kahn et al., 2005; Rao et al., 2012). The somatostatin (SST) and 3-hydroxyacyl coenzyme A dehydrogenase (EHHADH) genes are located in a region of BTA 1 (80.2–82.4 Mbp) that is associated with αS1-CN, αS2-CN, β-CN, and protein yield. Somatostatin (somatotropin release inhibiting factor, SRIF) is an endogenous cyclic polypeptide and abundant neuropeptide with two biologically active forms that exert a wide range of physiological effects on neurotransmission, secretion, and cell proliferation. Somatostatin is also potentially associated with lactation as a signaling molecule (Lupoli et al., 2001). The protein encoded by EHHADH is a bifunctional enzyme and one of the four enzymes of the peroxisomal beta-oxidation pathway. This gene is highly inducible via peroxisome proliferator-activated receptor α (PPARα) activation and has a key influence on milk composition traits (Houten et al., 2012).
We detected 30 windows between 53 and 64 Mbp on BTA 7 that were associated with αs1-CN, αs2-CN, β-CN, κ-CN, protein yield, and protein percentage. Twelve adjacent windows (53.86–53.99 Mbp) were strongly associated with protein percentage and contain multiple genes (PCDHB4, PCDHB6, PCDHB7, and PCDHB16), including the protocadherin beta gene cluster, which is critically involved in the establishment and function of specific cell–cell neural connections in humans (Tan et al., 2010). Moreover, two common contiguous windows within SLC36A2 (64.56–64.57 Mbp) were associated with six milk protein composition traits (αs1-CN, αs2-CN, β-CN, κ-CN, protein yield, and protein percentage). SLC36A2 plays a key role in amino acid transport across the plasma membrane as well as the transport of glucose and other sugars, bile salts and organic acids, metal ions, and amine compounds (Edwards et al., 2018), and may therefore have pleiotropic effects for several milk protein composition traits.
On BTA 11, we identified a region of 17 windows from 68 to 98 Mbp that was associated with αs1-CN, β-CN, κ-CN, and α-LA. There was a strong association between α-LA and a region of five windows (68.28–68.61 Mbp) located 0.1 Mbp from the GALNT14 (polypeptide N-acetylgalactosaminyl transferase 14) gene, a member of the polypeptide N-acetylgalactosaminyl transferase (ppGalNAc-Ts) protein family. These enzymes catalyze the transfer of N-acetyl-d-galactosamine to the hydroxyl groups on serines and threonines of target peptides. The encoded protein participates in protein metabolism (Wang et al., 2003). Therefore, GALNT14 has potential effects on α-LA. Additionally, a segment at 98 Mbp associated with αs1-CN and β-CN was located 0.4 Mbp from the FPGS gene. The folylpolyglutamate synthase enzyme encoded by FPGS plays a central role in establishing and maintaining both cytosolic and mitochondrial folylpolyglutamate concentrations. Further, FPGS is involved in several key metabolic pathways, including those associated with folate biosynthesis and the metabolism of vitamins and cofactors. Therefore, FPGS potentially serves as a bridge between metabolism and synthesis for αs1-CN and β-CN (Oppeneer et al., 2012).
We detected a total of 13 windows on BTA 13 that were associated with αs1-CN, αs2-CN, β-CN, and protein yield. Two of these windows (46.82–46.84 Mbp) were located 0.40 Mbp and 1.7 Mbp from the LARP4B and IDI1 genes, respectively. LARP4B encodes a member of an evolutionarily conserved protein family and is implicated in RNA metabolism and translation. This protein family includes five sub-families: one genuine La protein and four La-related protein (LARP) sub-families. LARP4B may stimulate amino acid transport as a cytoplasmic protein (Mattijssen and Maraia, 2016). IDI1 plays a key role in the metabolism of nutrients in the liver and is involved in milk protein synthesis. Therefore, both LARP4B and IDI1 are promising candidate genes for milk protein composition traits (Shi et al., 2018).
On BTA 18, a total of 14 windows were associated with αs1-CN, αs2-CN, κ-CN, protein yield, and protein percentage. The COG4 and FUK genes were noted in a region containing two adjacent windows (16.78–16.90 Mbp) that were associated with protein percentage. COG4 (component of oligomeric Golgi complex 4) is a protein-coding gene that is involved in the structure and function of the Golgi apparatus, whereas FUK (fucokinase) is involved in protein metabolism and transport to the Golgi and subsequent modification. Thus, COG4 and FUK may play key roles in the transport of milk proteins. The WDR62 (WD repeat domain 62) gene was also located in a region that included nine windows (43.37–46.96 Mbp) with significant associations with αs1-CN, αs2-CN, κ-CN, protein yield, and protein percentage. WRD62 encodes a c-Jun N-terminal kinase scaffold protein. Scaffold proteins such as WRD62 simultaneously associate with various components of the MAPK signal pathway and play a crucial role in signal transmission and MAPK regulation. The MAPK pathway regulates cellular proliferation and differentiation, in part by controlling protein translation machinery (Sciascia et al., 2013). Therefore, WDR62 may play a significant role in milk protein synthesis. Additionally, the CLIP3 (CAP-Gly domain-containing linker protein 3) gene, which encodes a member of the cytoplasmic linker proteins of 170 family, was located 0.28 Mbp from this region. Members of this protein family contain a cytoskeleton-associated protein glycine-rich domain and mediate the interaction of microtubules with cellular organelles.
Finally, 11 contiguous windows associated with β-CN were located from 47.72 to 47.85 Mbp on BTA 21 containing the SLC25A21 (solute carrier family 25 member 21) gene, which encodes a protein that participates in amino acid metabolism (Scarcia et al., 2017). On BTA 22, we detected an informative window (23.30–23.31 Mbp) that was significantly associated with β-LG and casein index and included the IL5RA (interleukin 5 receptor subunit alpha) gene. As a novel milk protein gene, IL5RA activates multiple downstream Jak-STAT signaling pathways and is involved in proteasome-mediated ubiquitin-dependent protein catabolism. On BTA 26, three adjacent windows (43.24–43.29 Mbp) that were significantly associated with casein index were located proximal to the ACADSB (acyl-CoA dehydrogenase short/branched chain) gene, the encoded protein of which is involved branched-chain amino acid catabolism (Liu et al., 2013).
Chromosomes Containing Known Candidate Genes for Milk Composition Traits
We identified 16 windows on BTA 6 (87.19–87.21 Mbp) that were associated with αs1-CN, αs2-CN, β-CN, κ-CN, β-LG, casein index, and protein yield. This segment included the casein gene cluster containing the CSN1S1, CSN1S2, CSN2, and CSN3 genes, which encode αs1, αs2, β, and κ casein, respectively. The casein gene cluster has a strong influence on casein synthesis in bovine milk, and polymorphisms in this region have significant effects on milk protein composition and cheese-making abilities (Grosclaude, 1988; Grisart et al., 2002). Additionally, a window associated with αs1-CN located at 38.61 Mbp was 0.11 Mbp from the LAP3 (leucine aminopeptidase 3) gene. As a known gene affecting milk production traits, LAP3 is involved in arginine and proline metabolism and affects protein maturation and degradation (Zheng et al., 2011), thereby potentially affecting casein synthesis.
A 2-Mbp region of BTA 14 (18.61–20.02 Mbp) containing six windows was associated with αs1-CN, β-CN, κ-CN, and α-LA. In this region, we identified the SNP BovineHD1400007026 as being most significantly associated with αS1-CN, αS2-CN, β-CN, κ-CN, α-LA, and protein yield. Several genes were identified in this region, including DGAT1, which has major effects on milk protein, milk fat content, and mineral composition in bovine milk (Schennink et al., 2007; Bovenhuis et al., 2016). The RPL8 gene, located 2.7 Mbp from this region, probably plays an important role in the transcriptional regulation of DGAT1 and may exert significant effects on milk production traits in dairy cattle (Jiang et al., 2010, 2014). Therefore, both DGAT1 and RPL8 are important candidate genes for milk protein composition traits. Additionally, the HSF1 gene, located 0.6 Mbp from this region, is involved in ERK signaling and the cellular response to heat stress. The protein encoded by HSF1 is rapidly induced in response to temperature stress and binds heat shock promoter elements. HSF1 has a significant effect on milk production mediated by a lysine-232/alanine polymorphism in the bovine DGAT1 gene (Winter et al., 2002). Therefore, HSF1 may have indirect effects on milk proteins such as αs1-CN, β-CN, κ-CN, and α-LA.
Conclusions
In the present study, we identified a total of 178 genomic windows and 194 SNPs on 24 bovine autosomes that were significantly associated with milk protein composition or protein percentage, including six genomic regions on chromosomes BTA 1, 6, 11, 13, 14, and 18. Within these regions, we identified the following 27 candidate genes for milk composition traits: ARL6, SST, EHHADH, CSN1S1, CSN1S2, CSN2, CSN3, LAP3, PCDHB4, PCDHB6, PCDHB7, PCDHB16, SLC36A2, GALNT14, FPGS, LARP4B, IDI1, RPL8, HSF1, DGAT1, COG4, FUK, WDR62, CLIP3, SLC25A21, IL5RA, and ACADSB. The findings of this study provide an important foundation for future fine-mapping studies to more precisely elucidate the mutations affecting milk protein composition traits in dairy cattle. Future studies should establish causative links between candidate variants and milk protein phenotypes using functional analyses.
Data Availability
The genotype and phenotype data of the samples used in the present study are available from the FigShare Repository: https://figshare.com/s/206a2bcbf0cb0e4c2564
Ethics Statement
Milk samples were collected from farms that periodically undergo quarantine inspections. The entire collection process was performed in strict accordance with a protocol approved by the AnimalWelfare Committee of China Agricultural University (permit number: DK996).
Author Contributions
SZ conceived and designed the study, and revised the manuscript. CZ performed the phenotype collection, sample collection, data analysis, and drafted the manuscript. CL participated in the experimental design and drafted the manuscript. SL, WC, and SS participated in sample collection. QZ participated in data interpretation and manuscript revision. All authors have read and approved the final manuscript.
Funding
This work was supported by the 863 project (2013AA102504), the National Science and Technology Programs of China (2011BAD28B02), National Key Technologies R & D Program (2012BAD12B01), the Beijing Dairy Industry Innovation Team, China Agricultural Research System (CARS-36), and the Xinjiang Province Key Technology Integration and Demonstration Program (201230116). We are deeply grateful to all donors who participated in this program.
Conflict of Interest Statement
The authors declare that the research was conducted in the absence of any commercial or financial relationships that could be construed as a potential conflict of interest.
Acknowledgments
We thank Prof. Jianfeng Liu for valuable discussion and their colleagues in the molecular quantitative genetics team at the National Engineering Laboratory for Animal Breeding of China Agricultural University, and all those who have contributed to the present study.
Supplementary Material
The Supplementary Material for this article can be found online at: https://www.frontiersin.org/articles/10.3389/fgene.2019.00072/full#supplementary-material
Table S1. Single-nucleotide polymorphisms showing the most significant association with six major milk proteins, casein index, protein percentage, and protein yield.
Figure S1. Manhattan plot for the proportion of genetic variance explained by the 5-SNP moving windows associated with αs1−CN.
Figure S2. Manhattan plot for the proportion of genetic variance explained by the 5-SNP moving windows associated with αs2-CN.
Figure S3. Manhattan plot for the proportion of genetic variance explained by the 5-SNP moving windows associated with β-CN.
Figure S4. Manhattan plot for the proportion of genetic variance explained by the 5-SNP moving windows associated with κ-CN.
Figure S5. Manhattan plot for the proportion of genetic variance explained by the 5-SNP moving windows associated with α-LA.
Figure S6. Manhattan plot for the proportion of genetic variance explained by the 5-SNP moving windows associated with β-LG.
Figure S7. Manhattan plot for the proportion of genetic variance explained by the 5-SNP moving windows associated with casein index.
Figure S8. Manhattan plot for the proportion of genetic variance explained by the 5-SNP moving windows associated with protein percentage.
Figure S9. Manhattan plot for the proportion of genetic variance explained by the 5-SNP moving windows associated with protein yield.
Figure S10. Manhattan plot for the –log10 (P-value) of single SNP associated with αs1−CN.
Figure S11. Manhattan plot for the –log10 (P-value) of single SNP associated with αs2-CN.
Figure S12. Manhattan plot for the –log10 (P-value) of single SNP associated with β-CN.
Figure S13. Manhattan plot for the –log10 (P-value) of single SNP associated with κ-CN.
Figure S14. Manhattan plot for the –log10 (P-value) of single SNP associated with α-LA.
Figure S15. Manhattan plot for the –log10 (P-value) of single SNP associated with β-LG.
Figure S16. Manhattan plot for the –log10 (P-value) of single SNP associated with casein index.
Figure S17. Manhattan plot for the –log10 (P-value) of single SNP associated with protein percentage.
Figure S18. Manhattan plot for the –log10 (P-value) of single SNP associated with protein yield.
Figure S19. Genetic map for 118 QTL related to milk protein composition.
References
Aguilar, I., Misztal, I., Johnson, D. L., Legarra, A., Tsuruta, S., and Lawlor, T. J. (2010). Hot topic: a unified approach to utilize phenotypic, full pedigree, and genomic information for genetic evaluation of Holstein final score. J. Dairy Sci. 93, 743–752. doi: 10.3168/jds.2009-2730
Bovenhuis, H., Visker, M. H. P. W., Poulsen, N. A., Sehested, J., Van Valenberg, H. J. F., Van Arendonk, J. A. M., et al. (2016). Effects of the diacylglycerol o-acyltransferase 1 (DGAT1) K232A polymorphism on fatty acid, protein, and mineral composition of dairy cattle milk. J. Dairy Sci. 99, 3113–3123. doi: 10.3168/jds.2015-10462
Brennan, K. C., Bates, E. A., Shapiro, R. E., Zyuzin, J., Hallows, W. C., Huang, Y., et al. (2013). Casein kinase Iδ mutations in familial migraine and advanced sleep phase. Sci. Transl. Med. 5:183ra56–11. doi: 10.1126/scitranslmed.3005784
Browning, S. R., and Browning, B. L. (2007). Rapid and accurate haplotype phasing and missing-data inference for whole-genome association studies by use of localized haplotype clustering. Am. J. Hum. Genet. 81, 1084–1097. doi: 10.1086/521987
Christensen, O. F., and Lund, M. S. (2010). Genomic prediction when some animals are not genotyped. Genet Sel Evol 42:2. doi: 10.1186/1297-9686-42-2
Daetwyler, H. D., Schenkel, F. S., Sargolzaei, M., and Robinson, J. A. (2008). A genome scan to detect quantitative trait loci for economically important traits in holstein cattle using two methods and a dense single nucleotide polymorphism map. J. Dairy Sci. 91, 3225–3236. doi: 10.3168/jds.2007-0333
Edwards, N., Anderson, C. M. H., Conlon, N. J., Watson, A. K., Hall, R. J., Cheek, T. R., et al. (2018). Resculpting the binding pocket of APC superfamily LeuT-fold amino acid transporters. Cell. Mol. Life Sci. 75, 921–938. doi: 10.1007/s00018-017-2677-8
Fekete, Á. A., Givens, D. I., and Lovegrove, J. A. (2013). The impact of milk proteins and peptides on blood pressure and vascular function: a review of evidence from human intervention studies. Nutr. Res. Rev. 26, 177–190. doi: 10.1017/S0954422413000139
Flicek, P., Ahmed, I., Amode, M. R., Barrell, D., Beal, K., Brent, S., et al. (2013). Ensembl 2013. Nucleic Acids Res. 41, D48–D55. doi: 10.1093/nar/gks1236
Forni, S., Aguilar, I., and Misztal, I. (2011). Different genomic relationship matrices for single-step analysis using phenotypic, pedigree and genomic information. Genet Sel Evol 43:1. doi: 10.1186/1297-9686-43-1
Fragomeni Bde, O., Misztal, I., Lourenco, D. L., Aguilar, I., Okimoto, R., Muir, W. M., et al. (2014). Changes in variance explained by top SNP windows over generations for three traits in broiler chicken. Front. Genet. 5, 332–332. doi: 10.3389/fgene.2014.00332
Grisart, B., Coppieters, W., Farnir, F., Karim, L., Ford, C., Berzi, P., et al. (2002). Positional candidate cloning of a QTL in dairy cattle: identification of a missense mutation in the bovine DGAT1 gene with major effect on milk yield and composition. Genome Res. 12, 222–231. doi: 10.1101/gr.224202
Grosclaude, F. (1988). Le polymorphisme génétique des principales lactoprotéines bovines. Relations avec la quantité, la composition et les aptitudes fromagères du lait. Product. Anim. 1, 5–17.
Heck, J. M., Schennink, A., Van Valenberg, H. J., Bovenhuis, H., Visker, M. H., Van Arendonk, J. A., et al. (2009). Effects of milk protein variants on the protein composition of bovine milk. J. Dairy Sci. 92, 1192–1202. doi: 10.3168/jds.2008-1208
Houten, S. M., Denis, S., Argmann, C. A., Jia, Y., Ferdinandusse, S., Reddy, J. K., et al. (2012). Peroxisomal L-bifunctional enzyme (Ehhadh) is essential for the production of medium-chain dicarboxylic acids. J. Lipid Res. 53, 1296–1303. doi: 10.1194/jlr.M024463
Huang Da, W., Sherman, B. T., and Lempicki, R. A. (2009a). Bioinformatics enrichment tools: paths toward the comprehensive functional analysis of large gene lists. Nucleic Acids Res. 37, 1–13. doi: 10.1093/nar/gkn923
Huang Da, W., Sherman, B. T., and Lempicki, R. A. (2009b). Systematic and integrative analysis of large gene lists using DAVID bioinformatics resources. Nat. Protoc. 4, 44–57. doi: 10.1038/nprot.2008.211
Huang, W., Peñagaricano, F., Ahmad, K. R., Lucey, J. A., Weigel, K. A., and Khatib, H. (2012). Association between milk protein gene variants and protein composition traits in dairy cattle. J. Dairy Sci. 95, 440–449. doi: 10.3168/jds.2011-4757
Jiang, L., Liu, J., Sun, D., Ma, P., Ding, X., Yu, Y., et al. (2010). Genome wide association studies for milk production traits in Chinese Holstein population. PLoS ONE 5:e13661. doi: 10.1371/journal.pone.0013661
Jiang, L., Liu, X., Yang, J., Wang, H., Jiang, J., Liu, L., et al. (2014). Targeted resequencing of GWAS loci reveals novel genetic variants for milk production traits. BMC Genomics 15:1105. doi: 10.1186/1471-2164-15-1105
Kahn, R. A., Volpicellidaley, L., Bowzard, B., Shrivastavaranjan, P., Li, Y., Zhou, C., et al. (2005). Arf family GTPases: roles in membrane traffic and microtubule dynamics. Biochem. Soc. Trans. 33, 1269–1272. doi: 10.1042/BST0331269
Kanehisa, M., Goto, S., Sato, Y., Kawashima, M., Furumichi, M., and Tanabe, M. (2014). Data, information, knowledge and principle: back to metabolism in KEGG. Nucleic Acids Res. 42, D199–D205. doi: 10.1093/nar/gkt1076
Konstantinou, G. N., Bencharitiwong, R., Grishin, A., Caubet, J. R. J., Bardina, L., Sicherer, S. H., et al. (2014). The role of casein-specific IgA and TGF-β in children with food protein-induced enterocolitis syndrome to milk. Pediatr. Allergy Immunol. 25, 651–656. doi: 10.1111/pai.12288
Legarra, A., Aguilar, I., and Misztal, I. (2009). A relationship matrix including full pedigree and genomic information. J. Dairy Sci. 92, 4656–4663. doi: 10.3168/jds.2009-2061
Li, C., Sun, D., Zhang, S., Wang, S., Wu, X., Zhang, Q., et al. (2014). Genome wide association study identifies 20 novel promising genes associated with milk fatty acid traits in chinese holstein. PLoS ONE 9:e96186. doi: 10.1371/journal.pone.0096186
Liu, X., Wu, L., Deng, G., Chen, G., Li, N., Chu, X., et al. (2013). Comparative studies of Acyl-CoA dehydrogenases for monomethyl branched chain substrates in amino acid metabolism. Bioorg. Chem. 47, 1–8. doi: 10.1016/j.bioorg.2012.12.001
Lundén, A., Nilsson, M., and Janson, L. (1997). Marked effect of beta-lactoglobulin polymorphism on the ratio of casein to total protein in milk. J. Dairy Sci. 80, 2996–3005. doi: 10.3168/jds.S0022-0302(97)76266-0
Lupoli, B., Johansson, B., Uvnäs, K., and Svennersten-Sjaunja, K. (2001). Effect of suckling on the release of oxytocin, prolactin, cortisol, gastrin, cholecystokinin, somatostatin and insulin in dairy cows and their calves. J. Dairy Res. 68, 175–187. doi: 10.1017/S0022029901004721
Ma, P., Lund, M. S., Ding, X., Zhang, Q., and Su, G. (2014). Increasing imputation and prediction accuracy for Chinese Holsteins using joint Chinese-Nordic reference population. J. Anim. Breed. Genetics 131, 462–472. doi: 10.1111/jbg.12111
Mattijssen, S., and Maraia, R. J. (2016). LARP4 is regulated by tumor necrosis factor alpha in a tristetraprolin-dependent manner. Mol. Cell. Biol. 36, 574–584. doi: 10.1128/MCB.00804-15
Medeiros de Oliveira Silva, R., BonvinoStafuzza, N., de Oliveira Fragomeni, B., Miguel Ferreira De Camargo, G., Matos Ceacero, T., Noely Dos Santos Gonçalves Cyrillo, J., et al. (2017). Genome-wide association study for carcass traits in an experimental nelore cattle population. PLoS ONE 12:e0169860. doi: 10.1371/journal.pone.0169860
Miluchová, M., Gábor, M., and Trakovická, A. (2013). Analysis of slovak spotted breed for bovine beta casein A1 variant as risk factor for human health. Acta Biochim. Pol. 60, 799–801.
Misztal, I., Aggrey, S. E., and Muir, W. M. (2013a). Experiences with a single-step genome evaluation. Poult. Sci. 92, 2530–2534. doi: 10.3382/ps.2012-02739
Misztal, I., Legarra, A., and Aguilar, I. (2009). Computing procedures for genetic evaluation including phenotypic, full pedigree, and genomic information. J. Dairy Sci. 92, 4648–4655. doi: 10.3168/jds.2009-2064
Misztal, I., Tsuruta, S., Aguilar, I., Legarra, A., Vanraden, P. M., and Lawlor, T. J. (2013b). Methods to approximate reliabilities in single-step genomic evaluation. J. Dairy Sci. 96, 647–654. doi: 10.3168/jds.2012-5656
Oppeneer, S. J., Ross, J. A., Koh, W., Yuan, J., and Robien, K. (2012). Genetic variation in folylpolyglutamate synthase and gamma-glutamyl hydrolase and plasma homocysteine levels in the Singapore Chinese Health Study. Mol. Genet. Metab. 105, 73–78. doi: 10.1016/j.ymgme.2011.09.035
Parker Gaddis, K. L., Megonigal, J. H., Clay, J. S., and Wolfe, C. W. (2018). Genome-wide association study for ketosis in US Jerseys using producer-recorded data. J. Dairy Sci. 101, 413–424. doi: 10.3168/jds.2017-13383
Prado, I. N. D., Moreira, F. B., Matsushita, M., and De Souza, N. E. (2003). Longissimus dorsi fatty acids composition of Bos indicus and Bos indicus x Bos taurus crossbred steers finished in pasture. Brazil. Arch. Biol. Technol. 46, 601–608. doi: 10.1590/S1516-89132003000400015
Rao, S., Ge, S., and Shelly, M. (2012). Centrosome positioning and primary cilia assembly orchestrate neuronal development. Front. Biol. China 7, 412–427. doi: 10.1007/s11515-012-1231-1
Sanchez, M., Govignon-Gion, A., Croiseau, P., Fritz, S., Hozé, C., Miranda, G., et al. (2017). Within-breed and multi-breed GWAS on imputed whole-genome sequence variants reveal candidate mutations affecting milk protein composition in dairy cattle. Genet. Select. Evolut. 49:68. doi: 10.1186/s12711-017-0344-z
Scarcia, P., Palmieri, L., Agrimi, G., Palmieri, F., and Rottensteiner, H. (2017). Three mitochondrial transporters of Saccharomyces cerevisiae are essential for ammonium fixation and lysine biosynthesis in synthetic minimal medium. Mol. Genet. Metab. 122, 54–60. doi: 10.1016/j.ymgme.2017.07.004
Schennink, A., Stoop, W. M., Visker, M. W., Heck, J. M., Bovenhuis, H., Van Der Poel, J. J., et al. (2007). DGAT1 underlies large genetic variation in milk-fat composition of dairy cows. Anim. Genet. 38, 467–473. doi: 10.1111/j.1365-2052.2007.01635.x
Schopen, G. C., Heck, J. M., Bovenhuis, H., Visker, M. H. P. W., Van Valenberg, H. J., Van Arendonk, J. A., et al. (2009). Genetic parameters for major milk proteins in Dutch holstein-friesians. J. Dairy Sci. 92, 1182–1191. doi: 10.3168/jds.2008-1281
Schopen, G. C., Visker, M. H., Koks, P. D., Mullaart, E., Van Arendonk, J. A., and Bovenhuis, H. (2011). Whole-genome association study for milk protein composition in dairy cattle. J. Dairy Sci. 94, 3148–3158. doi: 10.3168/jds.2010-4030
Sciascia, Q., Pacheco, D., and Mccoard, S. A. (2013). Increased milk protein synthesis in response to exogenous growth hormone is associated with changes in mechanistic (mammalian) target of rapamycin (mTOR)C1-dependent and independent cell signaling. J. Dairy Sci. 96, 2327–2338. doi: 10.3168/jds.2012-6267
Shi, H., Zhang, J., Li, S., Ji, S., Cao, Z., Zhang, H., et al. (2018). Effects of a wide range of dietary forage-to-concentrate ratios on nutrient utilization and hepatic transcriptional profiles in limit-fed Holstein heifers. BMC Genomics 19:148. doi: 10.1186/s12864-018-4529-9
Szklarczyk, D., Franceschini, A., Wyder, S., Forslund, K., Heller, D., Huerta-Cepas, J., et al. (2015). STRING v10: protein-protein interaction networks, integrated over the tree of life. Nucleic Acids Res. 43, D447–D452. doi: 10.1093/nar/gku1003
Tan, Y. P., Li, S., Jiang, X. J., Loh, W., Foo, Y. K., Loh, C. B., et al. (2010). Regulation of protocadherin gene expression by multiple neuron-restrictive silencer elements scattered in the gene cluster. Nucleic Acids Res. 38, 4985–4997. doi: 10.1093/nar/gkq246
Tiezzi, F., Parker-Gaddis, K. L., Cole, J. B., Clay, J. S., and Maltecca, C. (2015). A Genome-wide association study for clinical mastitis in first parity US holstein cows using single-step approach and genomic matrix re-weighting procedure. PLoS ONE 10:e0114919. doi: 10.1371/journal.pone.0114919
Tsiaras, A., Bargouli, G. G., Banos, G., and Boscos, C. M. (2005). Effect of kappa-casein and beta-lactoglobulin loci on milk production traits and reproductive performance of holstein cows. J. Dairy Sci. 88, 327–334. doi: 10.3168/jds.S0022-0302(05)72692-8
Vanraden, P. M., Van Tassell, C. P., Wiggans, G. R., Sonstegard, T. S., Schnabel, R. D., Taylor, J. F., et al. (2009). Invited review: reliability of genomic predictions for North American holstein bulls. J. Dairy Sci. 92, 16–24. doi: 10.3168/jds.2008-1514
Viale, E., Tiezzi, F., Maretto, F., De Marchi, M., Penasa, M., and Cassandro, M. (2017). Association of candidate gene polymorphisms with milk technological traits, yield, composition, and somatic cell score in Italian Holstein-Friesian sires. J. Dairy Sci. 100, 7271–7281. doi: 10.3168/jds.2017-12666
Wang, H., Misztal, I., Aguilar, I., Legarra, A., Fernando, R. L., Vitezica, Z., et al. (2014). Genome-wide association mapping including phenotypes from relatives without genotypes in a single-step (ssGWAS) for 6-week body weight in broiler chickens. Front. Genet. 5:134. doi: 10.3389/fgene.2014.00134
Wang, H., Misztal, I., Aguilar, I., Legarra, A., and Muir, W. (2012). Genome-wide association mapping including phenotypes from relatives without genotypes. Genet. Res. 94, 73–83. doi: 10.1017/S0016672312000274
Wang, H., Tachibana, K., Zhang, Y., Iwasaki, H., Kameyama, A., Cheng, L., et al. (2003). Cloning and characterization of a novel UDP-GalNAc:polypeptide N-acetylgalactosaminyltransferase, pp-GalNAc-T14?. Biochem. Biophys. Res. Commun. 300, 738–744. doi: 10.1016/S0006-291X(02)02908-X
Winter, A., Krämer, W., Werner, F. A., Kollers, S., Kata, S., Durstewitz, G., et al. (2002). Association of a lysine-232/alanine polymorphism in a bovine gene encoding acyl-CoA:diacylglycerol acyltransferase (DGAT1) with variation at a quantitative trait locus for milk fat content. Proc. Natl. Acad. Sci. U.S.A. 99, 9300–9305. doi: 10.1073/pnas.142293799
Wu, P., Yang, Q., Wang, K., Zhou, J., Ma, J., Tang, Q., et al. (2017). Single step genome-wide association studies based on genotyping by sequence data reveals novel loci for the litter traits of domestic pigs. Genomics 110, 171–179. doi: 10.1016/j.ygeno.2017.09.009
Zhang, Z., Liu, J., Ding, X., Bijma, P., De Koning, D.-J., and Zhang, Q. (2010). Best linear unbiased prediction of genomic breeding values using a trait-specific marker-derived relationship matrix. PLoS ONE 5:e12648. doi: 10.1371/journal.pone.0012648
Keywords: genome-wide association, milk protein, casein, α-lactalbumin, β-lactoglobulin, ssGBLUP
Citation: Zhou C, Li C, Cai W, Liu S, Yin H, Shi S, Zhang Q and Zhang S (2019) Genome-Wide Association Study for Milk Protein Composition Traits in a Chinese Holstein Population Using a Single-Step Approach. Front. Genet. 10:72. doi: 10.3389/fgene.2019.00072
Received: 01 August 2018; Accepted: 28 January 2019;
Published: 19 February 2019.
Edited by:
Denis Milan, Institut National de la Recherche Agronomique (INRA), FranceReviewed by:
Fabyano Fonseca Silva, Universidade Federal de Viçosa, BrazilStoycho N. Metodiev, Trakia University, Bulgaria
Pascal Croiseau, INRA Centre Jouy-en-Josas, France
Copyright © 2019 Zhou, Li, Cai, Liu, Yin, Shi, Zhang and Zhang. This is an open-access article distributed under the terms of the Creative Commons Attribution License (CC BY). The use, distribution or reproduction in other forums is permitted, provided the original author(s) and the copyright owner(s) are credited and that the original publication in this journal is cited, in accordance with accepted academic practice. No use, distribution or reproduction is permitted which does not comply with these terms.
*Correspondence: Shengli Zhang, emhhbmdzbGNhdUBjYXUuZWR1LmNu