 Yupeng Cui1
 Jianjiang Ma1
 Guoyuan Liu1
 Nuohan Wang1Wenfeng Pei1
 Man Wu1Xingli Li1
 Jinfa Zhang2*
 Jiwen Yu1*
- 1State Key Laboratory of Cotton Biology, Cotton Institute of the Chinese Academy of Agricultural Sciences, Key Laboratory of Cotton Genetic Improvement, Ministry of Agriculture, Anyang, China
- 2Department of Plant and Environmental Sciences, New Mexico State University, Las Cruces, NM, United States
Cotton is an economically important crop grown for natural fiber and seed oil production. Cottonseed oil ranks third after soybean oil and colza oil in terms of edible oilseed tonnage worldwide. Glycerol-3-phosphate acyltransferase (GPAT) genes encode enzymes involved in triacylglycerol biosynthesis in plants. In the present study, 85 predicted GPAT genes were identified from the published genome data in Gossypium. Among them, 14, 16, 28, and 27 GPAT homologs were identified in G. raimondii, G. arboreum, G. hirsutum, and G. barbadense, respectively. Phylogenetic analysis revealed that a total of 108 GPAT genes from cotton, Arabidopsis and cacao could be classified into three groups. Furthermore, through comparison, the gene structure analyses indicated that GPAT genes from the same group were highly conserved between Arabidopsis and cotton. Segmental duplication could be the major driver for GPAT gene family expansion in the four cotton species above. Expression patterns of GhGPAT genes were diverse in different tissues. Most GhGPAT genes were induced or suppressed after salt or cold stress in Upland cotton. Eight GhGPAT genes were co-localized with oil and protein quantitative trait locus (QTL) regions. Thirty-two single nucleotide polymorphisms (SNPs) were detected from 12 GhGPAT genes, sixteen of which in nine GhGPAT genes were classified as synonymous, and sixteen SNPs in ten GhGPAT genes non-synonymous. Two SNP markers of the GhGPAT16 and GhGPAT26 genes were significantly correlated with cotton oil content in one of the three field tests. This study shed lights on the molecular evolutionary properties of GPAT genes in cotton, and provided reference for improvement of cotton response to abiotic stress and the genetic improvement of cotton oil content.
Introduction
The majority of fatty acids are incorporated into membrane glycerolipids or triacylglycerol in a plant cells. The initial and committed step of glycerolipid biosynthesis is catalyzed by glycerol-3-phosphate acyltransferase, which catalyzes the transfer of a fatty acyl moiety from acyl-CoA, dicarboxylic acid-CoA or acyl-acyl carrier protein to the sn-1 or sn-2 position of glycerol 3-phosphate, resulting in the formation of lysophosphatic acid (LPA) (Zheng et al., 2003; Singer et al., 2016; Waschburger et al., 2018). There are plastid, endoplasmic reticulum (ER) and mitochondrial GPATs in plants (Gidda et al., 2009; Chen et al., 2011). Plastid GPATs participate in the prokaryotic biosynthesis of phospholipids, sulfolipids, and galactolipids (Ohlrogge and Browse, 1995), ER and mitochondrial GPATs are mainly involved in the synthesis of cutin, suberin, and storage lipids (Yang et al., 2012). The alignment of GPAT amino acid sequences from evolutionarily diverse organisms has revealed that all GPATs contain at least four highly conserved motifs, which are essential for both acyltransferase activity and the binding of glycerol-3-phosphate substrate (Lewin et al., 1999). The GPAT genes have been identified by genome-wide analyses in Arabidopsis, mammals and other plant species (Zheng et al., 2003; Gidda et al., 2009; Bertolesi et al., 2012; Yang et al., 2012; Waschburger et al., 2018), and fall within three different classes. Previous studies showed that GPAT gene is related to the fertility, oil content of plant, seed development and stress tolerance (Liu et al., 2013; Payá-Milans et al., 2016). In Arabidopsis, ten GPAT genes have been identified (Zheng et al., 2003; Gidda et al., 2009). AtATS1 functions in the production of major phospholipids (Singer et al., 2016). AtGPAT1 plays an essential role in pollen fertility, the disruption of AtGPAT1 affects tapetal differentiation and causes most microspores to abort before reaching maturity, and atgpat1/atgpat6 double mutants reduced the seed setting rate of Arabidopsis (Zheng et al., 2003). AtGPAT4, AtGPAT5, and AtGPAT8 are involved in the production of cutin or suberin, atgpat5 mutant could decrease suberin content in seed coat and root of Arabidopsis (Beisson et al., 2007), atgpat4/atgpat8 double mutants could reduce cutin biosynthesis in Arabidopsis, while overexpression of AtGPAT4 or AtGPAT8 in Arabidopsis could increase the content of C16 and C18 cutin monomers in leaves and stems by 80% (Li et al., 2007). AtGPAT9 is known to be essential for seed triacylglycerol (TAG) biosynthesis (Gidda et al., 2009), knockdown of AtGPAT9 can reduce seed oil content and an atgpat9 mutant causes both male and female gametophytic lethality phenotypes (Shockey et al., 2016). Furthermore, AtGPAT9 plays a role in the biosynthesis of polar lipids and TAG in developing leaves, as well as lipid droplet production in developing pollen grains of Arabidopsis (Singer et al., 2016).
Since the first identified plant GPAT gene was reported to function in tapetum differentiation and male fertility in Arabidopsis (Zheng et al., 2003), many studies have reported that GPAT genes are involved in adverse environmental conditions, such as cold, salt, and heat stress, indicating their potential roles in tolerance to abiotic stresses. The overexpression of the AtATS1 gene has been reported to improve the tolerance of tobacco seedlings to chilling stress, while the transformation of a squash GPAT gene into tobacco resulted in decreased chilling tolerance (Murata and Tasaka, 1992). In rice, the overexpression of AtATS1 gene increased the unsaturation of fatty acids in phosphatidylglycerol (PG) and improved the photosynthetic rates and growth at low temperatures (Yokoi et al., 1998; Ariizumi et al., 2002). The chloroplast GPAT gene from tomato (LeGPAT) was enhanced by chilling temperature (4°C) and suppressed by high temperature (40°C) in tomato leaves, and overexpression of the LeGPAT enhanced chilling tolerance by increasing the content of unsaturated fatty acids in PG (Sui et al., 2007b). Similarly, the overexpression of chloroplast LeGPAT in tomato enhanced chilling (Sui et al., 2007a) and salt tolerance (Sun et al., 2010), and the overexpression of Suaeda salsa GPAT gene (SsGPAT) in Arabidopsis enhanced salt tolerance (Sui et al., 2017). However, antisense-mediated depletion of chloroplast LeGPAT gene alleviated heat stress damage in transgenic tomato plants (Sui et al., 2010). Many other similar studies on GPAT genes and their functions have been reported (Payá-Milans et al., 2016; Misra et al., 2017; Xie et al., 2018). However, little is known about this gene family in cotton, especially their potential roles in lipid or oil synthesis or under salt and cold stress in Upland cotton.
Cotton (Gossypium) is the most important natural fiber-producing plant species for the textile industry, and according to the Foreign Agricultural Service, cotton is also the fifth largest vegetable oil-producing crop after soybeans, rapeseed, sunflower and peanuts in the world (https://apps.fas.usda.gov/psdonline/circulars/oilseeds.pdf). There are approximately 50 species of Gossypium including 45 diploid (2n = 2x = 26) and 5 tetraploid (2n = 4x = 52) species. Approximately 1–2 million years ago, diploid cotton species resembling G. arboreum (A2) and G. raimondii (D5) hybridized and underwent polyploidization, giving rise to tetraploid cotton species (Cronn et al., 1999; Paterson et al., 2012; Li et al., 2014). The recent progress in the whole-genome sequencing in G. raimondii (Paterson et al., 2012; Wang et al., 2012), G. arboreum (Li et al., 2014), G. hirsutum (Li et al., 2015; Zhang T. et al., 2015), and G. barbadense (Liu et al., 2015; Yuan et al., 2015) has rendered it possible to genome-wide analyses of important gene families including the GPAT gene family in the four species with their genomes sequenced.
In this study, all of the GPAT family genes in the four sequenced cotton species were identified and characterized. We further analyzed their phylogenetic tree, gene structure, chromosomal localization, functional diversification and expression profiles of GPAT genes in various tissues and under salt or cold stress. The duplication events of GPAT genes in the four cotton species were also analyzed. Finally, single nucleotide polymorphisms (SNPs) of GhGPAT genes were identified to study their association with cottonseed oil content using high-resolution melting (HRM). The results will contribute to widen our understanding about the gene structures and functions of GPAT family genes in Gossypium, and provide useful information on the relationship between GhGPAT genes and seed oil content in cotton.
Materials and Methods
Sequence Retrial and Identification of GPAT Family Members in Gossypium
The completed genome sequences of G. raimondii (Paterson et al., 2012), G. arboreum (Li et al., 2014), G. hirsutum acc. TM-1 (Zhang T. et al., 2015), and G. barbadense acc. 3-79 (Yuan et al., 2015) were downloaded from the CottonGen website1 (Yu et al., 2014). The genome sequences and the published GPAT proteins of Arabidopsis and cacao (Theobroma cacao) (Table S1) were retrieved from The Arabidopsis Information Resource (TAIR release 10, http://www.arabidopsis.org) and The Cacao Genome Database (https://www.cacaogenomedb.org), respectively. Afterwards, BlastP and tBlastN programs (E-value = 0.00001) were performed to search for the candidate GPAT genes of the four Gossypium species using GPAT protein sequences from Arabidopsis and cacao as queries. Subsequently, the Pfam (http://pfam.sanger.ac.uk/) (Finn et al., 2014), Interproscan (http://www.ebi.ac.uk/Tools/pfa/iprscan/) (Quevillon et al., 2005) and SMART (http://smart.embl-heidelberg.de/) (Letunic et al., 2015) databases were applied to confirm each candidate member of the GPAT family with the PlsC acyltransferase domain of Pfam (PF01553). Furthermore, the theoretical molecular weight (MW) and isoelectric point (pI) of the GPAT proteins were predicted using the online ExPASy tool (http://web.expasy.org/) (Bjellqvist et al., 1994), and subcellular localization was predicted using the online CELLO v2.5 server (http://cello.life.nctu.edu.tw/; Yu et al., 2004).
Phylogenetic Construction
Clustal X v2.0 program (Larkin et al., 2007) was used to perform the multiple sequence alignment with default parameters, followed by manual comparisons and refinements. Subsequently, the Neighbor-Joining (NJ) method was used to construct different phylogenetic trees by MEGA v5.0 software (Tamura et al., 2011) with pairwise deletion option, poisson correction model and uniform rates. Bootstrap test were carried out with 1,000 replicates for evaluating the statistical reliability of phylogenetic tree. Furthermore, Maximum likelihood method was also applied in the tree construction to confirm the consistency with the NJ method.
Chromosomal Localization, Gene Duplication and Genomic Organizations Prediction
All GPAT genes of G. raimondii, G. arboreum, G. hirsutum, and G. barbadense were mapped on the corresponding chromosomes according to their positional information provided in the genome annotation document. The chromosome location images of cotton GPAT genes were portrayed by Mapchart v2.2 software (Voorrips, 2002) and Circos tool (Krzywinski et al., 2009). GPAT gene duplication events were defined according to the length of aligned sequence covered more than 80% of the longer gene, similarity of the aligned regions was bigger than 80%, and only one duplication event was counted for tightly linked genes (Maher et al., 2006; Dong et al., 2016; Cui et al., 2017). Referring to the chromosomal locations of GPAT genes, these GPAT genes could be designated as segmental duplications or tandem duplications.
The Gene Structure Display Server (GSDS) tool (Hu et al., 2015) was used to construct the gene structure of GPAT genes by comparing the predicted GPAT coding sequences with their corresponding genomic sequences.
Selective Pressure Analysis of Duplicated Gene Pairs
All the full-length gene sequence of the GPAT duplicated gene pairs of G. raimondii, G. arboreum, G. hirsutum, and G. barbadense were firstly aligned by Clustal X v2.0 program, and then the synonymous substitution (Ks) and non-synonymous substitution (Ka) were calculated using the DnaSP v5.0 software (Rozas et al., 2003). Finally, the Ka/Ks ratio was used to estimate the selection pressure for each gene pair.
RNA-Seq Data Analysis and Gene Expression Heatmap
The raw RNA-Seq data of G. hirsutum acc. TM-1 was downloaded from the NCBI under the accession number SRA: PRJNA248163 (Zhang T. et al., 2015). TopHat and cufflinks were used for mapping reads and analyzing gene expression levels, and fragments per kilobase million (FPKM) values were used to normalize gene expression levels (Trapnell et al., 2013). The expression level of GhGPAT family genes at different developmental stages were measured by extracting their respective data from the total expression matrix according to the identified GhGPAT ID. The expression levels of ten AtGPAT genes were extracted form publicly Arabidopsis microarray expression datasets by the BioArray Resource (BAR) Expression Profiler tool (http://bar.utoronto.ca/affydb/cgi-bin/affy_db_exprss_browser_in.cgi) (Toufighi et al., 2005). The heatmap for expression profiles were generated with MultiExperiment Viewer (MeV) software.
Cis-Acting Elements Searching in the Promoters of GhGPATs
To identify the cis-elements in the promoter sequences of the 28 GPAT family genes in G. hirsutum, the BLASTN program was applied for searching G. hirsutum genome using the GhGPAT genes as query sequences. A 2-kb of genomic sequences upstream of the start codon of each GhGPAT gene was chosen, and then each sequence was submitted to the PlantCARE database (Lescot et al., 2002) (http://bioinformatics.psb.ugent.be/webtools/plantcare/html/) to identify the cis-elements.
Plant Materials and Abiotic Stress Treatment
Cotton seedlings of G. hirsutum L. acc TM-1 were grown in a temperature-controlled chamber at 28 ± 2°C under 16 h light/ 8 h dark condition. Seedlings at the 3-true leaf stage were exposed to the following different treatments. For low temperature, seedlings were grown in a temperature-controlled chamber at 4°C for 0, 12, and 24 h. For salt treatment, the seedlings were grown in Hoagland nutrient solution with additional 0, 150, 200, and 300 mM NaCl for 24 h, which represented the control condition, slight stress, moderate stress, and severe stress, respectively. After different treatments, the roots, stems, cotyledons and leaves were harvested at each time point of each treatment. Three biological replicates were conducted for each time point. All collected samples were immediately frozen with liquid nitrogen and then stored at −80°C for RNA isolation.
Quantitative Reverse Transcriptase-Polymerase Chain Reaction (qRT-PCR) Analysis
Total RNA of all samples was extracted using an RNAprep Pure Plant kit (Tiangen, Beijing, China), and approximately 1 μg RNA was used for the synthesis of first-strand cDNAs with PrimerScript 1st Strand cDNA synthesis kit (TaKaRa, Dalian, China) according to the manufacturer protocol. The gene-specific primers were designed, according to the CDSs of cotton GPAT genes, using Primer v5.0 software. The specific primers used are listed in Table S2, and GhUBQ7 was used as an internal control to normalize all data. The qRT-PCR was strictly conducted with SYBR premix Ex Taq Kit (TakaRa) following the manufacturer's instruction using ABI 7500 real-time PCR System (Applied Biosystems, Foster City, CA, USA). Each sample was conducted with three biological replicates and three technical replicates. The relative expression levels of GhGPAT genes were calculated using the 2−ΔΔCt method (Livak and Schmittgen, 2001).
Identification of Single Nucleotide Polymorphisms (SNPs) for GPAT Genes and Statistical Analysis With Cottonseed Oil
Single-nucleotide polymorphism (SNPs) for GPAT genes were identified by the RNA-seq datasets of CRI 36 and Hai 7124, in which CRI 36 is a currently commercial cultivar of G. hirsutum and Hai 7124 is a non-commercial G. barbadence, and SOAPsnp software was used to scan SNPs based on the assembled contigs (Li et al., 2009). To validate SNP markers, genomic DNA was extracted from an interspecific backcross inbred line (BIL) population of 180 lines, as well as the two parents using a quick CTAB method (Zhang and Stewart, 2000). In this study, the BIL population was developed from a cross between Upland cotton CRI 36 and G. barbadense Hai 7124 through one generation of backcrossing using CRI 36 as the recurrent parent followed by seven generations of selfing. Putative SNPs were identified to design primers using Primer v5.0 software (Table S2) and analyzed their association with cottonseed oil content using high-resolution melting (HRM). The HRM reaction mixture and PCR followed the protocols (Ma et al., 2016). The SNP markers were coded as “1” for genotypes of CRI 36, “3” for genotypes of Hai 7124 and “2” for the heterozygotes, and used for a simple correlation analysis with the cottonseed oil content in the BIL population by SPPS software (IBM, New York, USA).
Results
Genome-Wide Identification of GPAT Genes in Four Cotton Species
To identify all the GPAT genes in cotton, we performed a BLASTP search against the diploid cotton (G. raimondii and G. arboreum) and tetraploid cotton (G. hirsutum and G. barbadense) protein databases using the GPAT sequences of Arabidopsis (10) and cacao (13) as queries (Table S1). All potential cotton proteins were then subjected to domain analysis using the Pfam, Interproscan and SMART databases to further confirm the presence of the GPAT protein domain (PF01553). Eventually, a total of 14, 16, 28, and 27 GPAT members were identified in G. raimondii, G. arboreum, G. hirsutum and G. barbadense, respectively. These GPAT genes were named consecutively from GrGPAT1-GrGPAT14, GaGPAT1-GaGPAT16, GhGPAT1-GaGPAT28, and GbGPAT1-GaGPAT27 in the four cotton species, respectively, according to the order of their chromosomal locations (Table 1). Eighty of the 85 identified GPAT genes encode proteins ranging between 377 and 543 amino acids (AAs), except for 5 genes with lengths of less than 377 AAs or more than 543 AAs (i.e., GrGPAT3 encodes a protein of 261 AAs, and GhGPAT20, GbGPAT2, GbGPAT16, and GbGPAT20 encode proteins of 258, 319, 740, and 298 AAs, respectively). The predicted Mw of the GPAT proteins in the four cotton species ranged from 28.78 to 83.20 kDa, and the theoretical pI varied between 5.49 and 9.63. The protein subcellular localization of GPAT in cotton showed that 68 of 85 GPAT proteins were predicted to be located in the plasma membrane, while the rest were predicted to be located in the chloroplast or cytoplasm. We further analyzed the orthologous and paralogous GPAT genes in the four cotton species (Table S3). We identified 18 orthologous gene pairs between G. hirsutum and G. barbadense. Compared with the G. raimondii, 13, 12, and 10 orthologous gene pairs were identified for G. arboreum, G. hirsutum, and G. barbadense, respectively. Compared with the G. arboreum, 10 and 9 orthologous gene pairs were identified for G. hirsutum and G. barbadense, respectively. In addition, 5, 6, 13 and 11 paralogous gene pairs were identified in G. raimondii, G. arboreum, G. hirsutum, and G. barbadense, respectively.
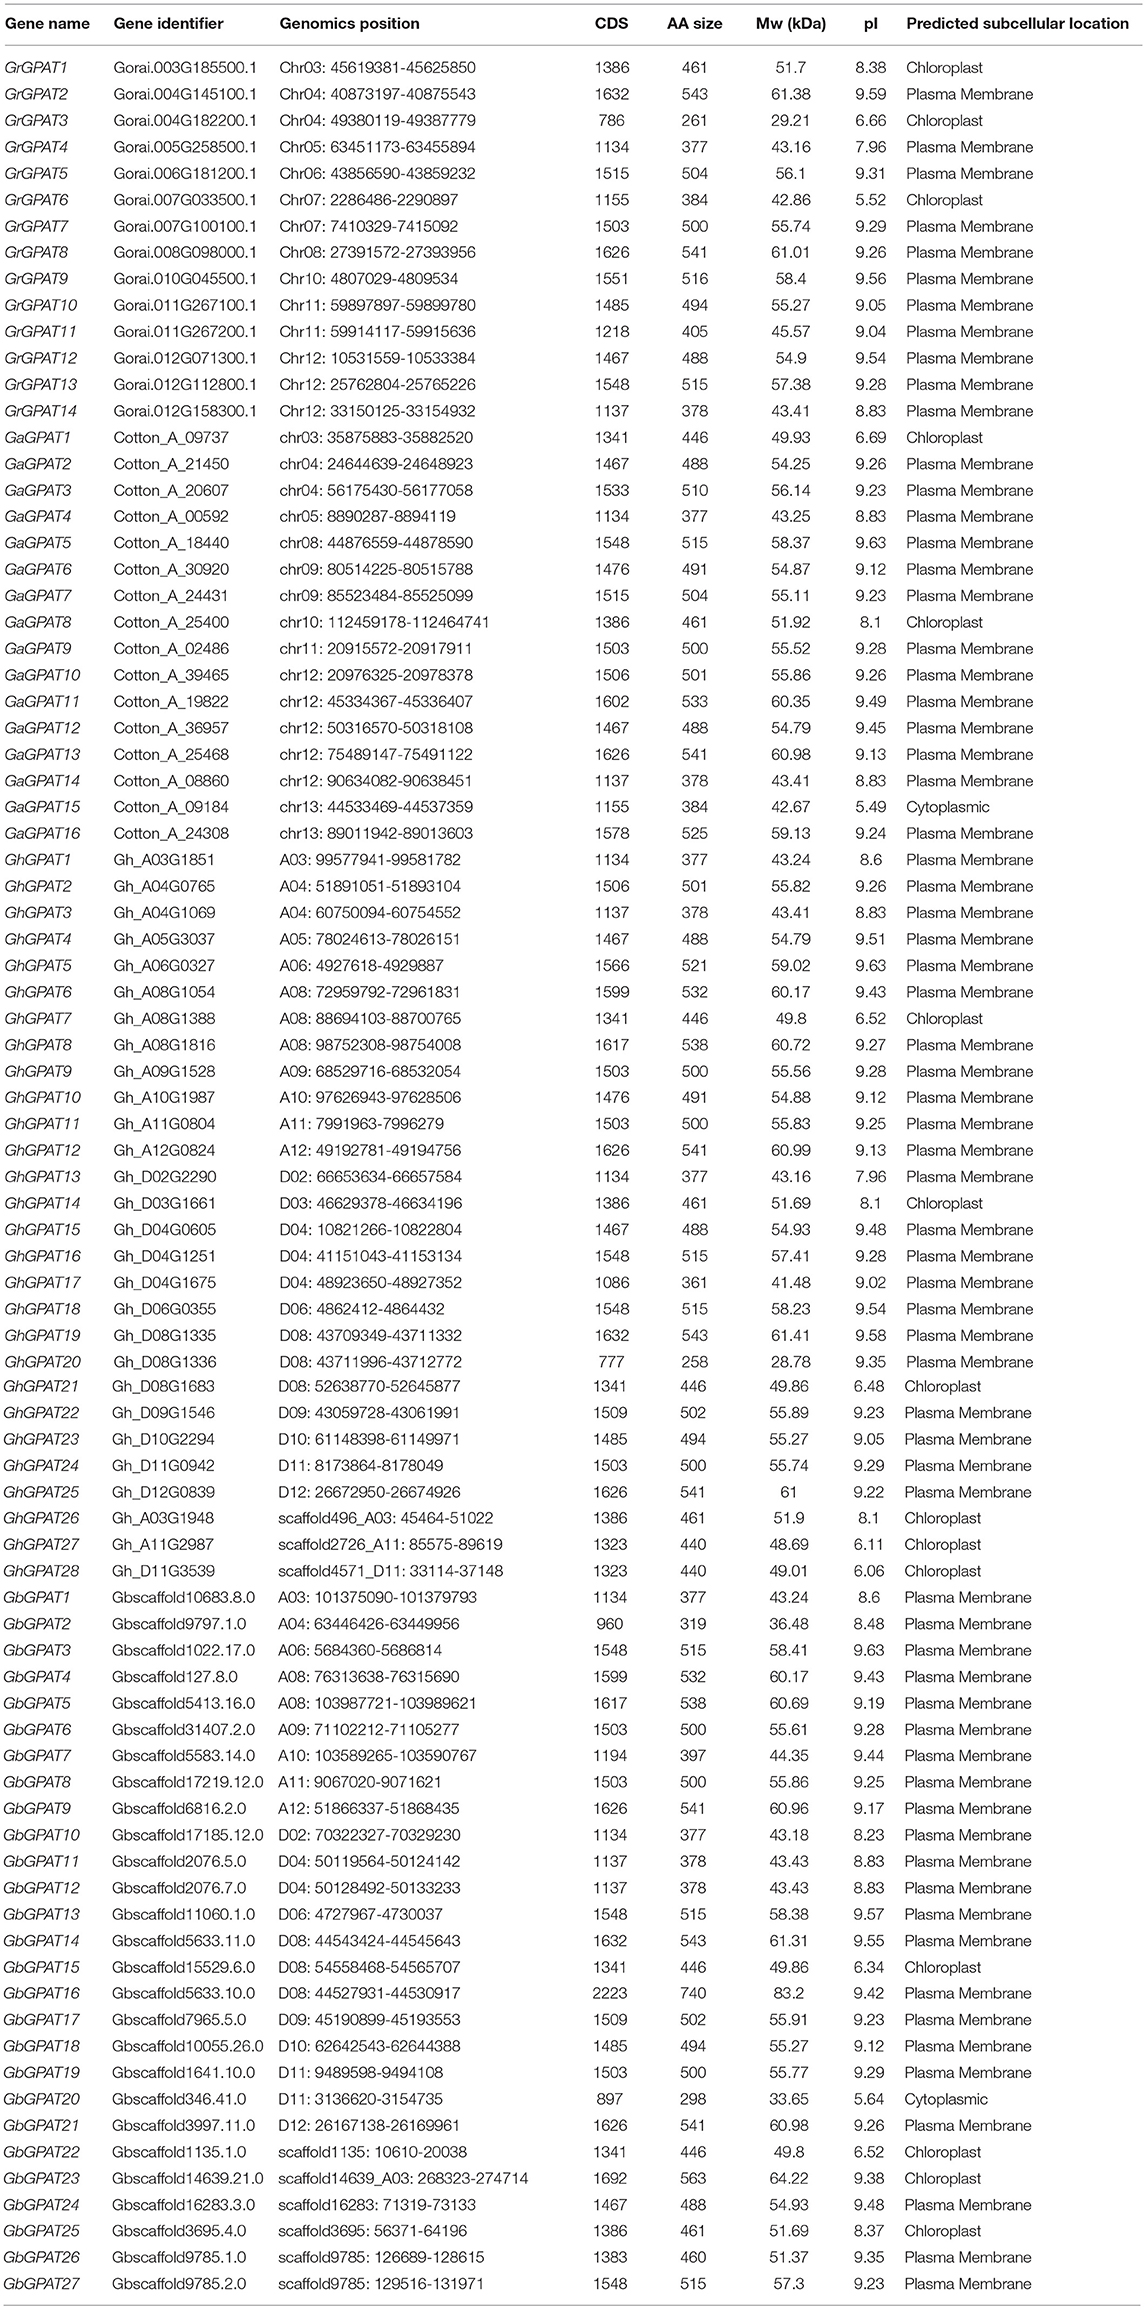
Table 1. The information of GPAT gene family in four Gossypium species.
Phylogenetic Analysis of the GPAT Gene Family
To assess the phylogenetic relationships of GPAT genes among the four cotton species (G. raimondii, G. arboreum, G. hirsutum, and G. barbadense) and other species, a comprehensive phylogenetic tree was constructed using a NJ method (Figure 1). Meanwhile, the phylogenetic tree was reconstructed with Maximum likelihood (ML) method, which was almost identical with only minor difference at some branches (Figure S1), suggesting that the two methods were largely consistent with each other. As shown in Figure 1, GPAT genes could be divided into three groups, named the Group I, Group II, and Group III. Group III has the most members (74), followed by Group I (19), and Group II (15). Compared to Arabidopsis, GPAT genes in the four cotton species showed a closer relationship with those from cacao, since they were clustered closely to each other in the phylogenetic tree. However, the number of GPAT genes in cotton and cacao were not similar within the groups, and one cacao gene corresponding to one to three homologous genes of G. raimondii and G. arboreum. For example, in Group I, TcGPAT12 had three orthlogous in G. raimondii and G. arboreum each, whereas in Group II, TcGPAT2 had two orthologous genes in both G. raimondii and G. arboreum. Furthermore, in Group III, TcGPAT4 had only one orthologous gene in G. raimondii and G. arboreum, respectively. In addition, the GPAT genes from the four cotton species showed a closer relationship than that from Arabidopsis and cacao (Figure 1). From the perspective of evolution, each GPAT gene in G. raimondii corresponds to one orthologous gene in G. arboreum and to two orthologous genes in tetraploid G. hirsutum and G. barbadense, since the diploid genomes of G. raimondii and G. arboreum are the progenitors for tetraploid G. hirsutum and G. barbadense (Paterson et al., 2012). In this study, most GPAT genes from G. hirsutum and from G. barbadense showed a one-to-one correspondence with those from the diploid progenitors (G. raimondii and G. arboreum). The inconsistencies were that the GrGPAT2 gene was duplicated in G. arboreum, G. hirsutum, and G. barbadense, implying that this gene underwent an independent duplication event in G. arboreum after its divergence from G. raimondii, even this duplication also existed after the formation of tetraploid cotton. In addition, GPAT genes from A subgenome and D subgenome of G. hirsutum showed a bias to those from G. arboreum and G. raimondii.
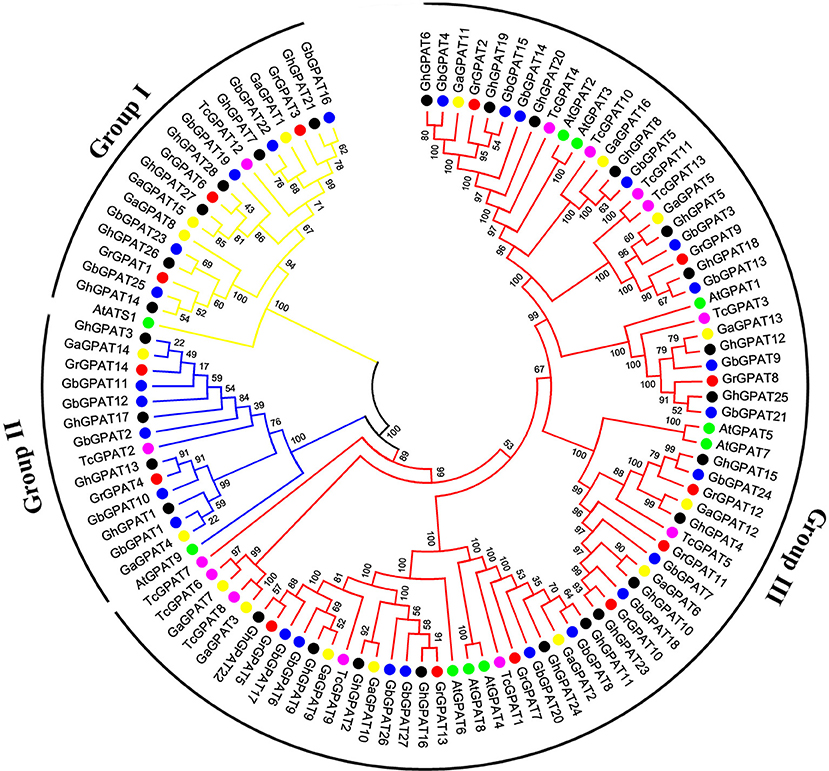
Figure 1. Phylogenetic relationships of GPAT genes from Gossypium, Arabidopsis, and cacao. Phylogenetic analysis was performed using the neighbor-joining method with 1,000 replicates. The GPAT genes from G. raimondii, G. arboreum, G. hirsutum, G. barbadense, Arabidopsis, and cacao were marked with the red, yellow, black, blue, green, and magenta dots, respectively. The branches of each group were indicated in a specific color.
Genomic Structure of GPAT Genes
Gene structure of GPAT genes is closely related to its function, and could reflect the phylogenetic relation among the GPAT genes, together with their phylogenetic analysis. To obtain further insight into the evolutionary relationships among GPAT genes from the four cotton species and Arabidopsis, we compared their gene structures. As shown in Figure 2A, the GPAT genes were divided into three groups as described in Figure 1. The GPAT gene members within groups were mostly the same, although the topologies of the two phylogenetic trees were different. Analysis of Arabidopsis and cotton GPAT gene structure for exon/intron organizations revealed that the number of exons per gene varied from 1 to 12 (Figure 2B), and the genes close to each other in the phylogenetic tree showed highly similar exon numbers. In general, the GPAT genes in the same group had similar exons than other groups. For example, all the members in Group I contained 12 exons except GbGPAT19 that had 11 exons. A host of GPAT genes in Group II possessed 12 exons, except for GhGPAT17 and GbGPAT2, which had 11 and 10 exons, respectively. Most members of Group III had two exons, except for GhGPAT20 that had only one exon, eight genes (GaGPAT2, GrGPAT7, GhGPAT5, GhGPAT11, GhGPAT24, GbGPAT8, GbGPAT14, and GbGPAT20) that had three exons, and three enes (AtGPAT4, AtGPAT8, and GrGPAT11) that had four exons. As excepted, the gene structures of orthologous gene pairs of cotton GPATs were almost identical with minor differences with the exception of GrGPAT6/GbGPAT19, GaGPAT14/GbGPAT2, GaGPAT15/GbGPAT19, GaGPAT5/GhGPAT5, and GhGPAT5/GbGPAT3 (Table S3).
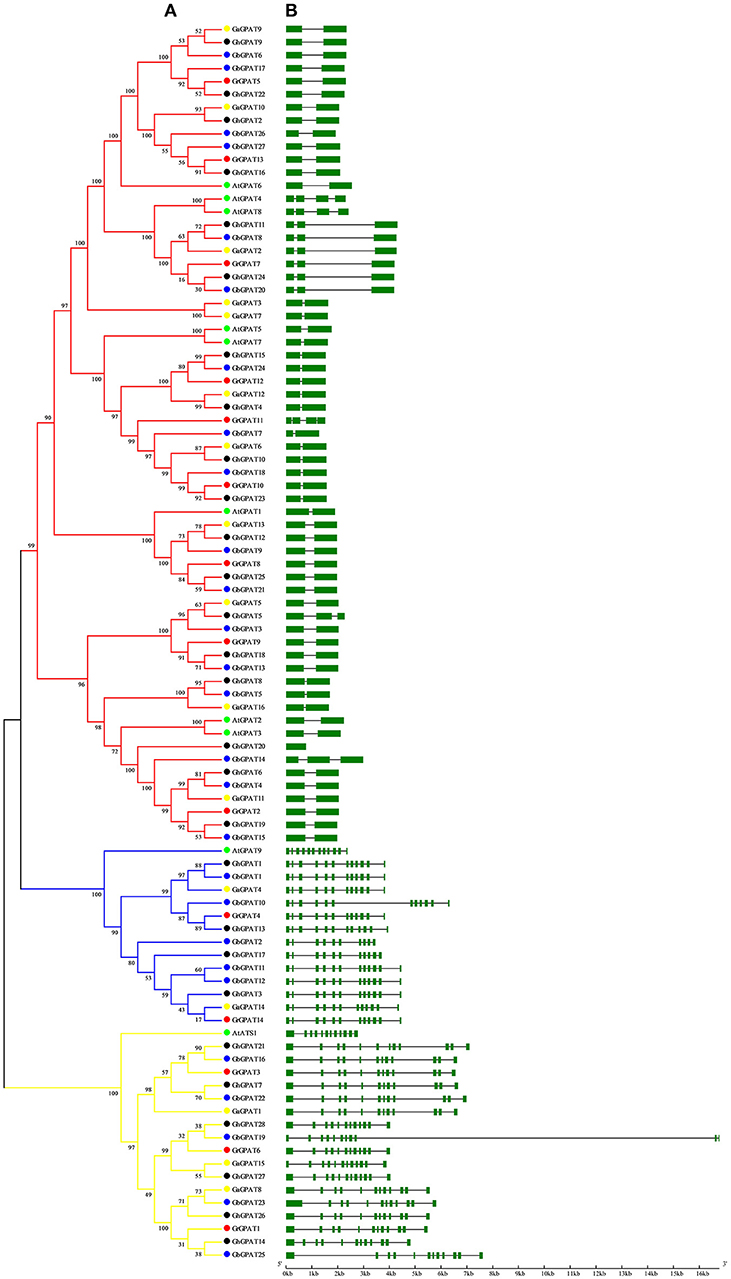
Figure 2. Phylogenetic relationships and gene structure of the GPAT gene family in Gossypium and Arabidopsis. (A) The phylogenetic tree of all GPAT proteins in G. raimondii, G. arboreum, G. hirsutum, G. barbadense, and Arabidopsis was constructed by the neighbor-joining method with 1,000 replicates, (B) The exon-intron structure of GPAT genes in G. raimondii, G. arboreum, G. hirsutum, G. barbadense, and Arabidopsis. Exons are represented by green boxes and introns by black lines.
Genomic Localization and Duplication of GPAT Genes
GPAT genes were mapped onto chromosomes in G. arboreum, G. raimondii, G. hirsutum, and G. barbadense based on the available genomic information on the four cotton species. Seventy-six of 85 GPATs were assigned to chromosomes (Figure 3), while the remaining 9 GPATs were anchored on unmapped scaffolds. A total of 14 GrGPAT genes were mapped to 9 chromosomes of G. raimondii: chromosome D12 contained three GPAT genes, chromosomes D04, D07, and D11 contained two GPAT genes each, and chromosomes D03, D05, D06, D08, and D10 each contained only one GPAT gene. The 16 GaGPAT genes were distributed on nine chromosomes in G. arboreum: 5 GPAT genes were on chromosome A12 and 2 genes on each of chromosomes A04, A09, and A13, while each of chromosomes A03, A05, A08, A10, and A11 contained only one GPAT gene. A total of 25 GhGPAT genes were mapped to 18 chromosomes of the G. hirsutum genome, not including chromosomes A01, A02, A07, A13, D01, D05, D07, and D13. The remaining three genes, GhGPAT26, GhGPAT27, and GhGPAT28, were positioned on unmapped scaffolds. As illustrated in Figure 3, chromosomes A08, D04, and D08 contained three GPAT genes each, and two GPAT genes were present on chromosome A04, while only one GPAT gene appeared on each of chromosomes A03, A05, A06, A09, A10, A11, A12, D02, D03, D06, D09, D10, D11, and D12. A total of 21 GbGPAT genes were distributed unevenly on 16 of 26 G. barbadense chromosomes, and the number of GPAT genes on each of the 16 chromosomes ranged from 1 to 3.
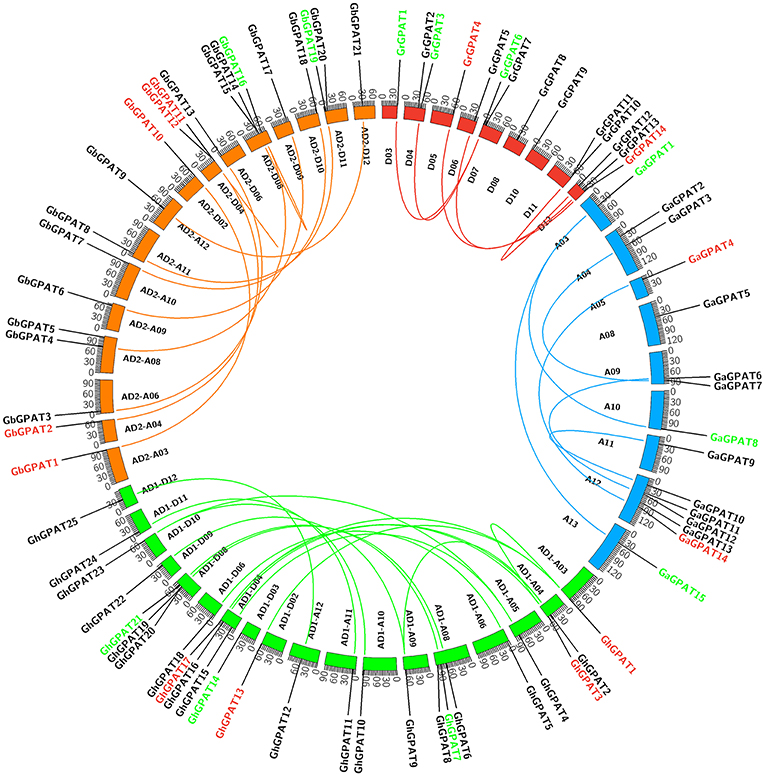
Figure 3. Genomic localization and gene duplication of GPAT genes in the four cotton species. The chromosomes of G. raimondii, G. arboreum, G. hirsutum, and G. barbadense were filled with red, blue, green, and orange, respectively. The duplicated gene pairs were connected with different color lines. Green, red, and black GPAT genes belonged to Group I, Group II, and Group III, respectively.
Gene duplication events were considered to play an important role in the amplification of gene families. It is reported that the genomes of G. raimondii and G. arboreum have undergone at least two rounds of genome-wide duplication (Paterson et al., 2012; Wang et al., 2012). And all tetraploid cotton species are derived from G. raimondii and G. arboreum (Wendel et al., 2009). Therefore, evolutionary relationships among the four cotton species are close. To elucidate the expanded mechanism of the GPAT gene family, gene duplication event analysis in the four cotton species was performed, and the details of the duplicated gene pairs were listed in Table 2. A total of 5, 6, and 19 duplication events were detected in G. raimondii, G. arboreum, and G. hirsutum, respectively. They were located on individual chromosomes and were mainly attributed to segmental duplication events in the three cotton species (Figure 3). In G. barbadense, 1 pair of tandem duplications and 13 pairs of segmental duplication events were detected (Figure 3, Table 2), but we also concluded that the expansion of the GbGPAT gene family occurred mainly by segmental duplication events rather than tandem events.
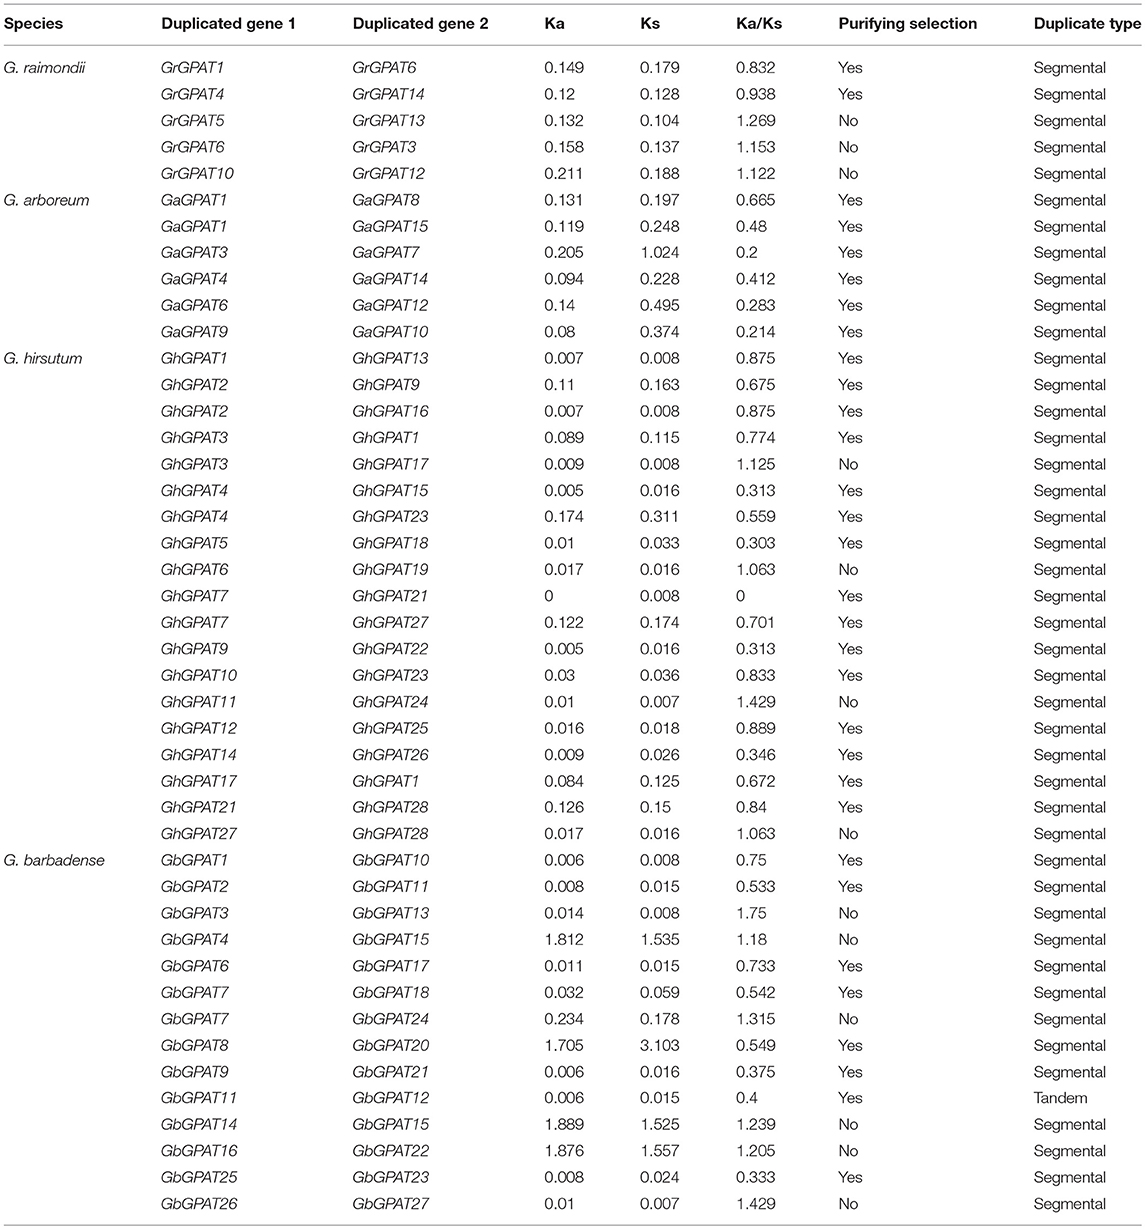
Table 2. Ka/Ks analysis for the duplicated GPAT gene pairs from G. raimondii, G. arboreum, G. hirsutum, and G. barbadense.
The duplicated gene pairs might have undergone three alternative fates during their evolution, i.e., nonfunctionalization, neofunctionalization and subfunctionalization (Lynch and Conery, 2000). To examine the selective constrains on duplicated GPAT gene pairs in the four cotton species, the Ka/Ks ratio for each pair of duplicated GPAT genes was calculated using the full-length sequences. Generally, Ka/Ks > 1 indicates accelerated evolution with positive selection, Ka/Ks = 1 indicates neuteal selection, while Ka/Ks < 1 indicates the functional constraint with purifying selection. In this study, there are 2, 6, 15, and 8 pairs of duplicated GPATs with a Ka/Ks ratio < 1 in G. raimondii, G. arboreum, G. hirsutum, and G. barbadense, respectively, which suggested that they had experienced purifying selection pressure with limited functional divergence after cotton GPAT genes duplications (Table 2). However, 3, 4, and 6 pairs of duplicated GPATs with a Ka/Ks ratio > 1 were found in G. raimondii, G. hirsutum, and G. barbadense, respectively, suggesting that these cotton GPAT genes had experienced positive selection (Table 2). These observations reflected that the functions of the duplicated GPAT genes in the four cotton species had not diverged much during subsequent evolution, and purifying selection might contribute greatly to the maintenance of function in the GPAT family genes in the four cotton species.
Expression Profiling of GPAT Genes in Upland Cotton and Arabidopsis
Gene expression is the major step toward a gene realizing its biological function. To understand the temporal and spatial expression patterns of upland cotton and Arabidopsis GPAT genes, their expression profiles in different tissues were analyzed using the public expression data.
The RNA-seq data of GhGPAT genes from different tissues and developmental stages of G. hirsutum acc. TM-1 (Zhang T. et al., 2015) were analyzed (Figure 4). As shown in Figure 4, GhGPAT genes exhibited different expression patterns in different tissues of TM-1, indicating that GhGPAT genes had multiple biological functions during cotton growth and development. Eleven GhGPAT genes (GhGPAT3, GhGPAT7, GhGPAT11, GhGPAT14, GhGPAT17, GhGPAT21, GhGPAT22, GhGPAT24, GhGPAT26, GhGPAT27, and GhGPAT28) could be detected in all the tested tissues, indicating that these GhGPAT genes were involved in multiple processes during the development of cotton. With the exception of GhGPAT5, GhGPAT6, GhGPAT8, and GhGPAT18, the expression of other genes could be detected in the stems. GhGPAT5 and GhGPAT18 were specifically expressed in 10 DPA fibers, and GhGPAT4, GhGPAT10, GhGPAT15, and GhGPAT23 were expressed in 20 DPA fibers, suggesting that these genes might play important roles in the rapid elongation period and secondary wall development. GhGPAT13 exhibited a high level of accumulation during ovule development (−3 to 35 DPA) and fiber development (5, 10, and 25 DPA), indicating that GhGPAT13 might play important roles in ovule development and fiber development. GhGPA4, GhGPAT5, GhGPAT15, GhGPAT18, GhGPAT19 and GhGPAT20 were not detectable at the different stages of cotyledons, suggesting that those six genes might not be associated with seed germination. There were 13 pairs of paralogous genes among these GhGPAT genes, and 11 pairs clustered together, which suggested that the expression of the paralogous GhGPAT genes might be conserved. In addition, the expression patterns of duplicated gene pairs in G. hirsutum were also investigated in Figure 4. Most duplicated gene pairs such as GhGPAT2/GhGPAT16 and GhGPAT5/GhGPAT18 were similar. However, the expression of GhGPAT1 and GhGPAT13 were strongly divergent, which might be caused by the significant variation in gene regulations after the duplication events.
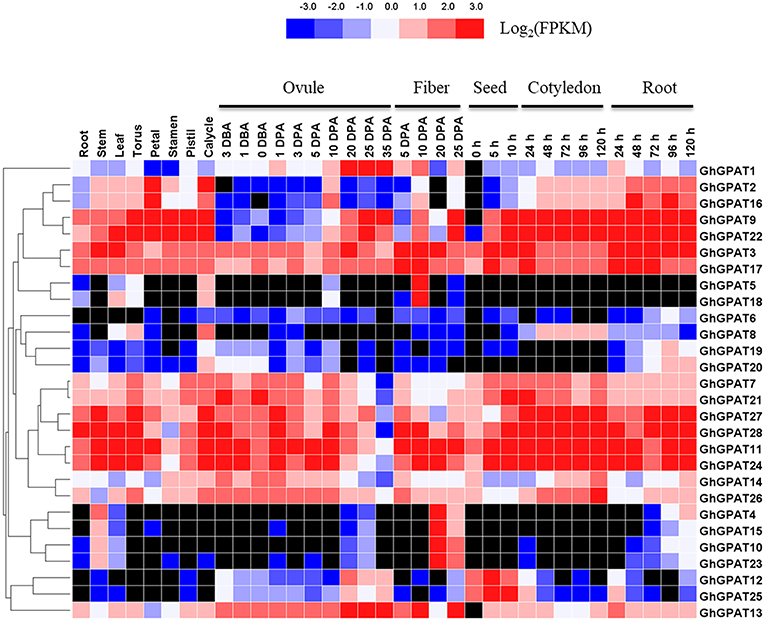
Figure 4. Expression profiles of GhGPAT genes in different tissues of G. hirsutum acc. TM-1. The RNA-Seq expression profiles of G. hirsutum acc. TM-1 (Zhang T. et al., 2015) were used to identify the expression levels of GhGPAT genes. The color bar represents the expression values in FPKM, and the black color represents there is not expression.
The expression profiles of Arabidopsis GPAT genes were also analyzed unsing the public microarray data (Toufighi et al., 2005). Similar to GhGPAT genes, the AtGPAT genes also showed different expression patterns in different tissues (Figure S2). The expression of AtGPAT5 showed a relatively high level in the siliques at 6–10 DAF (day after flowering), but lower expression in early developmental stages of silique (4–5 DFA), which suggested that it might contribute to the accumulation of glycerolipid in Arabidopsis siliques. The AtGPAT6 had high exprsssion in sepals, petals and stamens than in other tissues, which indicated that it may play important rols in the Arabidopsis flower development. Additionally, the paralogous gene pairs of Arabidopsis GPAT genes were also investigated, it was showed that AtGPAT4/AtGPAT8 had the simiar expression patterns. However, it was not the case for AtGPAT2/AtGPAT3.
Gene Expression Patterns Under Salt and Cold Stresses
Salt and cold stresses are the two of the main abiotic stresses that limit the productivity and geographical distribution of various crops all over the world. Previous study reported that plant GPAT genes are well known to be involved in responses to salt (Sun et al., 2010; Sui et al., 2017) and cold stresses (Murata and Tasaka, 1992; Ariizumi et al., 2002; Sui et al., 2007b), but the function of GhGPAT genes in cotton response to salt or cold stress remains unknown. The cis-elements could provide critical evidence and understanding about the functions of GPAT genes in cotton. Therefore, the promoter regions up to 2 kb upstream of all 28 GhGPAT genes were used to find their putative cis-elements (Table S4), and eight putative environmental stimulus-responsive cis-elements were identified in GhGPAT genes (Table S5). Although there were no cis-elements responding to salt stress and only one cis-element responding to low temperature in the PLACE database, some cis-elements might respond to multiple environmental stimuli (Higo et al., 1999). The results showed that almost all GhGPAT promoters contained more than three environmental stimulus-responsive cis-elements except for GhGPAT13 (Table S5), indicating that GhGPAT genes may be involved in the response to salt and cold stresses.To validate the participation of GPAT genes in salt or cold stress, gene expression of all GhGPAT genes were conducted in different tissues under salt or cold stress (Figure 5). For the salt stress, the relative expression levels of GhGPAT genes were altered either induction or suppression under different salt treatments (Figure 5A). In the roots, nearly all GhGPAT genes were upregulated under slight salt stress except for GhGPAT17 and GhGPAT21. Most GhGPAT genes were suppressed under severe stress except for GhGPAT8, GhGPAT9, GhGPAT11, GhGPAT18, and GhGPAT22. In the stems, most GhGPAT genes displayed downregulation under different levels of salt stress, while five GhGPAT genes (GhGPAT5, GhGPAT7, GhGPAT8, GhGPAT11, GhGPAT13, and GhGPAT18) showed upregulation under at least one salt treatment. In the leaves, GhGPAT5 and GhGPAT18 were upregulated under different levels of salt stress. Several GhGPAT genes showed downregulation. In the cotyledons, only GhGPAT18 was upregulation under different levels of salt stress, while nearly all GhGPAT genes were downregulation. Furthermore, two duplicated gene pairs, GhGPAT2/GhGPAT16 and GhGPAT27/GhGPAT28, showed similar expression patterns. For the cold stress (Figure 5B), only a few GhGPAT genes were induction, while others was suppression under cold stress. In the roots, five GhGPAT genes (GhGPAT2, GhGPAT6, GhGPAT10, GhGPAT20, and GhGPAT22) displayed upregulated expression under cold stress, while others were suppressed by cold stress. In the stems, GhGPAT18 and GhGPAT24 were initially increased at 12 h of cold stress and then decreased at 24 h of cold stress. In the leaves, the expression of GhGPAT20 showed upregulation under cold stress as compared with other GhGPAT genes. In the cotyledons, most of the GhGPAT genes were suppressed under cold stress except for GhGPAT8, GhGPAT9, and GhGPAT24. GhGPAT8 and GhGPAT9 were upregulated after 12 h of cold treatment, while GhGPAT24 was upregulated at 24 h. In addition, three duplicated gene pairs, GhGPAT5/GhGPAT18, GhGPAT12/GhGPAT25, and GhGPAT27/GhGPAT28 were clustered together with similar expression patterns.
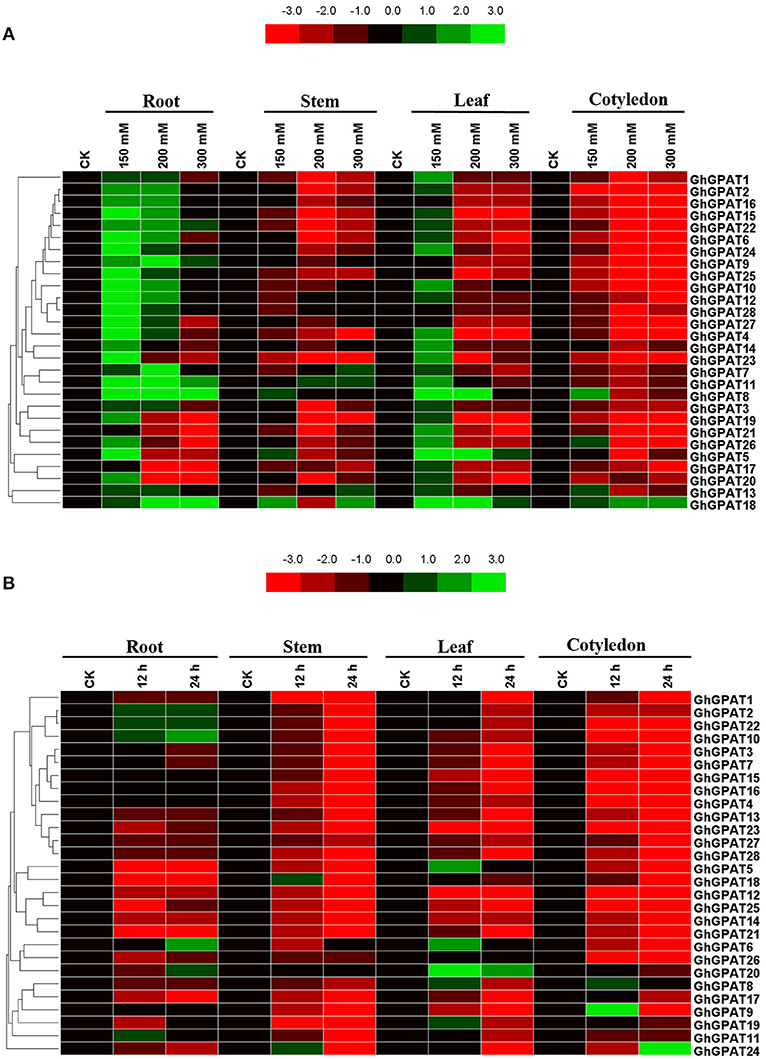
Figure 5. Expression patterns of 28 GhGPAT genes in four representative tissues of G. hirsutum in response to salt stress and cold stress. (A) Expression patterns of 28 GhGPAT genes under salt stress. (B) Expression patterns of 28 GhGPAT genes under cold stress. Slight stress, moderate stress, and severe stress in G. hirsutum were represented by 150, 200, and 300 mM NaCl, respectively. The color bar represents the relative signal intensity values.
Co-localization and Sequence Variation of GhGPAT Genes With Quantitative Trait Loci for Seed Oil and Protein Contents
To analyze the relationships of GhGPAT genes with cottonseed oil and protein contents, a co-localization analysis of GhGPAT genes with oil- and protein-related QTLs was conducted (Figure 6). QTLs for oil and protein traits were downloaded from intraspecific G. hirsutum and interspecific G. hirsutum × G. barbadense populations (Said et al., 2015a). The results showed that 5 GhGPAT genes on five chromosomes were co-localized within a 21.7 cM region of cottonseed oil- and protein-related QTLs, including GhGPAT3 on chromosome A04/c4, GhGPAT4 on chromosome A05/c5, GhGPAT7 on chromosome A08/c8, GhGPAT9 on chromosome A09/c9, and GhGPAT15 on chromosome D04/c22. Three GhGPAT genes on one chromosome (GhGPAT19, GhGPAT20, and GhGPAT21 on chromosome D08/c24) were localized within a 35 cM region (Figure 6). The co-localized QTLs include six QTLs (on chromosomes A04, A08, A09 and D04) from intraspecific G. hirsutum population and three QTLs (on chromosomes A05 and D08) from interspecific G. hirsutum × G. barbadense population (Table S6). In intraspecific G. hirsutum population, 4 and 2 QTLs associated with GhGPAT genes were identified for cotton oil and protein, respectively. GhGPAT3 and GhGPAT7 each co-localized with one oil-related QTL, while GhGPAT9 and GhGPAT15 each co-localized with one oil-related QTL and one protein-related QTL. In addition, one oil-related QTL and two protein-related QTLs associated with GhGPAT genes were identified from interspecific G. hirsutum × G. barbadense population. GhGPAT4 only co-localized only with one oil-related QTL on chromosome A05, whereas GhGPAT19, GhGPAT20, and GhGPAT21 co-localized with one oil-related QTL and one protein-related QTL on chromosome D08. However, the causative relationship between the natural variation in GhGPAT genes and oil content may not be obtained from the co-localization of a cottonseed oil-related QTL or a protein-related QTL with GhGPAT genes, since hundreds of genes could be identified from a 20 cM region (Said et al., 2015b), even 35 cM region.
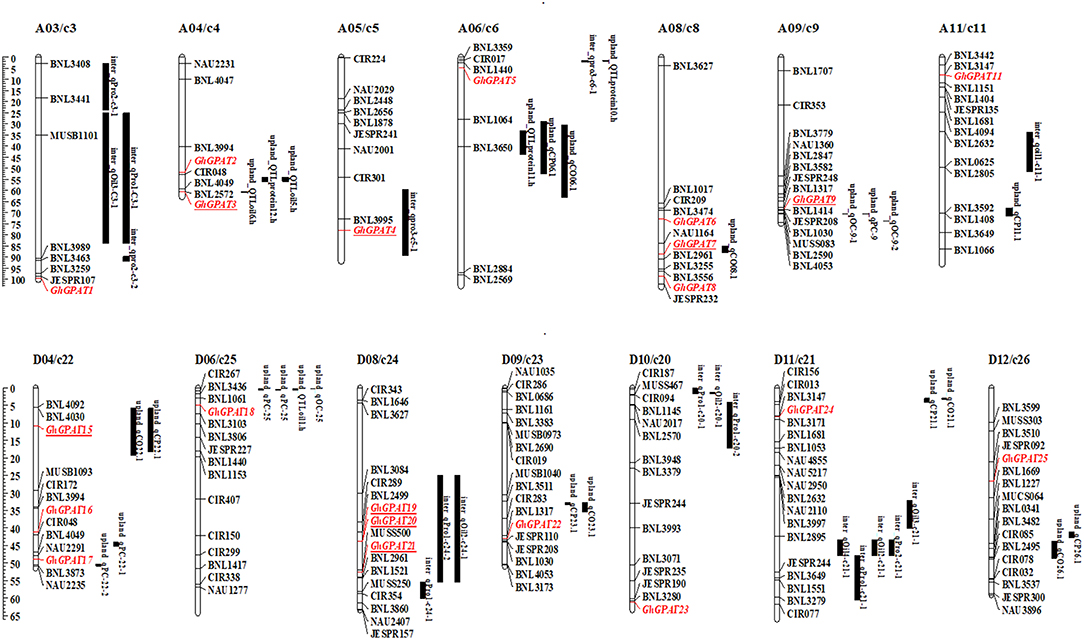
Figure 6. A co-localization analysis of GhGPAT genes with cotton oil and protein quantitative trait loci (QTLs). GhGPAT genes are shown in red, and underlining indicates the GhGPAT genes colocalized with oil or protein content QTLs.
To analyze the relationship between the sequence variation in GPAT genes and oil content, the SNPs of GPAT genes were identified from RNA-seq data on CRI 36 and Hai 7124. As shown in Table S7, 32 SNPs in the cDNA sequences of 12 GPAT genes were identified from the CRI 36 and Hai 7124 data compared with the TM-1 genome. Among them, 16 SNPs in 9 GPAT genes were classified as synonymous, and 16 SNPs in 10 GPAT genes were non-synonymous. To detect the association analysis between SNPs (non-synonynous) from GPAT genes and oil content, primers were designed to amplify fragments containing SNPs (Table S2) and analyzed using high-resolution melting (HRM). The 16 SNPs classified as non-synonymous were screened in a BIL population of 180 lines derived from a backcross between CRI 36 and Hai 7124, and correlation analysis was conducted in the BIL population of 180 lines in 2015 AY, 2016AY, and 2016XJ. An SNP of GhGPAT16, named GhGPAT16-1624 (T/C), which changes amino acid 542 from phenylalanine to leucine, was found to be significantly associated with oil content in the BIL population in 2015AY, and an SNP of GhGPAT26, named GhGPAT26-172 (T/C), which changes amino acid 58 from serine to proline, was found to be associated with oil content in 2016AY (Table S8). In the BIL population, the correlation of GhGPAT16-1624 and oil content in 2015AY was significantly negative (−0.262, P < 0.01), and the correlation of GhGPAT26-172 with oil content in 2016AY was significantly positive (0.183, P < 0.05). However, GhGPAT16-1624 and GhGPAT26-172 did not exhibit any association with oil content from the same BIL population in 2016AY, 2016XJ and 2015AY, 2016XJ, respectively. Therefore, the association between the SNP markers of GhGPAT16 and GhGPAT26 genes and oil content remains to be elucidated. These results suggest that the sequence variations in most GhGPAT genes are not associated with natural variations in cotton oil content.
Discussion
Identification, Phylogenetic Analysis and Evolution of GPAT Genes in Cotton
In this study, a total of 14, 16, 28, and 27 GPAT genes were identified from G. raimondii, G. arboreum, G. hirsutum, and G. barbadense, respectively (Table 1). The allotetraploid cotton species originated from an interspecific hybridization event between the progenitors G. raimondii (D5) and G. arboreum (A2) (Cronn et al., 1999; Wendel et al., 2009). Each of the GPAT genes in the diploid cotton species corresponds to two orthologous genes in their allotetraploid derivatives based on the theory of evolution. However, the numbers of GPAT genes in each of G. hirsutum and G. barbadense were slightly less than the sum of those from G. raimondii and G. arboreum, suggesting that whole-genome duplication was the major impetus and was followed by different degrees of gene loss during the evolution of allotetraploid cottons, and this was consistent with previous reported that gene loss was accompanied by the rapid arrangement of genomic sequences after hybridization and chromosome doubling during polyploidization (Paterson et al., 2004). This inconsistency has also been detected in a certain genus among different cotton species (Dong et al., 2017; Li et al., 2017; Pant et al., 2018). The number of GPAT genes in G. arboreum is slightly greater than that in G. raimondii, although the genome of G arboreum was approximately twice larger than that of G. raimondii, and the long terminal repeat (LTR) retrotransposon insertion in G. arboreum may explain the phenomenon (Paterson et al., 2012; Li et al., 2014). The GPAT family genes from the subgenomes of G. hirsutum or G. barbadense were more closely phylogenetically related to those from G. raimondii and G. arboreum, reflecting that the GPAT gene family evolved before the formation of allotetraploid cotton species.
Phylogenetic analysis revealed that GhGPAT genes were more closely related to TcGPATs than to AtGPATs (Figure 1), this result was consistent with the evolutionary relationships among the four cotton species, cacao and Arabidopsis. The GPAT genes from cotton, Arabidopsis and cacao were distinctly classified into three groups: Group I, Group II, and Group III (Figure 1), and no additional groups were identified in the tree, which was similar to those in Arabidopsis (Nishida et al., 1993; Gidda et al., 2009) and other plants (Waschburger et al., 2018). The gene structure analysis of Arabidopsis and cotton GPAT genes also supported this classification (Figure 2B). GPAT genes within the same groups showed similar exon numbers, indicating that genes within the same group diverged from a common ancestor. In addition, previous study reported that at least one rice GPAT gene was clusted with Arabidopsis GPAT gene from a phylogenetic tree constructed with 8 Arabidopsis and 16 rice GPAT genes (Horan et al., 2005). Take those results together, it suggested that the functional differences of various GPAT groups from Arabidopsis, rice and cotton have been conserved over 100 million years (Mya).
Duplication of GPAT Genes in Cotton
Previous studies reported that gene duplication was the major reason for amplification of the gene family, including tandem duplication, segmental duplication, transposition events and whole-genome duplication (Blanc and Wolfe, 2004; Flagel and Wendel, 2009). Segmental duplication and translocation have enabled plants to rapidly adapt to new environments (Fraser et al., 2005). In this study, we analyzed gene duplication events to further understand the expansion mechanism of GPAT genes in cotton. Forty-four duplicated gene pairs were identified in the four cotton species, including 5, 6, and 19 segmental duplicated pairs detected in G. raimondii, G. arboreum, and G. hirsutum, respectively, and 1 and 13 pairs of tandem and segmental duplication detected in G. barbadense (Figure 3, Table 2). The results suggested that the expansion of cotton GPAT genes was mainly due to segmental duplication events. The results from Table 2 showed that purifying selection predominated across the duplicated gene pairs in cotton. Purifying selection could eliminate deleterious loss-of-function mutations, enhance fixation and preserve the function of a new duplicated gene at both duplicated loci (Tanaka et al., 2009). After duplication, the coding regions can obtain new regulatory context by insertion or deletion of tissue-specific enhancers or repressors, causing spatial and temporal variations in expression patterns of duplicated genes (Yang et al., 2017). The expression patterns of GhGPAT genes in different tissues of TM-1, showed that most of GhGPAT duplicated gene pairs displayed similar expression patterns, indicating that their biological functions might not be diverged during cotton development and growth, but determining whether these genes had similar functions in different tested tissues would require further studies. However, some GhGPAT duplicated gene pairs also displayed differential expression patterns, and this case also presented in the expression pattern of Arabidopsis GPAT genes (Figure S2), indicating that the biological functions of the duplicated genes might have experienced divergence during the development and growth of cotton and Arabidopsis, which might enable these two plants to rapidly adapt to new environments. Previous studies also reported that some duplicated gene pairs in other gene families, such as the WOX and YABBY gene families, displayed different expression patterns (Yang et al., 2017, 2018). These results indicated that divergence of duplicated gene pairs is a pervasive evolutionary process after duplication.
Functional Divergence of Cotton GPAT Genes Under Salt Stress and Cold Stress
Salt and cold stresses are the serious environmental stresses that limit the productivity and geographical distribution of various crops worldwide. Previous studies revealed that the overexpression of GPAT genes in plants could enhance their salt or cold tolerance (Murata and Tasaka, 1992; Sui et al., 2007a, 2017; Sun et al., 2010). Gene expression patterns can provide useful clues for understanding gene function (Cui et al., 2017). Figure 5A showed that a majority of GhGPAT genes were upregulated in roots under moderate salt stress. In contrast, only a few upregulated GPAT genes were found in leaves compared with roots. This result was consistent with the fact that roots were the first tissues directly responding to salt stress (Guo et al., 2001), and root and leaf tissues were distinctly different in structure and function (Campo et al., 2014). Some GhGPAT genes showed similar expression patterns in the same tissue under salt or cold stress, being either induced or suppressed (Figure 5). For example, GhGPAT8 and GhGPAT11 were induced in roots by salt stress, and GhGPAT2 and GhGPAT22 were also upregulated before 24 h under cold stress. These results indicated that those genes were co-expressed under salt or cold stress. However, some GhGPAT genes in the same tissue also presented different expression patterns under salt stress and under cold stress. For instance, GhGPAT18 was induced in roots under different salt stress conditions, while it was suppressed before 24 h under cold stress. This difference indicated that these genes may perform diverse functions under salt or cold stress. Together, these results implied that the signaling network responding to abiotic stress in plants was complicated (Zhang L. et al., 2015). In addition, some GhGPAT gene pairs presented a high degree of functional divergence under salt. GhGPAT5 was downregulated in roots after severe salt stress, while its duplicated gene, GhGPAT18, was upregulated. This evidence supported the assertion that the expression divergence between duplicated gene pairs was the first step in functional divergence, which could increase the likelihood of their retention in the genome (Zhang, 2003).
Conclusions
In this study, a total of 85 GPAT genes based on the genome information of G. raimondii, G. arboreum, G. hirsutum, and G. barbadense were identified. The family could be divided into three groups based on the phylogenetic tree and gene structures. Segmental duplication events were the main contributors to GPAT gene family expansion in G. raimondii, G. arboreum, G. hirsutum, and G. barbadense. Moreover, duplicated gene pairs of GhGPATs in upland cotton might be experienced functional divergence, since their expression patterns were different in different tissues. some GhGPAT genes are likely to be involved in salt or cold response. Eight GhGPAT genes were co-localized with oil and protein content QTLs, and two SNP markers were genetically associated with cottonseed oil content in one interspecific BIL population (in one of three field tests). Our results provide a solid foundation for further understanding about involvement of cotton GPAT genes in the natural variation of cottonseed oil content, and also could provide the candidate genes for function studies.
Author Contributions
JZ and JY conceived and designed the study. YC and JM performed the experiments and analyzed the data. NW and GL prepared the figures. WP, MW, and XL analyzed and interpreted the data. YC, JZ, and JY prepared the manuscript. JZ participated in the design of the experiments, wrote part of the manuscript, and performed a critical review for intellectual content. All authors have read, edited, and approved the current version of the manuscript.
Funding
This research was funded by grants from the National Key Research and Development Program of China (grant No. 2016YFD0101400), the National Natural Science Foundation of China (grant No. 31621005) and the National Research and Development Project of Transgenic Crops of China (grant No. 2016ZX08005005).
Conflict of Interest Statement
The authors declare that the research was conducted in the absence of any commercial or financial relationships that could be construed as a potential conflict of interest.
Supplementary Material
The Supplementary Material for this article can be found online at: https://www.frontiersin.org/articles/10.3389/fgene.2019.00116/full#supplementary-material
Figure S1. Phylogenetic relationships of GPAT genes from Gossypium, Arabidopsis, and cacao. The phylogenetic analysis was performed by Minimum likelihood method with 1,000 replicates. The GPAT genes from G. raimondii, G. arboreum, G. hirsutum, G. barbadense, Arabidopsis, and cacao were marked with the red, yellow, black, blue, green, and magenta dots, respectively. And the branches of each group were indicated in a specific color.
Figure S2. Expression profiles of Arabidopsis GPAT genes in different tissues. The Arabidopsis transcriptome of GPAT genes were conducted using the BioArray Resource (BAR) Expression Browser (Toufighi et al., 2005). The color bar represents the relative signal intensity values.
Table S1. GPAT genes of Arabidopsis, and cacao used to construct phylogenetic trees in this study.
Table S2. Primers for qRT-PCR and single nucleotide polymorphisms in this study.
Table S3. Orthologous and paralogous GPAT genes in and between the four cotton species.
Table S4. The cis-elements in the promoter regions of GhGPATs.
Table S5. The cis-elements involved in salt and cold stresses response in the promoter regions of GhGPATs. _indicated no corresponding cis-element.
Table S6. Oil and protein QTLs.
Table S7. Identification of putative sequence variation (SNPs) by SOAPsnp in CRI 36 vs. Hai 7124 database.
Table S8. Association analysis between the markers (GhGPAT16-1624 and GhGPAT26-172 from GhGPAT16 and GhGPAT26 genes) and cottonseed oil content in a BIL population.
References
Ariizumi, T., Kishitani, S., Inatsugi, R., Nishida, I., Murata, N., and Toriyama, K. (2002). An increase in unsaturation of fatty acids in phosphatidylglycerol from leaves improves the rates of photosynthesis and growth at low temperatures in transgenic rice seedlings. Plant Cell Physiol. 43, 751–758. doi: 10.1093/pcp/pcf087
Beisson, F., Li, Y., Bonaventure, G., Pollard, M., and Ohlrogge, J. B. (2007). The acyltransferase GPAT5 is required for the synthesis of suberin in seed coat and root of Arabidopsis. Plant Cell 19, 351–368. doi: 10.1105/tpc.106.048033
Bertolesi, G. E., Iannattone, S., Johnston, J., Zaremberg, V., and Mcfarlane, S. (2012). Identification and expression analysis of GPAT family genes during early development of Xenopus laevis. Gene Expr. Patterns 12, 219–227. doi: 10.1016/j.gep.2012.04.002
Bjellqvist, B., Basse, B., Olsen, E., and Celis, J. E. (1994). Reference points for comparisons of two-dimensional maps of proteins from different human cell types defined in a pH scale where isoelectric points correlate with polypeptide compositions. Electrophoresis 15, 529–539. doi: 10.1002/elps.1150150171
Blanc, G., and Wolfe, K. H. (2004). Widespread paleopolyploidy in model plant species inferred from age distributions of duplicate genes. Plant Cell 16, 1667–1678. doi: 10.1105/tpc.021345
Campo, S., Baldrich, P., Messeguer, J., Lalanne, E., Coca, M., and Segundo, B. S. (2014). Overexpression of a calcium-dependent protein kinase confers salt and drought tolerance in rice by preventing membrane lipid peroxidation. Plant Physiol. 165, 688–704. doi: 10.1104/pp.113.230268
Chen, X., Snyder, C. L., Truksa, M., Shah, S., and Weselake, R. J. (2011). sn-Glycerol-3-phosphate acyltransferases in plants. Plant Signal. Behav. 6, 1695–1699. doi: 10.4161/psb.6.11.17777
Cronn, R. C., Small, R. L., and Wendel, J. F. (1999). Duplicated genes evolve independently after polyploid formation in cotton. Proc. Natl. Acad. Sci. U.S.A. 96, 14406–14411. doi: 10.1073/pnas.96.25.14406
Cui, Y., Zhao, Y., Wang, Y., Liu, Z., Ijaz, B., Huang, Y., et al. (2017). Genome-wide identification and expression analysis of the biotin carboxyl carrier subunits of heteromeric acetyl-CoA carboxylase in Gossypium. Front. Plant Sci. 8:624. doi: 10.3389/fpls.2017.00624
Dong, Y., Li, C., Zhang, Y., He, Q., Daud, M. K., Chen, J., et al. (2016). Glutathione s-transferase gene family in Gossypium raimondii and G. arboreum: comparative genomic study and their expression under salt stress. Front. Plant Sci. 7:139. doi: 10.3389/fpls.2016.00139
Dong, Y., Liu, H., Zhang, Y., Hu, J., Feng, J., Li, C., et al. (2017). Comparative genomic study of ALDH gene superfamily in Gossypium: a focus on Gossypium hirsutum under salt stress. PLoS ONE 12:e0176733. doi: 10.1371/journal.pone.0176733
Finn, R. D., Bateman, A., Clements, J., Coggill, P., Eberhardt, R. Y., Eddy, S. R., et al. (2014). Pfam: the protein families database. Nucleic Acids Res. 42, D222–D230. doi: 10.1093/nar/gkt1223
Flagel, L. E., and Wendel, J. F. (2009). Gene duplication and evolutionary novelty in plants. N. Phytol. 183, 557–564. doi: 10.1111/j.1469-8137.2009.02923.x
Fraser, J. A., Huang, J. C., Pukkila-Worley, R., Alspaugh, J. A., Mitchell, T. G., and Heitman, J. (2005). Chromosomal translocation and segmental duplication in cryptococcus neoformans. Eukaryotic Cell 4, 401–406. doi: 10.1128/EC.4.2.401-406.2005
Gidda, S. K., Shockey, J. M., Rothstein, S. J., Dyer, J. M., and Mullen, R. T. (2009). Arabidopsis thaliana GPAT8 and GPAT9 are localized to the ER and possess distinct ER retrieval signals: functional divergence of the dilysine ER retrieval motif in plant cells. Plant Physiol. Biochem. 47, 867–879. doi: 10.1016/j.plaphy.2009.05.008
Guo, Y., Halfter, U., Ishitani, M., and Zhu, J. K. (2001). Molecular characterization of functional domains in the protein kinase SOS2 that is required for plant salt tolerance. Plant Cell 13, 1383–1400. doi: 10.1105/tpc.13.6.1383
Higo, K., Ugawa, Y., Iwamoto, M., and Korenaga, T. (1999). Plant cis-acting regulatory DNA elements (PLACE) database: 1999. Nucleic Acids Res. 27, 297–300. doi: 10.1093/nar/27.1.297
Horan, K., Lauricha, J., Bailey-Serres, J., Raikhel, N., and Girke, T. (2005). Genome cluster database. A sequence family analysis platform for Arabidopsis and rice. Plant Physiol. 138, 47–54. doi: 10.1104/pp.104.059048
Hu, B., Jin, J., Guo, A. Y., Zhang, H., Luo, J., and Gao, G. (2015). GSDS 2.0: an upgraded gene feature visualization server. Bioinformatics 31, 1296–1297. doi: 10.1093/bioinformatics/btu817
Krzywinski, M., Schein, J., Birol, I., Connors, J., Gascoyne, R., Horsman, D., et al. (2009). Circos: an information aesthetic for comparative genomics. Genome Res. 19, 1639–1645. doi: 10.1101/gr.092759.109
Larkin, M. A., Blackshields, G., Brown, N. P., Chenna, R., Mcgettigan, P. A., Mcwilliam, H., et al. (2007). Clustal W and Clustal X version 2.0. Bioinformatics 23, 2947–2948. doi: 10.1093/bioinformatics/btm404
Lescot, M., Déhais, P., Thijs, G., Marchal, K., Moreau, Y., Van, Y. D. P., et al. (2002). PlantCARE, a database of plant cis-acting regulatory elements and a portal to tools for in silico analysis of promoter sequences. Nucleic Acids Res. 30, 325–327. doi: 10.1093/nar/30.1.325
Letunic, I., Doerks, T., and Bork, P. (2015). SMART: recent updates, new developments and status in 2015. Nucleic Acids Res. 43, D257–260. doi: 10.1093/nar/gku949
Lewin, T. M., Wang, P., and Coleman, R. A. (1999). Analysis of amino acid motifs diagnostic for the sn-glycerol-3-phosphate acyltransferase reaction. Biochemistry 38, 5764–5771. doi: 10.1021/bi982805d
Li, F., Fan, G., Lu, C., Xiao, G., Zou, C., Kohel, R. J., et al. (2015). Genome sequence of cultivated Upland cotton (Gossypium hirsutum TM-1) provides insights into genome evolution. Nat. Biotechnol. 33, 524–530. doi: 10.1038/nbt.3208
Li, F., Fan, G., Wang, K., Sun, F., Yuan, Y., Song, G., et al. (2014). Genome sequence of the cultivated cotton Gossypium arboreum. Nat. Genet. 46, 567–572. doi: 10.1038/ng.2987
Li, R., Li, Y., Fang, X., Yang, H., Wang, J., Kristiansen, K., et al. (2009). SNP detection for massively parallel whole-genome resequencing. Genome Res. 19, 1124–1132. doi: 10.1101/gr.088013.108
Li, X., Liu, G., Geng, Y., Wu, M., Pei, W., Zhai, H., et al. (2017). A genome-wide analysis of the small auxin-up rna (SAUR), gene family in cotton. BMC Genomics 18:815. doi: 10.1186/s12864-017-4224-2
Li, Y., Beisson, F., Koo, A. J. K., Molina, I., Pollard, M., and Ohlrogge, J. (2007). Identification of acyltransferases required for cutin biosynthesis and production of cutin with suberin-like monomers. Proc. Natl. Acad. Sci. U.S.A. 104, 18339–18344. doi: 10.1073/pnas.0706984104
Liu, M. Z., Michael, B. J., and Henry, J. S. (2013). Efficient planar heterojunction perovskite solar cells by vapour deposition. Nature 501, 395–398. doi: 10.1038/nature12509
Liu, X., Zhao, B., Zheng, H. J., Hu, Y., Lu, G., Yang, C. Q., et al. (2015). Gossypium barbadense genome sequence provides insight into the evolution of extra-long staple fiber and specialized metabolites. Sci. Rep. 5:14139. doi: 10.1038/srep14139
Livak, K. J., and Schmittgen, T. D. (2001). Analysis of relative gene expression data using real-time quantitative PCR and the 2(-Delta Delta C(T)) Method. Methods 25, 402–408. doi: 10.1006/meth.2001.1262
Lynch, M., and Conery, J. S. (2000). The evolutionary fate and consequences of duplicate genes. Science 290, 1151–1155. doi: 10.1126/science.290.5494.1151
Ma, Q., Wu, M., Pei, W., Wang, X., Zhai, H., and Wang, W. (2016) RNA-Seq-mediated transcriptome analysis of a fiberless mutant cotton its possible origin based on SNP markers. PLoS ONE 11:e0151994. doi: 10.1371/journal.pone.0151994
Maher, C., Stein, L., and Ware, D. (2006). Evolution of Arabidopsis microRNA families through duplication events. Genome Res. 16, 510–519. doi: 10.1101/gr.4680506
Misra, A., Khan, K., Niranjan, A., Kumar, V., and Sane, V. A. (2017). Heterologous expression of two GPATs from Jatropha curcas alters seed oil levels in transgenic Arabidopsis thaliana. Plant Sci. 263, 79–88. doi: 10.1016/j.plantsci.2017.07.003
Murata, N., and Tasaka, Y. (1992). Glycerol-3-phosphate acyltransferase in plants. Biochim. Biophys. Acta 1348, 10–16. doi: 10.1016/S0005-2760(97)00115-X
Nishida, I., Tasaka, Y., Shiraishi, H., and Murata, N. (1993). The gene and the RNA for the precursor to the plastid-located glycerol-3-phosphate acyltransferase of Arabidopsis thaliana. Plant Mol. Biol. 21, 267–277. doi: 10.1007/BF00019943
Ohlrogge, J., and Browse, J. (1995). Lipid biosynthesis. Plant Cell 7, 957–970. doi: 10.1105/tpc.7.7.957
Pant, P., Iqbal, Z., Pandey, B. K., and Sawant, S. V. (2018). Genome-wide comparative and evolutionary analysis of calmodulin-binding transcription activator (CAMTA) family in Gossypium species. Sci. Rep. 8:5573. doi: 10.1038/s41598-018-23846-w
Paterson, A. H., Bowers, J. E., and Chapman, B. A. (2004). Ancient polyploidization predating divergence of the cereals, and its consequences for comparative genomics. Proc. Natl. Acad. Sci. U.S.A. 101, 9903–9908. doi: 10.1073/pnas.0307901101
Paterson, A. H., Wendel, J. F., Gundlach, H., Guo, H., Jenkins, J., Jin, D., et al. (2012). Repeated polyploidization of Gossypium genomes and the evolution of spinnable cotton fibres. Nature 492, 423–427. doi: 10.1038/nature11798
Payá-Milans, M., Aznar-Moreno, J. A., Balbuena, T. S., Haslam, R. P., Gidda, S. K., Pérez-Hormaeche, J., et al. (2016). Sunflower HaGPAT9-1 is the predominant GPAT during seed development. Plant Sci. 252, 42–52. doi: 10.1016/j.plantsci.2016.07.002
Quevillon, E., Silventoinen, V., Pillai, S., Harte, N., Mulder, N., Apweiler, R., et al. (2005). InterProScan: protein domains identifier. Nucleic Acids Res. 33, W116–W120. doi: 10.1093/nar/gki442
Rozas, J., Sánchezdelbarrio, J. C., Messeguer, X., and Rozas, R. (2003). DnaSP, DNA polymorphism analyses by the coalescent and other methods. Bioinformatics 19, 2496–2497. doi: 10.1093/bioinformatics/btg359
Said, J. I., Knapka, J. A., Song, M., and Zhang, J. (2015a). Cotton QTLdb: a cotton QTL database for QTL analysis, visualization, and comparison between Gossypium hirsutum and G. hirsutum × G. barbadense populations. Mol. Genet. Genomics 290, 1615–1625. doi: 10.1007/s00438-015-1021-y
Said, J. I., Song, M., Wang, H., Lin, Z., Zhang, X., Fang, D. D., et al. (2015b). A comparative meta-analysis of QTL between intraspecifc Gossypium hirsutum and interspecifc G. hirsutum × G. barbadense populations. Mol. Genet. Genomics 290, 1003–1025. doi: 10.1007/s00438-014-0963-9
Shockey, J., Regmi, A., Cotton, K., Adhikari, N., Browse, J., and Bates, P. D. (2016). Identifcation of Arabidopsis GPAT9 (At5g60620) as an essential gene involved in triacylglycerol biosynthesis. Plant Physiol. 170, 163–179. doi: 10.1104/pp.15.01563
Singer, S. D., Chen, G., Mietkiewska, E., Tomasi, P., Jayawardhane, K., Dyer, J. M., et al. (2016). Arabidopsis GPAT9 contributes to synthesis of intracellular glycerolipids but not surface lipids. J Exp. Bot. 67, 4627–4638. doi: 10.1093/jxb/erw242
Sui, N., Li, M., Liu, X. Y., Wang, N., Fang, W., and Meng, Q. W. (2007a). Response of xanthophyll cycle and chloroplastic antioxidant enzymes to chilling stress in tomato over-expressing glycerol-3-phosphate acyltransferase gene. Photosynthetica 45, 447–454. doi: 10.1007/s11099-007-0074-5
Sui, N., Li, M., Shu, D. S., and Meng, Q. (2010). Antisense-mediated depletion of tomato chloroplast glycerol-3-phosphate acyltransferase affects male fertility and increases thermal tolerance. Physiol. Plantarum 130, 301–314. doi: 10.1111/j.1399-3054.2007.00907.x
Sui, N., Li, M., Zhao, S. J., Li, F., Liang, H., and Meng, Q. W. (2007b). Overexpression of glycerol-3-phosphate acyltransferase gene improves chilling tolerance in tomato. Planta 226, 1097–1108. doi: 10.1007/s00425-007-0554-7
Sui, N., Tian, S., Wang, W., Wang, M., and Fan, H. (2017). Overexpression of glycerol-3-phosphate acyltransferase from suaeda salsa improves salt tolerance in Arabidopsis. Front. Plant Sci. 8:1337. doi: 10.3389/fpls.2017.01337
Sun, Y. L., Li, F., Sui, N., Sun, X. L., Zhao, S. J., and Meng, Q. W. (2010). The increase in unsaturation of fatty acids of phosphatidylglycerol in thylakoid membrane enhanced salt tolerance in tomato. Photosynthetica 48, 400–408. doi: 10.1007/s11099-010-0052-1
Tamura, K., Peterson, D., Peterson, N., Stecher, G., Nei, M., and Kumar, S. (2011). MEGA5: molecular evolutionary genetics analysis using maximum likelihood, evolutionary distance, and maximum parsimony methods. Mol. Biol. Evol. 28, 2731–2739. doi: 10.1093/molbev/msr121
Tanaka, K. M., Takahasi, K. R., and Takano-Shimizu, T. (2009). Enhanced fixation and preservation of a newly arisen duplicate gene by masking deleterious loss-of-function mutations. Genetical Res. 91, 267–280. doi: 10.1017/S0016672309000196
Toufighi, K., Brady, S. M., Austin, R., Ly, E., and Provart, N. J. (2005). The Botany Array Resource: e-Northerns, expression angling, and promoter analyses. Plant J. 43, 153–163. doi: 10.1111/j.1365-313X.2005.02437.x
Trapnell, C., Roberts, A., Goff1, O., Pertea, G., Kim, D., Kelley, D. R., et al. (2013). Differential gene and transcript expression analysis of RNAseq experiments with TopHat and Cufflinks. Nat. Protoc. 7, 562–578. doi: 10.1038/nprot.2012.016
Voorrips, R. E. (2002). MapChart: software for the graphical presentation of linkage maps and QTLs. J. Hered. 93, 77–78. doi: 10.1093/jhered/93.1.77
Wang, K., Wang, Z., Li, F., Ye, W., Wang, J., Song, G., et al. (2012). The draft genome of a diploid cotton Gossypium raimondii. Nat. Genet. 44, 1098–1103. doi: 10.1038/ng.2371
Waschburger, E., Kulcheski, F. R., and Veto, N. M. (2018). Genome-wide analysis of the glycerol-3-phosphate acyltransferase (GPAT) gene family reveals the evolution and diversification of plant gpats. Genet. Mol. Biol. 41, 355–370. doi: 10.1590/1678-4685-gmb-2017-0076
Wendel, J. F., Brubaker, C., Alvarez, I., Cronn, R., Stewart, J. M., and Paterson, A. H. (2009). Evolution and natural history of the cotton genus. Genet. Genomics Cotton 3, 3–22. doi: 10.1007/978-0-387-70810-2_1
Xie, K., Wu, S., Li, Z., Zhou, Y., Zhang, D., Dong, Z., et al. (2018). Map-based cloning and characterization of Zea mays male sterility33 (ZmMs33) gene, encoding a glycerol-3-phosphate acyltransferase. Theor. Appl. Genet. 131, 1363–1378. doi: 10.1007/s00122-018-3083-9
Yang, W., Simpson, J. P., Li-Beisson, Y., Beisson, F., Pollard, M., and Ohlrogge, J. B. (2012). A land-plant-specific glycerol-3-phosphate acyltransferase family in Arabidopsis: substrate specificity, sn-2 preference, and evolution. Plant Physiol. 160, 638–652. doi: 10.1104/pp.112.201996
Yang, Z., Gong, Q., Qin, W., Cheng, Y., Lu, L., Ge, X., et al. (2017). Genome-wide analysis of WOX genes in upland cotton and their expression pattern under different stresses. BMC Plant Biol. 17:113. doi: 10.1186/s12870-017-1065-8
Yang, Z., Gong, Q., Wang, L., Jin, Y., Xi, J., Li, Z., et al. (2018). Genome-wide study of YABBY genes in upland cotton and their expression patterns under different stresses. Front. Genet. 9:33. doi: 10.3389/fgene.2018.00033
Yokoi, S., Higashi, S. I., Kishitani, S., Murata, N., and Toriyama, K. (1998). Introduction of the cDNA for shape Arabidopsis glycerol-3-phosphate acyltransferase (GPAT) confers unsaturation of fatty acids and chilling tolerance of photosynthesis on rice. Mol. Breeding 4, 269–275. doi: 10.1023/A:1009671231614
Yu, C. S., Lin, C. J., and Hwang, J. K. (2004). Predicting subcellular localization of proteins for Gram-negative bacteria by support vector machines based on n-peptide compositions. Protein Sci. 13, 1402–1406. doi: 10.1110/ps.03479604
Yu, J., Jung, S., Cheng, C. H., Ficklin, S. P., Lee, T., Zheng, P., et al. (2014). CottonGen: a genomics, genetics and breeding database for cotton research. Nucleic Acids Res. 42, D1229–D1236. doi: 10.1093/nar/gkt1064
Yuan, D., Tang, Z., Wang, M., Gao, W., Tu, L., Xin, J., et al. (2015). The genome sequence of Sea-Island cotton (Gossypium barbadense) provides insights into the allopolyploidization and development of superior spinnable fibres. Sci. Rep. 5, 469–472. doi: 10.1038/srep17662
Zhang, J. (2003). Evolution by gene duplication: an update. Trends Ecol. Evol. 18, 292–298. doi: 10.1016/S0169-5347(03)00033-8
Zhang, J., and Stewart, J. M. (2000). Economical and rapid method for extracting cotton genomic DNA. J. Cotton Sci. 4, 193-201.
Zhang, L., Zhao, H. K., Dong, Q. L., Zhang, Y. Y., Wang, Y. M., Li, H. Y., et al. (2015). Genome-wide analysis and expression profiling under heat and drought treatments of HSP70 gene family in soybean (Glycine max L.). Front. Plant Sci. 6:773. doi: 10.3389/fpls.2015.00773
Zhang, T., Hu, Y., Jiang, W., Fang, L., Guan, X., Chen, J., et al. (2015). Sequencing of allotetraploid cotton (Gossypium hirsutum acc. TM-1) provides a resource for fiber improvement. Nat. Biotech. 33, 531–537. doi: 10.1038/nbt.3207
Keywords: Gossypium spp., glycerol-3-phosphate acyltransferase (GPAT), gene expression patterns, abiotic stress, oil content
Citation: Cui Y, Ma J, Liu G, Wang N, Pei W, Wu M, Li X, Zhang J and Yu J (2019) Genome-Wide Identification, Sequence Variation, and Expression of the Glycerol-3-Phosphate Acyltransferase (GPAT) Gene Family in Gossypium. Front. Genet. 10:116. doi: 10.3389/fgene.2019.00116
Received: 14 September 2018; Accepted: 01 February 2019;
Published: 20 February 2019.
Edited by:
Rogerio Margis, Universidade Federal do Rio Grande do Sul (UFRGS), BrazilReviewed by:
Shiri Freilich, Agricultural Research Organization (ARO), IsraelKatia Scortecci, Federal University of Rio Grande do Norte, Brazil
Copyright © 2019 Cui, Ma, Liu, Wang, Pei, Wu, Li, Zhang and Yu. This is an open-access article distributed under the terms of the Creative Commons Attribution License (CC BY). The use, distribution or reproduction in other forums is permitted, provided the original author(s) and the copyright owner(s) are credited and that the original publication in this journal is cited, in accordance with accepted academic practice. No use, distribution or reproduction is permitted which does not comply with these terms.
*Correspondence: Jinfa Zhang, amluemhhbmdAbm1zdS5lZHU=
Jiwen Yu, eXVqdzY2NkBob3RtYWlsLmNvbQ==