 Jiajie She
 Hengyu Yan
 Jiaotong Yang
 Wenying Xu*
 Zhen Su
- State Key Laboratory of Plant Physiology and Biochemistry, College of Biological Sciences, China Agricultural University, Beijing, China
Catharanthus roseus is a medicinal plant, which can produce monoterpene indole alkaloid (MIA) metabolites with biological activity and is rich in vinblastine and vincristine. With release of the scaffolded genome sequence of C. roseus, it is necessary to annotate gene functions on the whole-genome level. Recently, 53 RNA-seq datasets are available in public with different tissues (flower, root, leaf, seedling, and shoot) and different treatments (MeJA, PnWB infection and yeast elicitor). We used in-house data process pipeline with the combination of PCC and MR algorithms to construct a co-expression network exploring multi-dimensional gene expression (global, tissue preferential, and treat response) through multi-layered approaches. In the meanwhile, we added miRNA-target pairs, predicted PPI pairs into the network and provided several tools such as gene set enrichment analysis, functional module enrichment analysis, and motif analysis for functional prediction of the co-expression genes. Finally, we have constructed an online croFGD database (http://bioinformatics.cau.edu.cn/croFGD/). We hope croFGD can help the communities to study the C. roseus functional genomics and make novel discoveries about key genes involved in some important biological processes.
Introduction
Catharanthus roseus, a model plant of the Apocynaceae family, is best known for production of the bis-indole monoterpene indole alkaloids (MIAs). There are four important MIAs, vinblastine and vincristine used in the clinic as anti-cancer agents (Aslam et al., 2010), catharanthine which can reduce blood sugar content (Pan et al., 2012), and vindoline. MIAs belong to a class of terpenoid indole alkaloids (TIAs). Some TIAs exhibit strong pharmacological activities, whose production has beneficial effects on human health (Almagro et al., 2015). The biosynthesis of TIAs is regulated by several key transcription factors (TFs), such as ORCA3, ORCA2, WRKY, MYC, ZCT1, and BIS, which can enhance alkaloid production (Van Der Fits and Memelink, 2000; Suttipanta et al., 2011; Zhang et al., 2011; Li et al., 2013; Van Moerkercke et al., 2015; Rizvi et al., 2016). In addition to these key TFs, some hormones and transporters are essential for the regulation of TIA biosynthesis in C. roseus (Liu et al., 2017). Some external signals such as elicitor and jasmonate (JA) can regulate the activities of several TFs involved in TIA biosynthesis (Memelink and Gantet, 2007). Although much progress has been made in the field of TIAs, functions of some key genes and enzymes associated with the regulation of TIA biosynthesis are still unknown, which makes it difficult to understand the whole process. Notably, the release of the scaffolded genome sequence of C. roseus (Kellner et al., 2015), makes it possible to refine functional annotations of genes by integrating multidimensional data and existing methods.
The integration of biological information through gene expression profiling analysis can benefit to elucidating gene function (Noordewier and Warren, 2001). Transcriptomic datasets can be used to establish the gene expression profiles, which can provide some useful information for inferring gene regulatory relationship (Newton and Wernisch, 2014). Transcriptome analysis reveals that some genes involved in TIA biosynthesis are differentially expressed in leaf and root tissues, which can help understand specialized metabolic pathways in C. roseus (Verma et al., 2014). Integrated transcriptome and metabolome analysis can establish connections between genes and specialized metabolites, which can identify many genes involved in TIA synthesis and elucidate particular biological pathways (Rischer et al., 2006). Basing on transcriptomic datasets, the network construction can provide important biological knowledge, especially for digging out possible gene functions (Rhee and Mutwil, 2014).
Currently, there has been a plenty of transcriptomic datasets available on the public platform, which lay the foundation for the research in C. roseus. By considering all collected transcriptomic samples available together, co-expression network is applied to predicting gene functions on a large scale (Ma et al., 2014). Co-expression network analysis can mimic some important regulatory mechanism in vivo and thus discover key regulatory genes or functional modules. van Dam et al. (2017) excavated disease-related functional modules and annotated core genes based on co-expression network analysis. Considering that genes within a specialized metabolite pathway may form tight associations with each other in co-expression network, the method for connecting genes to specialized metabolic pathways in plant is effective, which can identify novel genes associated with specialized metabolic pathways (Wisecaver et al., 2017). Co-expression network analysis identified two missing enzymes, PAS and DPAS, necessary for vinblastine biosynthesis in C. roseus, which is important for understanding many other bioactive alkaloids (Caputi et al., 2018).
A growing number of studies have supported the utility of co-expression network analysis for inferring and annotating gene function, and excavating core genes involved in specific biological process. PlaNet used Heuristic Cluster Chiseling Algorithm (HCCA) to construct whole-genome co-expression networks for Arabidopsis and six important plant crop species (Mutwil et al., 2011). AraNet presented co-functional gene network for Arabidopsis and generated functional predictions for 27 non-model plant species using an orthologous-based projection (Lee et al., 2015). ATTED-II provided 16 co-expression platforms for nine plant species through combining the Pearson correlation coefficient (PCC) and mutual rank (MR) algorithm (Aoki et al., 2016). Our lab have published several functional genomics databases with co-expression network for plant species (Yu et al., 2014; You et al., 2015, 2016; Zhang et al., 2015; Tian et al., 2016; Ma et al., 2018). Besides, ccNET provided comparative gene functional analyses at a multi-dimensional network and epigenome level across diploid and polyploid Gossypium species based on the co-expression network (You et al., 2017). With the combination of transcriptomic and epigenomic data, MCENet provided global and conditional networks to help identify maize functional genes or modules associated with agronomic traits (Tian et al., 2018).
Here, we constructed a functional genomics database for C. roseus (croFGD). It provided three types of co-expression network, which allowed user to perform network search and analysis from a multi-dimensional perspective. Functional annotation information and several analysis tools were provided for functional prediction of the co-expression genes. Basing on co-expression network, we identified some functional modules which could be applied to the discovery of vital genes associated with agronomic traits. The integration of co-expression network analysis and functional module identification can be used to improve C. roseus gene function annotation and helpful for the functional genomics research. Besides, it can promote the research for the synthesis, metabolism of active substances and drug development.
Materials and Methods
Transcriptomic Data Source
There were 53 samples in Catharanthus roseus collected from the NCBI Sequence Read Archive (SRA), which covered different tissues (root, hairy root, shoot, stem, leaf, flower, seedling, and callus) and different treatments, such as methyl jasmonate (MeJA), peanut witches’ broom (PnWB) infection and yeast elicitor (Supplementary Table S1).
Data Processing and Gene Expression Profiling Analysis
The C. roseus genome had a size of ∼500 Mb, and 33,829 protein-coding genes. All transcriptomic datasets were subjected to quality control using FastQC software (v0.10.1) (Brown et al., 2017). Those datasets with mapping rate <50% were filtered out. The sequence reads were mapped to the C. roseus reference genome (ASM94934v1) (Kellner et al., 2015) using Tophat (v2.0.10) software (Trapnell et al., 2009) with default parameters. Cufflinks (v2.2.1) (Trapnell et al., 2010) was used to calculate the FPKM (fragments per kilobase of transcript per million mapped reads) values with default parameters. And differentially expressed genes was calculated by Cuffdiff (v2.2.1) (Trapnell et al., 2013).
Co-expression Network Construction
Pearson correlation coefficient is used to calculate correlation coefficient between two genes. MR represents high credible co-expression gene pairs after ranking the PCC. PCC is calculated based on the formula below. The more similar the expression pattern in samples between genes is, the higher the PCC score might be. MR is an algorithm basing on PCC, which takes a geometric average of the PCC rank from gene A to gene B and from gene B to gene A.
X or Y represents the FPKM value, and n represents the number of samples. MR ensures those co-expression gene pairs with low credibility will be filtered out, so the PCC and MR are combined to construct co-expression network. Here, all samples were used for the construction of global co-expression network. Among all samples, 44 samples without treatment were used to construct tissue-preferential network, and 32 samples with treatment and corresponding control were used to construct the treat-response network.
Functional Module Identification and Parameter Selection
The Clique Percolation Method (CPM) (Adamcsek et al., 2006) was used to identify modules with nodes densely connected to each other in three types of co-expression networks, including global network, tissue-preferential network and treat-response network. Parameter selection was based on module number, module overlap rate and gene coverage rate. Here, we selected the k = 5 clique size for global co-expression network, which meant each module had at least five nodes and each node had co-expression relationship with each other (Supplementary Figure S2). In fact, one functional module could be regarded as a small network. Similarly, we selected the k = 6 clique size for tissue-preferential network and treat-response network. The functions of the modules were annotated through gene set enrichment analysis (GSEA) (Yi et al., 2013), including GO terms, gene families, plantCyc and KEGG pathways.
The Identification of Orthologous Genes in Arabidopsis
Bidirectional blast alignments were conducted for the analysis of protein sequences between C. roseus and Arabidopsis. Our criteria for the identification of orthologous gene pairs were as follows: the top three hits in each bidirectional blast alignment were selected as the best orthologous pairs; in addition, orthologous pairs with an e-value less than 1E-25 were regarded as the second level.
The Classification of Gene Family
Five main gene families, including TFs and regulator factors (TRs), carbohydrate-active enzymes, kinase, ubiquitin and cytochrome P450, were classified to improve limited functional annotation. TF/TRs and kinase family were identified mainly by iTAK tool (Zheng et al., 2016) based on the rule in PlnTFDB (Pérez-Rodríguez et al., 2009) and PlantsP Kinase Classification (Tchieu et al., 2003), respectively. The carbohydrate-active enzymes (CAZy) family (Lombard et al., 2014) was predicted through the method of orthologous search based on Arabidopsis thaliana. The enzymes were classified into six groups: glycoside hydrolases (GH), glycosyltransferase (GT), polysaccharide lyases (PL), carbohydrate esterase (CE), auxiliary activities (AA) and carbohydrate-binding modules (CBM). Ubiquitin family was identified through Hidden Markov Model (HMM) search based on models from UUCD (Gao et al., 2013). And cytochrome P450 family was predicted by orthologous relationship with Arabidopsis and the candidates were confirmed with ID of PF00067 by Pfam (Finn et al., 2014) search.
Z-Score for Motif Analysis
Motif (cis-element) analysis tool is developed to identify significant motifs in one sequence or in the promoter region of interested gene list and thus predict possible functions. Z-score is a statistical measurement of the distance in standard deviations of a sample, which can act as a normalization method to eliminate the difference caused by background for different samples. So far, it is widely applied to calculating the cis-element significance (Endo et al., 2014).
The Z-score is calculated as:
represents sum value of a motif in the promoter of one gene list. μ represents mean value of the same motif in 1,000 random gene lists with same scale. σ represents standard deviation of the 1,000 mean value based on random selection.
Plant Materials and Growth Conditions
C. roseus seeds were planted in small pots and kept moistened until the seeds had germinated, and allowed to grow until they had three to five leaves, then transferred to a greenhouse (16 h light/8 h darkness, 28/25°C). For MeJA treatment, 100 μM MeJA was sprayed evenly on leaves and stem of well-growth plants. In order to prevent MeJA decomposition, leaves and stem with treatment and corresponding control were under darkness. After treatment for 6 and 24 h, the leaves and stem were harvested, immediately frozen in liquid nitrogen, and then stored at -80°C for use. Control samples were also harvested. Three biologically repeated samples were harvested.
RNA Isolation and Quantitative Real Time RT-PCR
About 100 mg of tissue was ground in liquid nitrogen before isolation of the RNA. Total RNA was isolated using TRIZOL® reagent (Invitrogen, Carlsbad, CA, United States) and purified using Qiagen RNeasy columns (Qiagen, Hilden, Germany). Reverse transcription was performed using Moloney murine leukemia virus (M-MLV; Invitrogen). We heated 10 μL samples containing 2 μg of total RNA, and 20 pmol of random hexamers (Invitrogen) at 70°C for 2 min to denature the RNA and then chilled the samples on ice for 2 min. We added reaction buffer and M-MLV to a total volume of 20 μL containing 500 μM dNTPs, 50 mM Tris-HCl (PH 8.3), 75 mM KCl, 3 mM MgCl2, 5 mM dithiothreitol, 200 units of M-MLV and 20 pmol random hexamers. The samples were then heated at 42°C for 1.5 h. The cDNA samples were diluted to 2 ng/μL for real time RT-PCR analysis.
For quantitative real-time RT-PCR, triplicate quantitative assays were performed on 1 μL of each cDNA dilution using the SYBR Green Master Mix with an ABI 7900 sequence detection system according to the manufacture’s protocol (Applied Biosystems). The gene-specific primers were designed using PRIMER31. The amplification of 18S rRNA was used as an internal control to normalize all data (forward primer, 5′-CGGCTACCACATCCAAGGAA-3′; reverse primer, 5′-TGTCACTACCT CCCCGTGTCA-3′). Gene-specific primers were listed in Supplementary Table S2. The relative quantification method (ΔΔCT) was used to evaluate quantitative variation between replicates examined.
Construction and Content
Database Construction
The database was constructed under the LAMP (Linux + Apache + Mysql + PHP) environment. It mainly contains three parts: (I) functional annotation, which includes gene family, KEGG pathway and miRNA detailed information, etc.; (II) network and module, including co-expression network search and analysis, network comparison and module search; (III) some analysis tools, mainly including cis-element enrichment analysis, GSEA, functional module enrichment analysis and UCSC Genome Browser visualization (Figure 1).
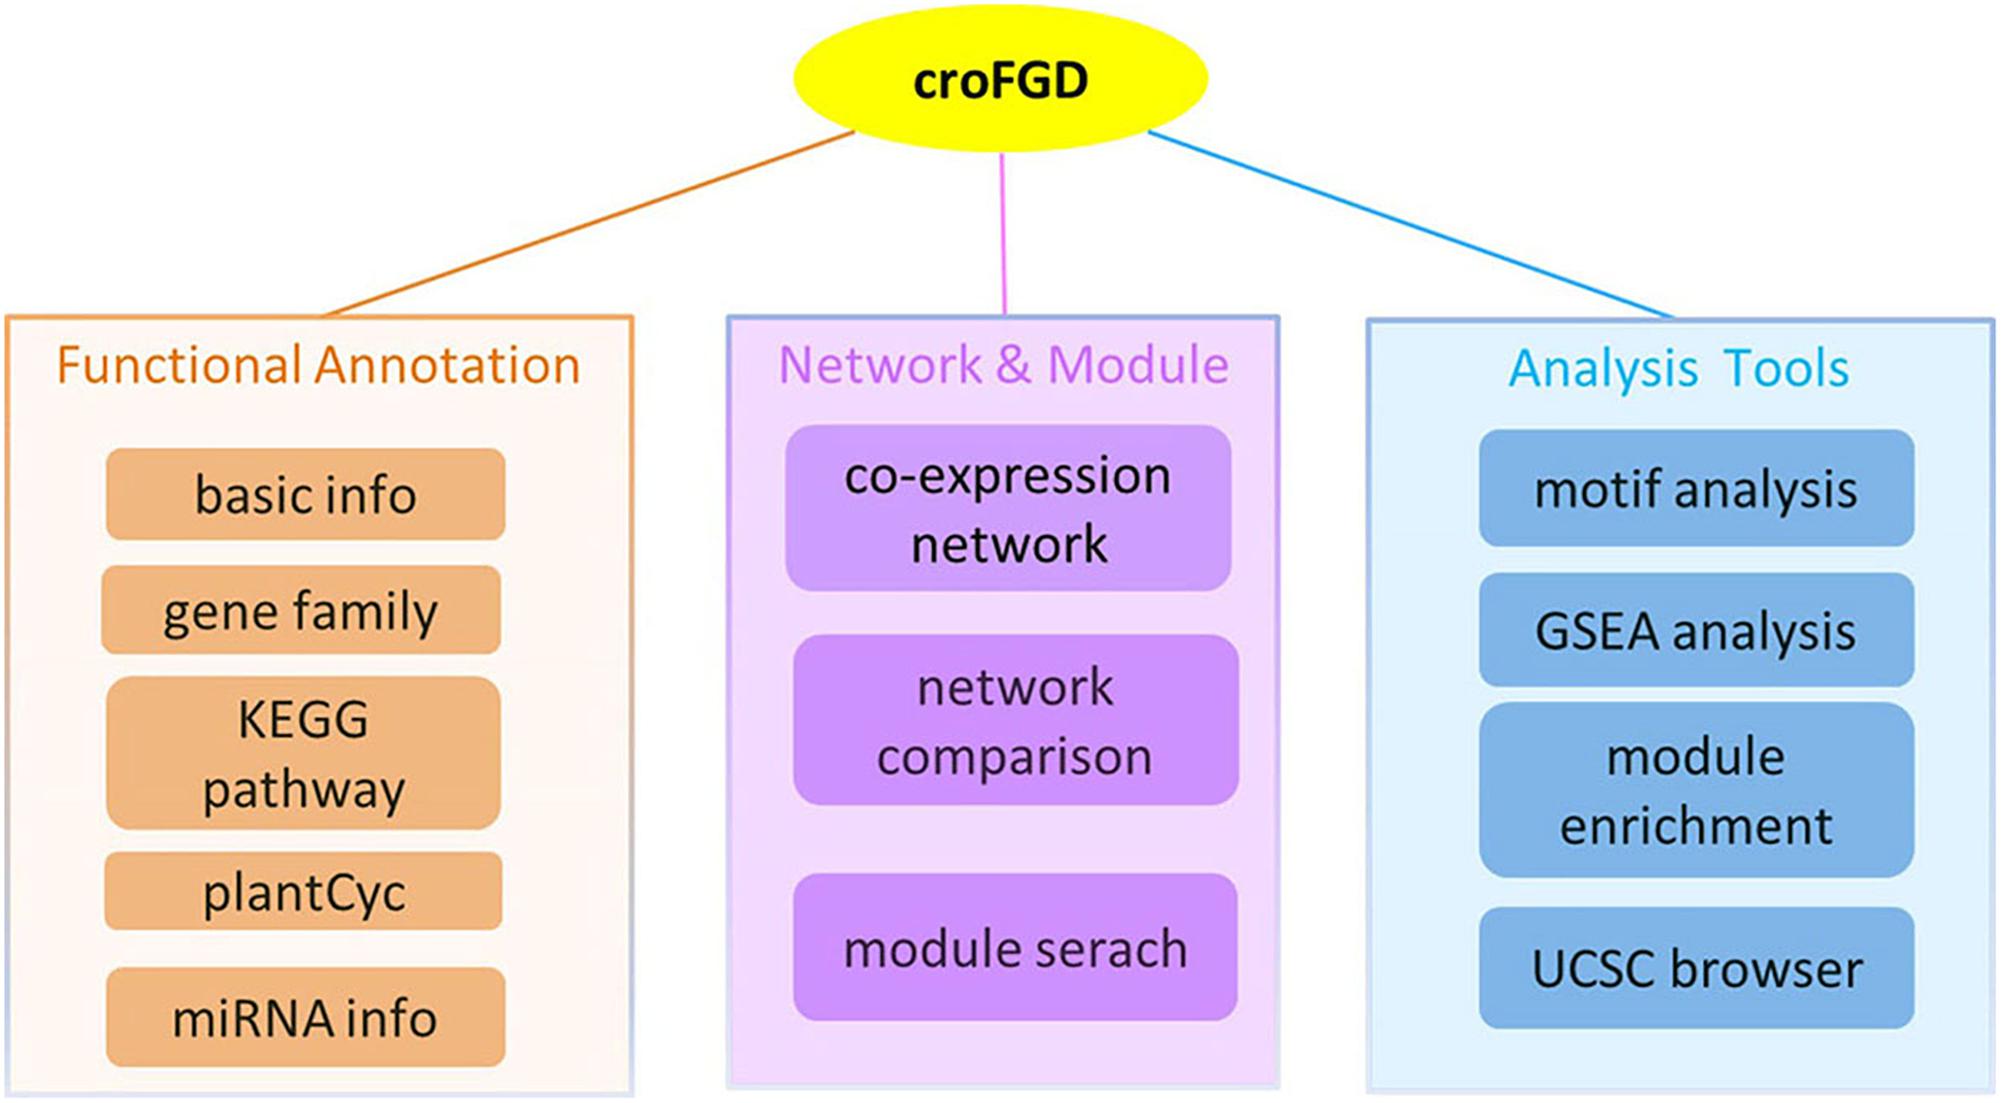
Figure 1. Database architecture. The croFGD database is divided into three main pieces: network & module, functional annotation, and analysis tools. The line with different colors indicates different pieces.
Functional Annotation
We obtained the functional annotation information in C. roseus from the Dryad Digital Repository (Kellner et al., 2015). Among 33,829 protein-coding genes, 14,527 genes were annotated with 4,734 GO terms by blast2GO (Conesa and Gotz, 2008). 5,571 enzymes involved in 213 metabolism pathways were annotated by GhostKOALA (Kanehisa et al., 2016) from KEGG database. We mapped C. roseus protein sequences against CathaCyc (Van Moerkercke et al., 2013) using the BLASTP program and 2,421 enzymes involved in 513 metabolism pathways were annotated. Then we predicted 36,882 orthologous pairs between C. roseus and Arabidopsis through bidirectional blast alignment. There were a total of 1,035 plant motifs collected from the Plant Cis-acting Regulatory DNA Elements (PLACE) database (Higo et al., 1999), PlantCARE database (Rombauts et al., 1999), AthaMap database (Steffens, 2004) and literatures. Furthermore, we adopted the inparanoid algorithm (Sonnhammer and Östlund, 2015) and predicted 9,377 protein–protein interaction (PPI) pairs in C. roseus from over 18,000 experimentally validated PPI pairs in Arabidopsis integrated from several databases, such as BIOGRID (Chatr-Aryamontri et al., 2017), IntAct (Orchard et al., 2014) and related literature (Lumba et al., 2014). We also collected 227 miRNA sequence information derived from a literature (Shen et al., 2017), and then mapped these miRNA sequences against the whole-genome sequence using the GMAP program (Wu and Watanabe, 2005). Furthermore, 143 miRNA targets were identified by psRNATarget (Dai and Zhao, 2011). The miRNA detailed information mainly included location, sequence and structure, miRNA target and expression profiles in seedling after MeJA treatment (Supplementary Figure S3). Furthermore, we conducted the gene family classification and finally predicted 88 TFs/TRs families with 1,702 genes, 21 ubiquitin families with 1,192 genes, 98 cytochrome P450 families with 191 genes, 85 kinase families with 778 genes and 96 CAZy families with 1,505 genes (Table 1).
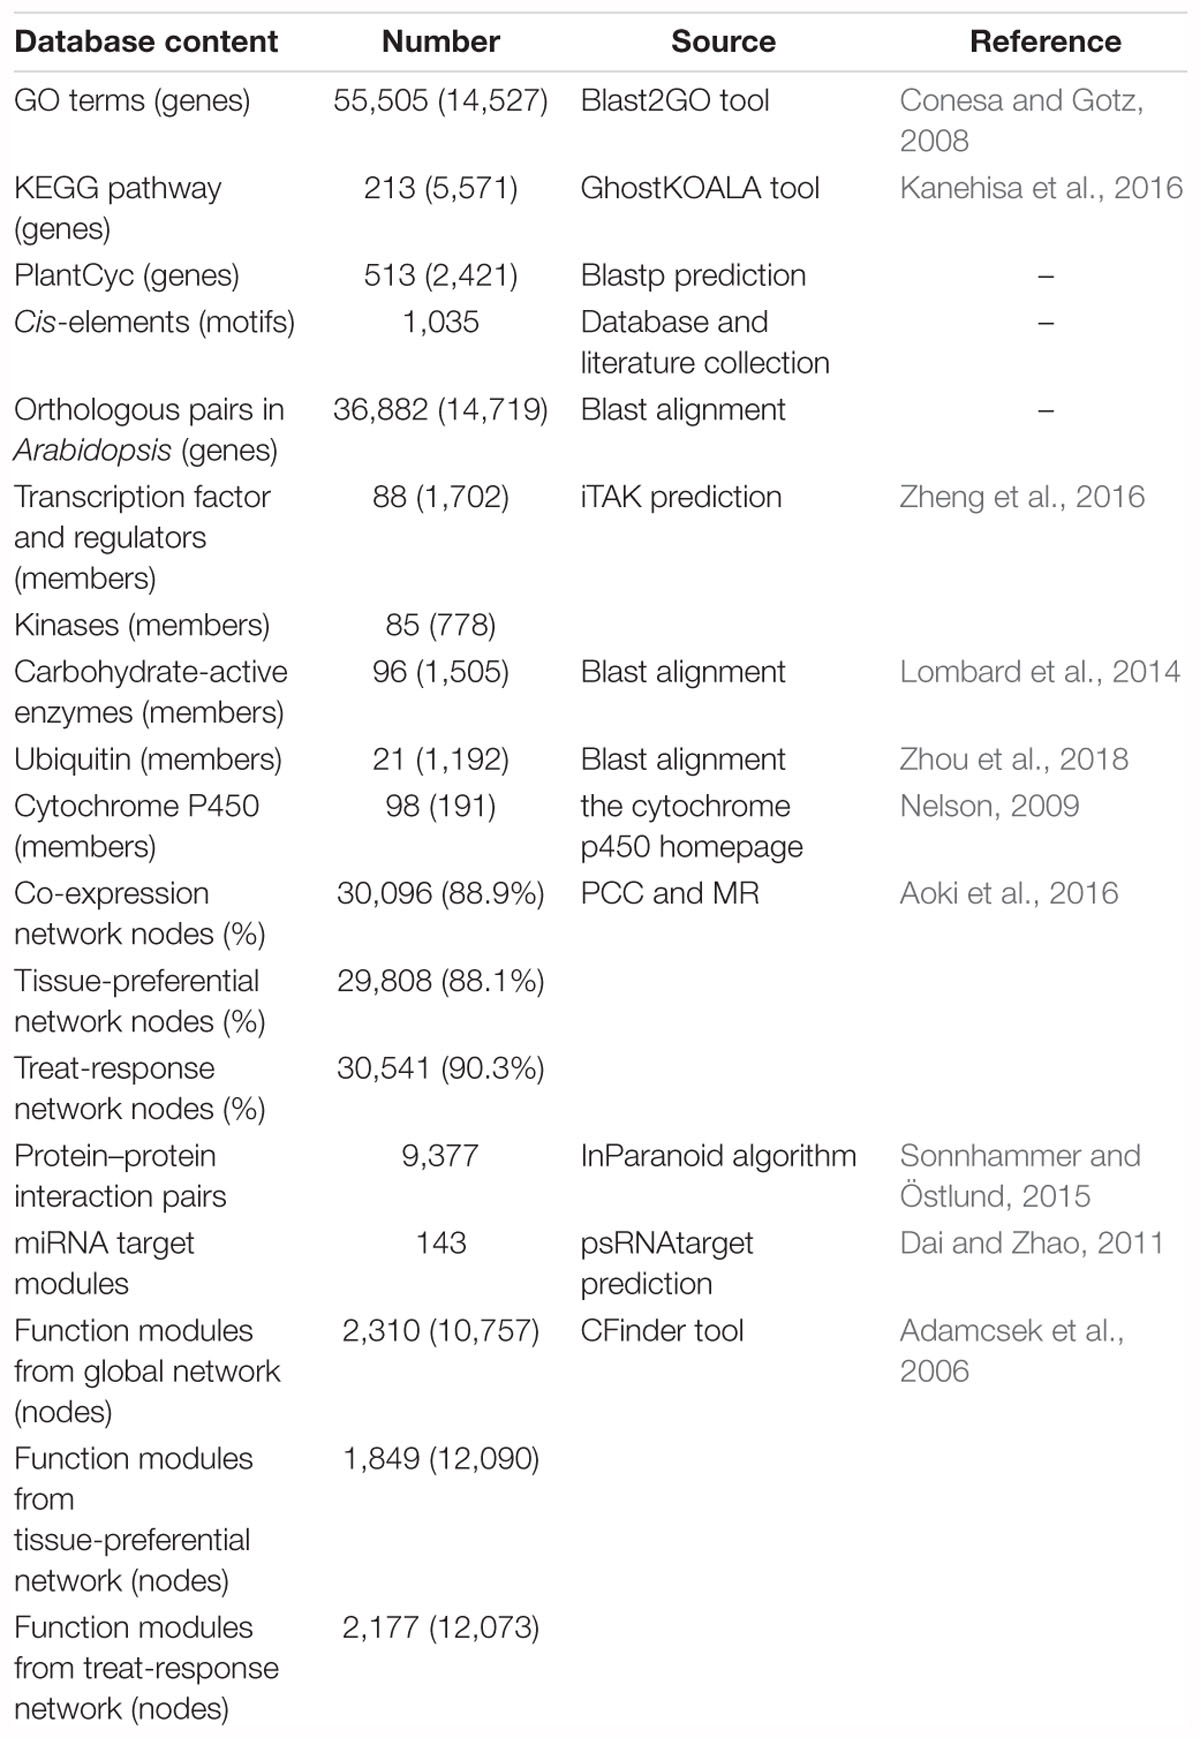
Table 1. Data collection and statistics in croFGD.
Co-expression Network and Functional Module
A well-developed strategy with the integration of PCC and MR algorithm was widely applied to the construction of co-expression network (You et al., 2016, 2017; Obayashi et al., 2018; Tian et al., 2018). We used the 240 BP terms of GO associated with >4 and <20 genes to evaluate the networks. To get optimal gene pairs and evaluate the credibility of co-expression network, we selected different PCC thresholds of PCC > 0.7, PCC > 0.8, PCC > 0.9 and different MR thresholds of MR top3 + MR ≤ 30, MR top3 + MR ≤ 50, MR top3 + MR ≤ 100 to predict gene functions basing on selected GO terms and generated receiver operating characteristic (ROC) curves (Supplementary Figure S1). The larger the area under the curve (AUC) value of co-expression network is, the higher the credibility of the network will be. Finally, we selected the thresholds of PCC > 0.7 and MR top3 + MR ≤ 30 to filter out those co-expression gene pairs with low credibility to construct co-expression network. In total, there were 30,096, 29,808 and 30,541 nodes in global network, tissue-preferential network and treat-response network with gene expression view, which covered 88.9%, 88.1%, and 90.3% of genes in C. roseus, respectively (Table 1). All networks were visualized by Cytoscape 2.8 (Smoot et al., 2011).
Then we overlaid the gene expression value onto the co-expression network to identify whether genes in the network were expressed or not based on the minimum threshold FPKM value. To determine the minimum threshold of the gene expression value (FPKM) among all C. roseus samples (detailed mapping results are shown in Supplementary Table S3), the lowest 5% of all gene FPKM values in each sample and the standard deviation (SD) of each experimental group were computed. The mathematical formula “threshold = average (5% value) + 3 ∗ SD” (You et al., 2016, 2017) was used to calculate the minimum expression value of each experimental group. The minimum threshold of FPKM was 0.094. We identified differential expressed genes between treatment and control samples by the cutoff: |log2FC|≥ 1 and p-value ≤ 0.05. Tissue-preferential analysis in different tissues (root, hairy root, shoot, stem, leaf, flower, seedling, and callus) and treat-response analysis under three types of treatments (MeJA, PnWB infection and yeast elicitor) among five tissues (root, shoot, flower, callus, and hairy root) were supplied for the co-expression network analysis. Meanwhile, predicted miRNA target and PPI pairs were integrated into the network, and further analysis was provided for all members in the network, such as gene expression profiling analysis, GSEA, and cis-element analysis.
Furthermore, co-expression network could be used to perform modularized analysis and excavation for the discovery of agronomic trait-related vital gene and functional module. The CPM proposed to detect the overlapping communities in the complex network (Palla et al., 2005; Li et al., 2014), provided certain practicability for the discovery of key gene and module. Finally, we applied the algorithm and predicted 2,310, 1,849, and 2,177 functional modules in global network, tissue-preferential network and treat-response network in C. roseus, respectively (Table 1). The functions of these modules were annotated through GSEA (Yi et al., 2013). The entries which were not significant were filtered out by Fisher’s tests and multiple test correction method (FDR ≤ 0.05). These functional modules covered diverse functions such as vindoline and vinblastine biosynthesis, jasmonic acid biosynthesis, pathogen resistance and hormone response, etc.
Analysis Tools
Gene Set Enrichment Analysis
Gene set enrichment analysis (Yi et al., 2013) is a powerful method for the functional annotation of interested gene list by computing the overlaps with well-defined background gene sets. Some categories of gene sets, such as GO terms, gene families, plantCyc and KEGG pathways, miRNA targets and functional modules identified from three types of network, were used as background gene sets. The significantly enriched gene set with FDRs ≤ 0.05 would be displayed on the GSEA result page.
Functional Module Enrichment Analysis
The tool was used to identify some functional modules from interested gene list especially in the network. The previously annotated miRNA target modules and functional modules identified from three types of network were used as background functional modules. The modules with FDRs ≤ 0.05 would be regarded as significantly enriched and the enrichment analysis result page included module annotation, module source, overlap gene number, and FDR value.
Cis-Element Enrichment Analysis
Cis-element (motif), a short conserved sequence, can be recognized by some TFs to regulate the expression levels of downstream genes. The tool was developed to identify motifs in a set of gene promoters and thus predict the function of gene set. The cis-element significance test is an algorithm using statistical method based on Z-score and p-value filtering (Yu et al., 2014) that can identify significant cis-regulatory elements in the promoter region of one gene. The promoter region was set as 3 kb in C. roseus. When scanned in the 3 kb promoter region of C. roseus genes, motifs with p-value ≤ 0.05 were significantly enriched on account of the frequency of motif occurrence.
Other Tools Supported in croFGD
A quick search, UCSC Genome Browser (Speir et al., 2016) visualization and a manual were provided for users. The search page mainly included gene detail search, gene function search, functional module search and orthologous search. The orthologous search allowed user to input one gene list in Arabidopsis to search for corresponding C. roseus genes.
Function Application
Comprehensive Exploration for the Function of 16OMT Gene
CRO_T004356 (16OMT), o-methyltransferase family member, which was reported to be involved in the biosynthesis of TIAs (Pandey et al., 2016; Yamamoto et al., 2016). Taking 16OMT gene as an example, we explored possible function of the gene through the database. By gene detail search, we found that the gene: (I) was annotated with alkaloid biosynthetic process (GO: 0009821) and myricetin 3′-O-methyltransferase activity (GO: 0033799), etc.; (II) had two pfam domains: “Dimerisation (PF08100)” and “Methyltransf_2 (PF00891)” domains; (III) was mainly involved in vindoline and vinblastine biosynthesis; (IV) was relatively high in expression in leaf tissue (Figure 2A). We conducted network analysis for three types of co-expression network of 16OMT gene including tissue-preferential network (Figure 2B), global network (Figure 2C) and treat-response network (Figure 2D). GSEA results for global network genes indicated that these genes might be involved in phenylpropanoid biosynthesis, vindoline and vinblastine biosynthesis. Network comparison results suggested that it was relatively conservative between global network and tissue-preferential network (Figure 2E), and there were great differences between global network and treat-response network (Figure 2F). Through module search, the gene in the module (Figure 2G) might be involved in vindoline and vinblastine biosynthesis, alkaloid biosynthetic process, and protein phosphorylation, etc. Therefore, 16OMT gene might have diverse function in several biological processes like hos1 gene (MacGregor and Penfield, 2015). The expression heatmaps of all genes in the module were included (Figure 2H). UCSC genome browser visualization (Figure 2I) indicated that most RNA-seq peaks were enriched in the genic region. Furthermore, stilbenoid, diarylheptanoid, and gingerol biosynthesis pathway was shown (Figure 2J).
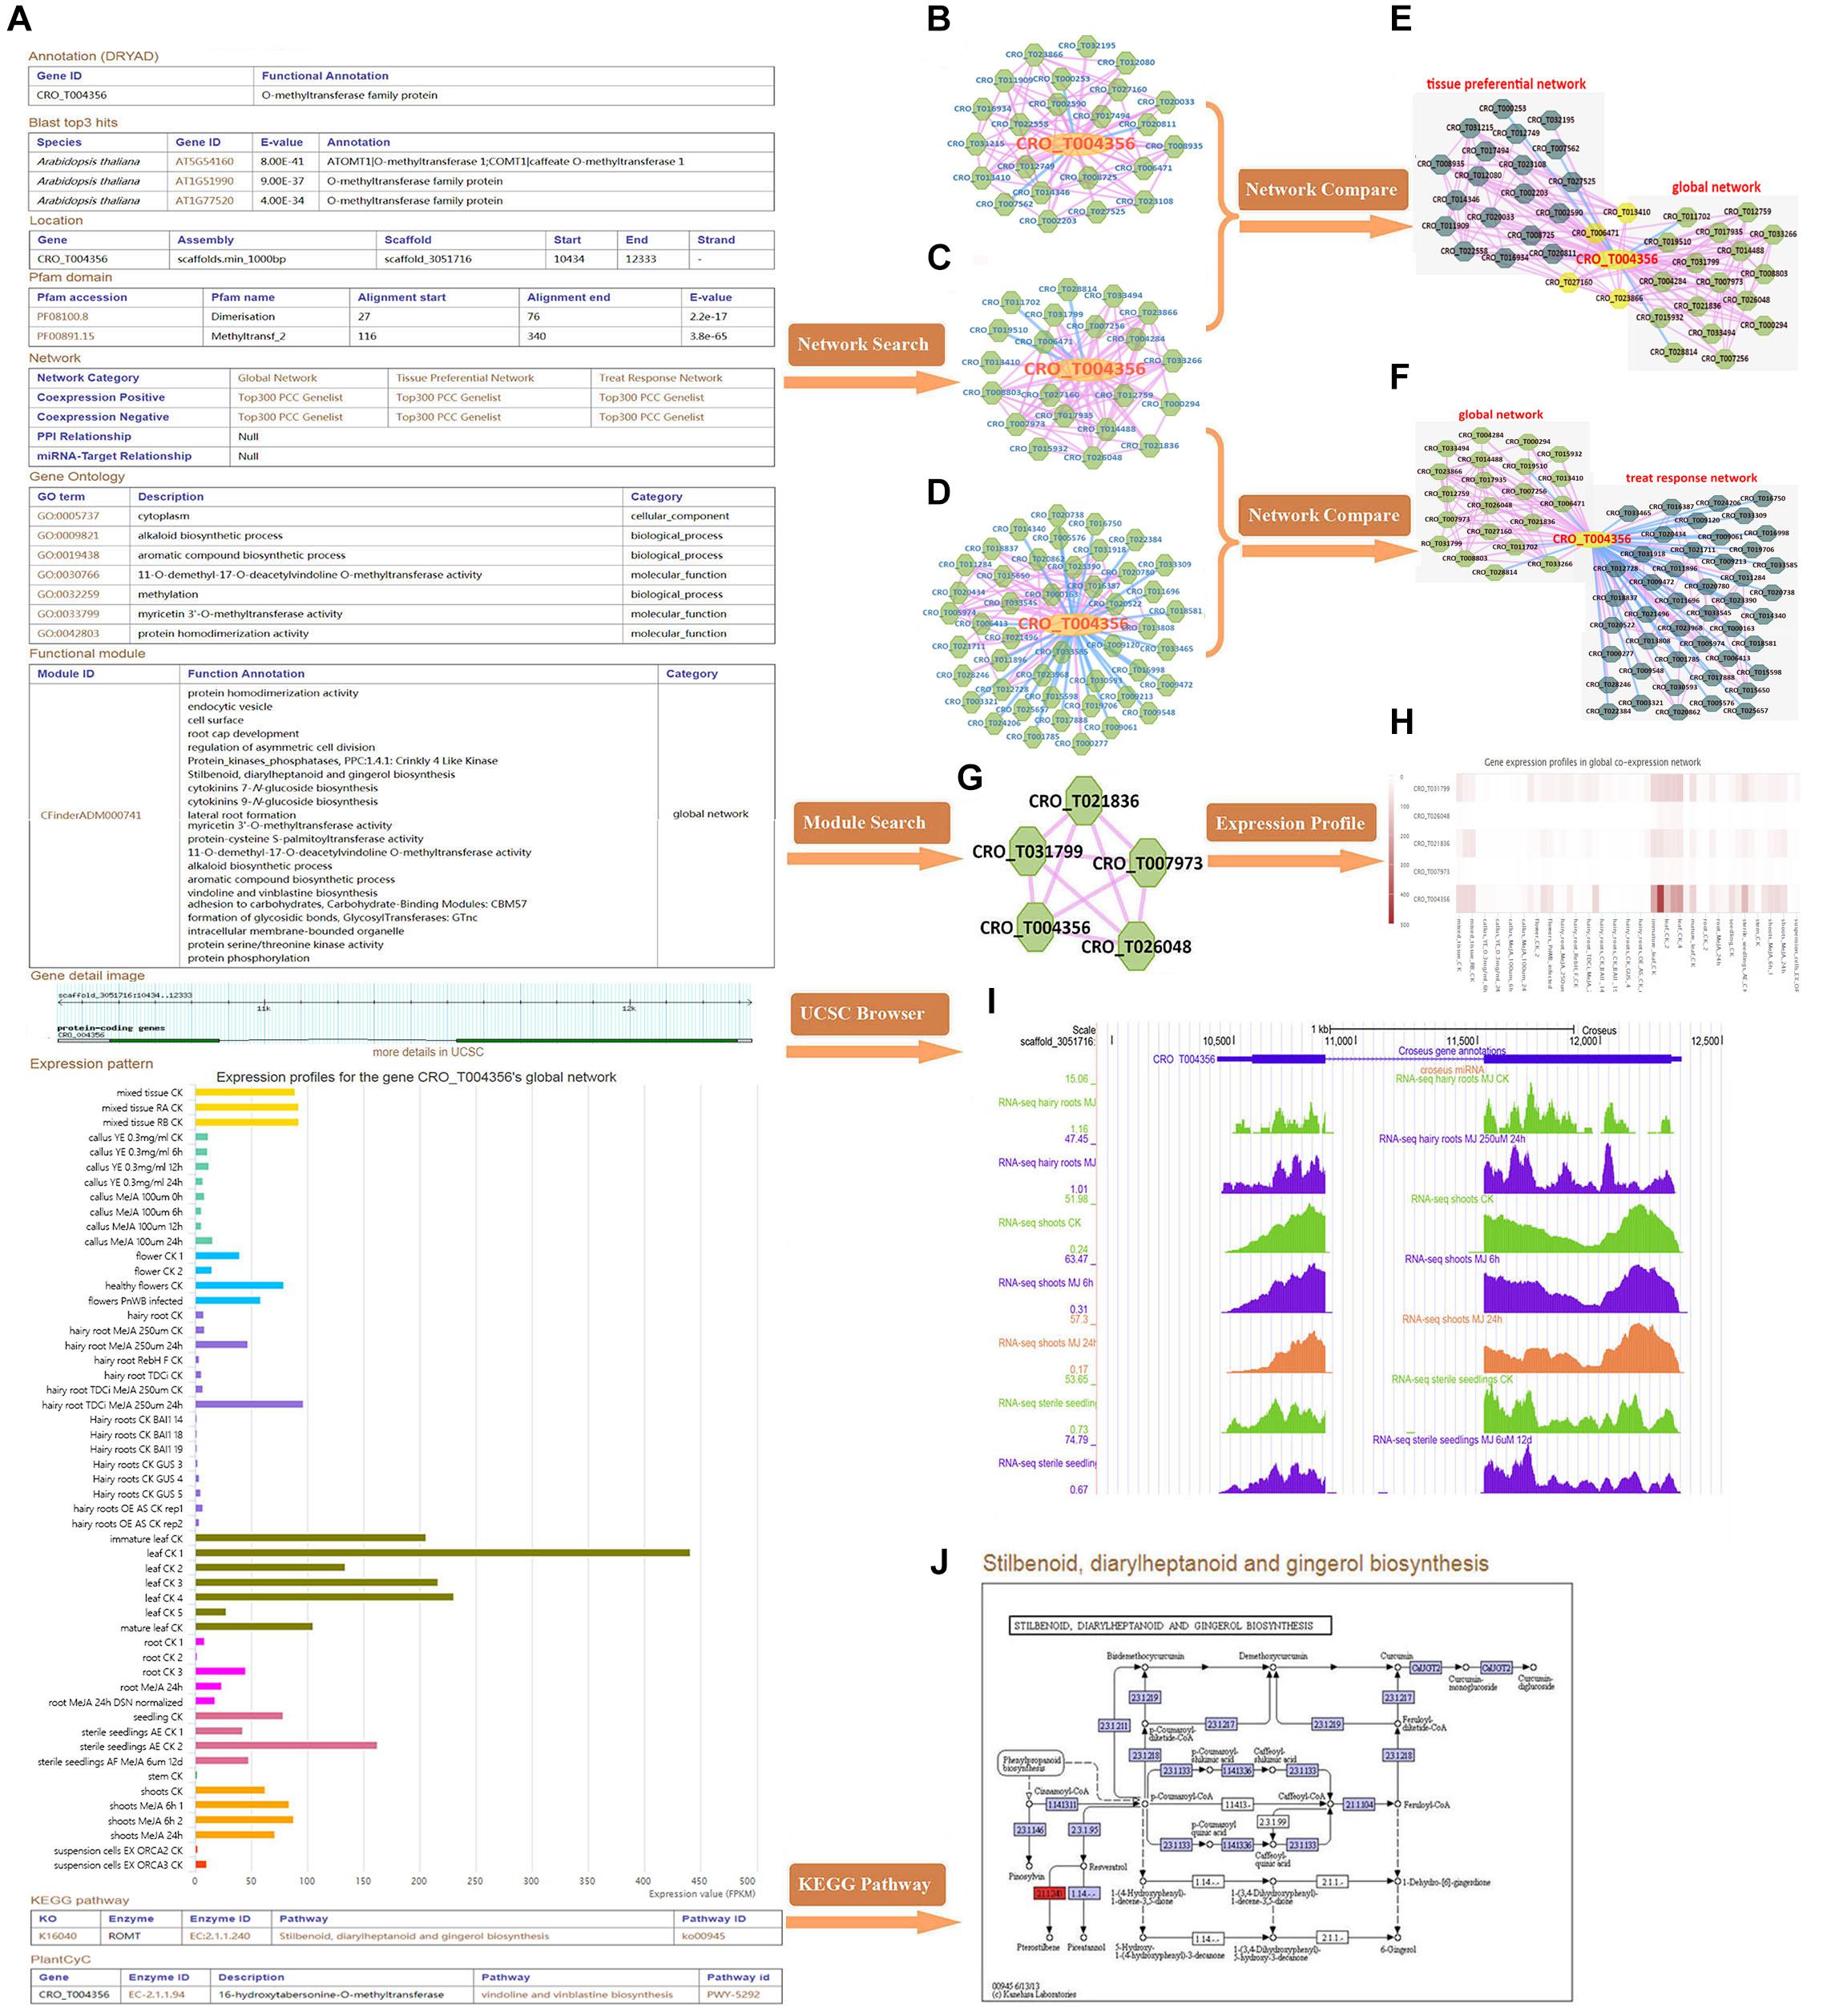
Figure 2. Comprehensive explorations for the function of 16OMT (CRO_T004356) gene. (A) The detailed information of 16OMT gene in C. roseus. Three types of co-expression network, including tissue-preferential network (B), global network (C) and treat-response network (D). In these networks, the node with yellow color represents the gene submitted initially, and the nodes with green color represent co-expressed genes; the edge with pink color links two genes with positive co-expression relationship; the edge with blue color links two genes with negative co-expression relationship. (E) Network comparison between global network and tissue-preferential network. The nodes with yellow color represent overlap genes between two networks, and the nodes with green and dark green color stand for unique genes in two networks, respectively. (F) Network comparison between global network and treat-response network. (G) The “CFinderADM000741” module. (H) Expression heatmaps of genes in “CFinderADM000741” module. (I) UCSC genome browser visualization. (J) Stilbenoid, diarylheptanoid, and gingerol biosynthesis pathway.
Co-expression Network Analysis for CPR Gene
CPR, NADPH–cytochrome P450 reductase, which is essential for the activation of cytochrome P450 enzymes, is critical for the biosynthesis of MIAs (Parage et al., 2016). The detailed information of all genes in the global network of CPR gene (Figure 3A) was listed in Supplementary Table S4. In the CPR network, some genes (GES, 7DLH, GOR, HDS, G8H, ISY, MCS, HDR, 7DLGT and IO) were involved in MIA biosynthesis pathway (Chebbi et al., 2014; Kumar et al., 2015). These genes were labeled with bold in the MIA biosynthesis pathway (Figure 3C). Through GO enrichment analysis (Tian et al., 2017) for all genes in the CPR network, the significantly enriched GO terms were associated with terpene biosynthetic process, and isoprenoid biosynthetic process (Figure 3B), which were related to MIA biosynthesis (Geu-Flores et al., 2012; Dugé de Bernonville et al., 2015). Through module enrichment analysis for all genes in CPR network, three genes (CYP76C, CRO_T015823, and CRO_T014922) in significantly enriched functional modules might be involved in brassinosteroid (BR) biosynthesis, gibberellic acid (GA) response and indole alkaloid biosynthesis, respectively (Figure 3D). Therefore, in addition to MIA biosynthesis, CYP76C and CRO_T015823 also played important role in plant growth and development. Besides, CRO_T014922 might also be involved in MIA biosynthesis together with other genes (CRO_T019924, CRO_T030883, CRO_T015465, and CRO_T025273) in the module (Figure 3D). Thus, in addition to the function of network, co-expressed genes might be involved in some other functions. Furthermore, co-expression analysis can be combined with module enrichment analysis to predict gene function effectively.
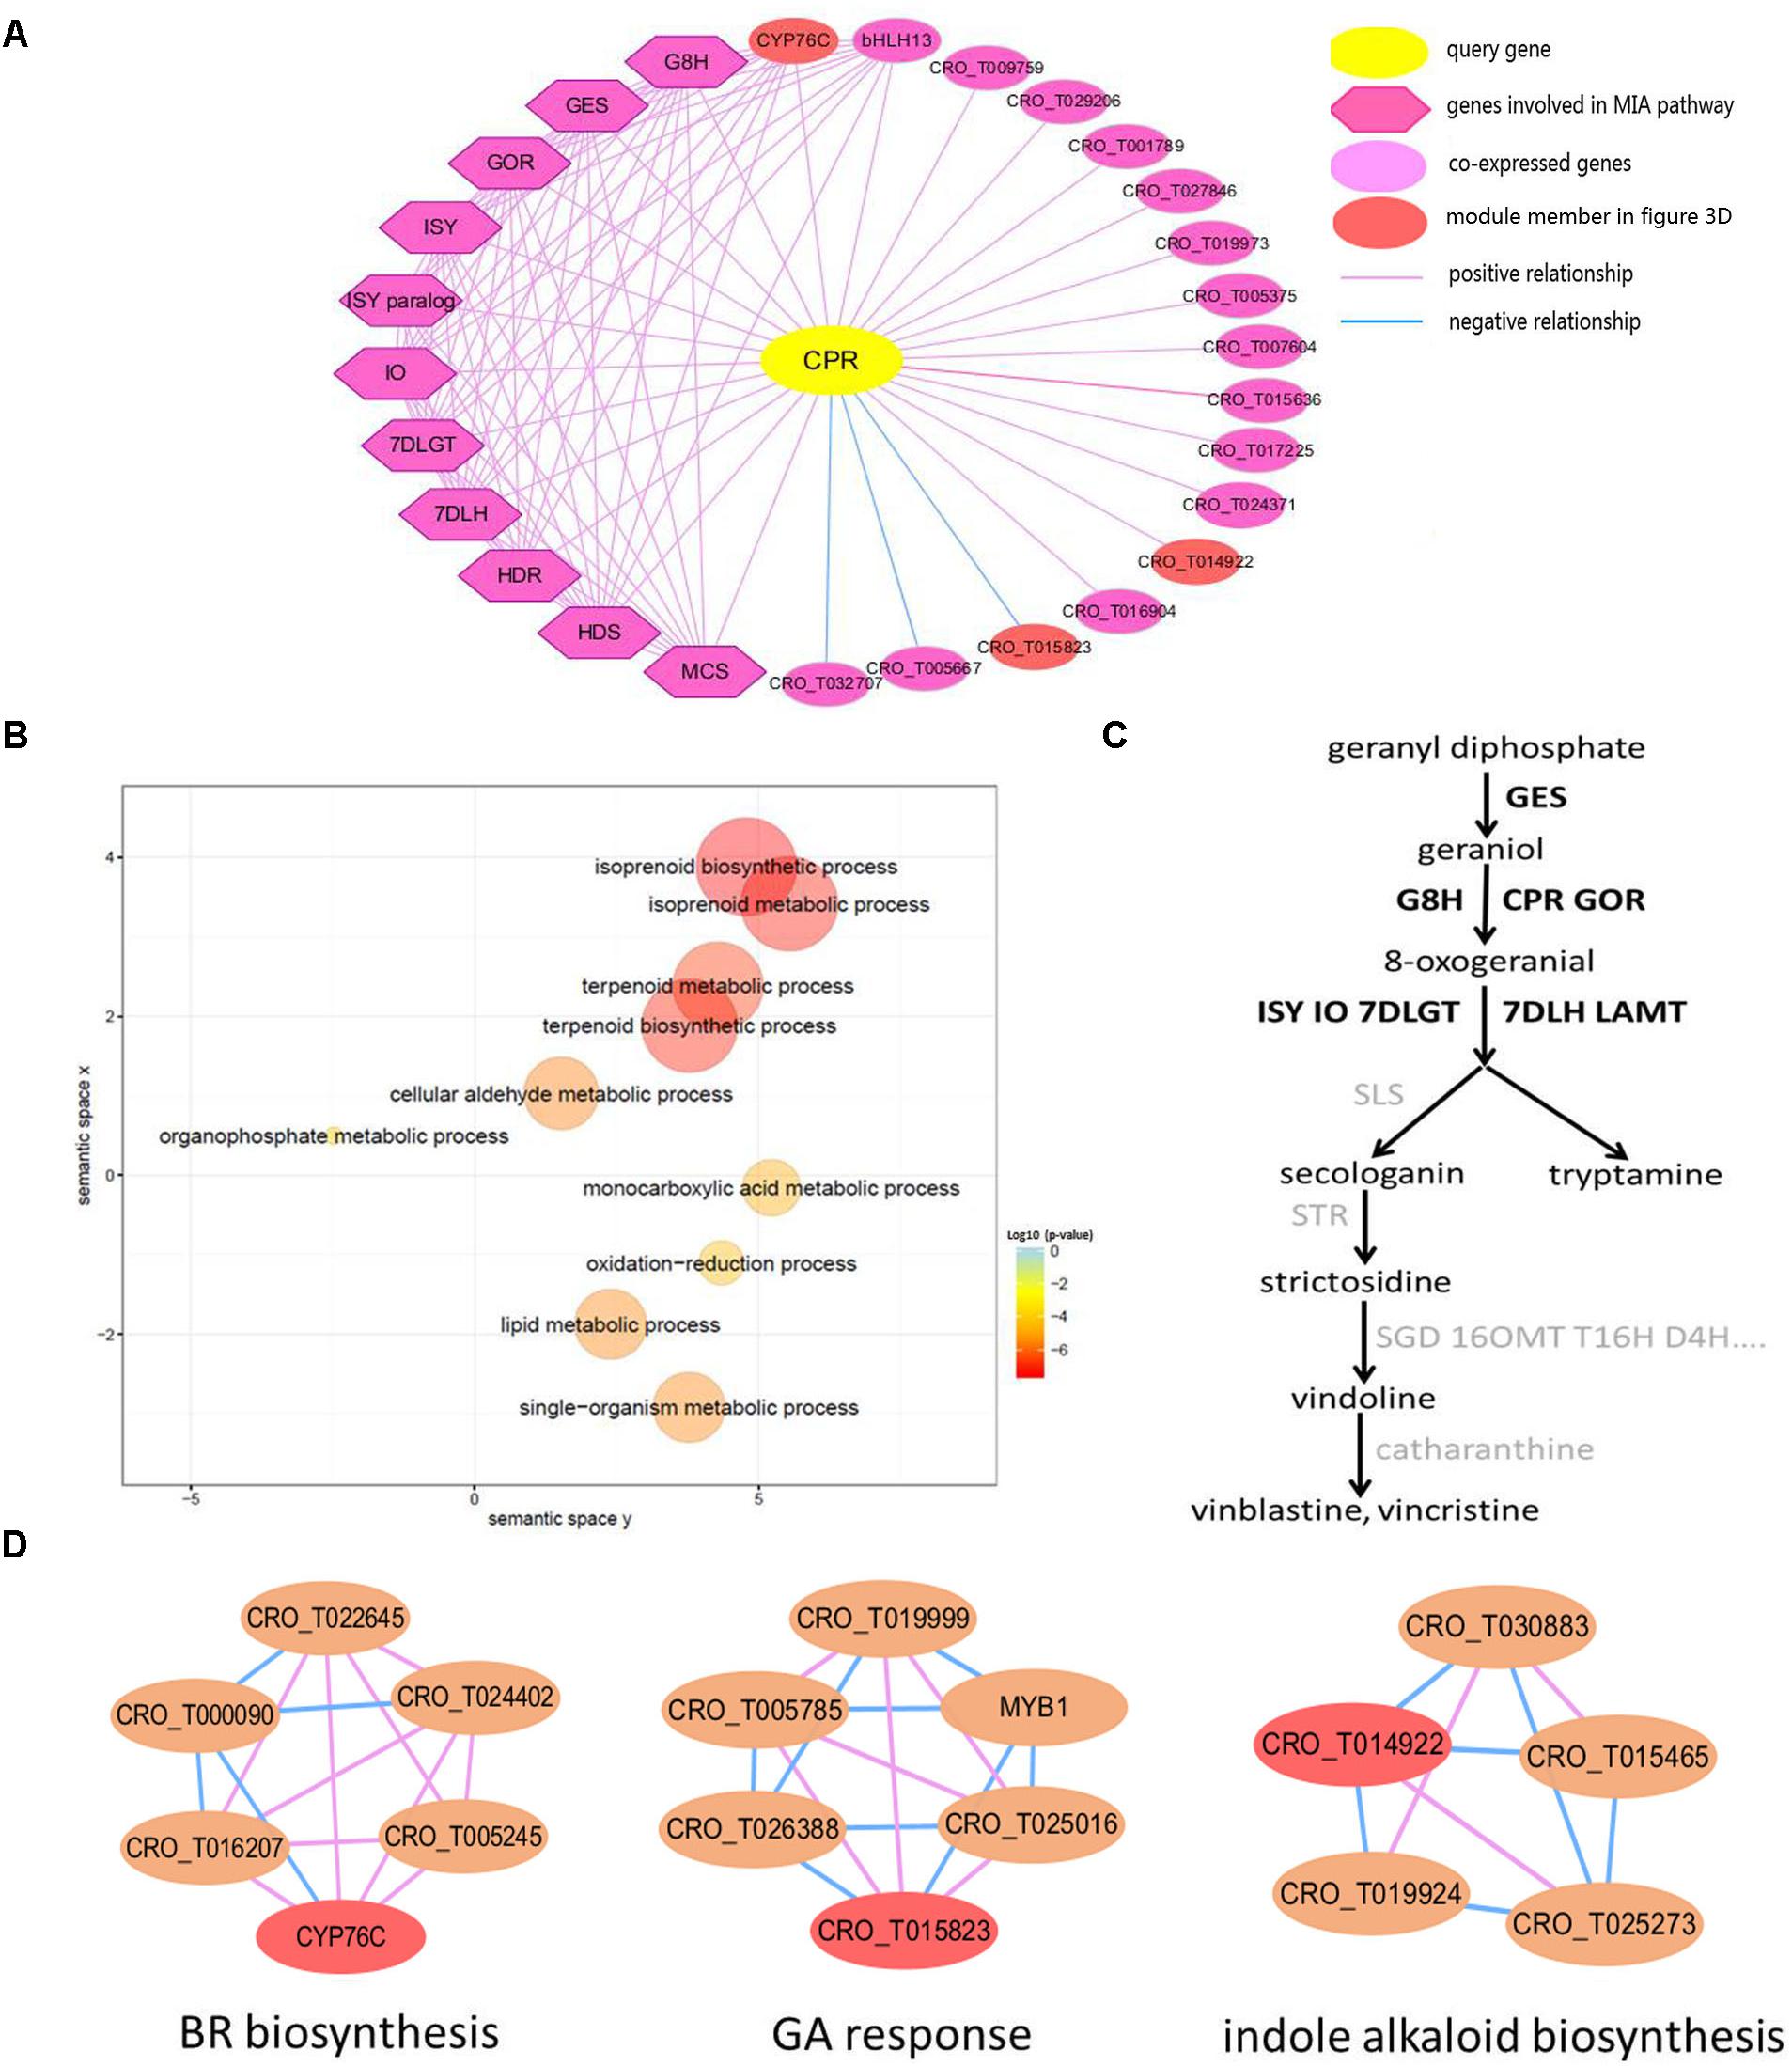
Figure 3. The global network of CPR (CRO_T031702) gene involved in MIA pathway. (A) Global network of CPR gene. The query gene CPR is highlighted by yellow, the blue line represents negative co-expression relationship between two genes, while the pink line represents positive co-expression relationship. The dark purple diamond represents several genes involved in the MIA biosynthesis pathway, such as GES, 7DLH, GOR, HDS, G8H, ISY, MCS, HDR, 7DLGT, and IO, which are co-expressed with CPR gene in the network, and the light purple circular represents other genes co-expressed with query gene. (B) Scatter plot of GO enrichment analysis results for all genes in CPR network. (C) The simplified MIA pathway. The bold represents the gene in CPR co-expression network. (D) Several functional modules related to genes in CPR network. The red node represents genes in CPR network.
Network Comparison Between Global Network and Tissue-Preferential Network of JAZ1 Gene
JAZ1, a jasmonate-zim-domain protein, was discovered as repressors of jasmonate signaling, which was involved in TIA biosynthesis (Pan et al., 2018). We conducted network comparison between global network and tissue-preferential network of JAZ1 (Figure 4A). The information of co-expressed genes in global network and tissue-preferential network was shown in Supplementary Table S5. We found that the two networks displayed different network structure. There were nine overlapped genes including JAZ1 gene between two networks. Fifteen unique genes (including TIFY, CYP94C, and JAZ3) appeared in global network, while sixteen unique genes including MYB15 appeared in tissue-preferential network. GSEA results for the genes in global network of JAZ1 indicated that some gene sets were significantly enriched, such as jasmonic acid biosynthesis, alpha-linolenic acid metabolism, steroid biosynthesis and plant hormone signal transduction (Menke et al., 1999; Koo et al., 2014; Patra et al., 2018). GSEA results for the genes in tissue-preferential network of JAZ1 illustrated that some gene sets were significantly enriched, such as jasmonic acid biosynthetic process, 12-oxophytodienoate reductase activity, NADPH dehydrogenase activity, triglyceride lipase activity and oxylipin biosynthetic process (Figure 4B) (Tani et al., 2008; Wallström et al., 2014; Wang et al., 2018). Based on the structure and function of the two networks of JAZ1 gene, there were some conservation and differences between two networks. In Arabidopsis, cytochrome p450 family member CYP94C1 and CYP94B3 played important role in the regulation of jasmonate response (Niu et al., 2011; Heitz et al., 2012; Koo et al., 2014). In Gossypium hirsutum, GhJAZ2 regulated the jasmonic acid signaling pathway by interacting with the R2R3-MYB transcription factor GhMYB25 (Hu et al., 2016). It needed further study whether the two genes CYP94C and MYB15 coexpressed with JAZ1 in two networks had similar function in C. roseus as in Arabidopsis and Gossypium hirsutum, respectively. These results indicated that network comparison is an effective approach to analyze gene function from the perspective of different networks.
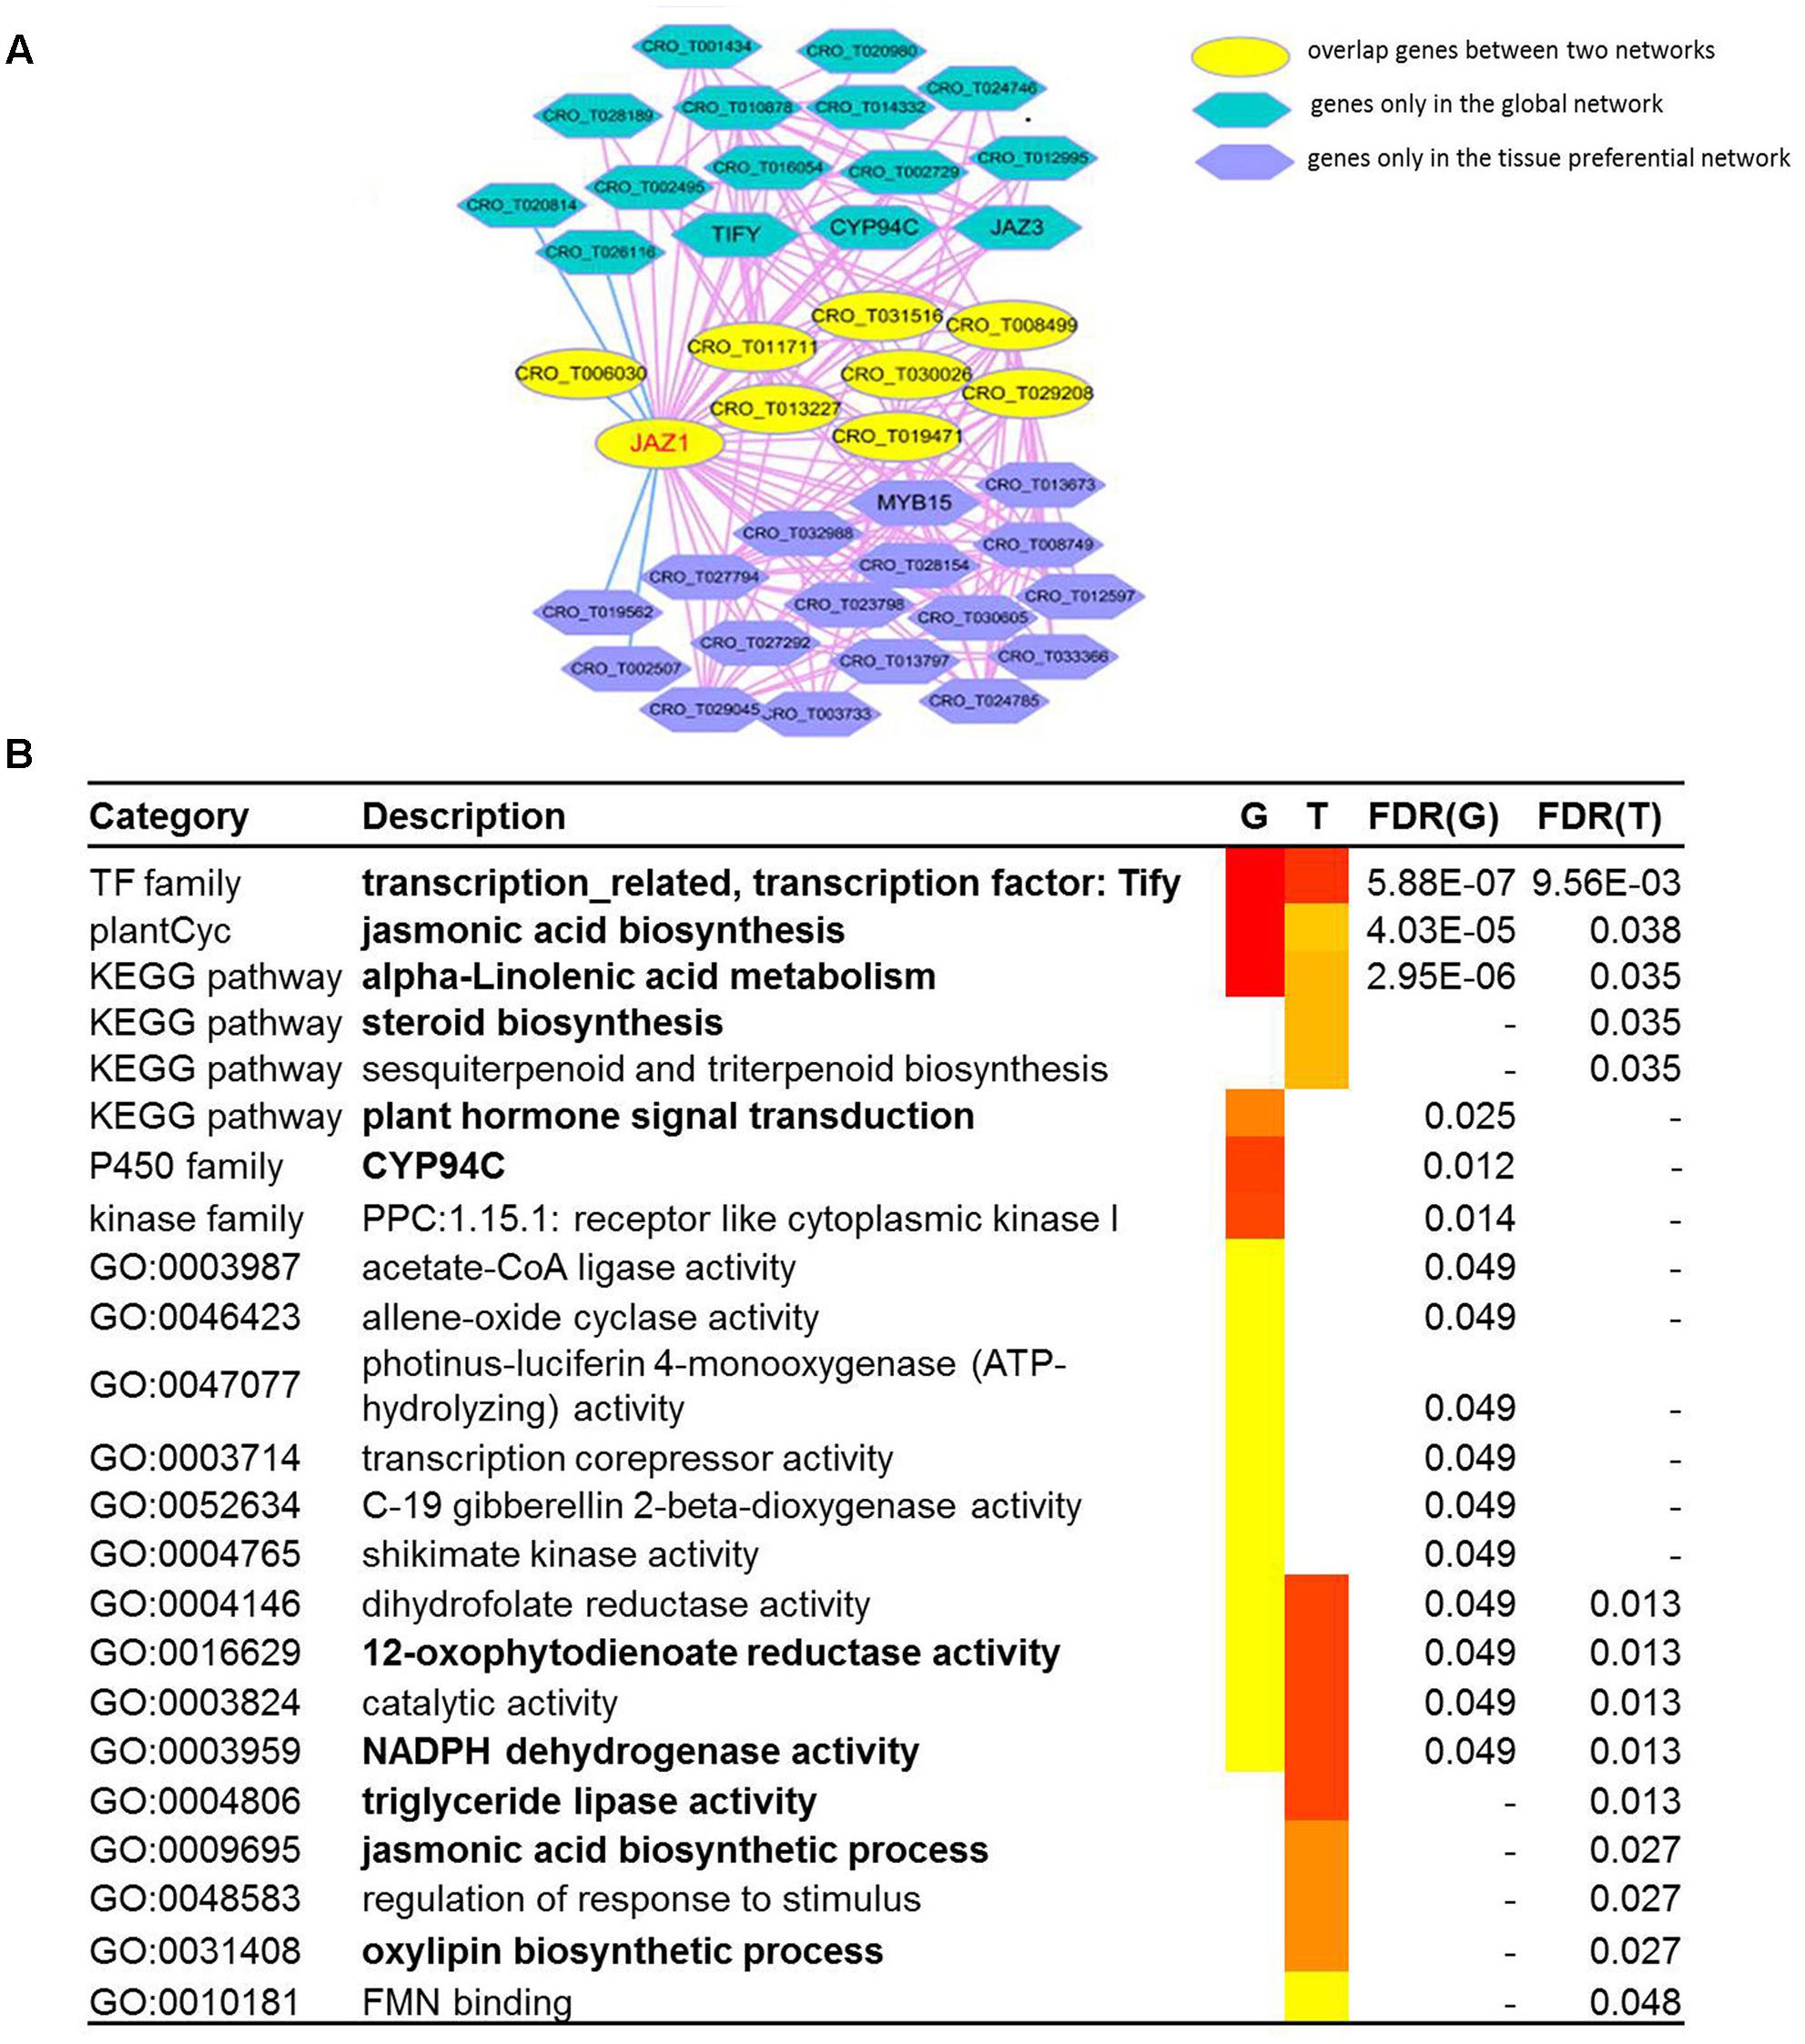
Figure 4. The network comparison between the global network and tissue-preferential network. (A) The comparison between the global network and tissue-preferential network of JAZ1 (CRO_T006982). In the network comparison, the nodes with yellow color represents overlap genes between two networks, and the nodes with dark blue color represents genes only in tissue specific network, while the nodes with sky blue color represents genes only in global network. (B) GSEA results for two networks of JAZ1. The “G” represents global network, and the “T” represents tissue-preferential network.
Treat-Response Network With Expression View After MeJA Treatment
In JAZ1 network with expression view after MeJA treatment in different tissues (shoot, root, hairy root, and seedling) (Figure 5), most genes had significant change in expression, such as JAZ1, JAZ3, CYP94C, MYB, MYB15, and TIFY. Detailed information for up and down-regulated genes in these networks was shown (Supplementary Table S6). In C. roseus, JAZ proteins could repress MYC2 and BIS1 to respond to JA signaling and then modulate MIA biosynthesis (Patra et al., 2018). In rice, enhanced expression of cytochrome p450 family member CYP94C2b could alleviate the jasmonate response and enhanced salt tolerance (Kurotani et al., 2015). In Arabidopsis, AtMYB44 could repress JA-mediated defense by activating the expression of WRKY70 at transcriptional level (Shim et al., 2013). PvTIFY10C and GsTIFY10 gene acted as a repressor in the JA signaling pathway in Phaseolus vulgaris and Glycine soja (Zhu et al., 2011; Aparicio-Fabre et al., 2013), respectively. We conferred that CYP94C, MYB, MYB15, and TIFY co-expressed with JAZ1 might act as JA-response candidate genes in C. roseus. Furthermore, CRO_T012104 (anthranilate synthase beta subunit), CRO_T013473 (protein of unknown function), CRO_T010878 (alpha/beta-hydrolases superfamily protein), CRO_T002729 (allene oxide cyclase), and CRO_T002624 (tryptophan biosynthesis) almost up-regulated under those five conditions, might also act as JA-response candidate genes. Taking treat-response network of JAZ1 gene as an example, we selected six genes (JAZ1, TIFY, MYB, CRO_T012104, CRO_T024124, and CRO_T002729) for the real time RT-PCR validation (Supplementary Figure S4). These genes were up-regulated after MeJA treatment in shoot tissues and might act as JA-response genes. The qRT-PCR results indicated that these genes acted as JA-response genes in shoot tissues. This not only validated the accuracy of the predicted results, but also demonstrated the reliability of the network. Thus, treat-response network with expression view can clear display the dynamic change of gene expression in a network. Therefore, the co-expression network with multi-dimensional analysis can benefit to analyzing regulatory mechanisms in C. roseus development and stress response.

Figure 5. The expression view of JAZ1 network after MeJA treatment in different tissues (shoot, root, hairy root, and seedling). The JAZ1 network after MeJA treatment 6 h in shoot (A), MeJA treatment 24 h in shoot (B), 250 μM MeJA treatment 24 h in hairy root (C), MeJA treatment 24 h in root (D), 6 μm MeJA treatment 12 days in sterile seedling (E). The red hexagon represents up-regulated genes, the blue hexagon represents down-regulated genes, and the green hexagon represents genes with no significant change in expression.
Discussion
Our croFGD database aims to provide an online database server for the annotation and prediction of gene function. We constructed global network, tissue-preferential network and treat-response network with expression view, which covered almost 90% of gene in C. roseus and identified more than 6,000 functional modules. The annotation of these functional modules covered vindoline and vinblastine biosynthesis, jasmonic acid biosynthesis, hormone response and pathogen resistance, etc. The network analysis strategy, functional module annotation and integrated method could improve and refine gene function annotation from diverse perspectives to some extent. For some crops, it could be applied to excavate important functional module related to agronomic traits, which would be beneficial for genetic breeding.
Through some analysis tools supported in croFGD, we can excavate key genes involved in some important biological processes and predict gene function. In comprehensive exploration for the function of 16OMT (Figure 2), we found that the gene might have complex function, like hos1 gene (MacGregor and Penfield, 2015). In global network of CPR, some genes were involved in MIA biosynthesis, such as GES, 7DLH, GOR, G8H, ISY, and 7DLGT (Figure 3A). The integration of co-expression network analysis and module enrichment analysis can be benefit to predicting gene function effectively and refining gene annotation. Basing on network comparison between two networks of JAZ1, there were certain similarities and differences whether in the structure or in the function of two networks (Figure 4). In addition, function of two genes CYP94C and MYB15 needed further research. In treat-response network of JAZ1 gene with expression view after MeJA treatment in different tissues, we identified several possible JA-response candidate genes (Figure 5 and Supplementary Table S6), which was experimentally validated by real time RT-PCR (Supplementary Figure S4). These results would be beneficial to understanding some molecular regulatory mechanisms in C. roseus, such as MIA biosynthesis and jasmonic acid biosynthesis, etc.
Comparative co-expression network analysis between species is an effective approach to predict gene function and improve functional annotation (Pathania et al., 2016). We conducted network comparison for gene list with PCC ranks in the top 300 between C. roseus and Arabidopsis (obtained from ATTED-II) (Supplementary Figure S5). High similarity between co-expression network of JAZ1 in C. roseus and AT1G19180 (JAZ1) in Arabidopsis not only demonstrated the reliability of co-expression network, but also illustrated the conservation of JAZ1 gene function between these two species.
Based on co-expression network with multi-dimensional level, predicting functional module and refining gene function is an effective strategy, which can be used to identify more key genes and regulatory modules when we focus on a detailed biological process. Interestingly, co-expression network is highly associated with the regulation of epigenetic modification, such as DNA methylation (El-Sharkawy et al., 2015) and H3K4me3 (Farris et al., 2015), which can be integrated to understand detailed molecular mechanism, such as the biosynthesis of specific metabolites. There is a certain correlation between co-expression network and metabolic network, the integration of which can be used to predict key enzyme-coding genes and metabolites (Chen et al., 2013), and contribute to better understanding of the molecular mechanisms related to plant metabolic pathway (Rischer et al., 2006; Coneva et al., 2014).
Notably, there are additional limitations and possible improvements for croFGD database. Firstly, the release of the chromosome-level genome of C. roseus in the future, will greatly promote the research on functional genomics. Secondly, more RNA-seq samples of other tissues and treatments could be integrated into the co-expression network construction on the transcriptomic level, which will be beneficial to excavate gene function and improve the whole genome annotation in C. roseus. Thirdly, epigenomic data, such as ChIP-seq and DNase-seq data, can be integrated to improve the annotation of cis-elements and predict gene function. Furthermore, more accurate data, such as gene families, new type of non-coding RNAs, KEGG pathway and GO terms, needs to be integrated, too. Our croFGD database will be updated regularly, and we hope the database can help the community study the functional genomics and yield novel insights into the molecular regulatory mechanisms.
Data Availability
Publicly available datasets were analyzed in this study. This data can be found here: https://www.ncbi.nlm.nih.gov/sra.
Author Contributions
JS performed gene functional annotation, functional module identification, and database construction. HY performed data collection and the co-expression network construction. JY gave advice a lot about the web server. WX gave advice for the application of the co-expression network and some key functional module identification. ZS and WX supervised the project. All authors read and approved the final manuscript.
Funding
This work was supported by grants from the National Natural Science Foundation of China (Grant Nos. 31771467 and 31571360).
Conflict of Interest Statement
The authors declare that the research was conducted in the absence of any commercial or financial relationships that could be construed as a potential conflict of interest.
Supplementary Material
The Supplementary Material for this article can be found online at: https://www.frontiersin.org/articles/10.3389/fgene.2019.00238/full#supplementary-material
Footnotes
References
Adamcsek, B., Palla, G., Farkas, I. J., Derényi, I., and Vicsek, T. (2006). CFinder: locating cliques and overlapping modules in biological networks. Bioinformatics 22, 1021–1023. doi: 10.1093/bioinformatics/btl039
Almagro, L., Fernández-Pérez, F., and Pedreño, M. A. (2015). Indole alkaloids from Catharanthus roseus: bioproduction and their effect on human health. Molecules 20, 2973–3000. doi: 10.3390/molecules20022973
Aoki, Y., Okamura, Y., Tadaka, S., Kinoshita, K., and Obayashi, T. (2016). ATTED-II in 2016: a plant coexpression database towards lineage-specific coexpression. Plant Cell Physiol. 57:e5. doi: 10.1093/pcp/pcv165
Aparicio-Fabre, R., Guillén, G., Loredo, M., Arellano, J., Valdés-López, O., Ramírez, M., et al. (2013). Common bean (Phaseolus vulgaris L.) PvTIFY orchestrates global changes in transcript profile response to jasmonate and phosphorus deficiency. BMC Plant Biol. 13:26. doi: 10.1186/1471-2229-13-26
Aslam, J., Khan, S. H., Siddiqui, Z. H., Fatima, Z., Maqsood, M., Bhat, M. A., et al. (2010). Catharanthus roseus (L.) G. Don. an important drug: it’s applications and production. Int. J. Compr. Pharm. [Epub ahead of print].
Brown, J., Pirrung, M., and Mccue, L. A. (2017). FQC Dashboard: integrates FastQC results into a web-based, interactive, and extensible FASTQ quality control tool. Bioinformatics doi: 10.1093/bioinformatics/btx373 [Epub ahead of print].
Caputi, L., Franke, J., Farrow, S. C., Chung, K., Payne, R. M. E., Nguyen, T. D., et al. (2018). Missing enzymes in the biosynthesis of the anticancer drug vinblastine in Madagascar periwinkle. Science 360, 1235–1239. doi: 10.1126/science.aat4100
Chatr-Aryamontri, A., Oughtred, R., Boucher, L., Rust, J., Chang, C., Kolas, N. K., et al. (2017). The BioGRID interaction database: 2017 update. Nucleic Acids Res. 45, D369–D379. doi: 10.1093/nar/gkw1102
Chebbi, M., Ginis, O., Courdavault, V., Glévarec, G., Lanoue, A., Clastre, M., et al. (2014). ZCT1 and ZCT2 transcription factors repress the activity of a gene promoter from the methyl erythritol phosphate pathway in Madagascar periwinkle cells. J. Plant Physiol. 171, 1510–1513. doi: 10.1016/j.jplph.2014.07.004
Chen, J., Ma, M., Shen, N., Xi, J. J., and Tian, W. (2013). Integration of cancer gene co-expression network and metabolic network to uncover potential cancer drug targets. J. Proteome Res. 12, 2354–2364. doi: 10.1021/pr400162t
Conesa, A., and Gotz, S. (2008). Blast2GO: a comprehensive suite for functional analysis in plant genomics. Int. J. Plant Genomics 2008:619832. doi: 10.1155/2008/619832
Coneva, V., Simopoulos, C., Casaretto, J. A., El-kereamy, A., Guevara, D. R., Cohn, J., et al. (2014). Metabolic and co-expression network-based analyses associated with nitrate response in rice. BMC Genomics 15:1056. doi: 10.1186/1471-2164-15-1056
Dai, X., and Zhao, P. X. (2011). PsRNATarget: a plant small RNA target analysis server. Nucleic Acids Res. 39, W155–W159. doi: 10.1093/nar/gkr319
Dugé de Bernonville, T., Foureau, E., Parage, C., Lanoue, A., Clastre, M., Londono, M. A., et al. (2015). Characterization of a second secologanin synthase isoform producing both secologanin and secoxyloganin allows enhanced de novo assembly of a Catharanthus roseus transcriptome. BMC Genomics 16:619. doi: 10.1186/s12864-015-1678-y
El-Sharkawy, I., Liang, D., and Xu, K. (2015). Transcriptome analysis of an apple (Malus × domestica) yellow fruit somatic mutation identifies a gene network module highly associated with anthocyanin and epigenetic regulation. J. Exp. Bot. 66, 7359–7376. doi: 10.1093/jxb/erv433
Endo, M., Shimizu, H., Nohales, M. A., Araki, T., and Kay, S. A. (2014). Tissue-specific clocks in Arabidopsis show asymmetric coupling. Nature 515, 419–422. doi: 10.1038/nature13919
Farris, S. P., Harris, R. A., and Ponomarev, I. (2015). Epigenetic modulation of brain gene networks for cocaine and alcohol abuse. Front. Neurosci. 9:176. doi: 10.3389/fnins.2015.00176
Finn, R. D., Bateman, A., Clements, J., Coggill, P., Eberhardt, R. Y., Eddy, S. R., et al. (2014). Pfam: the protein families database. Nucleic Acids Res. 42, D222–D30. doi: 10.1093/nar/gkt1223
Gao, T., Liu, Z., Wang, Y., Cheng, H., Yang, Q., Guo, A., et al. (2013). UUCD: a family-based database of ubiquitin and ubiquitin-like conjugation. Nucleic Acids Res. 4, D445–D451. doi: 10.1093/nar/gks1103
Geu-Flores, F., Sherden, N. H., Glenn, W. S., O’connor, S. E., Courdavault, V., Burlat, V., et al. (2012). An alternative route to cyclic terpenes by reductive cyclization in iridoid biosynthesis. Nature 492, 138–142. doi: 10.1038/nature11692
Heitz, T., Widemann, E., Lugan, R., Miesch, L., Ullmann, P., Désaubry, L., et al. (2012). Cytochromes P450 CYP94C1 and CYP94B3 catalyze two successive oxidation steps of plant hormone jasmonoyl-isoleucine for catabolic turnover. J. Biol. Chem. 287, 6296–6306. doi: 10.1074/jbc.M111.316364
Higo, K., Ugawa, Y., Iwamoto, M., and Korenaga, T. (1999). Plant cis-acting regulatory DNA elements (PLACE) database: 1999. Nucleic Acids Res. 27, 297–300. doi: 10.1093/nar/27.1.297
Hu, H., He, X., Tu, L., Zhu, L., Zhu, S., Ge, Z., et al. (2016). GhJAZ2 negatively regulates cotton fiber initiation by interacting with the R2R3-MYB transcription factor GhMYB25-like. Plant J. 88, 921–935. doi: 10.1111/tpj.13273
Kanehisa, M., Sato, Y., and Morishima, K. (2016). BlastKOALA and GhostKOALA: KEGG tools for functional characterization of genome and metagenome sequences. J. Mol. Biol. 428, 726–731. doi: 10.1016/j.jmb.2015.11.006
Kellner, F., Kim, J., Clavijo, B. J., Hamilton, J. P., Childs, K. L., Vaillancourt, B., et al. (2015). Genome-guided investigation of plant natural product biosynthesis. Plant J. 82, 680–692. doi: 10.1111/tpj.12827
Koo, A. J., Thireault, C., Zemelis, S., Poudel, A. N., Zhang, T., Kitaoka, N., et al. (2014). Endoplasmic reticulum-associated inactivation of the hormone jasmonoyl-L-isoleucine by multiple members of the cytochrome P450 94 family in Arabidopsis. J. Biol. Chem. 289, 29728–29738. doi: 10.1074/jbc.M114.603084
Kumar, K., Kumar, S. R., Dwivedi, V., Rai, A., Shukla, A. K., Shanker, K., et al. (2015). Precursor feeding studies and molecular characterization of geraniol synthase establish the limiting role of geraniol in monoterpene indole alkaloid biosynthesis in Catharanthus roseus leaves. Plant Sci. 239, 56–66. doi: 10.1016/j.plantsci.2015.07.007
Kurotani, K. I., Hayashi, K., Hatanaka, S., Toda, Y., Ogawa, D., Ichikawa, H., et al. (2015). Elevated levels of CYP94 family gene expression alleviate the Jasmonate response and enhance salt tolerance in rice. Plant Cell Physiol. 779–789. doi: 10.1093/pcp/pcv006
Lee, T., Yang, S., Kim, E., Ko, Y., Hwang, S., Shin, J., et al. (2015). AraNet v2: an improved database of co-functional gene networks for the study of Arabidopsis thaliana and 27 other nonmodel plant species. Nucleic Acids Res. 43, D996–D1002. doi: 10.1093/nar/gku1053
Li, C. Y., Leopold, A. L., Sander, G. W., Shanks, J. V., Zhao, L., and Gibson, S. I. (2013). The ORCA2 transcription factor plays a key role in regulation of the terpenoid indole alkaloid pathway. BMC Plant Biol. 13:155. doi: 10.1186/1471-2229-13-155
Li, J., Wang, X., and Cui, Y. (2014). Uncovering the overlapping community structure of complex networks by maximal cliques. Phys. A Stat. Mech. Appl. 415, 398–406. doi: 10.1016/j.physa.2014.08.025
Liu, J., Cai, J., Wang, R., and Yang, S. (2017). Transcriptional regulation and transport of terpenoid indole alkaloid in Catharanthus roseus: exploration of new research directions. Int. J. Mol. Sci. 18:E53. doi: 10.3390/ijms18010053
Lombard, V., Golaconda Ramulu, H., Drula, E., Coutinho, P. M., and Henrissat, B. (2014). The carbohydrate-active enzymes database (CAZy) in 2013. Nucleic Acids Res. 42, 490–495. doi: 10.1093/nar/gkt1178
Lumba, S., Toh, S., Handfield, L. F., Swan, M., Liu, R., Youn, J. Y., et al. (2014). A mesoscale abscisic acid hormone interactome reveals a dynamic signaling landscape in arabidopsis. Dev. Cell 29, 360–372. doi: 10.1016/j.devcel.2014.04.004
Ma, C., Xin, M., Feldmann, K. A., and Wang, X. (2014). Machine learning-based differential network analysis: a study of stress-responsive transcriptomes in Arabidopsis. Plant Cell 26, 520–537. doi: 10.1105/tpc.113.121913
Ma, X., Zhao, H., Xu, W., You, Q., Yan, H., Gao, Z., et al. (2018). Co-expression gene network analysis and functional module identification in bamboo growth and development. Front. Genet. 9:574. doi: 10.3389/fgene.2018.00574
MacGregor, D. R., and Penfield, S. (2015). Exploring the pleiotropy of hos1. J. Exp. Bot. 66, 1661–1671. doi: 10.1093/jxb/erv022
Memelink, J., and Gantet, P. (2007). Transcription factors involved in terpenoid indole alkaloid biosynthesis in Catharanthus roseus. Phytochem. Rev. 6, 353–362. doi: 10.1007/s11101-006-9051-z
Menke, F., Parchmann, S., Mueller, M., Kijne, J., and Memelink, J. (1999). Involvement of the octadecanoid pathway and protein phosphorylation in fungal elicitor-induced expression of terpenoid indole alkaloid biosynthetic genes in Catharanthus roseus. Plant Physiol. 119, 1289–1296. doi: 10.1104/pp.119.4.1289
Mutwil, M., Klie, S., Tohge, T., Giorgi, F. M., Wilkins, O., Campbell, M. M., et al. (2011). PlaNet: combined sequence and expression comparisons across plant networks derived from seven species. Plant Cell 23, 895–910. doi: 10.1105/tpc.111.083667
Nelson, D. R. (2009). The cytochrome p450 homepage. Hum. Genomics 4, 59–65. doi: 10.1186/1479-7364-4-1-59
Newton, R., and Wernisch, L. (2014). A meta-analysis of multiple matched copy number and transcriptomics data sets for inferring gene regulatory relationships. PLoS One 9:e105522. doi: 10.1371/journal.pone.0105522
Niu, Y., Figueroa, P., and Browse, J. (2011). Characterization of JAZ-interacting bHLH transcription factors that regulate jasmonate responses in Arabidopsis. J. Exp. Bot. 62, 2143–2154. doi: 10.1093/jxb/erq408
Noordewier, M. O., and Warren, P. V. (2001). Gene expression microarrays and the integration of biological knowledge. Trends Biotechnol. 19, 412–415. doi: 10.1016/S0167-7799(01)01735-8
Obayashi, T., Aoki, Y., Tadaka, S., Kagaya, Y., and Kinoshita, K. (2018). ATTED-II in 2018: a plant coexpression database based on investigation of the statistical property of the mutual rank index. Plant Cell Physiol. 59:e3. doi: 10.1093/pcp/pcx191
Orchard, S., Ammari, M., Aranda, B., Breuza, L., Briganti, L., Broackes-Carter, F., et al. (2014). The MIntAct project - IntAct as a common curation platform for 11 molecular interaction databases. Nucleic Acids Res 42, D358–D363. doi: 10.1093/nar/gkt1115
Palla, G., Derényi, I., Farkas, I., and Vicsek, T. (2005). Uncovering the overlapping community structure of complex networks in nature and society. Nature 435, 814–818. doi: 10.1038/nature03607
Pan, Q., Wang, Q., Yuan, F., Xing, S., Zhao, J., Choi, Y. H., et al. (2012). Overexpression of ORCA3 and G10H in catharanthus roseus plants regulated alkaloid biosynthesis and metabolism revealed by NMR-metabolomics. PLoS One 7:e43038. doi: 10.1371/journal.pone.0043038
Pan, Y. J., Lin, Y. C., Yu, B. F., Zu, Y. G., Yu, F., and Tang, Z. H. (2018). Transcriptomics comparison reveals the diversity of ethylene and methyl-jasmonate in roles of TIA metabolism in Catharanthus roseus. BMC Genomics 19:508. doi: 10.1186/s12864-018-4879-3
Pandey, S. S., Singh, S., Babu, C. S. V., Shanker, K., Srivastava, N. K., Shukla, A. K., et al. (2016). Fungal endophytes of Catharanthus roseus enhance vindoline content by modulating structural and regulatory genes related to terpenoid indole alkaloid biosynthesis. Sci. Rep. 6:26583. doi: 10.1038/srep26583
Parage, C., Foureau, E., Kellner, F., Burlat, V., Mahroug, S., Lanoue, A., et al. (2016). Class II Cytochrome P450 Reductase Governs the Biosynthesis of Alkaloids. Plant Physiol. 172, 1563–1577. doi: 10.1104/pp.16.00801
Pathania, S., Bagler, G., and Ahuja, P. S. (2016). Differential network analysis reveals evolutionary complexity in secondary metabolism of Rauvolfia serpentina over Catharanthus roseus. Front. Plant Sci. 7:1229. doi: 10.3389/fpls.2016.01229
Patra, B., Pattanaik, S., Schluttenhofer, C., and Yuan, L. (2018). A network of jasmonate-responsive bHLH factors modulate monoterpenoid indole alkaloid biosynthesis in Catharanthus roseus. New Phytol. 217, 1566–1581. doi: 10.1111/nph.14910
Pérez-Rodríguez, P., Riaño-Pachón, D. M., Corr^ea, L. G. G., Rensing, S. A., Kersten, B., and Mueller-Roeber, B. (2009). PlnTFDB: updated content and new features of the plant transcription factor database. Nucleic Acids Res 38, D822–D827. doi: 10.1093/nar/gkp805
Rhee, S. Y., and Mutwil, M. (2014). Towards revealing the functions of all genes in plants. Trends Plant Sci. 19, 212–221. doi: 10.1016/j.tplants.2013.10.006
Rischer, H., Oresic, M., Seppanen-Laakso, T., Katajamaa, M., Lammertyn, F., Ardiles-Diaz, W., et al. (2006). Gene-to-metabolite networks for terpenoid indole alkaloid biosynthesis in Catharanthus roseus cells. Proc. Natl. Acad. Sci. U.S.A. 103, 5614–5619. doi: 10.1073/pnas.0601027103
Rizvi, N. F., Weaver, J. D., Cram, E. J., and Lee-Parsons, C. W. T. (2016). Silencing the transcriptional repressor, ZCT1, illustrates the tight regulation of terpenoid indole alkaloid biosynthesis in Catharanthus roseus hairy roots. PLoS One 11:e0159712. doi: 10.1371/journal.pone.0159712
Rombauts, S., Déhais, P., Van Montagu, M., and Rouzé, P. (1999). PlantCARE, a plant cis-acting regulatory element database. Nucleic Acids Res. 27, 295–296. doi: 10.1093/nar/27.1.295
Shen, E. M., Singh, S. K., Ghosh, J. S., Patra, B., Paul, P., Yuan, L., et al. (2017). The miRNAome of Catharanthus roseus: identification, expression analysis, and potential roles of microRNAs in regulation of terpenoid indole alkaloid biosynthesis. Sci. Rep. 7:43027. doi: 10.1038/srep43027
Shim, J. S., Jung, C., Lee, S., Min, K., Lee, Y. W., Choi, Y., et al. (2013). AtMYB44 regulates WRKY70 expression and modulates antagonistic interaction between salicylic acid and jasmonic acid signaling. Plant J. 73, 483–495. doi: 10.1111/tpj.12051
Smoot, M. E., Ono, K., Ruscheinski, J., Wang, P. L., and Ideker, T. (2011). Cytoscape 2.8: new features for data integration and network visualization. Bioinformatics 27, 431–432. doi: 10.1093/bioinformatics/btq675
Sonnhammer, E. L. L., and Östlund, G. (2015). InParanoid 8: orthology analysis between 273 proteomes, mostly eukaryotic. Nucleic Acids Res. 43, D234–D239. doi: 10.1093/nar/gku1203
Speir, M. L., Zweig, A. S., Rosenbloom, K. R., Raney, B. J., Paten, B., Nejad, P., et al. (2016). The UCSC Genome Browser database: 2016 update. Nucleic Acids Res. 44, D717–D725. doi: 10.1093/nar/gkv1275
Steffens, N. O. (2004). AthaMap: an online resource for in silico transcription factor binding sites in the Arabidopsis thaliana genome. Nucleic Acids Res. 32, 368D–372D. doi: 10.1093/nar/gkh017
Suttipanta, N., Pattanaik, S., Kulshrestha, M., Patra, B., Singh, S. K., and Yuan, L. (2011). The Transcription Factor CrWRKY1 positively regulates the terpenoid indole alkaloid biosynthesis in Catharanthus roseus. Plant Physiol. 157, 2081–2093. doi: 10.1104/pp.111.181834
Tani, T., Sobajima, H., Okada, K., Chujo, T., Arimura, S. I., Tsutsumi, N., et al. (2008). Identification of the OsOPR7 gene encoding 12-oxophytodienoate reductase involved in the biosynthesis of jasmonic acid in rice. Planta 227:517. doi: 10.1007/s00425-007-0635-7
Tchieu, J. H., Fana, F., Fink, J. L., Harper, J., Nair, T. M., Niedner, R. H., et al. (2003). The PlantsP and PlantsT functional genomics databases. Nucleic Acids Res. 31, 342–344. doi: 10.1093/nar/gkg025
Tian, T., Liu, Y., Yan, H., You, Q., Yi, X., Du, Z., et al. (2017). AgriGO v2.0: a GO analysis toolkit for the agricultural community, 2017 update. Nucleic Acids Res. 45, W122-W129. doi: 10.1093/nar/gkx382
Tian, T., You, Q., Yan, H., Xu, W., and Su, Z. (2018). MCENet: a database for maize conditional co-expression network and network characterization collaborated with multi-dimensional omics levels. J. Genet. Genomics 45, 351–360. doi: 10.1016/j.jgg.2018.05.007
Tian, T., You, Q., Zhang, L., Yi, X., Yan, H., Xu, W., et al. (2016). SorghumFDB: sorghum functional genomics database with multidimensional network analysis. Database 2016:baw099. doi: 10.1093/database/baw099
Trapnell, C., Hendrickson, D. G., Sauvageau, M., Goff, L., Rinn, J. L., and Pachter, L. (2013). Differential analysis of gene regulation at transcript resolution with RNA-seq. Nat. Biotechnol. 31, 46–53. doi: 10.1038/nbt.2450
Trapnell, C., Pachter, L., and Salzberg, S. L. (2009). TopHat: Discovering splice junctions with RNA-Seq. Bioinformatics 25, 1105–1111. doi: 10.1093/bioinformatics/btp120
Trapnell, C., Williams, B. A., Pertea, G., Mortazavi, A., Kwan, G., Van Baren, M. J., et al. (2010). Transcript assembly and quantification by RNA-Seq reveals unannotated transcripts and isoform switching during cell differentiation. Nat. Biotechnol. 28, 511–515. doi: 10.1038/nbt.1621
van Dam, S., Võsa, U., van der Graaf, A., Franke, L., and de Magalhães, J. P. (2017). Gene co-expression analysis for functional classification and gene–disease predictions. Brief. Bioinform. 19, 575–592. doi: 10.1093/bib/bbw139
Van Der Fits, L., and Memelink, J. (2000). ORCA3, a jasmonate-responsive transcriptional regulator of plant primary and secondary metabolism. Science 289, 295–297. doi: 10.1126/science.289.5477.295
Van Moerkercke, A., Fabris, M., Pollier, J., Baart, G. J. E., Rombauts, S., Hasnain, G., et al. (2013). CathaCyc, a metabolic pathway database built from catharanthus roseus RNA-seq data. Plant Cell Physiol. 54, 673–685. doi: 10.1093/pcp/pct039
Van Moerkercke, A., Steensma, P., Schweizer, F., Pollier, J., Gariboldi, I., Payne, R., et al. (2015). The bHLH transcription factor BIS1 controls the iridoid branch of the monoterpenoid indole alkaloid pathway in Catharanthus roseus. Proc. Natl. Acad. Sci. U.S.A. 112, 8130–8135. doi: 10.1073/pnas.1504951112
Verma, M., Ghangal, R., Sharma, R., Sinha, A. K., and Jain, M. (2014). Transcriptome analysis of Catharanthus roseus for gene discovery and expression profiling. PLoS One 9:e103583. doi: 10.1371/journal.pone.0103583
Wallström, S. V., Florez-Sarasa, I., Araújo, W. L., Aidemark, M., Fernández-Fernández, M., Fernie, A. R., et al. (2014). Suppression of the external mitochondrial NADPH dehydrogenase, NDB1, in Arabidopsis thaliana affects central metabolism and vegetative growth. Mol. Plant 7, 356–368. doi: 10.1093/mp/sst115
Wang, K., Guo, Q., Froehlich, J. E., Hersh, H. L., Zienkiewicz, A., Howe, G. A., et al. (2018). Two abscisic acid responsive plastid lipase genes involved in jasmonic acid biosynthesis in Arabidopsis thaliana. Plant Cell 30, 1006–1022. doi: 10.1105/tpc.18.00250
Wisecaver, J. H., Borowsky, A. T., Tzin, V., Jander, G., Kliebenstein, D. J., and Rokas, A. (2017). A global coexpression network approach for connecting genes to specialized metabolic pathways in plants. Plant Cell 29, 944-959 doi: 10.1105/tpc.17.00009
Wu, T. D., and Watanabe, C. K. (2005). GMAP: A genomic mapping and alignment program for mRNA and EST sequences. Bioinformatics 21, 1859–1875. doi: 10.1093/bioinformatics/bti310
Yamamoto, K., Takahashi, K., Mizuno, H., Anegawa, A., Ishizaki, K., Fukaki, H., et al. (2016). Cell-specific localization of alkaloids in Catharanthus roseus stem tissue measured with Imaging MS and Single-cell MS. Proc. Natl. Acad. Sci. U.S.A. 113, 3891–3896. doi: 10.1073/pnas.1521959113
Yi, X., Du, Z., and Su, Z. (2013). PlantGSEA: a gene set enrichment analysis toolkit for plant community. Nucleic Acids Res. 41, W98–W103. doi: 10.1093/nar/gkt281
You, Q., Xu, W., Zhang, K., Zhang, L., Yi, X., Yao, D., et al. (2017). CcNET: Database of co-expression networks with functional modules for diploid and polyploid Gossypium. Nucleic Acids Res. 45, D1090–D1099. doi: 10.1093/nar/gkw910
You, Q., Zhang, L., Yi, X., Zhang, K., Yao, D., Zhang, X., et al. (2016). Co-expression network analyses identify functional modules associated with development and stress response in Gossypium arboreum. Sci. Rep. 6:38436. doi: 10.1038/srep38436
You, Q., Zhang, L., Yi, X., Zhang, Z., Xu, W., and Su, Z. (2015). SIFGD: Setaria italica functional genomics database. Mol. Plant 8, 967–970. doi: 10.1016/j.molp.2015.02.001
Yu, J., Zhang, Z., Wei, J., Ling, Y., Xu, W., and Su, Z. (2014). SFGD: a comprehensive platform for mining functional information from soybean transcriptome data and its use in identifying acyl-lipid metabolism pathways. BMC Genomics 15:271. doi: 10.1186/1471-2164-15-271
Zhang, H., Hedhili, S., Montiel, G., Zhang, Y., Chatel, G., Pré, M., et al. (2011). The basic helix-loop-helix transcription factor CrMYC2 controls the jasmonate-responsive expression of the ORCA genes that regulate alkaloid biosynthesis in Catharanthus roseus. Plant J. 67, 61–71. doi: 10.1111/j.1365-313X.2011.04575.x
Zhang, L., Guo, J., You, Q., Yi, X., Ling, Y., Xu, W., et al. (2015). GraP: Platform for functional genomics analysis of Gossypium raimondii. Database 2015:bav047. doi: 10.1093/database/bav047
Zheng, Y., Jiao, C., Sun, H., Rosli, H. G., Pombo, M. A., Zhang, P., et al. (2016). iTAK: a program for genome-wide prediction and classification of plant transcription factors, transcriptional regulators, and protein kinases. Mol. Plant 9, 1667–1670. doi: 10.1016/j.molp.2016.09.014
Zhou, J., Xu, Y., Lin, S., Guo, Y., Deng, W., Zhang, Y., et al. (2018). iUUCD 2.0: an update with rich annotations for ubiquitin and ubiquitin-like conjugations. Nucleic Acids Res. 46, D447–D453. doi: 10.1093/nar/gkx1041
Keywords: Catharanthus roseus, co-expression network, functional module, gene function, monoterpene indole alkaloid
Citation: She J, Yan H, Yang J, Xu W and Su Z (2019) croFGD: Catharanthus roseus Functional Genomics Database. Front. Genet. 10:238. doi: 10.3389/fgene.2019.00238
Received: 16 October 2018; Accepted: 04 March 2019;
Published: 22 March 2019.
Edited by:
Vinicius Maracaja-Coutinho, Universidad de Chile, ChileReviewed by:
Vishal Acharya, Institute of Himalayan Bioresource Technology (CSIR), IndiaDinesh Kumar, Indian Council of Agricultural Research (ICAR), India
Copyright © 2019 She, Yan, Yang, Xu and Su. This is an open-access article distributed under the terms of the Creative Commons Attribution License (CC BY). The use, distribution or reproduction in other forums is permitted, provided the original author(s) and the copyright owner(s) are credited and that the original publication in this journal is cited, in accordance with accepted academic practice. No use, distribution or reproduction is permitted which does not comply with these terms.
*Correspondence: Wenying Xu, eF93ZW55aW5nQHlhaG9vLmNvbQ== Zhen Su, emhlbnN1QGNhdS5lZHUuY24=
†These authors have contributed equally to this work