 Li Liu
 Jiajing Lin
 Hongying He
- Department of Obstetrics and Gynecology, Liuzhou Worker’s Hospital, Fourth Affiliated Hospital of Guangxi Medical University, Liuzhou, China
Background and Objective: Endometrial cancer (EC) is a common gynecological malignancy worldwide. Despite advances in the development of strategies for treating EC, prognosis of the disease remains unsatisfactory, especially for advanced EC. The aim of this study was to identify novel genes that can be used as potential biomarkers for identifying the prognosis of EC and to construct a novel risk stratification using these genes.
Methods and Results: An mRNA sequencing dataset, corresponding survival data and expression profiling of an array of EC patients were obtained from The Cancer Genome Atlas and Gene Expression Omnibus, respectively. Common differentially expressed genes (DEGs) were identified based on sequencing and expression as given in the profiling dataset. Pathway enrichment analysis of the DEGs was performed using the Database for Annotation, Visualization, and Integrated Discovery. The protein–protein interaction network was established using the string online database in order to identify hub genes. Univariate and multivariable Cox regression analyses were used to screen prognostic DEGs and to construct a prognostic signature. Survival analysis based on the prognostic signature was performed on TCGA EC dataset. A total of 255 common DEGs were found and 11 hub genes (TOP2A, CDK1, CCNB1, CCNB2, AURKA, PCNA, CCNA2, BIRC5, NDC80, CDC20, and BUB1BA) that may be closely related to the pathogenesis of EC were identified. A panel of 7 DEG signatures consisting of PHLDA2, GGH, ESPL1, FAM184A, KIAA1644, ESPL1, and TRPM4 were constructed. The signature performed well for prognosis prediction (p < 0.001) and time-dependent receiver–operating characteristic (ROC) analysis displayed an area under the curve (AUC) of 0.797, 0.734, 0.729, and 0.647 for 1, 3, 5, and 10-year overall survival (OS) prediction, respectively.
Conclusion: This study identified potential genes that may be involved in the pathophysiology of EC and constructed a novel gene expression signature for EC risk stratification and prognosis prediction.
Introduction
Endometrial cancer (EC) is a group of epithelial malignancies that occur in the endometrium and is the most common gynecological malignancy in developed countries. It is estimated that the incidence and mortality of EC was 22.2/100,000 and 4.4/100,000, respectively, in Europe and 8.4/100,000, 1.8/100,000, respectively, worldwide in females in 2018 (Ferlay et al., 2018a,b). In China, the incidence and mortality of EC was 6.6/100,000 and 1.54/100,000, respectively, in females in 2014 (Chen et al., 2014). The incidence of EC has increased during recent years based on the population age and population size (Chen et al., 2017; Global Burden of Disease Cancer Collaboration, Fitzmaurice et al., 2018). While great advances have been made regarding treatment options available for EC, such as surgical interventions, radiotherapy and chemotherapy, large differences exist in the outcomes for patients with different stages of EC. Early EC patients usually have good prognosis but advanced, recurrent, or metastatic EC patients commonly have a bad outcome, which contributes to an ineffective response to radical surgery for EC (Creasman et al., 2006; Watari et al., 2009; Mcgunigal et al., 2017). Therefore, there is an urgent need to identify new molecules that can be used as diagnostic biological markers, molecular therapeutic targets, and to predict prognosis of EC.
Endometrial cancer development and progression occurs as a result of environmental factors and genetic variation, and shows different pathological and molecular characteristics. Classification of EC has been established based on different systems including clinical, metabolic, and endocrine, histological, and genetic alterations. These characteristics are usually used as a guide for selecting treatment strategies and prognosis assessments for EC patients (Bokhman, 1983; Han et al., 2013; Murali et al., 2014). A few clinical factors and pathological features further determine risk level and the prognosis of EC patients. Risk stratification comprehensive analysis of EC patients based on tumor stage, clinical and biological prognostic factors has been established and utilized (Pecorelli, 2009; Korkmaz et al., 2017). However, many genes and pathways are also associated with risk level and prognosis of EC patients (Stelloo et al., 2015). Along with the development of next-generation sequencing, a large number of differentially expressed genes (DEGs) have been discovered between EC tissue and normal endometrium tissue, which have been applied to characterize EC into four subtypes (Church et al., 2013). Furthermore, a few DEGs can be used as biomarkers for EC risk stratification and prognosis (O’mara et al., 2016; Corrado et al., 2018). However, only a few studies have conducted a comprehensive analysis of DEGs related to risk judgment and prognosis of EC.
The Cancer Genome Atlas (TCGA) and Gene Expression Omnibus (GEO) database contain many high-throughput sequencing and gene expression profile data of many different cancer types at DNA, RNA, protein, and epigenetic levels. These genomic data are publicly available and play an important role in exploring the molecular characteristics of cancer occurrence, recurrence, as well as metastasis and in improving diagnosis and treatment of cancer (Tomczak et al., 2015). In recent years, a new molecular typing of EC has been developed through comprehensive genomic and transcriptomic analysis of ECs using TCGA high-throughput sequencing data, which can greatly contribute to develop a targeted therapy for a specific genetic mutation population (Mcalpine et al., 2018). Additionally, comprehensive analysis of DEGs based on TCGA and GEO data has found new models consisting of many DEGs that have been used for risk stratification and as potential diagnosis and prognosis biomarkers in certain cancers (Zhou et al., 2015; Huang et al., 2017; Liu X. et al., 2018).
In this study, we first identified DEGs through an integrated analysis based on TCGA and GEO gene expression data of EC tissue and normal endometrial tissue. A bioinformatics analysis was used to analyze potential prognosis biomarkers for predicting the survival of EC patients using TCGA datasets. Finally, we constructed a DEG expression-based prognostic signature, which may contribute to the development of risk stratification and prognosis assessment of EC patients.
Materials and Methods
Data Source
The gene microarray expression data of GSE63678, including 7 EC tissue samples and 5 normal endometrial tissue samples was downloaded from the Gene Expression Omnibus (GEO) database1. The EC dataset containing 551 tumor samples and 35 normal samples, which included raw counts of mRNA expression data and corresponding clinical information, was obtained from The Cancer Genome Atlas (TCGA) dataset2. Data in this study was obtained from GEO and TCGA public databases and the acquisition and application method complied with guidelines and policies of each database.
Differentially Expressed Gene (DEG) Screening
THE GSE63678 expression profile was normalized and analyzed using the limma package of R software. The TCGA EC dataset was normalized and analyzed using the edgR package of R software. The criteria of a false discovery rate (FDR) p-value < 0.05 and | logFC| > 1 were applied to screen the DEGs. The DEGs that were overlapping in the GSE63678 and TCGA EC datasets were named as common DEGs and were clustered using the pheatmap package of R software.
Functional Enrichment Analysis of DEGs
The Database for Annotation, Visualization and Integrated Discovery (DAVID) v6.83 was used to analyze the common DEGs using gene ontology (GO) enrichment analysis to identify the biological processes, molecular functions, cellular components, and signaling pathways associated with these DEGs. A p-value of <0.05 was considered as statistically significant.
Protein–Protein Interaction (PPI) Network and Module Analysis
The potential relationship between the DEGs encoding proteins was analyzed using the STRING database4. Visualization of the PPI network was done using Cytoscape software. Genes with the top 10 highest degrees in the PPI network were viewed as hub genes. Module analysis of the PPI network was performed using the Molecular Complex Detection (MCODE) tool of Cytoscape software. Functional enrichment analysis of the modules was carried out using the DAVID database.
Survival Analysis
In the TCGA EC dataset, patients with a survival time of more than 30 days were used for the survival analysis. The raw count of the DEGs were log2(x+1) transformed and Univariate Cox proportional hazards regression analysis was used to identify the potential genes involved in overall survival. DEGs with a p-value < 0.05 were subsequently used for multivariate Cox proportional hazards regression analysis to identify prognostic gene markers. In order to further evaluate the relative contribution of these prognostic gene markers to patient survival prediction, these markers were used as the dependent variable to construct the Cox proportional hazards regression model. A risk score model was constructed using a linear combination of these prognostic gene expression markers with the regression coefficient (β) from the multivariate Cox proportional hazards regression analysis. The formula used is as follows: risk score = expression of gene1 × β1gene1 + expression of gene2 × β2gene2 + … expression of genen × βngenen. Patients were divided into a high-risk group and a low-risk group based on the median risk score. The survival analysis between the high-risk group and low-risk group was done using SPSS 20.0. A time-dependent receiver–operating characteristic (ROC) curve was constructed using the survivalROC package of R software to analyze the predictive accuracy of patient overall survival obtained using the risk score model. In addition, comprehensive survival analysis based on the risk score model and EC subgroups, including EC grade, EC histological type and EC stage, were also performed to evaluate the adequacy of the prognostic gene signature for risk stratification and prognostic analysis of different EC subgroups.
Statistical Analysis
The univariate and multivariate Cox proportional hazards regression analyses were completed using the survival package of R software and SPSS 20.0, respectively. Survival analysis was performed between high-risk group and low-risk group using the Kaplan–Meier method in SPSS 20.0. Completely random two samples t test was used to analyze the statistical difference in the expression of hub genes between tumor samples and normal samples and between prognostic genes in tumor samples and normal samples or between the high-risk group and low-risk group. A p-value of <0.05 was considered to be statistically significant.
Results
Identification of Differentially Expressed Genes
According to the screening criteria, a total of 388 DEGs were found between EC tissue and normal endometrial tissue in GSE63678, which included 239 upregulated and 149 downregulated genes (Supplementary Table S1 and Figure 1A). The hierarchy cluster analysis indicated that DEGs can be distinguished between the two groups based on gene expression (Figure 1B). In addition, 4,410 DEGs were obtained, which consisted of 2,215 upregulated genes and 2,195 downregulated genes in EC tissue when compared with normal endometrial tissue in the TCGA dataset (Supplementary Table S2). Furthermore, 255 common DEGs were identified between the GSE63678 and the TCGA EC dataset which comprised of 168 upregulated genes and 87 downregulated genes (Figure 1C and Supplementary Table S3). Figure 1D shows the cluster analysis of the 255 common DEGs in the TCGA EC dataset.
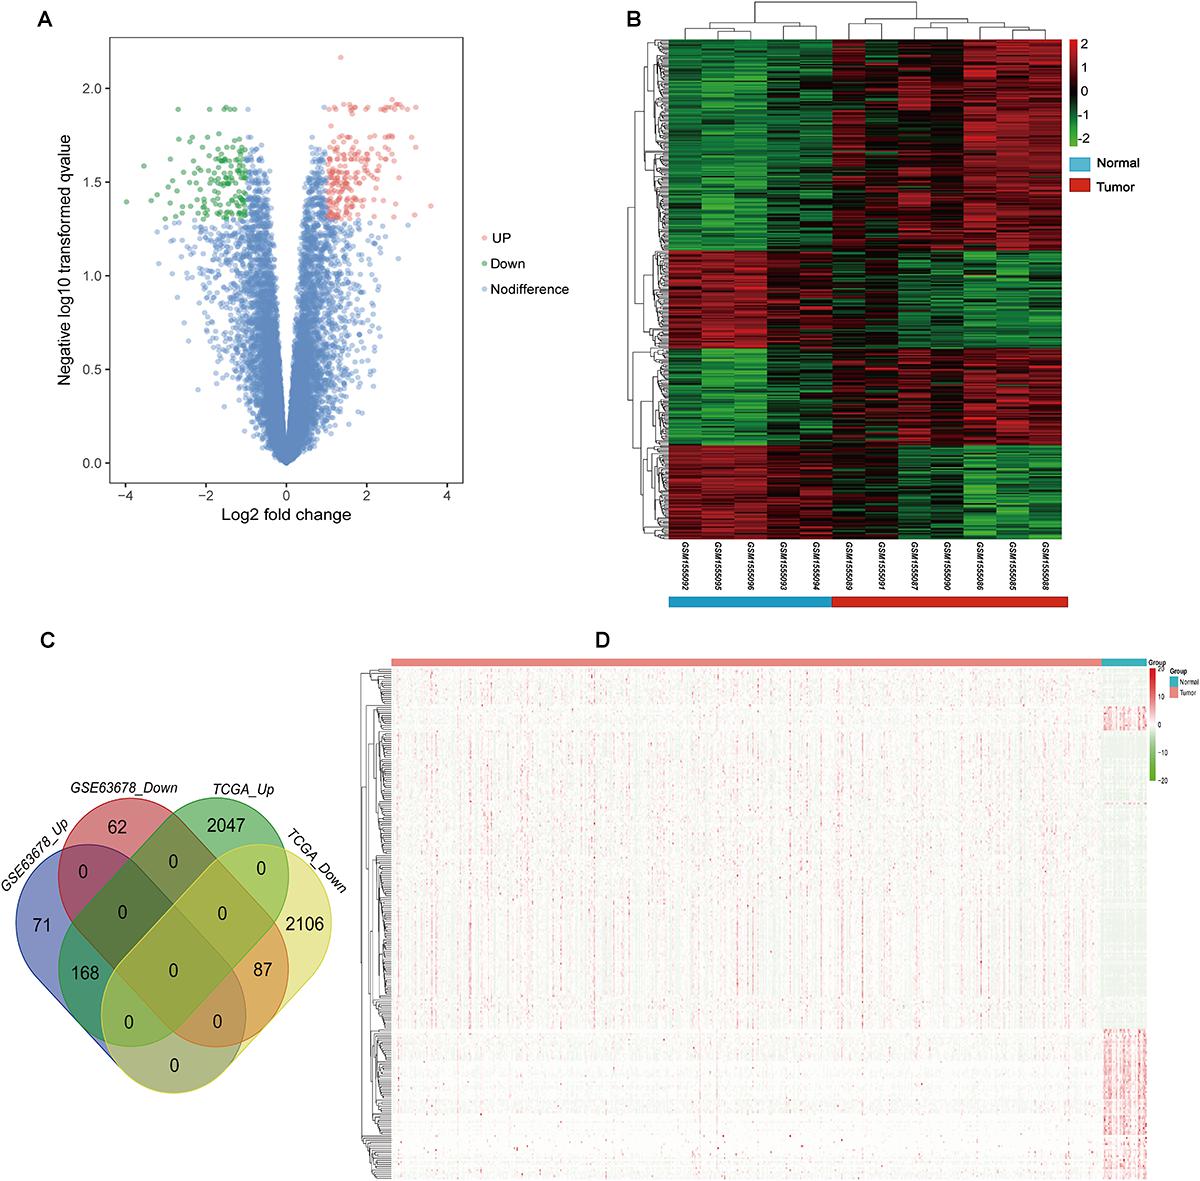
Figure 1. Identification of the DEGs. (A) Volcano plot of GSE63678. Red nodes represent DEGs with logFC >1 and p-value of <0.05. Green nodes represent DEGs with logFC <–1 and p-value of <0.05. (B) A heat map of all DEGs of GSE63678. Each column represents a sample and each row represents one gene. The gradual color ranging from green to red represents the gene expression changing from downregulation to upregulation. (C) Venn diagrams of common DEGs of GSE63678 and TCGA endometrial cancer (EC) dataset. 71 and 2,047 represent the upregulated DEGs of GSE63678 and TCGA EC dataset, respectively, while 62 and 2,106 represent the downregulated DEGs of GSE63678 and TCGA EC dataset, respectively. 168 represent common upregulated DEGs of GSE63678 and TCGA EC dataset, while 87 represent common downregulated DEGs of GSE63678 and TCGA EC dataset. (D) A heat map of the common DEGs in TCGA EC dataset. DEGs, differentially expressed genes; EC, endometrial cancer; TCGA, The Cancer Genome Atlas.
Functional and Pathway Enrichment Analysis of the Common DEGs
Gene ontology and KEGG enrichment analysis were used to explore the biological functions of the DEGs. The upregulated DEGs were mainly associated with cell proliferation, apoptotic process, cell adhesion, and cell cycle, while the downregulated DEGs were mainly enriched in DNA transcription, transcription factor in addition to cell proliferation and apoptosis (Figure 2A and Supplementary Table S4). In the pathway enrichment analysis, metabolic pathways, p53 signaling pathway, and cell cycle were identified for the upregulated DEGs, while the downregulated DEGs were associated with pathways such as PI3K-Akt signaling pathway, MAPK signaling pathway, and signaling pathways regulating pluripotency of stem cells and proteoglycans in cancer (Figure 2B and Supplementary Table S5).
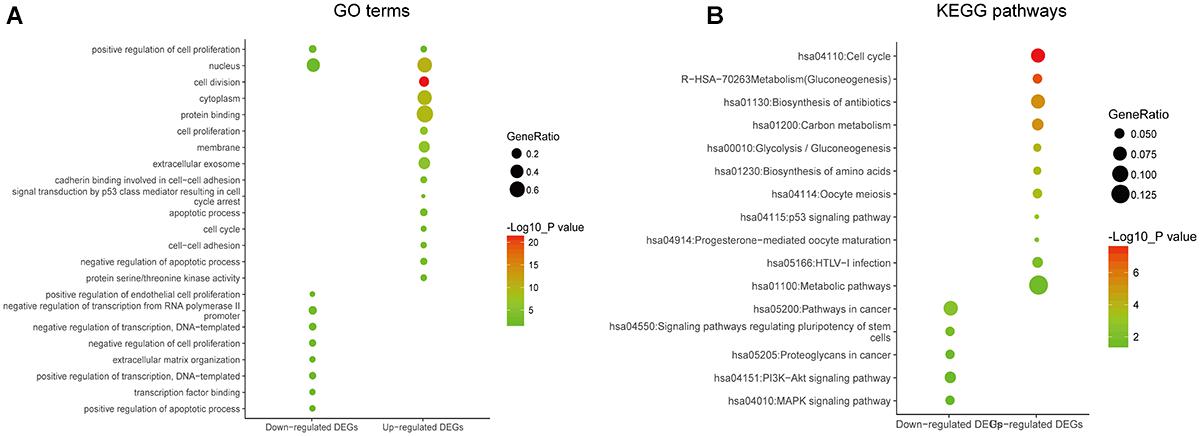
Figure 2. Gene ontology and pathway enrichment analyses of the common DEGs. (A) GO enrichment analysis of the common DEGs. The y-axis labels represent clustered GO terms. The GeneRatio represents the ratio of the number of genes enriched in one GO term to the number of upregulated or downregulated DEGs. (B) KEGG enrichment analysis of the common DEGs. The y-axis labels represent clustered KEGG pathways. The GeneRatio represents the ratio of the number of genes enriched in one KEGG pathway to the number of upregulated or downregulated DEGs. GO, gene ontology; DEGs, differentially expressed genes; KEGG, Kyoto Encyclopedia of Genes and Genomes.
Protein–Protein Interaction (PPI) Network and Modular Analysis
In order to reveal the potential relationship between DEGs encoding proteins, a PPI network was constructed based on the SRTING database. A total of 194 proteins obtained from the DEGs and 2,581 edges were included in the PPI network including 46 downregulated genes and 148 upregulated genes (Figure 3A). In the network, nodes with top 10 highest degrees were TOP2A, CDK1, CCNB1, CCNB2, AURKA, PCNA, CCNA2, BIRC5, NDC80, CDC20, and BUB1BA, which were considered as hub genes. According to Cytoscape MCODE soft, two modules were identified in the PPI network. Module 1 contained of 62 nodes and 1,810 edges and module 2 contained 10 nodes and 33 edges (Figures 3B,C). Expression distribution of the 11 hub genes are shown in Figure 4. To our surprise, all 11 hub genes were members of module 1 suggesting that module 1 plays a crucial role in the PPI network. GO terms enrichment analysis suggested that module 1 was mainly involved in diverse cellular activities such as cell division, cell proliferation, apoptotic process, and the cell cycle, while module 2 mainly participates in diverse metabolic processes such as gluconeogenesis, carbohydrate metabolic process, and extracellular exosomes (Figure 5A and Supplementary Table S6). In terms of KEGG enrichment analysis, module 1 was closely related to cell cycle, immune system, p53 signaling pathway and viral carcinogenesis pathways. Module 2 regulated various metabolic pathways such as carbon metabolism and gluconeogenesis (Figure 5B and Supplementary Table S7).
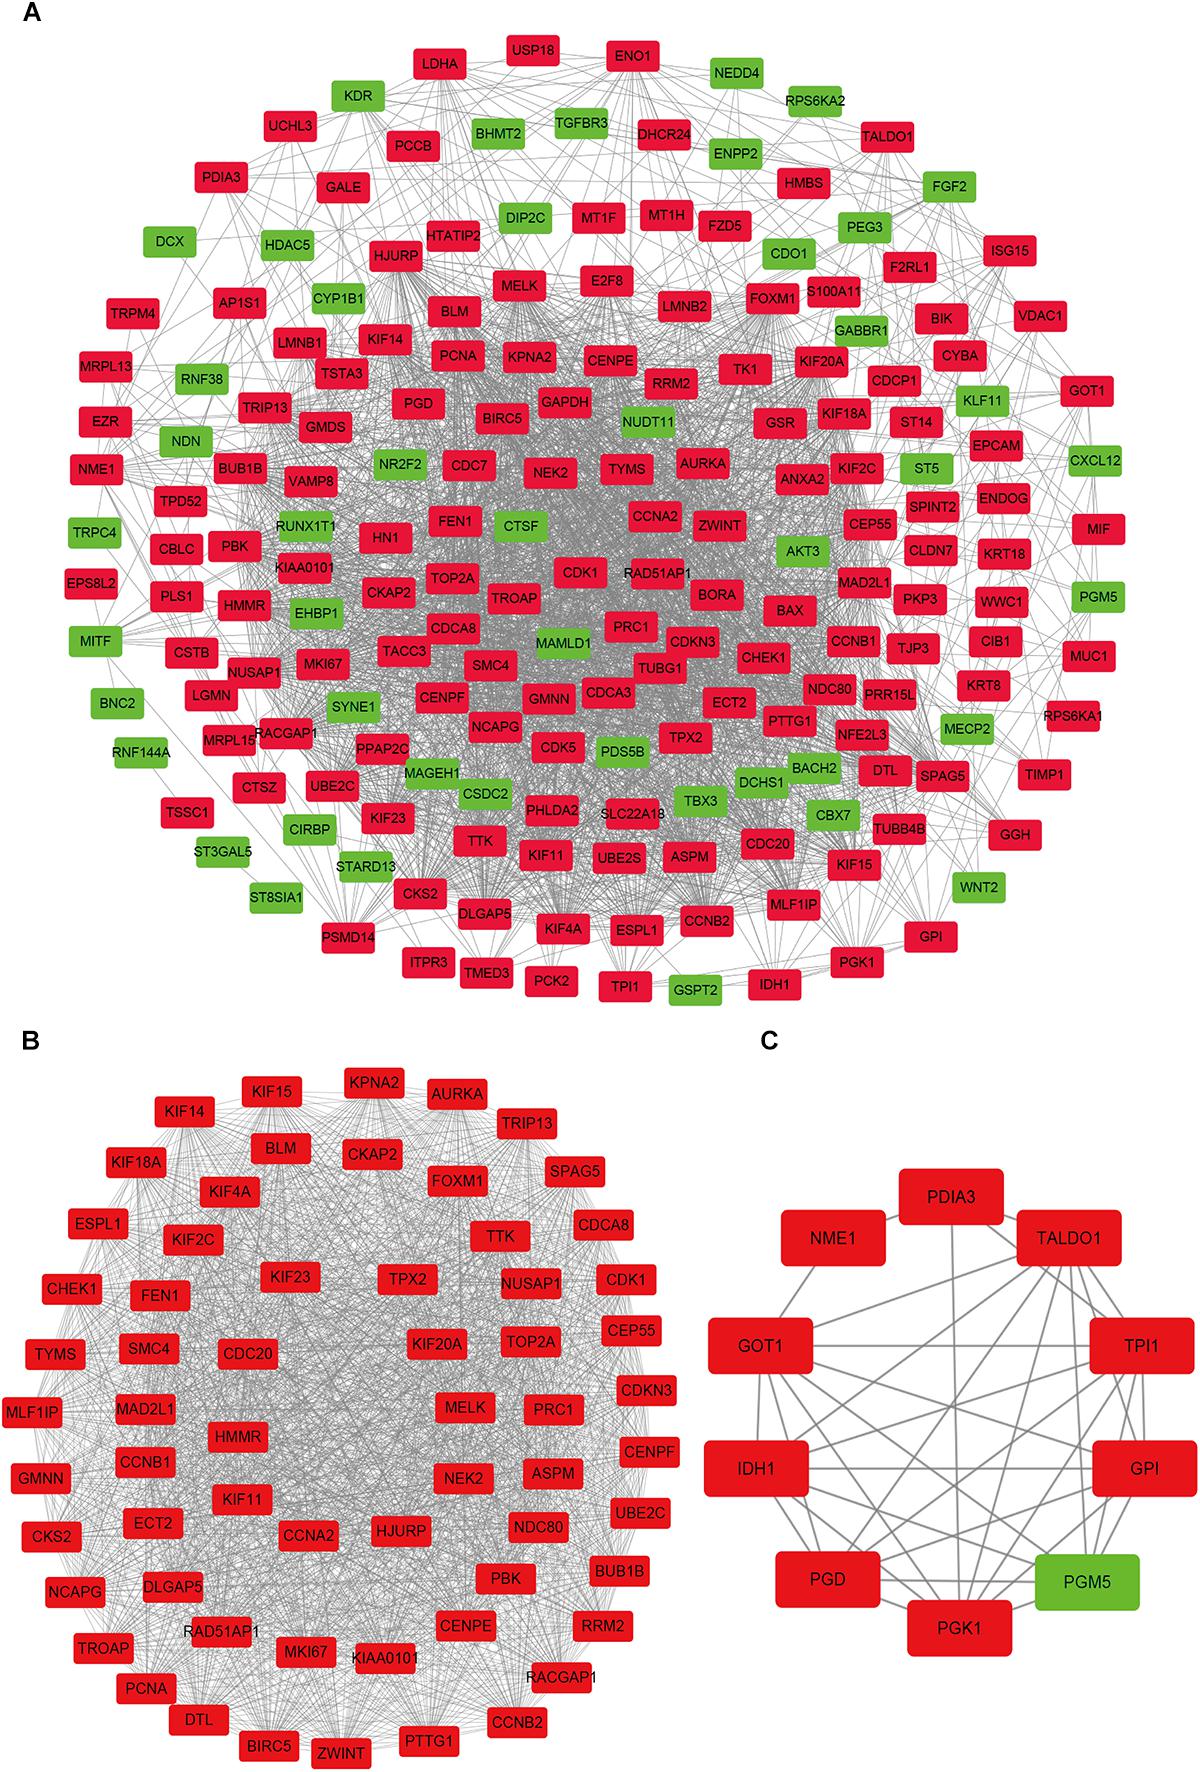
Figure 3. Protein–protein interaction network of common DEGs and module analysis. (A) PPI network of proteins encoded by the DEGs, including 194 nodes and 2,581 edges. The yellow circle represents module 2 and the purple circle represents module 1. (B) Module 1 consisted of 62 nodes and 1,810 edges. (C) Module 2 consisted of 10 nodes and 33 edges. Red nodes and green nodes represent upregulated and downregulated DEGs, respectively. PPI, protein–protein interaction; DEGs, differentially expressed genes.
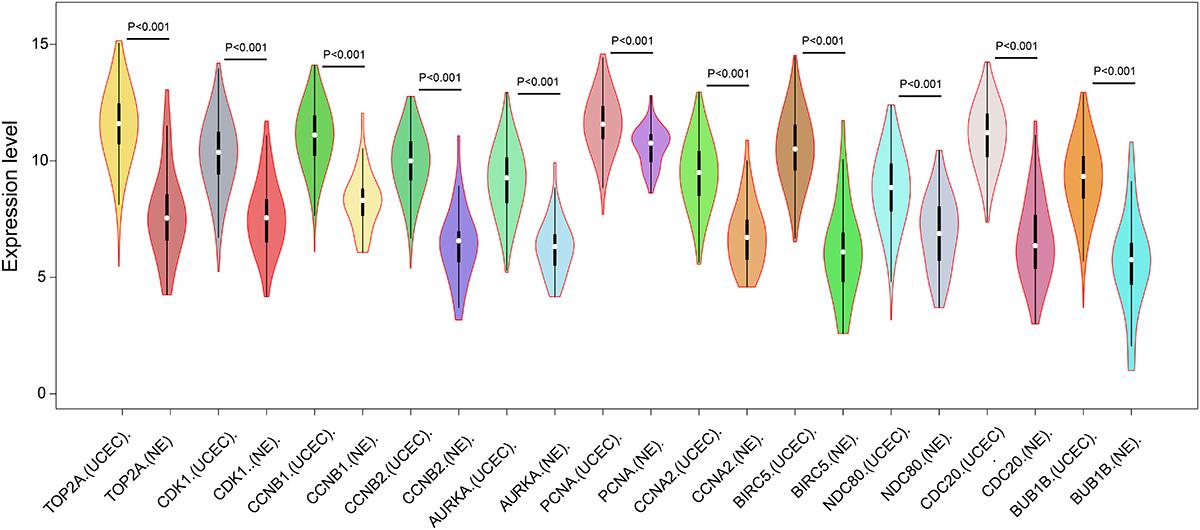
Figure 4. Expression of eleven hub genes in the PPI network in TCGA endometrial cancer dataset between the UCEC group and NE group. The expression value was log2(X+1) transformed. Completely randomized two-sample T-test was used to calculate the p-value. The white dot in each x-axis category represents the median. The dark bar on each x-axis category shows the interquartile range. The longer gray bar in each x-axis category represents the 95% confidence interval. TCGA, The Cancer Genome Atlas; PPI, protein–protein interaction; UCEC, uterine corpus endometrial carcinoma; NE, normal endometrium.
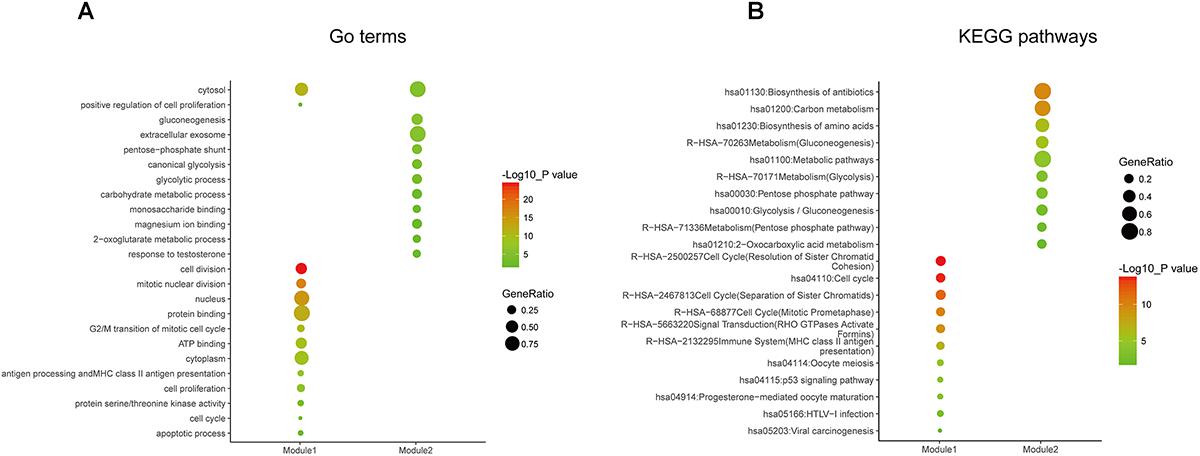
Figure 5. Gene ontology and pathway enrichment analyses of the modules in the PPI network. (A) GO enrichment analysis of module 1. The y-axis labels represent clustered GO terms. The GeneRatio represents the ratio of the number of genes enriched in one GO term to the number of genes in module 1. (B) KEGG pathway enrichment analysis of module 2. The y-axis labels represent clustered KEGG pathways. The GeneRatio represents the ratio of the number of genes enriched in one KEGG pathway to the number of genes in module 2. GO, gene ontology; KEGG, Kyoto Encyclopedia of Genes and Genomes; PPI, protein–protein interaction.
Survival Analysis
A univariate Cox regression analysis found that 117 DEGs were associated with patient overall survival (p < 0.05) A multivariate Cox proportional hazards regression model constructed the seven DEGs as a prognostic signature for overall survival (p < 0.05). These included PHLDA2, KIAA1644, GGH, ESPL1, TRPM4, LMNB1, and FAM184A. Among these genes, PHLDA2, GGH, ESPL1, and FAM184A with a hazard ratio of >1 were regarded as risky prognostic genes, while KIAA1644, ESPL1, TRPM4 with a hazard ratio of <1 were considered as protective prognostic genes (Table 1). According to the risk score model, 276 patients were assigned to the high-risk group and the remaining 275 patients were assigned to the low-risk group. Figures 6A–C presents the risk score state of the TCGA EC dataset. Survival analysis showed that the low-risk group had a better overall survival than the high-risk group (p < 0.05) (Figure 6D). The overall survival at 1, 3, and 5 years for low-risk group was 99.6% (95% CI: 1–0.99), 95.6% (95% CI: 0.97–0.90), and 94.2% (95% CI: 0.95–0.86), respectively. Comparatively, overall survival at 1, 3, and 5 years for high-risk group was 92.4% (95% CI: 0.95–0.89), 78.3% (95% CI: 0.78–0.65), and 75.4% (95% CI: 0.71–0.55), respectively. A time-dependent ROC analysis based on the risk score model showed good performance in survival prediction and the area under the ROC curve was 0.797, 0.734, 0.729, and 0.647 for 1, 3, 5, and 10 years, respectively (Figure 6E). Joint effects analysis of the seven-gene signature and EC grade, EC histologic, EC stage also showed a high predictive value for EC patient overall survival (p < 0.001) (Figure 7 and Table 2). The overall survival at 1, 3, and 5 years for different EC subgroups based on the seven-gene signature risk stratification model also showed good predictive value (Table 3). The expression value of the seven genes in EC tissue and normal endometrial tissue is shown in Figure 8A, while the expression distribution of these genes in low-risk group and high-risk group is shown in Figure 8B.
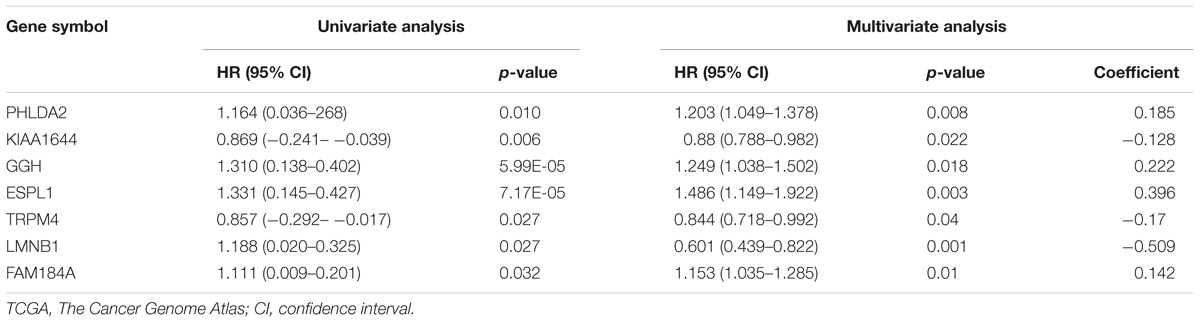
Table 1. Prognostic value of the seven genes in endometrial cancer patients of the TCGA cohort.
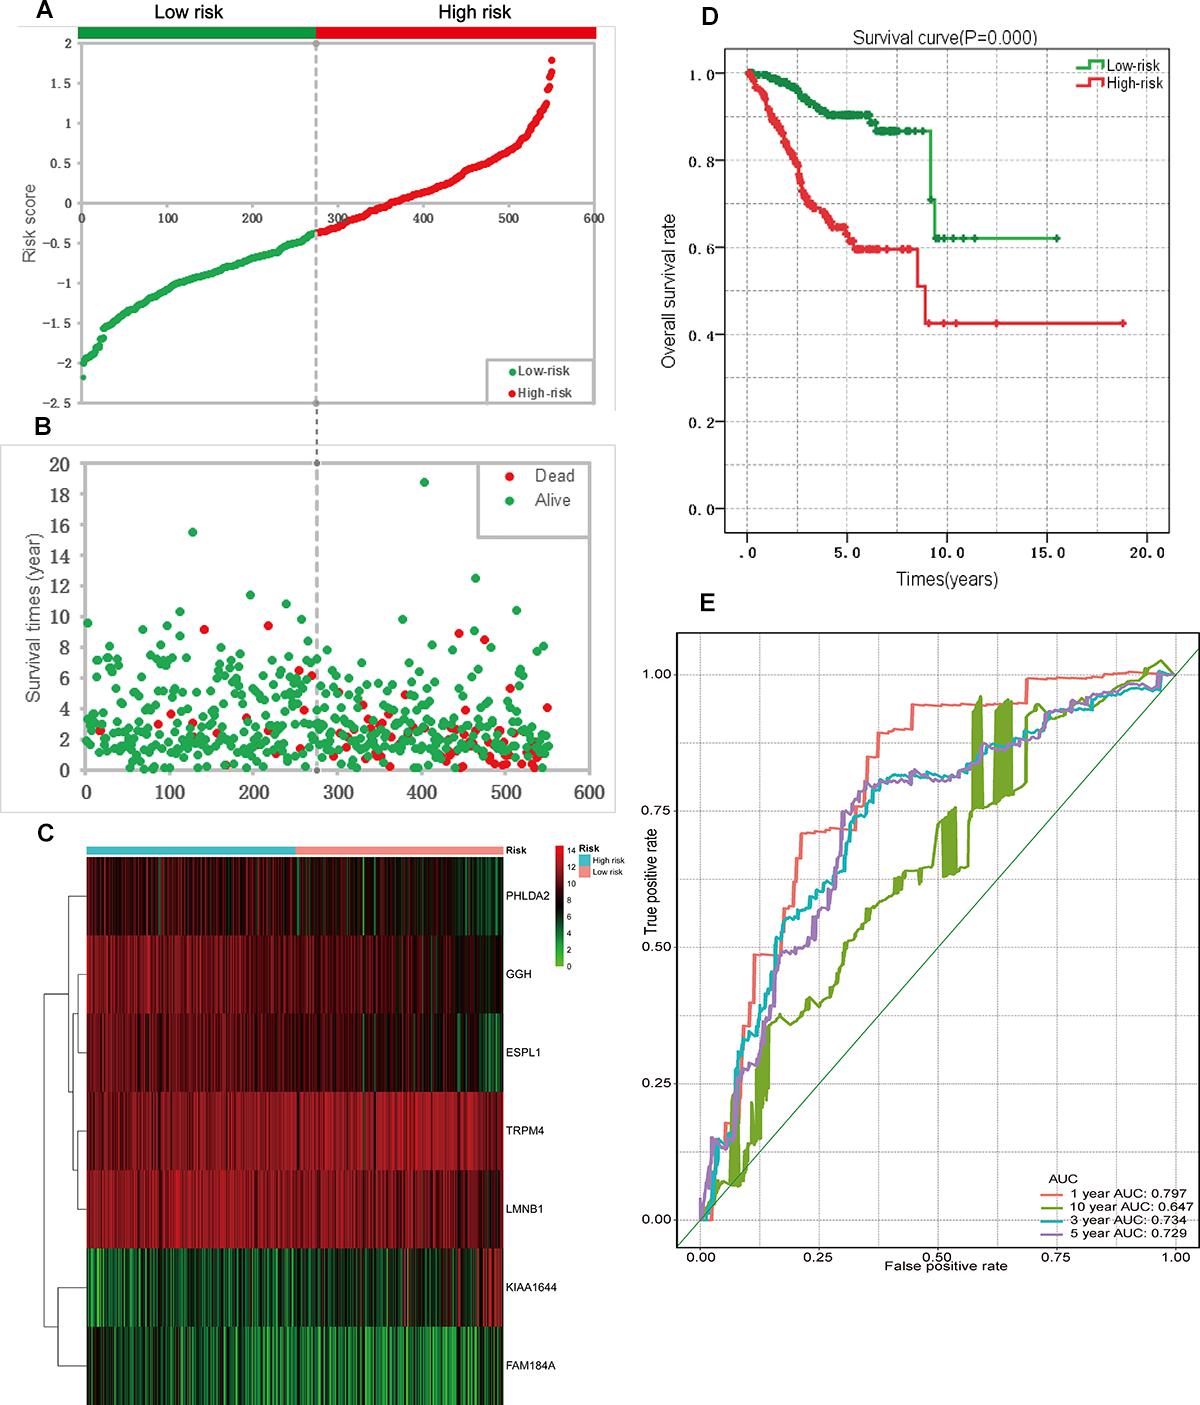
Figure 6. Prognostic analysis based on the seven genes risk score model on TCGA endometrial cancer dataset. (A) Patient risk score distribution based on the risk score model. (B) Patient survival status distribution of the low-risk group and the high-risk group. (C) Heat map of the seven genes that were used to construct the risk score model of the low- and high-risk groups. (D) Survival curves for the low- and high-risk groups. (E) ROC analysis predicted overall survival using the risk score. TCGA, The Cancer Genome Atlas; ROC, receiver operating characteristic curve.
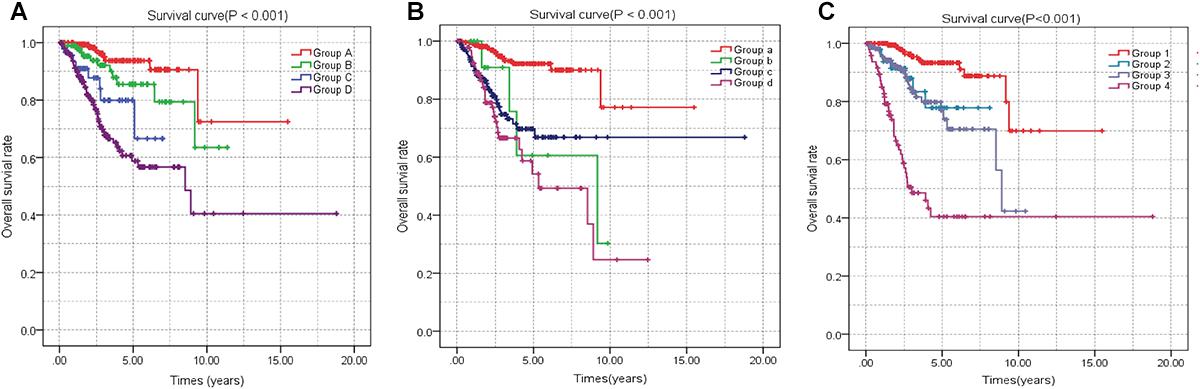
Figure 7. Joint effects analysis of OS stratified by risk score and EC clinical parameters. Joint effects analysis was stratified using the risk score and the following clinical parameters: tumor grade (A), histologic type (B), tumor stage (C). OS, overall survival; EC, endometrial cancer.
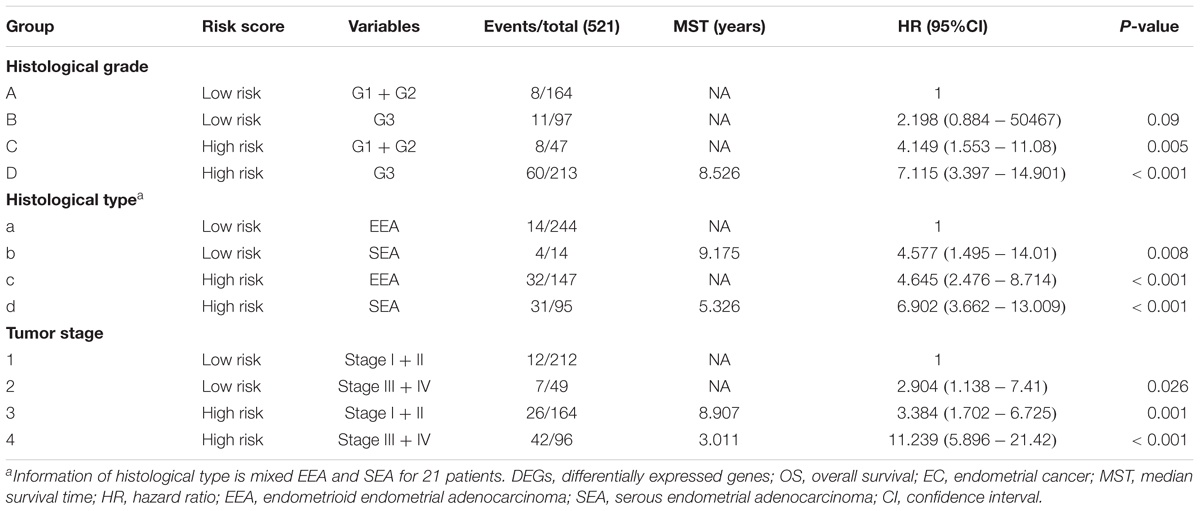
Table 2. Joint effects survival analysis of clinical factors and the DEG signature risk score with OS in EC patients.
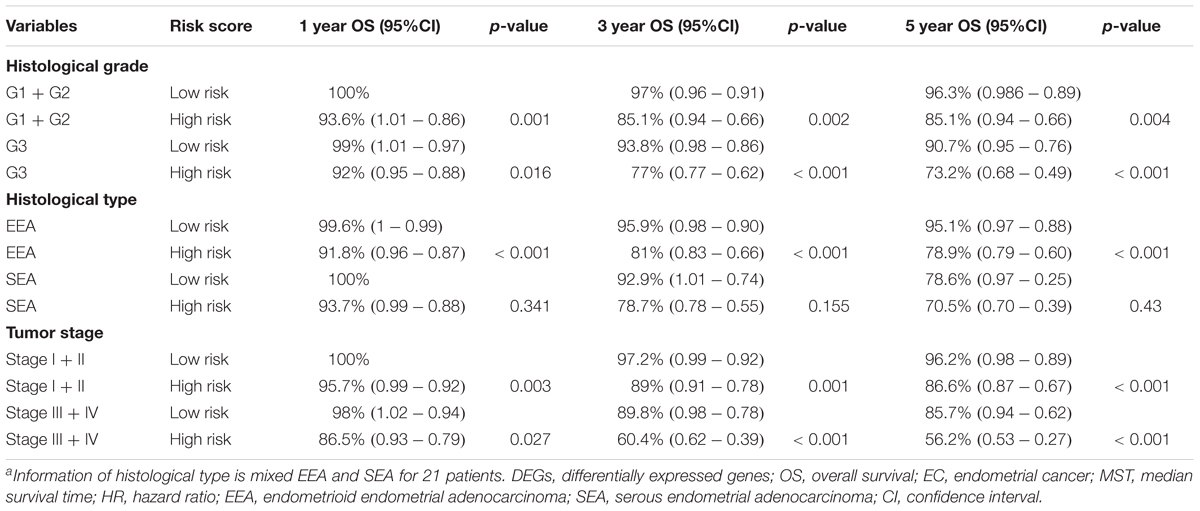
Table 3. 1, 3, and 5-year OS analysis of EC patients based on clinical factors and the DEG signature risk score.
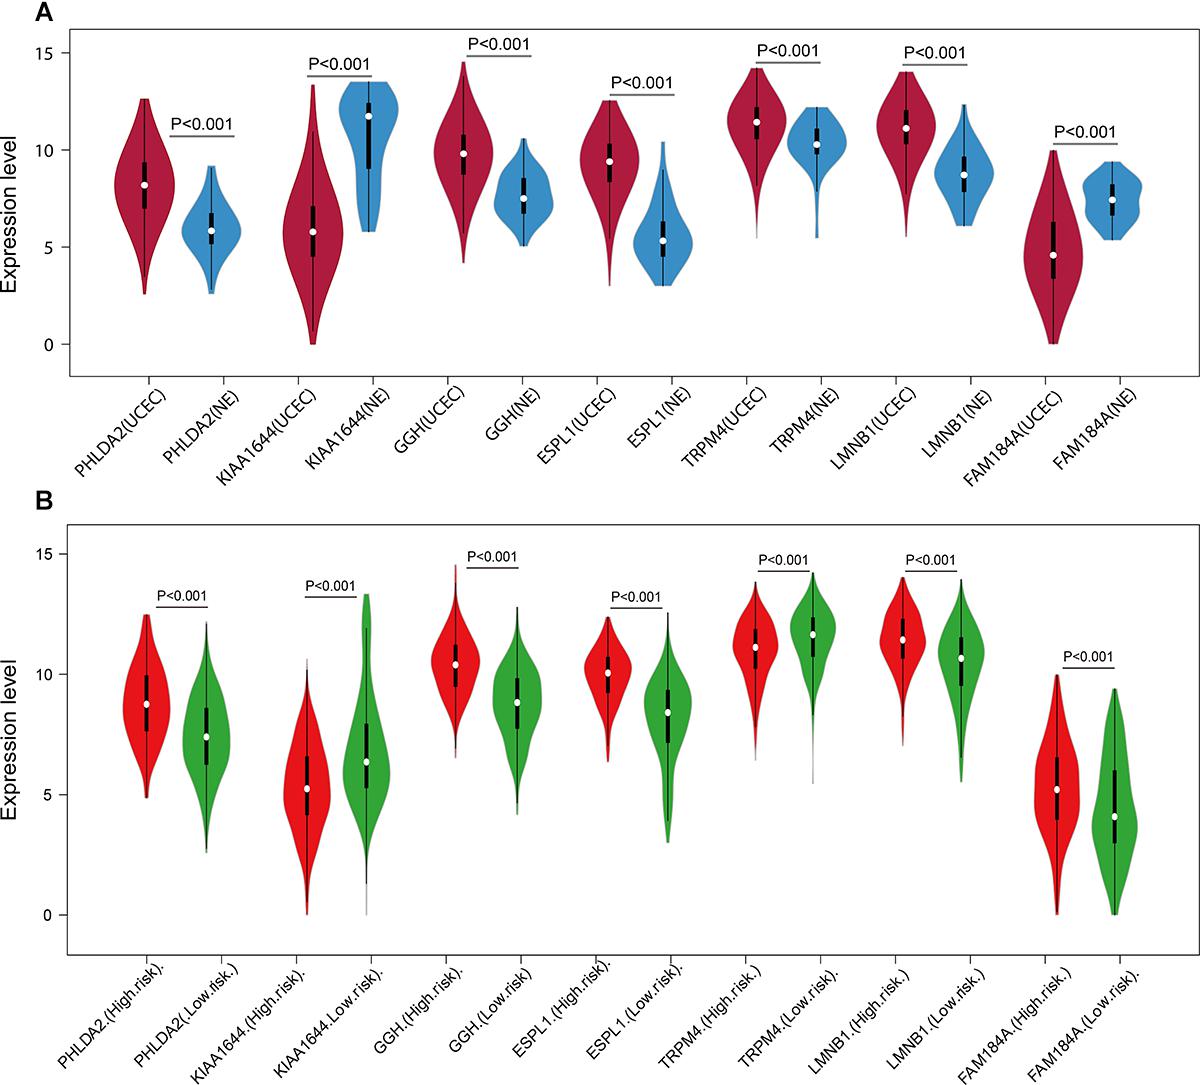
Figure 8. Expression of the seven genes in TCGA endometrial cancer dataset. The expression value was log2(X+1) transformed. (A) Expression of the seven genes between the UCEC group and NE group in TCGA endometrial cancer dataset. (B) Expression of the seven genes of the low- and high-risk groups in TCGA endometrial cancer dataset. The white dot on each x-axis category represents the median. The dark bar in each x-axis category shows the interquartile range. The longer gray bar in each x-axis category represent the 95% confidence interval. TCGA, The Cancer Genome Atlas; UCEC, uterine corpus endometrial carcinoma; NE, normal endometrium.
Discussion
In this study, we identified DEGs between EC tissue and normal endometrium based on a GEO expression profile and TCGA high-throughput sequencing, and revealed the hub genes found among the protein-encoding DEGs. We looked for potential biomarkers related to EC prognosis from among the DEGs using univariate and multivariate Cox regression analyses and constructed a prognostic signature based on DEG expression. We found 255 common DEGs and 11 hub genes including TOP2A, CDK1, CCNB1, CCNB2, AURKA, PCNA, CCNA2, BIRC5, NDC80, CDC20, and BUB1BA. We developed a seven-gene signature for prognosis prediction of EC patients, which included the genes PHLDA2, KIAA1644, GGH, ESPL1, TRPM4, LMNB1, and FAM184A. The seven-gene signature displayed good predictive value for OS of EC patients and its subgroups. In summary, these results provide clues for further exploring the pathogenesis of EC and to establish a new risk classification and prognosis assessment model.
Similar to our research, Wu et al. (2019) reported of four important miRNAs that formed a four-miRNA signature that can divide EC patients into a high risk and a low-risk group, with significantly different overall survival according to TCGA EC dataset. A nine-lncRNA signature was also established, which had a good performance in overall survival prediction of endometrioid EC patients based on TCGA dataset (Xu et al., 2018). RNA Sequencing analysis revealed the coexistence of mutations in a three-gene signature that can be viewed as a biomarker for diagnosis of endometrioid EC, while the absence of three-gene signature mutations when TP53 was mutated was found to be diagnostic of serous carcinomas (Cuevas et al., 2019). In our study, a seven-gene signature was developed based on GEO and TCGA EC datasets, which can distinguish between high risk and low risk patients and functions well in predicting the overall survival of EC and its subgroups. In addition, our study showed that metabolic pathways, p53 signaling pathway, and cell cycle were the signaling pathways that were mainly enriched for the upregulated DEGs, while the downregulated DEGs were associated with pathways such as the PI3K-Akt signaling pathway and the MAPK signaling pathway. These results were confirmed by the similar results obtained by Zhang et al. (2016) and Liu et al. (2019).
In the current study, we also found eleven hub genes in the PPI network, indicating that they possibly play an important role in the pathogenesis of EC. Similar to our findings, TOP2A positive EC patients have been found to have shorter overall survival and disease-free survival compared to TOP2A negative EC patients (Lapinska-Szumczyk et al., 2014; Ito et al., 2016). TOP2A heterogeneity was also related to EC stage and metastases. Stage III and IV EC patients and EC patients with EC metastases showed higher TOP2A heterogeneity (Supernat et al., 2014). These results suggest that higher TOP2A levels lead to EC progression and represent a higher degree of malignancy in EC. In other studies, TOP2A was upregulated in cancer tissues when compared with that of adjacent non-cancerous tissues in breast cancer (Wang et al., 2012), renal cell carcinoma (Ye et al., 2018), ovarian cancer (Erriquez et al., 2015), prostate cancer (De Resende et al., 2013), nasopharyngeal carcinoma (Lan et al., 2014), and colon cancer (Zhang et al., 2018). Furthermore, TOP2A overexpression is a positive tumor metastasis marker and a poor biomarker for prognosis. In addition, TOP2A downregulation was found to inhibit the proliferation and migration or invasion of pancreatic and colon cancer cell lines and involved the β-catenin signaling pathway in pancreatic cancer (Pei et al., 2018; Zhang et al., 2018). CCNB1, CCNB2, and CCNA2 are three members of the cyclin family and CDK1, a member of serine-threonine kinases, is a master regulator of cell cycle progression. Furthermore, cell cycle was also enriched significantly in our study for both biological processes and pathways, which indicates cell cycle changes significantly in EC. Consistent with our research, CDK1 and CCNA2 were also found to be overexpressed in EC tissues and cells and were also identified as hub genes in the PPI network (Zhang et al., 2016; Li et al., 2017). At present, there are few studies regarding the role of CCNB1, CCNB2, and CCNA2 in EC. Wang J. et al., 2018 found that CCNA2 expression was high and was positively correlated with histological grades, where a higher expression of CCNA2 was associated with worse differentiation in endometrial adenocarcinoma. CDK1 is a target gene of miR-1271, human paired box 2 and LncRNA ABHD11-AS1 and regulates endometrial carcinoma cell line proliferation, invasion, migration, apoptosis, and other mobility factors (Li et al., 2017; Liu Y. et al., 2018; Wang J. et al., 2018). In vulvar squamous cell carcinoma, elevated levels of CDK1 were found in patients with advanced tumor behaviors and aggressive features (Wang Z. et al., 2015). In addition, a high expression of CDK1 in lung adenocarcinoma patients, epithelial ovarian cancer patients, and colorectal cancer patients was identified as a diagnostic biomarker for poor survival (Sung et al., 2014; Xi et al., 2015; Liu W.T. et al., 2018). AURKA is a human Aurora kinase and is reported to be involved in cell cycle regulation. In a study, AURKA was upregulated in higher tumor grades and was found to be associated with poor histological differentiation in EC (Glover et al., 1995). Furthermore, knockout of AURKA inhibited EC cell line invasion and migration, and improved chemosensitivity to paclitaxel, suggesting that it is a potential therapeutic target in EC (Umene et al., 2015). PCNA is a co-factor of DNA polymerase and is essential for DNA replication. It is also considered to play an important role in the G1 phase to the S phase of the cell cycle (Bolton et al., 1992). PCNA expression was reported to be higher in postmenopausal endometrial carcinoma in comparison to normal postmenopausal endometrium tissue. Furthermore, the expression level of PCNA was found to be related to clinicopathological features and prognosis of EC patients (Hareyama, 1994). Additionally, many studies have demonstrated that it is a poor survival biomarker in osteosarcoma, gastric, and colorectal cancer (Wang et al., 2017; Yin et al., 2017; Zhou et al., 2018). BIRC5 which encodes for survivin protein, is a member of inhibitor of apoptosis gene family and regulates apoptosis, while cell cycle studies suggest that BIRC5 is overexpressed both in EC and in EC cell lines (Pallares et al., 2005; Nabilsi et al., 2009). Furthermore, BIRC5 expression was found to gradually increase from the proliferative endometrium to endometrial hyperplasia to endometrioid adenocarcinoma indicating that it contributes to EC development (Erkanli et al., 2006). In recent years, it was also reported that the high expression of BIRC5 can be used as a biomarker of poor progression free survival (Chuwa et al., 2016). NDC80 is a subunit of the Ndc80 complex and plays an important role in mitotic progression suggesting that NDC80 may be associated with EC through regulation of the cell cycle (Amin et al., 2018). Chen et al. (2011) found that NDC80 was highly expressed in serous adenocarcinomas in comparison with endometrioid adenocarcinomas. However, the expression of NDC80 increased in many cancers such as colon gastric, pancreatic cancer, and osteosarcoma and was associated with poor prognosis. Furthermore, knockdown of NDC80 was found to inhibit cancer cell proliferation and induced apoptosis (Qu et al., 2014; Meng et al., 2015; Xing et al., 2016; Xu et al., 2017). CDC20 is a cell cycle regulating protein. A large number of studies have confirmed that CDC20 is upregulated in solid tumors and promotes cell growth and invasion leading to poor prognosis (Ding et al., 2017; Wang S. et al., 2018). Meanwhile, higher expression of CDC20 was found to be related to a high tumor grade and stage in common malignant tumors including EC (Gayyed et al., 2016). BUB1BA has not been reported in previous studies, and its function remains to be elucidated. All this evidence demonstrates that almost all of the hub genes identified in this study are closely related to tumor development and progression, based on mainly cell cycle regulation. The specific mechanisms by which they regulate EC need to be further investigated.
In addition, we identified 7 pivotal genes involved in EC prognosis and constructed a prognostic gene signature comprising of these genes. Among these, PHLDA2, GGH, ESPL1, and FAM184A are viewed as risky prognostic genes. PHLDA2 is an imprinted gene located on human chromosome 11p15.5. Previous studies have suggested that is a growth suppressor gene and that overexpression of this gene in the placenta leads to growth restricted pregnancies both in humans and in animal models (Jensen et al., 2014). Furthermore, ectopic expression of PHLDA2 results in pregnancy complications possibly by promoting apoptosis and suppressing trophoblast growth (Jin et al., 2016). In cancer, the role of PHLDA2 is controversial. Many studies have shown that PHLDA2 expression is decreased in osteosarcoma tissue and cell lines when compared with controls and that high levels of PHLDA2 is a predictor of good prognosis (Dai et al., 2012; Wang et al., 2016). Additionally, upregulation of PHLDA2 induces osteosarcoma cell apoptosis, inhibited cell growth and tumorigenesis in vitro and in vivo (Huang et al., 2012; Li et al., 2014). However, PHLDA2 was also found to play oncogenic roles in lung adenocarcinoma (Hsu et al., 2017). In addition, high expression of PHLDA2 has also been observed in triple-negative breast cancer cell lines and pancreatic ductal adenocarcinoma, and represents poor prognosis (Moon et al., 2015). Silencing PHLDA2 reduces cancer cell aggressiveness and proliferation (Idichi et al., 2018). In our study, PHLDA2 expression was upregulated and associated with poor prognosis. These results suggest that the role of PHLDA2 in cancer is complex and further studies are needed to dissect the mechanism of PHLDA2 in EC. GGH is an enzyme involved in folate metabolism. Previous studies have confirmed that GGH is highly expressed in invasive breast cancer and ERG-negative prostate cancer in comparison with adjacent non-cancerous tissues and high GGH levels are related to poor prognosis and unfavorable clinical outcomes (Shubbar et al., 2013; Melling et al., 2017). In oral squamous cell carcinoma, GGH is a member of an 11 gene molecular signature with a worse overall survival maker for patients without nodal metastases (Wang W. et al., 2015). Additionally, it has been identified as a therapeutic target of chemotherapy in multiple cancer types. Lower expression of GGH enhances sensitivity of cancer cells to pemetrexed, 5-fluorouracil, methotrexate, and gemcitabine in colon cancer, advanced pancreatic cancer, and non-small cell lung cancer (Iacopetta et al., 2008; Nakamura et al., 2011; Yoshida et al., 2016). Our results imply that GGH is highly expressed in EC and is a marker of poor prognosis. However, the underlying molecular mechanisms of GGH in EC remain unclear. ESPL1 encoding protein is a protease that cleaves chromosomal cohesin during mitosis. ESPL1 expression has been found to be upregulated in a wide range of cancers (Finetti et al., 2014; Wen et al., 2018) and high expression of ESPL1 is associated with a loss of key tumor suppressor gene P53, which further contributes to the progression of mammary adenocarcinomas (Mukherjee et al., 2014). Nevertheless, it has also been reported that ESPL1 plays an opposite role in gastric adenocarcinoma. Wang D. et al. (2018) showed that ESPL1 levels were lower in gastric adenocarcinoma tissue in comparison with that of adjacent non-cancer tissue and was associated with longer overall survival and a low tumor stage suggesting the dual role of this gene in cancer. ESPL1 expression was found to be increased in our study, however, the clinical significance and functional mechanism of ESPL1 in EC remains to be verified. FAM184A was also found to be increased in the current study and was classified as a risky prognostic gene, but its role in EC has not been reported in previous studies.
Additionally, the three protective prognostic genes identified in this study were TRPM4, LMNB1, and KIAA1644. TRPM4 is a Ca2+-activated non-selective cation channel that influences calcium homeostasis. However, it is highly expressed in some cancers and is considered as a risk factor as well as a poor survival factor in prostate cancer and diffuse large B-cell lymphoma (Schinke et al., 2014; Loo et al., 2017). Meanwhile, overexpression of TRPM4 promotes cell proliferation by enhancing the β-catenin signaling pathway and epithelial to mesenchymal transition, migration, and invasion in prostate cancer cell lines (Armisen et al., 2011; Sagredo et al., 2019). In contrast, low expression of TRPM4 was found in colorectal cancer indicating that it may also serve as a protective factor (Sozucan et al., 2015). LMNB1 is an important member of the lamin protein family but its role in cancer is controversial. Its expression is decreased in colon cancer and gastric cancer (Moss et al., 1999), but is increased in prostate cancer, hepatocellular carcinoma, and pancreatic cancer (Sun et al., 2010; Li et al., 2013). Overexpression of LMNB1 indicates lower survival rates both in pancreatic cancer and colon cancer (Li et al., 2013; Izdebska et al., 2018), while upregulation of LMNB1 represents good clinical outcome in breast cancer (Wazir et al., 2013). Furthermore, Fridley et al. (2014) reported that silencing of LMNB1 in cancer cells increases its resistance to cisplatin, suggesting that LMNB1 is beneficial for cancer treatment. Based on the complex role of LMNB1, additional studies are needed to confirm its role in EC. In terms of KIAA1644, little is known about its role and prognostic value in cancer research.
Our study has several limitations. Firstly, our findings are based entirely on public databases using bioinformatics analysis and therefore functional experiments are needed to verify these results. Secondly, the prognostic predictive value of the seven-gene signature is only based on a single cohort with a relatively small sample size and future studies involving larger independent cohorts should be conducted to validate our findings. Additionally, we did not consider common clinical parameters as we only focused on the commonly occurring DEGs, which may have resulted in vital information being ignored.
Conclusion
In summary, our study identified 255 common DEGs between EC and normal endometrium and identified 11 hub genes and constructed a seven-gene signature that can be used as a good stratified analysis and prognostic prediction biomarker for survival at 1, 3, 5, and 10 years for EC patients. Therefore, our results revealed novel potential molecular therapeutic targets and a new method for EC patient risk stratification assessment and prognostic prediction. Further experimental studies and independent cohort studies are needed to validate these findings.
Ethics Statement
Data in this study was obtained from GEO and TCGA public database and the acquisition and application method complied with corresponding database guidelines and policies.
Author Contributions
HH and LL conceived and instructed the work. LL and JL checked the associated database and analyzed the raw data. LL wrote and revised the manuscript. All authors read and approved the final manuscript.
Funding
This work was supported in part by clinical study on early diagnosis and treatment of cervical precancerous lesions and cervical cancer of Liuzhou Science and Technology Bureau (No. 2015J030508).
Conflict of Interest Statement
The authors declare that the research was conducted in the absence of any commercial or financial relationships that could be construed as a potential conflict of interest.
Supplementary Material
The Supplementary Material for this article can be found online at: https://www.frontiersin.org/articles/10.3389/fgene.2019.00373/full#supplementary-material
TABLE S1 | List of differentially expressed genes in GSE63678.
TABLE S2 | List of differentially expressed genes between EC tissue and normal endometrial tissue in the TCGA dataset.
TABLE S3 | List of common differentially expressed genes both in GSE63678 and the TCGA EC dataset.
TABLE S4 | Gene ontology enrichment analysis of the common DEGs both in GSE63678 and the TCGA EC dataset.
TABLE S5 | Pathway enrichment analysis of the common DEGs both in GSE63678 and the TCGA EC dataset.
TABLE S6 | Gene ontology enrichment analysis of module1 and module2 in PPI network.
TABLE S7 | Pathway enrichment analysis of module1 and module2 in PPI network.
Footnotes
- ^https://www.ncbi.nlm.nih.gov/geo/
- ^https://portal.gdc.cancer.gov/
- ^https://david.ncifcrf.gov
- ^https://string-db.org
References
Amin, M. A., Mckenney, R. J., and Varma, D. (2018). Antagonism between the dynein and Ndc80 complexes at kinetochores controls the stability of kinetochore-microtubule attachments during mitosis. J. Biol. Chem. 293, 5755–5765. doi: 10.1074/jbc.RA117.001699
Armisen, R., Marcelain, K., Simon, F., Tapia, J. C., Toro, J., Quest, A. F., et al. (2011). TRPM4 enhances cell proliferation through up-regulation of the beta-catenin signaling pathway. J. Cell Physiol. 226, 103–109. doi: 10.1002/jcp.22310
Bokhman, J. V. (1983). Two pathogenetic types of endometrial carcinoma. Gynecol. Oncol. 15, 10–17. doi: 10.1016/0090-8258(83)90111-7
Bolton, W. E., Mikulka, W. R., Healy, C. G., Schmittling, R. J., and Kenyon, N. S. (1992). Expression of proliferation associated antigens in the cell cycle of synchronized mammalian cells. Cytometry 13, 117–126. doi: 10.1002/cyto.990130203
Chen, W., Sun, K., Zheng, R., Zeng, H., Zhang, S., Xia, C., et al. (2014). Cancer incidence and mortality in China. Chin. J. Cancer Res. 2018, 1–12. doi: 10.18632/oncotarget.16638
Chen, W., Zheng, R., Zhang, S., Zeng, H., Xia, C., Zuo, T., et al. (2017). Cancer incidence and mortality in China, 2013. Cancer Lett. 401, 63–71. doi: 10.1016/j.canlet.2017.04.024
Chen, Y., Yao, Y., Zhang, L., Li, X., Wang, Y., Zhao, L., et al. (2011). cDNA microarray analysis and immunohistochemistry reveal a distinct molecular phenotype in serous endometrial cancer compared to endometrioid endometrial cancer. Exp. Mol. Pathol. 91, 373–384. doi: 10.1016/j.yexmp.2011.04.005
Church, D. N., Briggs, S. E., Palles, C., Domingo, E., Kearsey, S. J., Grimes, J. M., et al. (2013). DNA polymerase epsilon and delta exonuclease domain mutations in endometrial cancer. Hum. Mol. Genet. 22, 2820–2828. doi: 10.1093/hmg/ddt131
Chuwa, A. H., Sone, K., Oda, K., Ikeda, Y., Fukuda, T., Wada-Hiraike, O., et al. (2016). Significance of survivin as a prognostic factor and a therapeutic target in endometrial cancer. Gynecol. Oncol. 141, 564–569. doi: 10.1016/j.ygyno.2016.04.003
Corrado, G., Laquintana, V., Loria, R., Carosi, M., De Salvo, L., Sperduti, I., et al. (2018). Endometrial cancer prognosis correlates with the expression of L1CAM and miR34a biomarkers. J. Exp. Clin. Cancer Res. 37:139. doi: 10.1186/s13046-018-0816-1
Creasman, W. T., Odicino, F., Maisonneuve, P., Quinn, M. A., Beller, U., Benedet, J. L., et al. (2006). Carcinoma of the corpus uteri. Int. J. Gynecol. Obstet. 95, S105–S143.
Cuevas, D., Valls, J., Gatius, S., Roman-Canal, B., Estaran, E., Dorca, E., et al. (2019). Targeted sequencing with a customized panel to assess histological typing in endometrial carcinoma. Virchows Arch. .
Dai, H., Huang, Y., Li, Y., Meng, G., Wang, Y., and Guo, Q. N. (2012). TSSC3 overexpression associates with growth inhibition, apoptosis induction and enhances chemotherapeutic effects in human osteosarcoma. Carcinogenesis 33, 30–40. doi: 10.1093/carcin/bgr232
De Resende, M. F., Vieira, S., Chinen, L. T., Chiappelli, F., da Fonseca, F. P., Guimarães, G. C., et al. (2013). Prognostication of prostate cancer based onTOP2A protein and gene assessment: TOP2A in prostate cancer. J. Transl. Med. 11:9. doi: 10.1186/1479-5876-11-36
Ding, Y., Yu, S., Bao, Z., Liu, Y., and Liang, T. (2017). CDC20 with malignant progression and poor prognosis of astrocytoma revealed by analysis on gene expression. J. Neurooncol. 133, 87–95. doi: 10.1007/s11060-017-2434-8
Erkanli, S., Kayaselcuk, F., Kuscu, E., Bagis, T., Bolat, F., Haberal, A., et al. (2006). Expression of survivin, PTEN and p27 in normal, hyperplastic, and carcinomatous endometrium. Int. J. Gynecol. Cancer 16, 1412–1418. doi: 10.1136/ijgc-00009577-200605000-00071
Erriquez, J., Becco, P., Olivero, M., Ponzone, R., Maggiorotto, F., Ferrero, A., et al. (2015). TOP2A gene copy gain predicts response of epithelial ovarian cancers to pegylated liposomal doxorubicin: TOP2A as marker of response to PLD in ovarian cancer. Gynecol. Oncol. 138, 627–633. doi: 10.1016/j.ygyno.2015.06.025
Ferlay, J., Colombet, M., Soerjomataram, I., Dyba, T., Randi, G., Bettio, M., et al. (2018a). Cancer incidence and mortality patterns in Europe: estimates for 40 countries and 25 major cancers in. Eur. J. Cancer 2018, 356–387. doi: 10.1016/j.ejca.2018.07.005
Ferlay, J., Colombet, M., Soerjomataram, I., Mathers, C., Parkin, D. M., Pineros, M., et al. (2018b). Estimating the global cancer incidence and mortality in: GLOBOCAN sources and methods. Int. J. Cancer 144, 1941–1953. doi: 10.1002/ijc.31937
Finetti, P., Guille, A., Adelaide, J., Birnbaum, D., Chaffanet, M., and Bertucci, F. (2014). ESPL1 is a candidate oncogene of luminal B breast cancers. Breast Cancer Res. Treat. 147, 51–59. doi: 10.1007/s10549-014-3070-z
Fridley, B. L., Abo, R., Tan, X. L., Jenkins, G. D., Batzler, A., Moyer, A. M., et al. (2014). Integrative gene set analysis: application to platinum pharmacogenomics. OMICS 18, 34–41. doi: 10.1089/omi.2013.0099
Gayyed, M. F., El-Maqsoud, N. M., Tawfiek, E. R., El Gelany, S. A., and Rahman, M. F. (2016). A comprehensive analysis of CDC20 overexpression in common malignant tumors from multiple organs: its correlation with tumor grade and stage. Tumour Biol. 37, 749–762. doi: 10.1007/s13277-015-3808-1
Global Burden of Disease Cancer Collaboration, Fitzmaurice, C., Akinyemiju, T. F., Al Lami, F. H., Alam, T., Alizadeh-Navaei, R., et al. (2018). Global, regional, and national cancer incidence, mortality, years of life lost, years lived with disability, and disability-adjusted life-years for 29 cancer groups, 1990 to 2016: a systematic analysis for the global burden of disease study. JAMA Oncol. 4, 1553–1568. doi: 10.1001/jamaoncol.2018.2706
Glover, D. M., Leibowitz, M. H., Mclean, D. A., and Parry, H. (1995). Mutations in aurora prevent centrosome separation leading to the formation of monopolar spindles. Cell 81, 95–105. doi: 10.1016/0092-8674(95)90374-7
Han, G., Sidhu, D., Duggan, M. A., Arseneau, J., Cesari, M., Clement, P. B., et al. (2013). Reproducibility of histological cell type in high-grade endometrial carcinoma. Modern Pathol. 26, 1594–1604. doi: 10.1038/modpathol.2013.102
Hareyama, H. (1994). [Proliferative activity of normal endometrial cells, endometrial hyperplasia cells and endometrial cancer cells using the monoclonal antibody to PCNA]. Hokkaido Igaku Zasshi 69, 1427–1431.
Hsu, Y. L., Hung, J. Y., Lee, Y. L., Chen, F. W., Chang, K. F., Chang, W. A., et al. (2017). Identification of novel gene expression signature in lung adenocarcinoma by using next-generation sequencing data and bioinformatics analysis. Oncotarget 8, 104831–104854. doi: 10.18632/oncotarget.21022
Huang, R., Liao, X., and Li, Q. (2017). Identification and validation of potential prognostic gene biomarkers for predicting survival in patients with acute myeloid leukemia. Onco. Targets Ther. 10, 5243–5254. doi: 10.2147/OTT.S147717
Huang, Y., Dai, H., and Guo, Q. N. (2012). TSSC3 overexpression reduces stemness and induces apoptosis of osteosarcoma tumor-initiating cells. Apoptosis 17, 749–761. doi: 10.1007/s10495-012-0734-1
Iacopetta, B., Kawakami, K., and Watanabe, T. (2008). Predicting clinical outcome of 5-fluorouracil-based chemotherapy for colon cancer patients: is the CpG island methylator phenotype the 5-fluorouracil-responsive subgroup? Int. J. Clin. Oncol. 13, 498–503. doi: 10.1007/s10147-008-0854-3
Idichi, T., Seki, N., Kurahara, H., Fukuhisa, H., Toda, H., Shimonosono, M., et al. (2018). Molecular pathogenesis of pancreatic ductal adenocarcinoma: impact of passenger strand of pre-miR-148a on gene regulation. Cancer Sci. 109, 2013–2026. doi: 10.1111/cas.13610
Ito, F., Furukawa, N., and Nakai, T. (2016). Evaluation of TOP2A as a predictive marker for endometrial cancer with taxane-containing adjuvant chemotherapy. Int. J. Gynecol. Cancer 26, 325–330. doi: 10.1097/IGC.0000000000000607
Izdebska, M., Gagat, M., and Grzanka, A. (2018). Overexpression of lamin B1 induces mitotic catastrophe in colon cancer LoVo cells and is associated with worse clinical outcomes. Int. J. Oncol. 52, 89–102. doi: 10.3892/ijo.2017.4182
Jensen, A. B., Tunster, S. J., and John, R. M. (2014). The significance of elevated placental PHLDA2 in human growth restricted pregnancies. Placenta 35, 528–532. doi: 10.1016/j.placenta.2014.04.018
Jin, F., Qiao, C., Luan, N., and Li, H. (2016). Lentivirus-mediated PHLDA2 overexpression inhibits trophoblast proliferation, migration and invasion, and induces apoptosis. Int. J. Mol. Med. 37, 949–957. doi: 10.3892/ijmm.2016.2508
Korkmaz, V., Meydanli, M. M., Yalcin, I., Sari, M. E., Sahin, H., Kocaman, E., et al. (2017). Comparison of three different risk-stratification models for predicting lymph node involvement in endometrioid endometrial cancer clinically confined to the uterus. J. Gynecol. Oncol. 28:e78. doi: 10.3802/jgo.2017.28.e78
Lan, J., Huang, H. Y., Lee, S. W., Chen, T. J., Tai, H. C., Hsu, H. P., et al. (2014). TOP2A overexpression as a poor prognostic factor in patients with nasopharyngeal carcinoma. Tumour Biol. 35, 179–187. doi: 10.1007/s13277-013-1022-6
Lapinska-Szumczyk, S., Supernat, A., Majewska, H., Gulczynski, J., Luczak, A., Biernat, W., et al. (2014). HER2-positive endometrial cancer subtype carries poor prognosis. Clin. Transl. Sci. 7, 482–488. doi: 10.1111/cts.12207
Li, L., Du, Y., Kong, X., Li, Z., Jia, Z., Cui, J., et al. (2013). Lamin B1 is a novel therapeutic target of betulinic acid in pancreatic cancer. Clin. Cancer Res. 19, 4651–4661. doi: 10.1158/1078-0432.CCR-12-3630
Li, L., Qu, Y. W., and Li, Y. P. (2017). Over-expression of miR-1271 inhibits endometrial cancer cells proliferation and induces cell apoptosis by targeting CDK1. Eur. Rev. Med. Pharmacol. Sci. 21, 2816–2822.
Li, Y., Huang, Y., Lv, Y., Meng, G., and Guo, Q. N. (2014). Epigenetic regulation of the pro-apoptosis gene TSSC3 in human osteosarcoma cells. Biomed. Pharmacother. 68, 45–50. doi: 10.1016/j.biopha.2013.10.006
Liu, W. T., Wang, Y., Zhang, J., Ye, F., Huang, X. H., Li, B., et al. (2018). A novel strategy of integrated microarray analysis identifies CENPA, CDK1 and CDC20 as a cluster of diagnostic biomarkers in lung adenocarcinoma. Cancer Lett. 425, 43–53. doi: 10.1016/j.canlet.2018.03.043
Liu, X., Wu, J., Zhang, D., Bing, Z., Tian, J., Ni, M., et al. (2018). Identification of potential key genes associated with the pathogenesis and prognosis of gastric cancer based on integrated bioinformatics analysis. Front. Genet. 9:265. doi: 10.3389/fgene.2018.00265
Liu, Y., Hua, T., Chi, S., and Wang, H. (2019). Identification of key pathways and genes in endometrial cancer using bioinformatics analyses. Oncol. Lett. 17, 897–906. doi: 10.3892/ol.2018.9667
Liu, Y., Wang, L. L., Chen, S., Zong, Z. H., Guan, X., and Zhao, Y. (2018). LncRNA ABHD11-AS1 promotes the development of endometrial carcinoma by targeting cyclin D1. J. Cell Mol. Med. .
Loo, S. K., Ch’ng, E. S., Md Salleh, M. S., Banham, A. H., Pedersen, L. M., Moller, M. B., et al. (2017). TRPM4 expression is associated with activated B cell subtype and poor survival in diffuse large B cell lymphoma. Histopathology 71, 98–111. doi: 10.1111/his.13204
Mcalpine, J., Leon-Castillo, A., and Bosse, T. (2018). The rise of a novel classification system for endometrial carcinoma; integration of molecular subclasses. J. Pathol. 244, 538–549. doi: 10.1002/path.5034
Mcgunigal, M., Liu, J., Kalir, T., Chadha, M., and Gupta, V. (2017). Survival differences among uterine papillary serous, clear cell and grade 3 endometrioid adenocarcinoma endometrial cancers: a national cancer database analysis. Int. J. Gynecol. Cancer 27, 85–92. doi: 10.1097/IGC.0000000000000844
Melling, N., Rashed, M., Schroeder, C., Hube-Magg, C., Kluth, M., Lang, D., et al. (2017). High-level gamma-glutamyl-hydrolase (GGH) expression is linked to poor prognosis in erg negative prostate cancer. Int. J. Mol. Sci. 18:E286. doi: 10.3390/ijms18020286
Meng, Q. C., Wang, H. C., Song, Z. L., Shan, Z. Z., Yuan, Z., Zheng, Q., et al. (2015). Overexpression of NDC80 is correlated with prognosis of pancreatic cancer and regulates cell proliferation. Am. J. Cancer. Res. 5, 1730–1740.
Moon, H.-G., Oh, K., Lee, J., Lee, M., Kim, J.-Y., Yoo, T.-K., et al. (2015). Prognostic and functional importance of the engraftment-associated genes in the patient-derived xenograft models of triple-negative breast cancers. Breast Cancer Res. Treat. 154, 13–22. doi: 10.1007/s10549-015-3585-y
Moss, S. F., Krivosheyev, V., De Souza, A., Chin, K., Gaetz, H. P., Chaudhary, N., et al. (1999). Decreased and aberrant nuclear lamin expression in gastrointestinal tract neoplasms. Gut 45, 723–729. doi: 10.1136/gut.45.5.723
Mukherjee, M., Ge, G., Zhang, N., Edwards, D. G., Sumazin, P., Sharan, S. K., et al. (2014). MMTV-Espl1 transgenic mice develop aneuploid, estrogen receptor alpha (ERalpha)-positive mammary adenocarcinomas. Oncogene 33, 5511–5522. doi: 10.1038/onc.2013.493
Murali, R., Soslow, R. A., and Weigelt, B. (2014). Classification of endometrial carcinoma: more than two types. Lancet Oncol. 15, e268–e278. doi: 10.1016/S1470-2045(13)70591-6
Nabilsi, N. H., Broaddus, R. R., and Loose, D. S. (2009). DNA methylation inhibits p53-mediated survivin repression. Oncogene 28, 2046–2050. doi: 10.1038/onc.2009.62
Nakamura, A., Hayashi, K., Nakajima, G., Kamikozuru, H., Okuyama, R., Kuramochi, H., et al. (2011). Impact of dihydropyrimidine dehydrogenase and gamma-glutamyl hydrolase on the outcomes of patients treated with gemcitabine or S-1 as adjuvant chemotherapy for advanced pancreatic cancer. Exp. Ther. Med. 2, 1097–1103. doi: 10.3892/etm.2011.340
O’mara, T. A., Zhao, M., and Spurdle, A. B. (2016). Meta-analysis of gene expression studies in endometrial cancer identifies gene expression profiles associated with aggressive disease and patient outcome. Sci. Rep. 6:36677. doi: 10.1038/srep36677
Pallares, J., Martínez-Guitarte, J. L., Dolcet, X., Llobet, D., Rue, M., Palacios, J., et al. (2005). Survivin expression in endometrial carcinoma. Int. J. Gynecol. Pathol. 24, 247–253.
Pecorelli, S. (2009). Revised FIGO staging for carcinoma of the vulva, cervix, and endometrium. Int. J. Gynecol. Obstet. 105, 103–104. doi: 10.1016/j.ijgo.2009.02.012
Pei, Y. F., Yin, X. M., and Liu, X. Q. (2018). TOP2A induces malignant character of pancreatic cancer through activating beta-catenin signaling pathway. Biochim. Biophys. Acta Mol. Basis Dis. 1864, 197–207. doi: 10.1016/j.bbadis.2017.10.019
Qu, Y., Li, J., Cai, Q., and Liu, B. (2014). Hec1/Ndc80 is overexpressed in human gastric cancer and regulates cell growth. J. Gastroenterol. 49, 408–418. doi: 10.1007/s00535-013-0809-y
Sagredo, A. I., Sagredo, E. A., Pola, V., Echeverria, C., Andaur, R., Michea, L., et al. (2019). TRPM4 channel is involved in regulating epithelial to mesenchymal transition, migration, and invasion of prostate cancer cell lines. J. Cell Physiol. 234, 2037–2050. doi: 10.1002/jcp.27371
Schinke, E. N., Bii, V., Nalla, A., Rae, D. T., Tedrick, L., Meadows, G. G., et al. (2014). A novel approach to identify driver genes involved in androgen-independent prostate cancer. Mol. Cancer 13:120. doi: 10.1186/1476-4598-13-120
Shubbar, E., Helou, K., Kovacs, A., Nemes, S., Hajizadeh, S., Enerback, C., et al. (2013). High levels of gamma-glutamyl hydrolase (GGH) are associated with poor prognosis and unfavorable clinical outcomes in invasive breast cancer. BMC Cancer 13:47. doi: 10.1186/1471-2407-13-47
Sozucan, Y., Kalender, M. E., Sari, I., Suner, A., Oztuzcu, S., Arman, K., et al. (2015). TRP genes family expression in colorectal cancer. Exp. Oncol. 37, 208–212. doi: 10.31768/2312-8852.2015.37(3):208-212
Stelloo, E., Bosse, T., Nout, R. A., Mackay, H. J., Church, D. N., Nijman, H. W., et al. (2015). Refining prognosis and identifying targetable pathways for high-risk endometrial cancer; a TransPORTEC initiative. Mod. Pathol. 28, 836–844. doi: 10.1038/modpathol.2015.43
Sun, S., Xu, M. Z., Poon, R. T., Day, P. J., and Luk, J. M. (2010). Circulating Lamin B1 (LMNB1) biomarker detects early stages of liver cancer in patients. J. Proteome Res. 9, 70–78. doi: 10.1021/pr9002118
Sung, W. W., Lin, Y. M., Wu, P. R., Yen, H. H., Lai, H. W., Su, T. C., et al. (2014). High nuclear/cytoplasmic ratio of Cdk1 expression predicts poor prognosis in colorectal cancer patients. BMC Cancer 14:951. doi: 10.1186/1471-2407-14-951
Supernat, A., Lapinska-Szumczyk, S., Majewska, H., Gulczynski, J., Biernat, W., Wydra, D., et al. (2014). Tumor heterogeneity at protein level as an independent prognostic factor in endometrial cancer. Transl. Oncol. 7, 613–619. doi: 10.1016/j.tranon.2014.06.001
Tomczak, K., Czerwinska, P., and Wiznerowicz, M. (2015). The cancer genome atlas (TCGA): an immeasurable source of knowledge. Contemp. Oncol. 19, A68–A77. doi: 10.5114/wo.2014.47136
Umene, K., Yanokura, M., Banno, K., Irie, H., Adachi, M., Iida, M., et al. (2015). Aurora kinase A has a significant role as a therapeutic target and clinical biomarker in endometrial cancer. Int. J. Oncol. 46, 1498–1506. doi: 10.3892/ijo.2015.2842
Wang, D., Zhu, H., Guo, M., Fan, X., Hu, S., Yan, K., et al. (2018). Expression and prognostic value of cell-cycle-associated genes in gastric adenocarcinoma. BMC Gastroenterol. 18:81. doi: 10.1186/s12876-018-0811-1
Wang, J., Jia, N., Lyv, T., Wang, C., Tao, X., Wong, K., et al. (2018). Paired box 2 promotes progression of endometrial cancer via regulating cell cycle pathway. J. Cancer 9, 3743–3754. doi: 10.7150/jca.22418
Wang, J., Xu, B., Yuan, P., Zhang, P., Li, Q., Ma, F., et al. (2012). TOP2A amplification in breast cancer is a predictive marker of anthracycline-based neoadjuvant chemotherapy efficacy. Breast Cancer Res. Treat. 135, 531–537. doi: 10.1007/s10549-012-2167-5
Wang, S., Chen, B., Zhu, Z., Zhang, L., Zeng, J., Xu, G., et al. (2018). CDC20 overexpression leads to poor prognosis in solid tumors: a system review and meta-analysis. Medicine 97:e13832. doi: 10.1097/MD.0000000000013832
Wang, W., Lim, W. K., Leong, H. S., Chong, F. T., Lim, T. K., Tan, D. S., et al. (2015). An eleven gene molecular signature for extra-capsular spread in oral squamous cell carcinoma serves as a prognosticator of outcome in patients without nodal metastases. Oral. Oncol. 51, 355–362. doi: 10.1016/j.oraloncology.2014.12.012
Wang, X., He, H., Zhang, K., and Peng, W. (2016). The expression of TSSC3 and its prognostic value in patients with osteosarcoma. Biomed. Pharmacother. 79, 23–26. doi: 10.1016/j.biopha.2015.10.013
Wang, X., Wang, D., Yuan, N., Liu, F., Wang, F., Wang, B., et al. (2017). The prognostic value of PCNA expression in patients with osteosarcoma: a meta-analysis of 16 studies. Medicine 96:e8254. doi: 10.1097/MD.0000000000008254
Wang, Z., Slipicevic, A., Forsund, M., Trope, C. G., Nesland, J. M., and Holm, R. (2015). Expression of CDK1(Tyr15), pCDK1(Thr161), Cyclin B1 (total) and pCyclin B1(Ser126) in vulvar squamous cell carcinoma and their relations with clinicopatological features and prognosis. PLoS One 10:e0121398. doi: 10.1371/journal.pone.0121398
Watari, H., Mitamura, T., Moriwaki, M., Hosaka, M., Ohba, Y., Sudo, S., et al. (2009). Survival and failure pattern of patients with endometrial cancer after extensive surgery including systematic pelvic and para-aortic lymphadenectomy followed by adjuvant chemotherapy. Int. J. Gynecol. Cancer 19, 1585–1590. doi: 10.1111/IGC.0b013e3181a833cc
Wazir, U., Ahmed, M. H., Bridger, J. M., Harvey, A., Jiang, W. G., Sharma, A. K., et al. (2013). The clinicopathological significance of lamin A/C, lamin B1 and lamin B receptor mRNA expression in human breast cancer. Cell Mol. Biol. Lett. 18, 595–611. doi: 10.2478/s11658-013-0109-9
Wen, D. Y., Lin, P., Pang, Y. Y., Chen, G., He, Y., Dang, Y. W., et al. (2018). Expression of the long intergenic non-protein coding RNA 665 (LINC00665) gene and the cell cycle in hepatocellular carcinoma using the cancer genome atlas, the gene expression omnibus, and quantitative real-time polymerase chain reaction. Med. Sci. Monit. 24, 2786–2808. doi: 10.12659/MSM.907389
Wu, Y. S., Lin, H., Chen, D., Yi, Z., Zeng, B., Jiang, Y., et al. (2019). A four-miRNA signature as a novel biomarker for predicting survival in endometrial cancer. Gene 697, 86–93. doi: 10.1016/j.gene.2019.01.046
Xi, Q., Huang, M., Wang, Y., Zhong, J., Liu, R., Xu, G., et al. (2015). The expression of CDK1 is associated with proliferation and can be a prognostic factor in epithelial ovarian cancer. Tumour Biol. 36, 4939–4948. doi: 10.1007/s13277-015-3141-8
Xing, X. K., Wu, H. Y., Chen, H. L., and Feng, H. G. (2016). NDC80 promotes proliferation and metastasis of colon cancer cells. Genet. Mol. Res. 15:gmr8312. doi: 10.4238/gmr.15028312
Xu, B., Wu, D. P., Xie, R. T., Liu, L. G., and Yan, X. B. (2017). Elevated NDC80 expression is associated with poor prognosis in osteosarcoma patients. Eur. Rev. Med. Pharmacol. Sci. 21, 2045–2053.
Xu, Q., Yang, Q., Zhou, Y., Yang, B., Jiang, R., Ai, Z., et al. (2018). A long noncoding RNAs signature to improve survival prediction in endometrioid endometrial cancer. J. Cell Biochem. .
Ye, M., He, Z., Dai, W., Li, Z., Chen, X., and Liu, J. A. (2018). TOP2A-derived cancer panel drives cancer progression in papillary renal cell carcinoma. Oncol. Lett. 16, 4169–4178. doi: 10.3892/ol.2018.9179
Yin, S., Li, Z., Huang, J., Miao, Z., Zhang, J., Lu, C., et al. (2017). Prognostic value and clinicopathological significance of proliferating cell nuclear antigen expression in gastric cancer: a systematic review and meta-analysis. Onco. Targets Ther. 10, 319–327. doi: 10.2147/OTT.S126551
Yoshida, T., Okamoto, T., Yano, T., Takada, K., Kohno, M., Suda, K., et al. (2016). Molecular factors associated with pemetrexed sensitivity according to histological type in non-small cell lung cancer. Anticancer Res. 36, 6319–6326. doi: 10.21873/anticanres.11228
Zhang, R., Xu, J., Zhao, J., and Bai, J. H. (2018). Proliferation and invasion of colon cancer cells are suppressed by knockdown of TOP2A. J. Cell Biochem. 119, 7256–7263. doi: 10.1002/jcb.26916
Zhang, Y., Zhang, W., Li, X., Li, D., Zhang, X., Yin, Y., et al. (2016). Prognostic factors and genes associated with endometrial cancer based on gene expression profiling by bioinformatics analysis. Arch. Gynecol. Obstet. 293, 1287–1295. doi: 10.1007/s00404-015-3886-8
Zhou, H., Huang, T., Xiong, Y., Peng, L., Wang, R., and Zhang, G. J. (2018). The prognostic value of proliferating cell nuclear antigen expression in colorectal cancer: a meta-analysis. Medicine 97:e13752. doi: 10.1097/MD.0000000000013752
Keywords: endometrial cancer, bioinformatics, prognosis, biomarker, GEO, TCGA
Citation: Liu L, Lin J and He H (2019) Identification of Potential Crucial Genes Associated With the Pathogenesis and Prognosis of Endometrial Cancer. Front. Genet. 10:373. doi: 10.3389/fgene.2019.00373
Received: 27 January 2019; Accepted: 09 April 2019;
Published: 26 April 2019.
Edited by:
Gajendra P. S. Raghava, Indraprastha Institute of Information Technology Delhi, IndiaCopyright © 2019 Liu, Lin and He. This is an open-access article distributed under the terms of the Creative Commons Attribution License (CC BY). The use, distribution or reproduction in other forums is permitted, provided the original author(s) and the copyright owner(s) are credited and that the original publication in this journal is cited, in accordance with accepted academic practice. No use, distribution or reproduction is permitted which does not comply with these terms.
*Correspondence: Hongying He, aGVob25neWluZzFAeWVhaC5uZXQ=