 Xiaoyang Gao1
 Jing Xu
 Hao Chen
 Yongchao C. Ma
 Long Ma
- 1Center for Medical Genetics, School of Life Sciences, Central South University, Changsha, China
- 2Department of Pediatrics, Northwestern University Feinberg School of Medicine, Ann & Robert H. Lurie Children’s Hospital of Chicago, Chicago, IL, United States
- 3Hunan Key Laboratory of Medical Genetics, School of Life Sciences, Central South University, Changsha, China
- 4Hunan Key Laboratory of Animal Models for Human Diseases, School of Life Sciences, Central South University, Changsha, China
Spinal muscular atrophy (SMA) is a severe motor neuron degenerative disease caused by loss-of-function mutations in the survival motor neuron gene SMN1. It is widely posited that defective gene expression underlies SMA. However, the identities of these affected genes remain to be elucidated. By analyzing the transcriptome of a Caenorhabditis elegans SMA model at the pre-symptomatic stage, we found that the expression of numerous nuclear encoded mitochondrial genes and vacuolar H+-ATPase genes was significantly down-regulated, while that of histone genes was significantly up-regulated. We previously showed that the uaf-1 gene, encoding key splicing factor U2AF large subunit, could affect the behavior and lifespan of smn-1 mutants. Here, we found that smn-1 and uaf-1 interact to affect the recognition of 3′ and 5′ splice sites in a gene-specific manner. Altogether, our results suggest a functional interaction between smn-1 and uaf-1 in affecting RNA splicing and a potential effect of smn-1 on the expression of mitochondrial and histone genes.
Introduction
Spinal muscular atrophy (SMA) is a severe congenital motor neuron degenerative disease caused by loss-of-function mutations in the survival motor neuron gene 1 (SMN1) (Lefebvre et al., 1995). In addition to SMN1, humans also carry SMN2, which is different from SMN1 by a single nucleotide, leading to defective RNA splicing and reduced full length functional SMN protein expression (Kashima and Manley, 2003; Cartegni et al., 2006). SMN is conserved and only one SMN gene is found in mouse, Drosophila and Caenorhabditis elegans (Edens et al., 2015).
A key function of SMN is to facilitate the proper assembly of the small nuclear ribonucleoproteins (snRNP) (Fischer et al., 1997; Liu et al., 1997; Pellizzoni et al., 1998). snRNPs form the core components of the pre-mRNA splicing machinery (Reed, 2000; Makarov et al., 2002). It is hypothesized that defective snRNP formation caused by SMN deficiency and subsequent aberrant gene splicing underlie the pathogenesis of SMA (Burghes and Beattie, 2009). However, the key molecular changes caused by SMN deficiency that lead to SMA and SMN mutant phenotype remain to be elucidated.
In addition to snRNP biogenesis and pre-mRNA splicing, SMN also affects mRNA localization in neurons (Rossoll et al., 2003), mRNA local translation (Kye et al., 2014), axonal guidance (McWhorter et al., 2003), muscle functions (Rajendra et al., 2007), endocytosis (Dimitriadi et al., 2016; Hosseinibarkooie et al., 2016; Riessland et al., 2017), autophagy (Garcera et al., 2013; Custer and Androphy, 2014) and multiple other RNA-related processes (Singh et al., 2017). SMN may interact with numerous genes in Drosophila and C. elegans (Chang et al., 2008; Dimitriadi et al., 2010; Sen et al., 2013). The broad function of SMN implicates that SMA pathogenesis might involve molecular processes beyond defective RNA splicing and gene expression.
The nematode C. elegans carries an ortholog of SMN named smn-1 and has been used for studying in vivo functions of SMN (Bertrandy et al., 1999; Miguel-Aliaga et al., 1999; Burt et al., 2006; Briese et al., 2009; Dimitriadi et al., 2010, 2013, 2016; Sleigh et al., 2011; Gao et al., 2014). smn-1 is essential for C. elegans survival (Miguel-Aliaga et al., 1999). A deletion mutation of smn-1, ok355, causes developmental arrest, a reduced lifespan and a progressive loss of motor functions that can be partially attributed to neuronal defects (Briese et al., 2009; Dimitriadi et al., 2010).
One approach to understand SMA is to investigate how SMN interacts with other splicing factors to affect gene expression and RNA splicing. In eukaryotes, pre-mRNA splicing (RNA splicing) begins with the recognition of 5′ splice sites by the U1 snRNP and of 3′ splice sites by the U2AF large and small subunits (Reed, 2000). Specifically, the U2AF large subunit (UAF-1 in C. elegans) and small subunit (UAF-2) interact with each other to bind the pyrimidine tract preceding the 3′ splice site and the conserved 3′ splice site (Reed, 2000; Maniatis and Reed, 2002).
A complete loss of function in UAF-1 or UAF-2 leads to lethality in C. elegans (Zorio and Blumenthal, 1999; Ma and Horvitz, 2009). We previously isolated a missense mutation in uaf-1 (Thr180Ile in C. elegans, Thr145Ile in mouse) that causes conditional lethality at higher temperatures and affects alternative splicing (Ma and Horvitz, 2009; Ma et al., 2011). An exploration of how uaf-1 interacts with smn-1 found that this uaf-1 mutation (n4588) and a derived uaf-1 mutation (n4588 n5127, T180I and M157I) (Ma and Horvitz, 2009) can partially suppress the behavioral and lifespan defects of smn-1(ok355) mutants at late developmental stages when smn-1 mutants exhibit severe defects in behavior and lifespan (Gao et al., 2014). Since uaf-1(n4588) can decrease or increase the recognition of 3′ splice sites in a gene-specific manner (Ma and Horvitz, 2009; Ma et al., 2011; Zhou et al., 2018), we postulate that this mutation might improve the splicing of a subset of affected genes in smn-1(ok355) mutants, which might compensate the defects in snRNPs and lead to the suppression (Gao et al., 2014). In this study, we examined how smn-1 affected C. elegans gene expression and RNA splicing by analyzing the transcriptome of smn-1 mutants at the pre-symptomatic stage.
Results
smn-1(ok355) Affects the Expression of a Wide Array of Genes in C. elegans
It was unclear how smn-1 affects gene expression in C. elegans. ok355 is a null mutation in smn-1 that deletes the majority of the coding regions of the gene (Briese et al., 2009). smn-1(ok355) mutants have similar behavior, body size and survival rate at early larval stages compared to wild type (Briese et al., 2009). The mutants start to exhibit gradual deterioration in locomotion and pharyngeal pumping after 2 days post the L1 stage (Briese et al., 2009; Gao et al., 2014), probably due to the depletion of maternally inherited smn-1 products. We therefore used animals at this stage (2 days after L1) for RNA-Seq analyses, postulating that we might observe early-stage changes of gene expression caused by smn-1 deficiency.
We performed RNA-Seq on animals of different genotypes and focused on differentially expressed genes (DEGs) with q ≤ 0.05 (adjusted p-value) and | log2_ratio|≥ 1 from pairwise comparisons. The heat map indicates that smn-1(ok355) mutants exhibited apparently different gene expression profiles compared to wild type (Figure 1A). Three thousand four hundred and fifty-five DEGs were identified in smn-1(ok355) mutants, including 1564 up-regulated and 1891 down-regulated ones (Figure 1B, ok355 vs. N2 and Supplementary Table S1). It is interesting to note that the expression levels of numerous genes were altered significantly beyond two folds. This is exemplified by the fold changes of the top 200 up-regulated and the top 200 down-regulated DEGs (Supplementary Table S2), among which smn-1 is the third most down-regulated one. Consistently, the raw sequencing reads and FPKMs (fragments per kilobase of transcript per million mapped reads) of smn-1 transcripts were barely detectable in all smn-1(ok355) samples compared to wild type or uaf-1(n4588) samples (Supplementary Table S3).
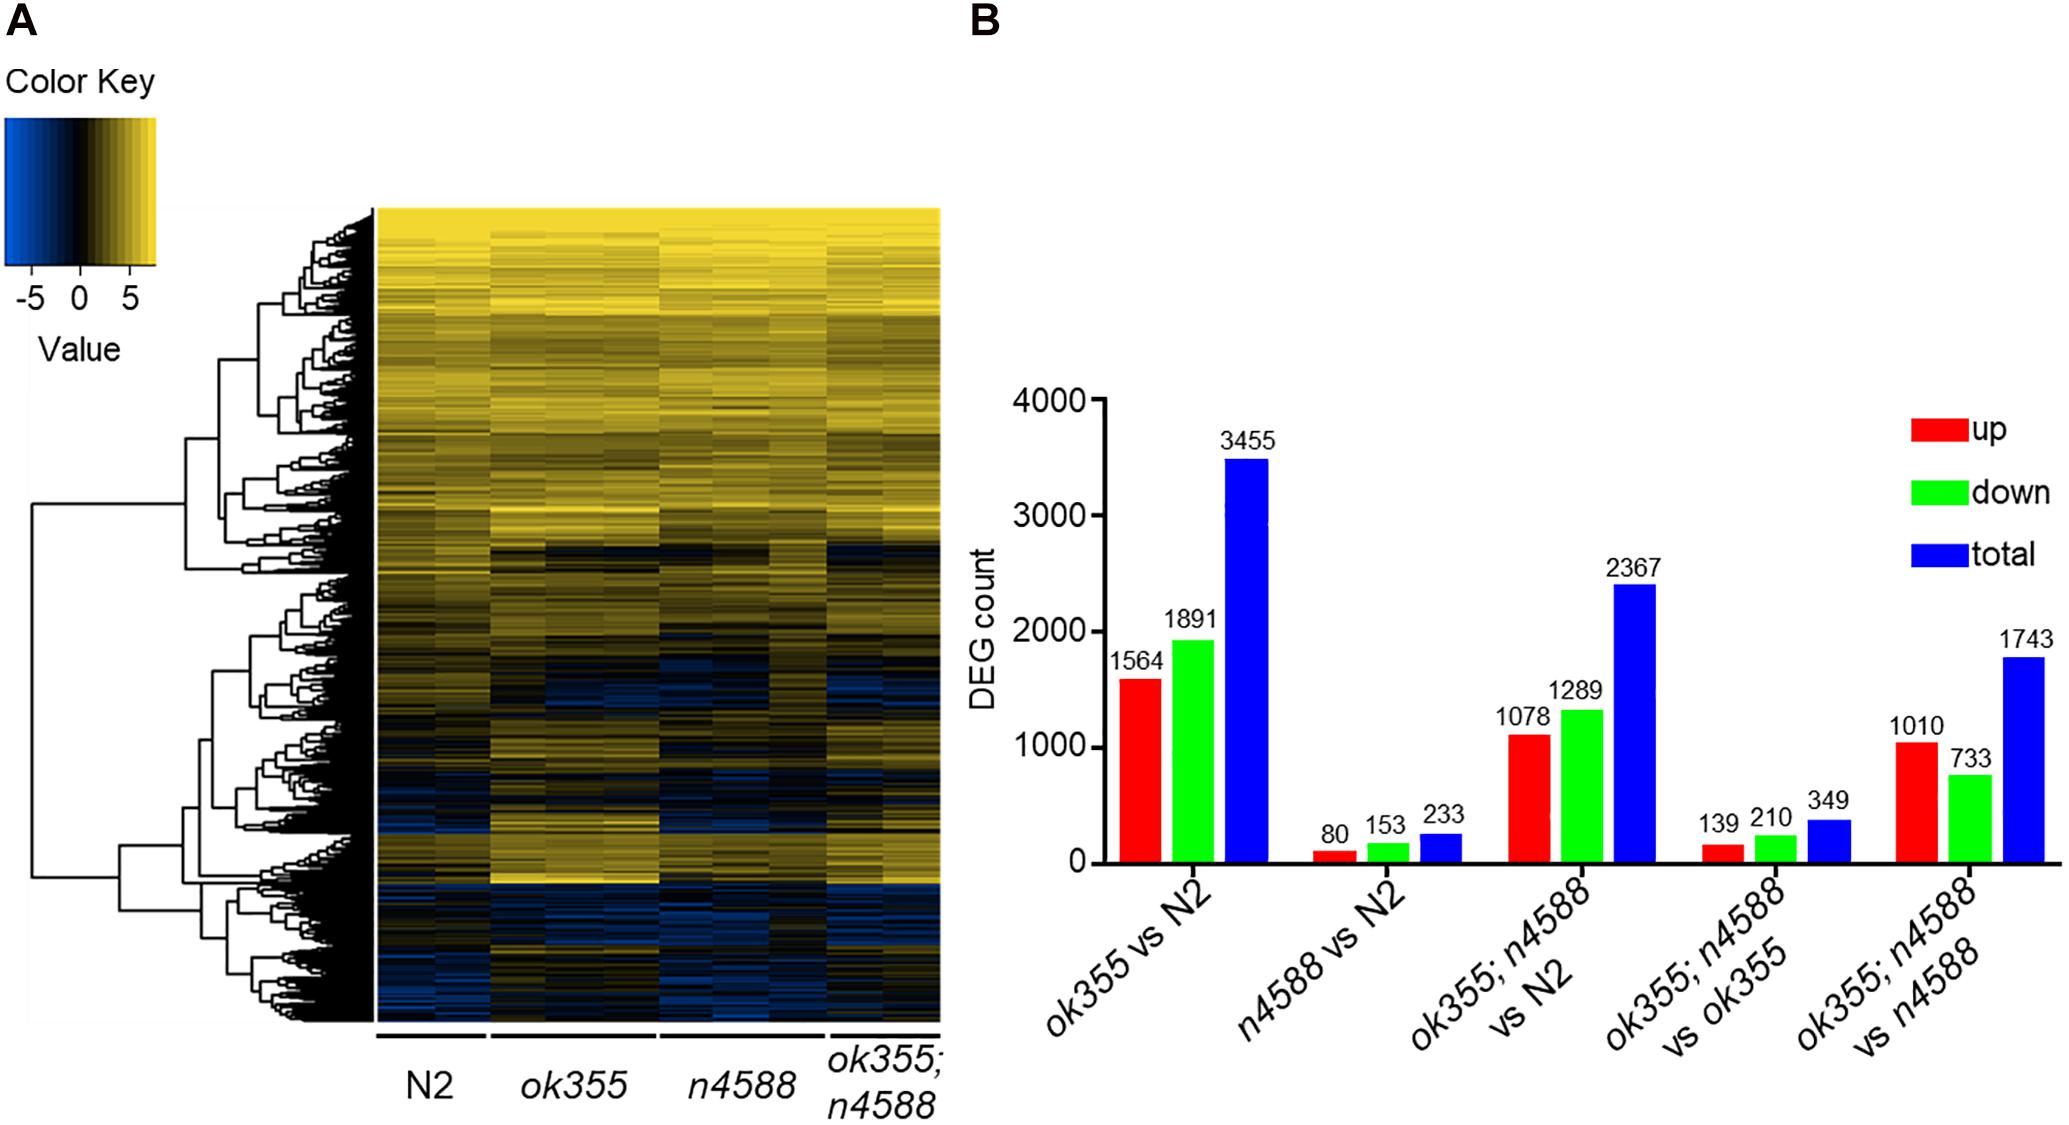
Figure 1. RNA-Seq identified differentially expressed genes (DEGs) in smn-1(ok355) mutants. (A) Heat map of DEGs in mutants and wild type. Blue color indicates low expression and yellow color indicates high expression. (B) Numbers of DEGs in mutants compared to wild type or in smn-1(ok355); uaf-1(n4588) double mutants compared to smn-1(ok355) or uaf-1(n4588) single mutants.
smn-1(ok355) Mutants Have Defective Mitochondrial, Vacuolar H+-ATPase and Histone Gene Expression
To identify the major biological pathways affected by smn-1, we performed KEGG (Kyoto Encyclopedia of Genes and Genomes1) pathway analyses on the DEGs of smn-1(ok355) mutants. Twenty-five significantly affected pathways were identified (Figure 2A and Supplementary Table S4), 13 of which were enriched with mitochondrial genes (Figure 2A, highlighted in red), followed by six pathways enriched with genes encoding vacuolar H+-ATPases (V-ATPases, green) and two pathways enriched with genes encoding nucleosome proteins (histones, blue) (Figure 2A).
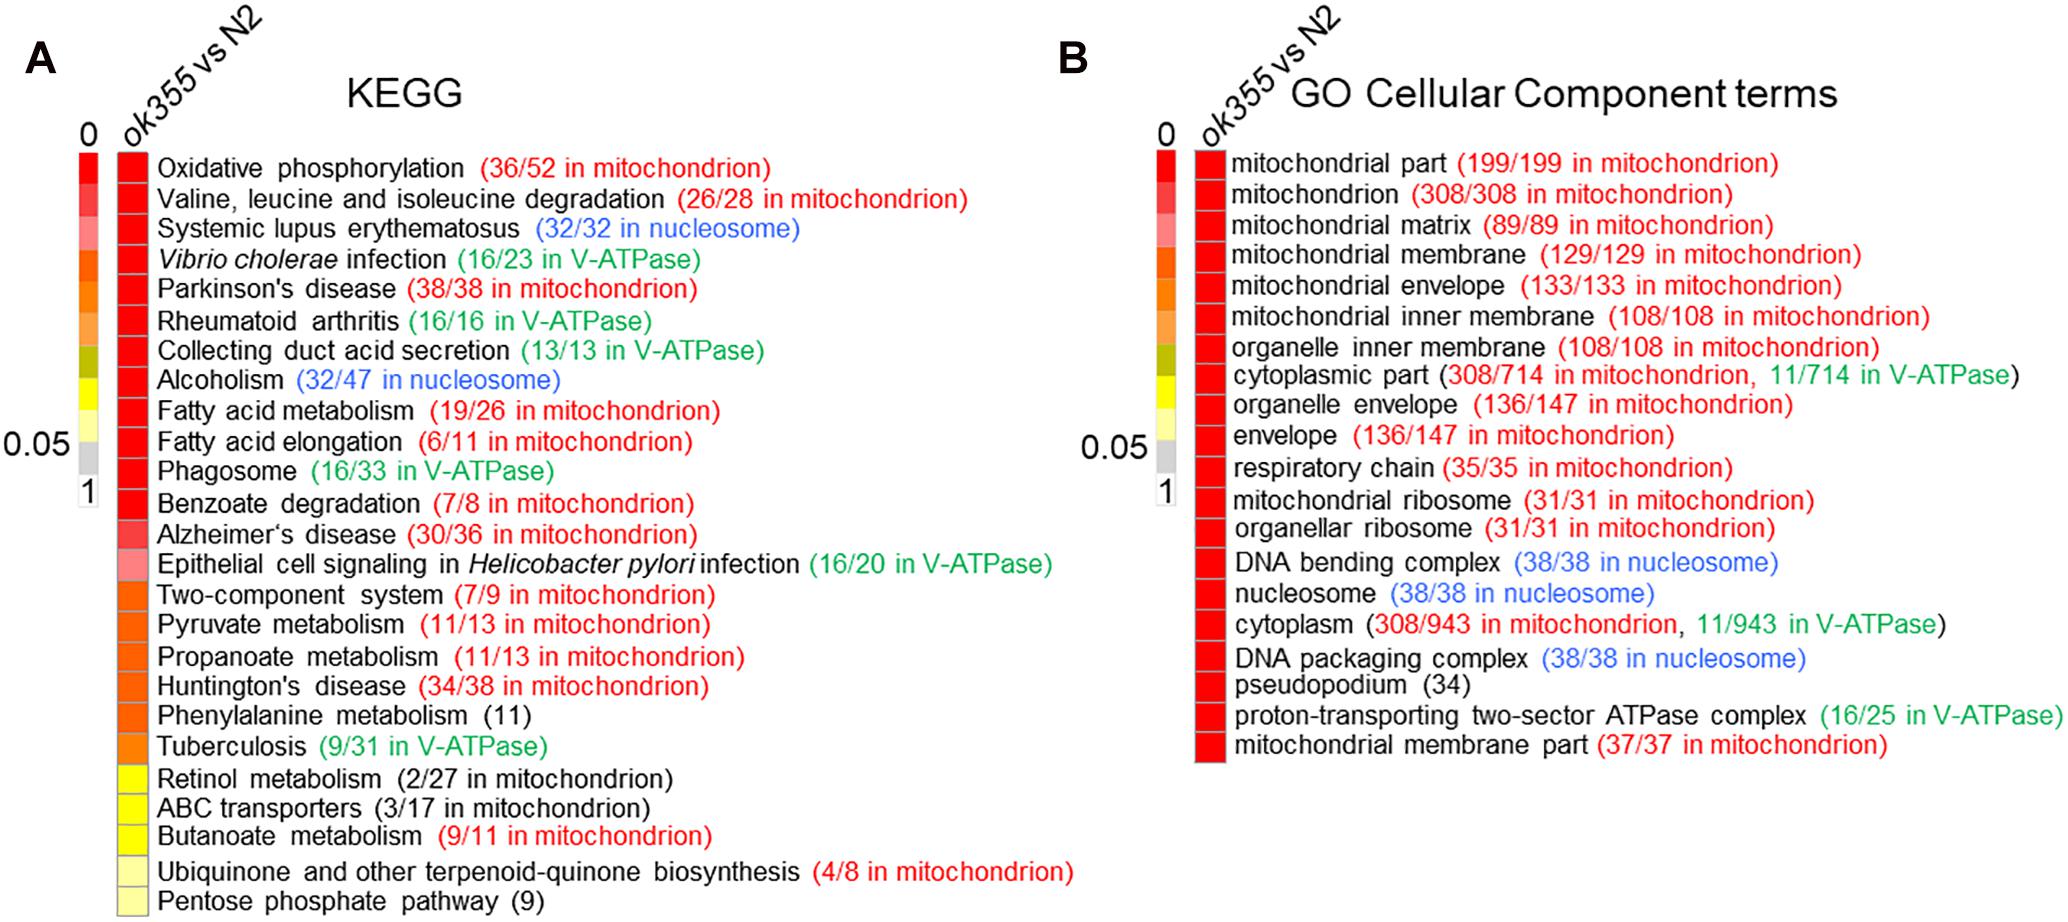
Figure 2. Kyoto Encyclopedia of Genes and Genomes (KEGG) pathway analysis and gene ontology (GO) cellular component analysis in smn-1(ok355) single mutants. (A) Significantly affected KEGG pathways in smn-1(ok355) mutants. The number of DEGs with similar annotated functions vs. total DEGs in each pathway is shown in parentheses. Mitochondrial genes are indicated in red, V-ATPase genes in green and histone genes in blue. (B) Top 20 significantly affected GO cellular component terms in smn-1(ok355) mutants. Mitochondrial genes are indicated in red, V-ATPase genes in green and histone genes in blue. The number of DEGs in each term is shown in the parentheses. The colors of the scale bars indicate the statistical significance (q-value) of the affected pathways or terms, with q-value above 0.05 considered non-significant.
The other four KEGG pathways significantly affected in smn-1(ok355) mutants include phenylalanine metabolism, retinol metabolism, ATP-binding cassette (ABC) transporters and the pentose phosphate pathway (Figure 2A). Two DEGs in the phenylalanine metabolism pathway were bas-1 and tdc-1, which are required for the synthesis of neurotransmitters serotonin (bas-1) (Hare and Loer, 2004), tyramine (tdc-1) and octopamine (tdc-1) (Alkema et al., 2005) (Supplementary Table S4). Among the 27 DEGs in the retinol metabolism pathway, 12 were ugt genes encoding UDP glycosyltransferases (UGT), followed by seven cyp genes encoding cytochrome P450 proteins (Supplementary Table S4). UGT and P450 interact and play essential roles in xenobiotic and endobiotic metabolism (Ishii et al., 2010; Knights et al., 2013). Among the 17 DEGs encoding ABC transporters, three were similar to yeast homologs localized in mitochondria (Figure 2A and Supplementary Table S4, based on annotations2), while the others were similar to homologs localized on the plasma membrane or other organelles (Supplementary Table S4). The pentose phosphate pathway is an important route for generating NADPH and maintaining redox balance (Stincone et al., 2015), a function also shared by mitochondria.
Considering that the same gene can be assigned to different KEGG pathways, we further sorted these DEGs to a non-redundant list (Supplementary Table S5). In the list, the top groups include genes that encode mitochondrial proteins (94 genes), histones (32), ABC transporters (17), V-ATPases (16), UGTs (12), phosphoprotein phosphatases (12), C-type lectins (10), and cytochrome P450 (7) (Supplementary Table S5).
Gene ontology (GO3) analyses of the DEGs showed that mitochondrial components were the most significantly affected group (Figure 2B, red), similar to the KEGG analyses. Components of the nucleosome proteins and V-ATPases were also among the top 20 categories (Figure 2B, blue and green, respectively). Non-redundant DEGs related to these GO terms are listed in Supplementary Table S6.
Though no KEGG pathways or GO terms related to lifespan or motor functions were predicted to be significantly affected in smn-1(ok355) mutants based on the hypergeometric test (Materials and Methods), a closer examination of the RNA-Seq results identified a non-redundant list (189 in total) of DEGs annotated to GO terms related to lifespan, motor functions and/or neuron activities (Supplementary Table S7). In the list, 15 were mitochondrial genes (Supplementary Table S7, highlighted in red) and two were V-ATPase genes (Supplementary Table S7, highlighted in green).
Validation of Down-Regulated Gene Expression in smn-1(ok355) Mutants
To validate the RNA-Seq results, we used RT-qPCR to quantify the expression of a group of down-regulated DEGs randomly selected in the mitochondrial, V-ATPase, ugt and cyp groups (Supplementary Table S8, highlighted in red). Among the 13 nuclear genome-encoded mitochondrial genes examined (Supplementary Table S8), nine were confirmed to be down-regulated to ∼50% or less of the wild-type levels (Figure 3A), while four were not (Supplementary Figure S1). However, the differential expression of the four mitochondrial genome-encoded genes was not validated (Supplementary Figure S1). We examined seven V-ATPase genes (Supplementary Table S8) and validated that four were down-regulated (Figure 3B and Supplementary Figure S1). We further validated the down-regulation of four ugt genes (Figure 3C and Supplementary Figure S1) out of five examined (Supplementary Table S8) and of three cyp genes (Figure 3D and Supplementary Figure S1) out of five examined (Supplementary Table S8). Together, the total validation rate was 20/34.
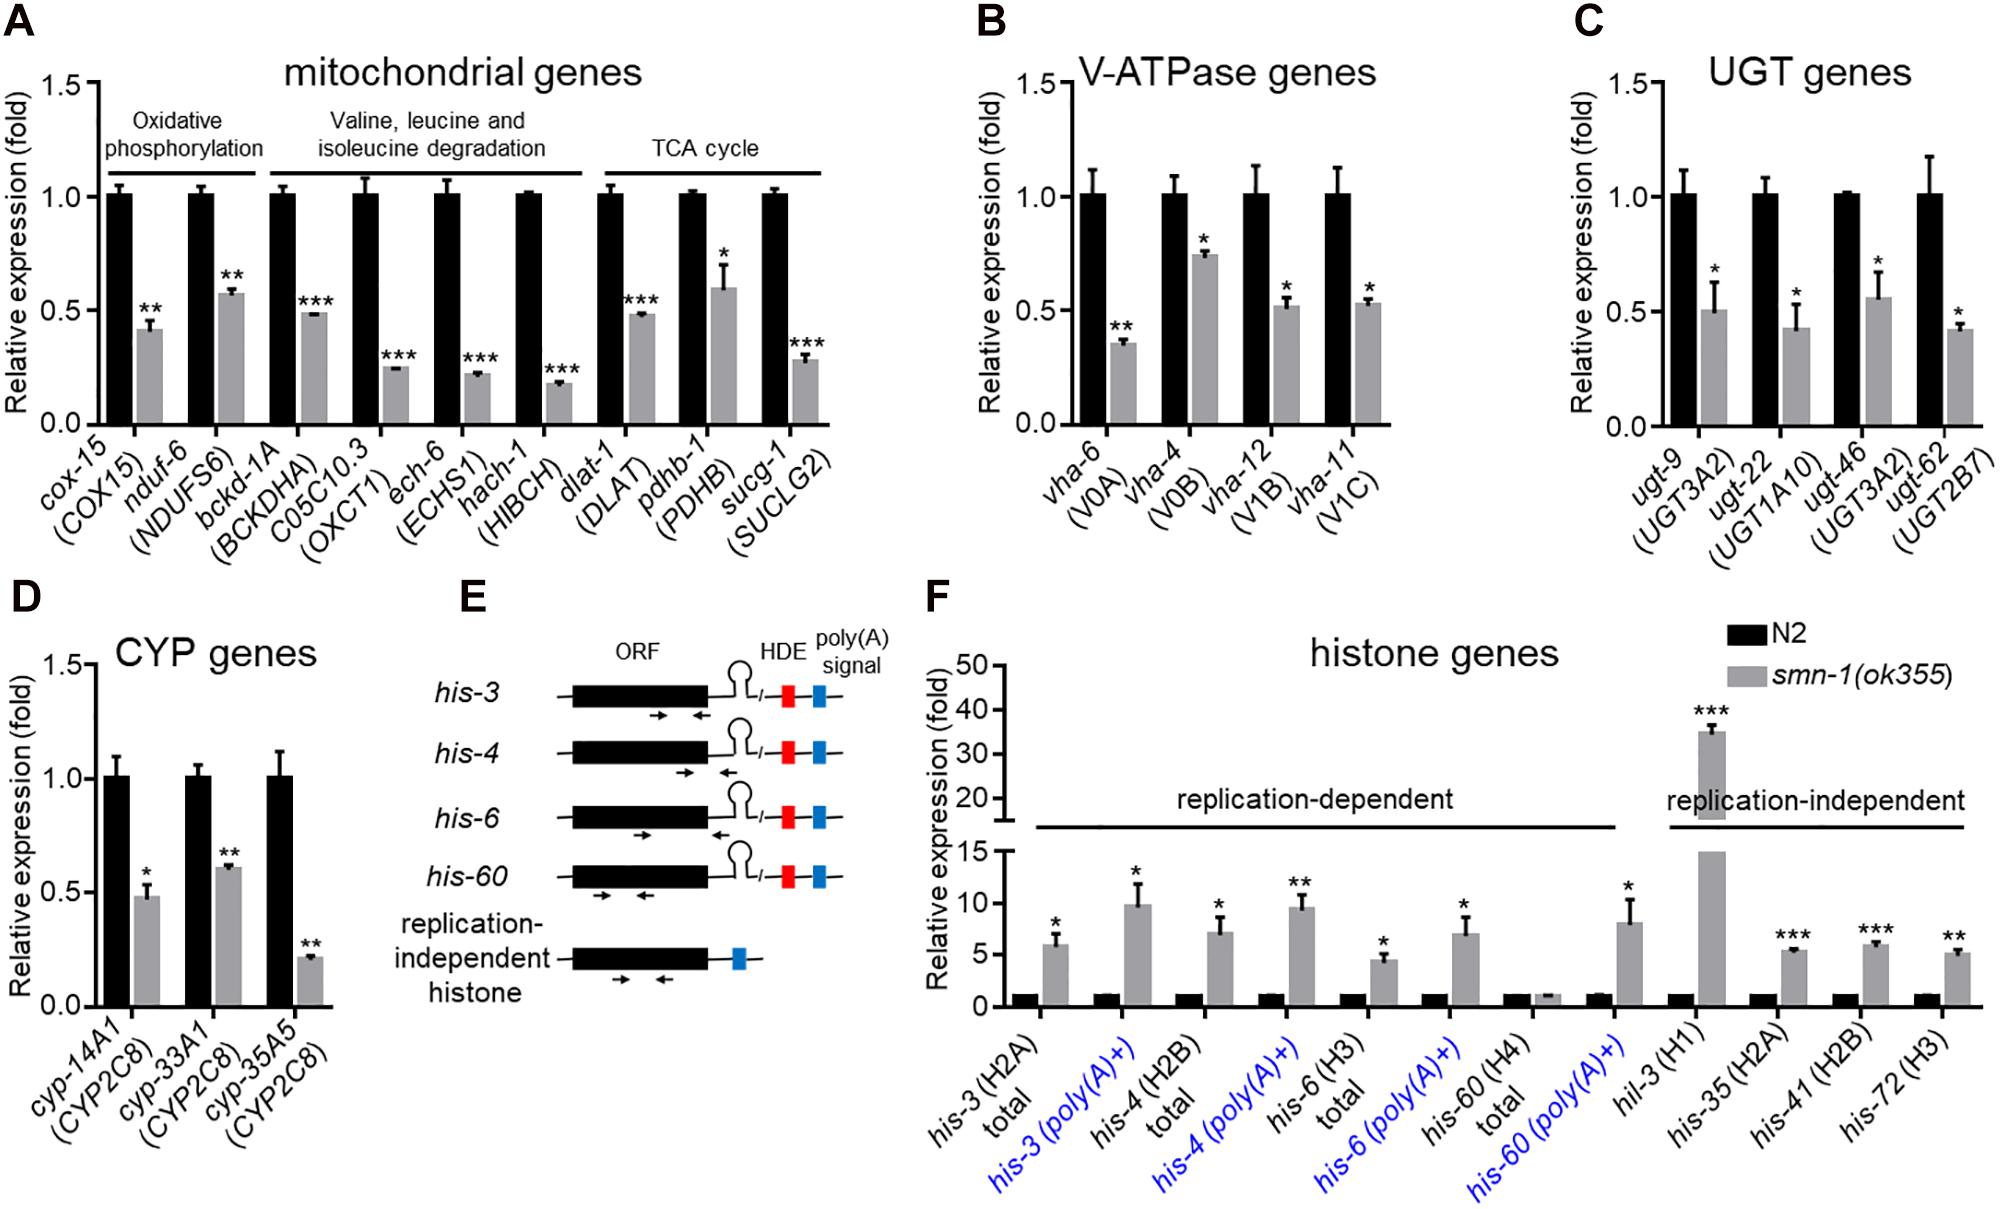
Figure 3. RT-qPCR validation of DEGs in smn-1(ok355) single mutants. Relative expression of mitochondrial genes (A), V-ATPase subunit genes (B), ugt genes (C), and cyp genes (D) in smn-1(ok355) mutants. The corresponding mammalian homologs are indicated in parentheses. (E) Gene structures of replication-dependent and -independent histone genes and positions of PCR primers. HDE (red): presumably C. elegans-specific histone downstream element (Keall et al., 2007). Poly(A) signals are indicated as blue boxes. (F) Validation of histone gene expression. For replication-dependent histone genes, total transcripts and poly(A)+ transcripts were reversely transcribed using random primers and oligo(dT) primers, respectively. Each dataset is the average of three biological replicates. Statistics: two-tailed unpaired Student’s t-test. ∗p < 0.05; ∗∗p < 0.01; ∗∗∗p < 0.001. Error bars: standard errors.
Validation of Histone Gene Expression
Different from that of mitochondrial and V-ATPase genes, the expression of the majority of histone genes (34/38, excluding his-72, see below) was found to be significantly up-regulated in smn-1(ok355) mutants based on RNA-Seq results (Supplementary Table S8).
Histone genes can be classified into two types: the replication-dependent type, which produces mature mRNA transcripts with a unique 3′ stem-loop end structure without poly(A) tails [poly(A)-], and the replication-independent type, which produces transcripts with poly(A) tails [poly(A)+] (Marzluff et al., 2008) (Figure 3E). For replication-dependent histone genes, studies in mammalian SMN-deficient cells showed that defective cleavage between the 3′ stem-loop end structure and the poly(A) signal (Figure 3E) by the U7 snRNP would lead to the accumulation of poly(A)+ transcripts (Tisdale et al., 2013).
To validate histone gene expression, we selected four genes from both replication-dependent and -independent types, each of which encodes a different histone (Supplementary Table S8 and Figure 3F). It is worth noting that his-72, which encodes an H3 histone and is replication-independent, was not identified as a DEG based on RNA-Seq (Supplementary Table S8). We included it as a representative of its type (replication-independent H3-encoding).
For replication-independent histone genes, we generated cDNAs using random oligo primers in reverse transcription experiments (see section “Materials and Methods”). RT-qPCR experiments confirmed that the expression levels of the four selected genes (Supplementary Table S8) were significantly up-regulated in smn-1(ok355) mutants (Figure 3F).
The RNA-Seq results suggested up-regulation of poly(A)+ transcripts of replication-dependent histone genes in smn-1(ok355) mutants (Supplementary Table S8). To validate the change, we generated cDNAs for either poly(A)+ transcripts or total transcripts (see section “Materials and Methods”) of four such genes. RT-qPCR experiments confirmed that the poly(A)+ transcripts were significantly up-regulated [Figure 3F, e.g., his-3 (poly(A)+)].
Interestingly, the total transcript levels of three replication-dependent histone genes were also up-regulated in smn-1(ok355) mutants (Figure 3F), except for his-60.
To investigate whether more histone transcripts would lead to increased protein expression, we generated transgenic animals expressing a his-41p::his-41::mCherry transgene (Figure 4A). Consistent with the up-regulation of endogenous histone genes by smn-1(ok355) (Figure 3F), the expression of the transgene was increased by ∼100% in smn-1(ok355) homozygotes compared to smn-1(ok355)/+ heterozygotes (Figure 4B). However, the mCherry fluorescence signals were similar between the two genotypes (Figures 4A,C). Similar observations were also made for his-35 and hil-3 (XG and LM, unpublished observations). Therefore, a transcript-independent mechanism(s) might be employed to regulate histone protein levels in vivo.
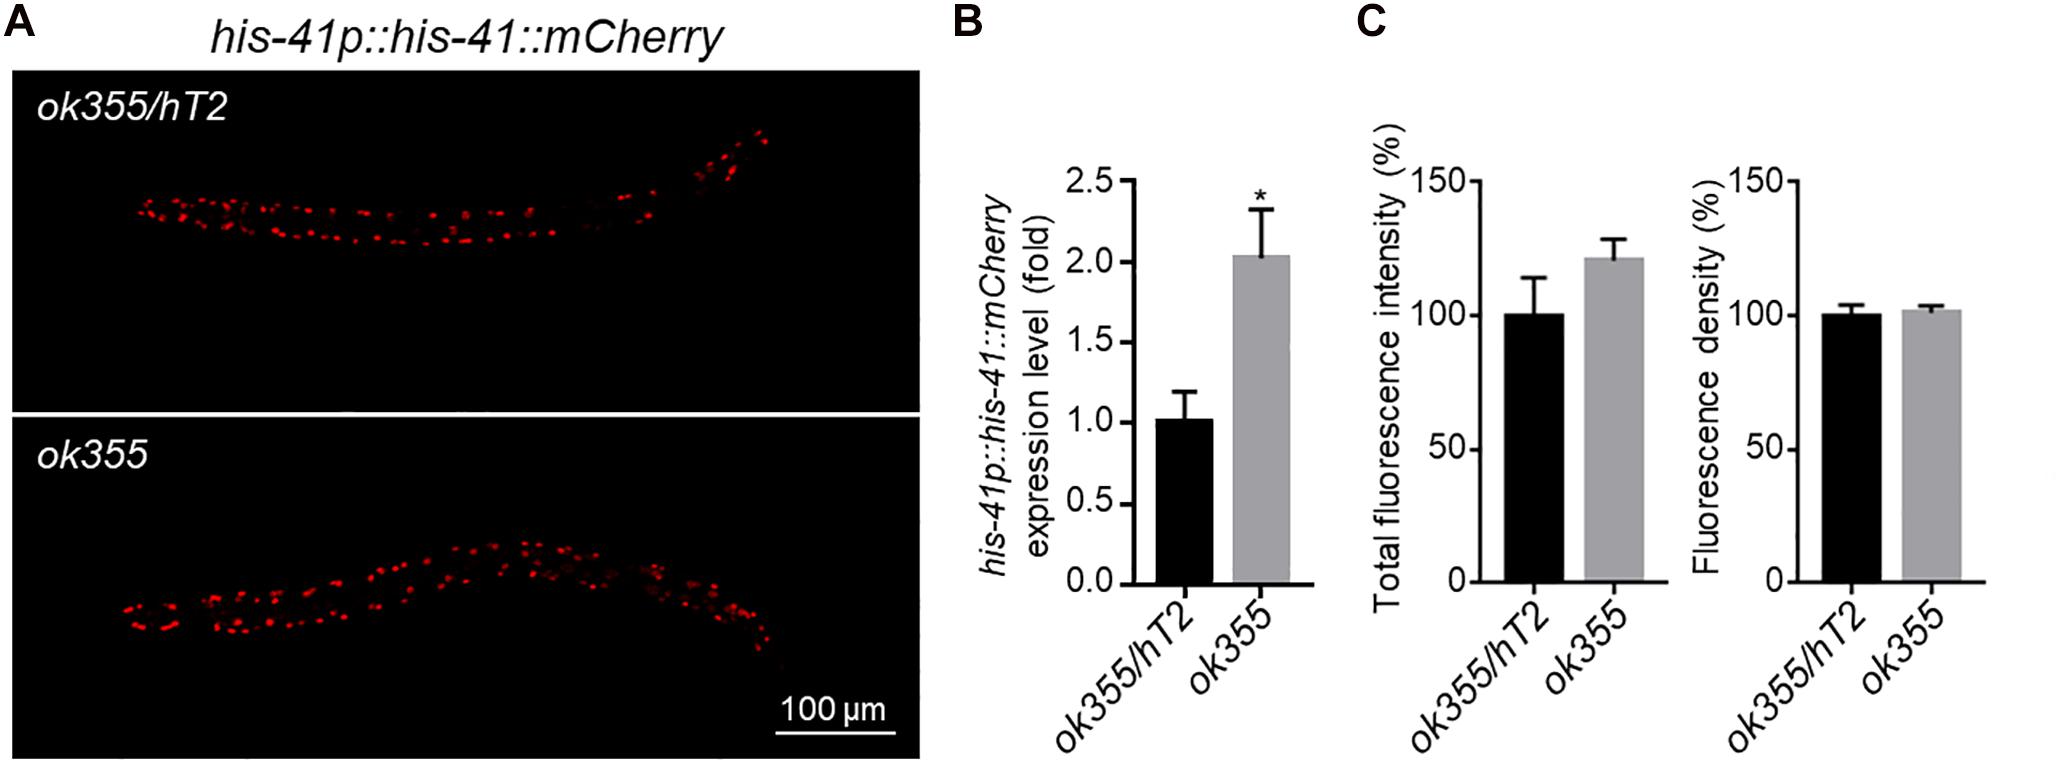
Figure 4. his-41p::his-41::mCherry transgene expression. (A) Representative fluorescence pictures of HIS-41::mCherry fusion protein expression in an smn-1(ok355)/hT2 heterozygous or an smn-1(ok355) homozygous animal. (B) RT-qPCR quantification of his-41::mCherry expression levels. (C) Quantification of the total fluorescence intensity (left) and density (right) of mCherry. For mRNA expression, each dataset is the average of three biological replicates from one transgenic line. For mCherry intensity, each dataset is the average of 20 transgenic animals in two transgenic lines, with 10 animals from each line. Statistics: two-tailed unpaired Student’s t-test. ∗p < 0.05. Error bars: standard errors.
The Effect of uaf-1(n4588) on DEGs of smn-1(ok355) Mutants
We previously found that the uaf-1(n4588) and uaf-1(n4588 n5127) mutations can partially suppress the defective behavior and lifespan of smn-1(ok355) mutants at late developmental stages when the defects are obvious (Gao et al., 2014). To understand how uaf-1(n4588) affects gene expression, we performed RNA-Seq on uaf-1(n4588) single and smn-1(ok355); uaf-1(n4588) double mutants at the pre-symptomatic stage (Figure 1A).
In smn-1(ok355); uaf-1(n4588) double mutants, the major KEGG pathways identified in smn-1(ok355) single mutants were no longer significant (Supplementary Figure S2 and Supplementary Tables S4, S9), though many DEGs were shared between the two mutants (Supplementary Tables S5, S6). We postulate that false negatives in the double mutants might render these pathways insignificant. To test this possibility, we compared the expression of eight genes deemed DEGs in smn-1(ok355) single mutants but not DEGs in the double mutants (Supplementary Figure S3A). Five of the eight genes had been validated before (Figures 3A,B), while three had not been. The RT-qPCR results showed that seven genes were false negatives in the double mutants (Supplementary Figures S3B,C, cox-15, C05C10.3, acdh-2, dhs-26, vha-6, vha-11 and vha-12). One gene appeared to be a real negative in the double mutants (Supplementary Figure S3B, T22B7.7).
The gene expression profiles of uaf-1(n4588) single mutants were similar to that of wild type (Figure 1A). 233 DEGs were identified in uaf-1(n4588) mutants, including 80 up-regulated and 153 down-regulated ones (Figure 1B). No KEGG pathways were significantly affected by these DEGs. A few affected GO terms include collagens or structural proteins of the cuticle (Supplementary Table S10). A comparison between uaf-1(n4588) single and smn-1(ok355); uaf-1(n4588) double mutants identified 1,743 DEGs, among which 1,010 were up-regulated and 733 down-regulated (Figure 1B).
We compared smn-1(ok355); uaf-1(n4588) double mutants with smn-1(ok355) single mutants and identified 349 DEGs (Figure 1B and Supplementary Table S11). No KEGG pathways were significantly affected by these DEGs. The two GO terms significantly affected were extracellular region and nutrient reservoir activity (Supplementary Table S11). We also identified individual DEGs related to life span, motor functions and neuron activities (Supplementary Table S11).
One hundred and fifty-two of the 349 DEGs in smn-1(ok355); uaf-1(n4588) vs. smn-1(ok355) comparison exhibited expression changes opposite to that in smn-1(ok355) vs. N2 comparison (Supplementary Table S12), among which the expression of 31 down-regulated genes in smn-1(ok355) was increased in the double mutants, while that of 121 up-regulated genes in smn-1(ok355) was decreased in the double mutants. Though it is interesting to speculate that some of these expression changes might underlie the suppression of smn-1(ok355) defects by uaf-1(n4588), caution has to be exercised in interpreting these results before the expression is validated and extensive analyses of gene functions are performed.
The Effect of smn-1(ok355) on Alternative Splicing
Our RNA-Seq results provide a list of candidate DEGs with altered splicing in smn-1(ok355) mutants, among which 18 genes (Supplementary Table S13) belonged to the mitochondrial and V-ATPase group. However, the predicted alternative splicing in 17 genes could not be validated by RT-PCR (Supplementary Table S13). The predicted intron retention was validated for the cpt-2 gene (Supplementary Table S13), while no significant difference was found between wild type and smn-1(ok355) mutants (Supplementary Table S13).
To further investigate how smn-1(ok355) affected alternative splicing, we examined nine genes (Figure 5 and Supplementary Figure S4) that exhibited altered splicing in uaf-1(n4588) mutant embryos. These genes were recently reported in a study about the interaction of uaf-1 with the RNA-binding motif gene rbm-5 (Zhou et al., 2018).
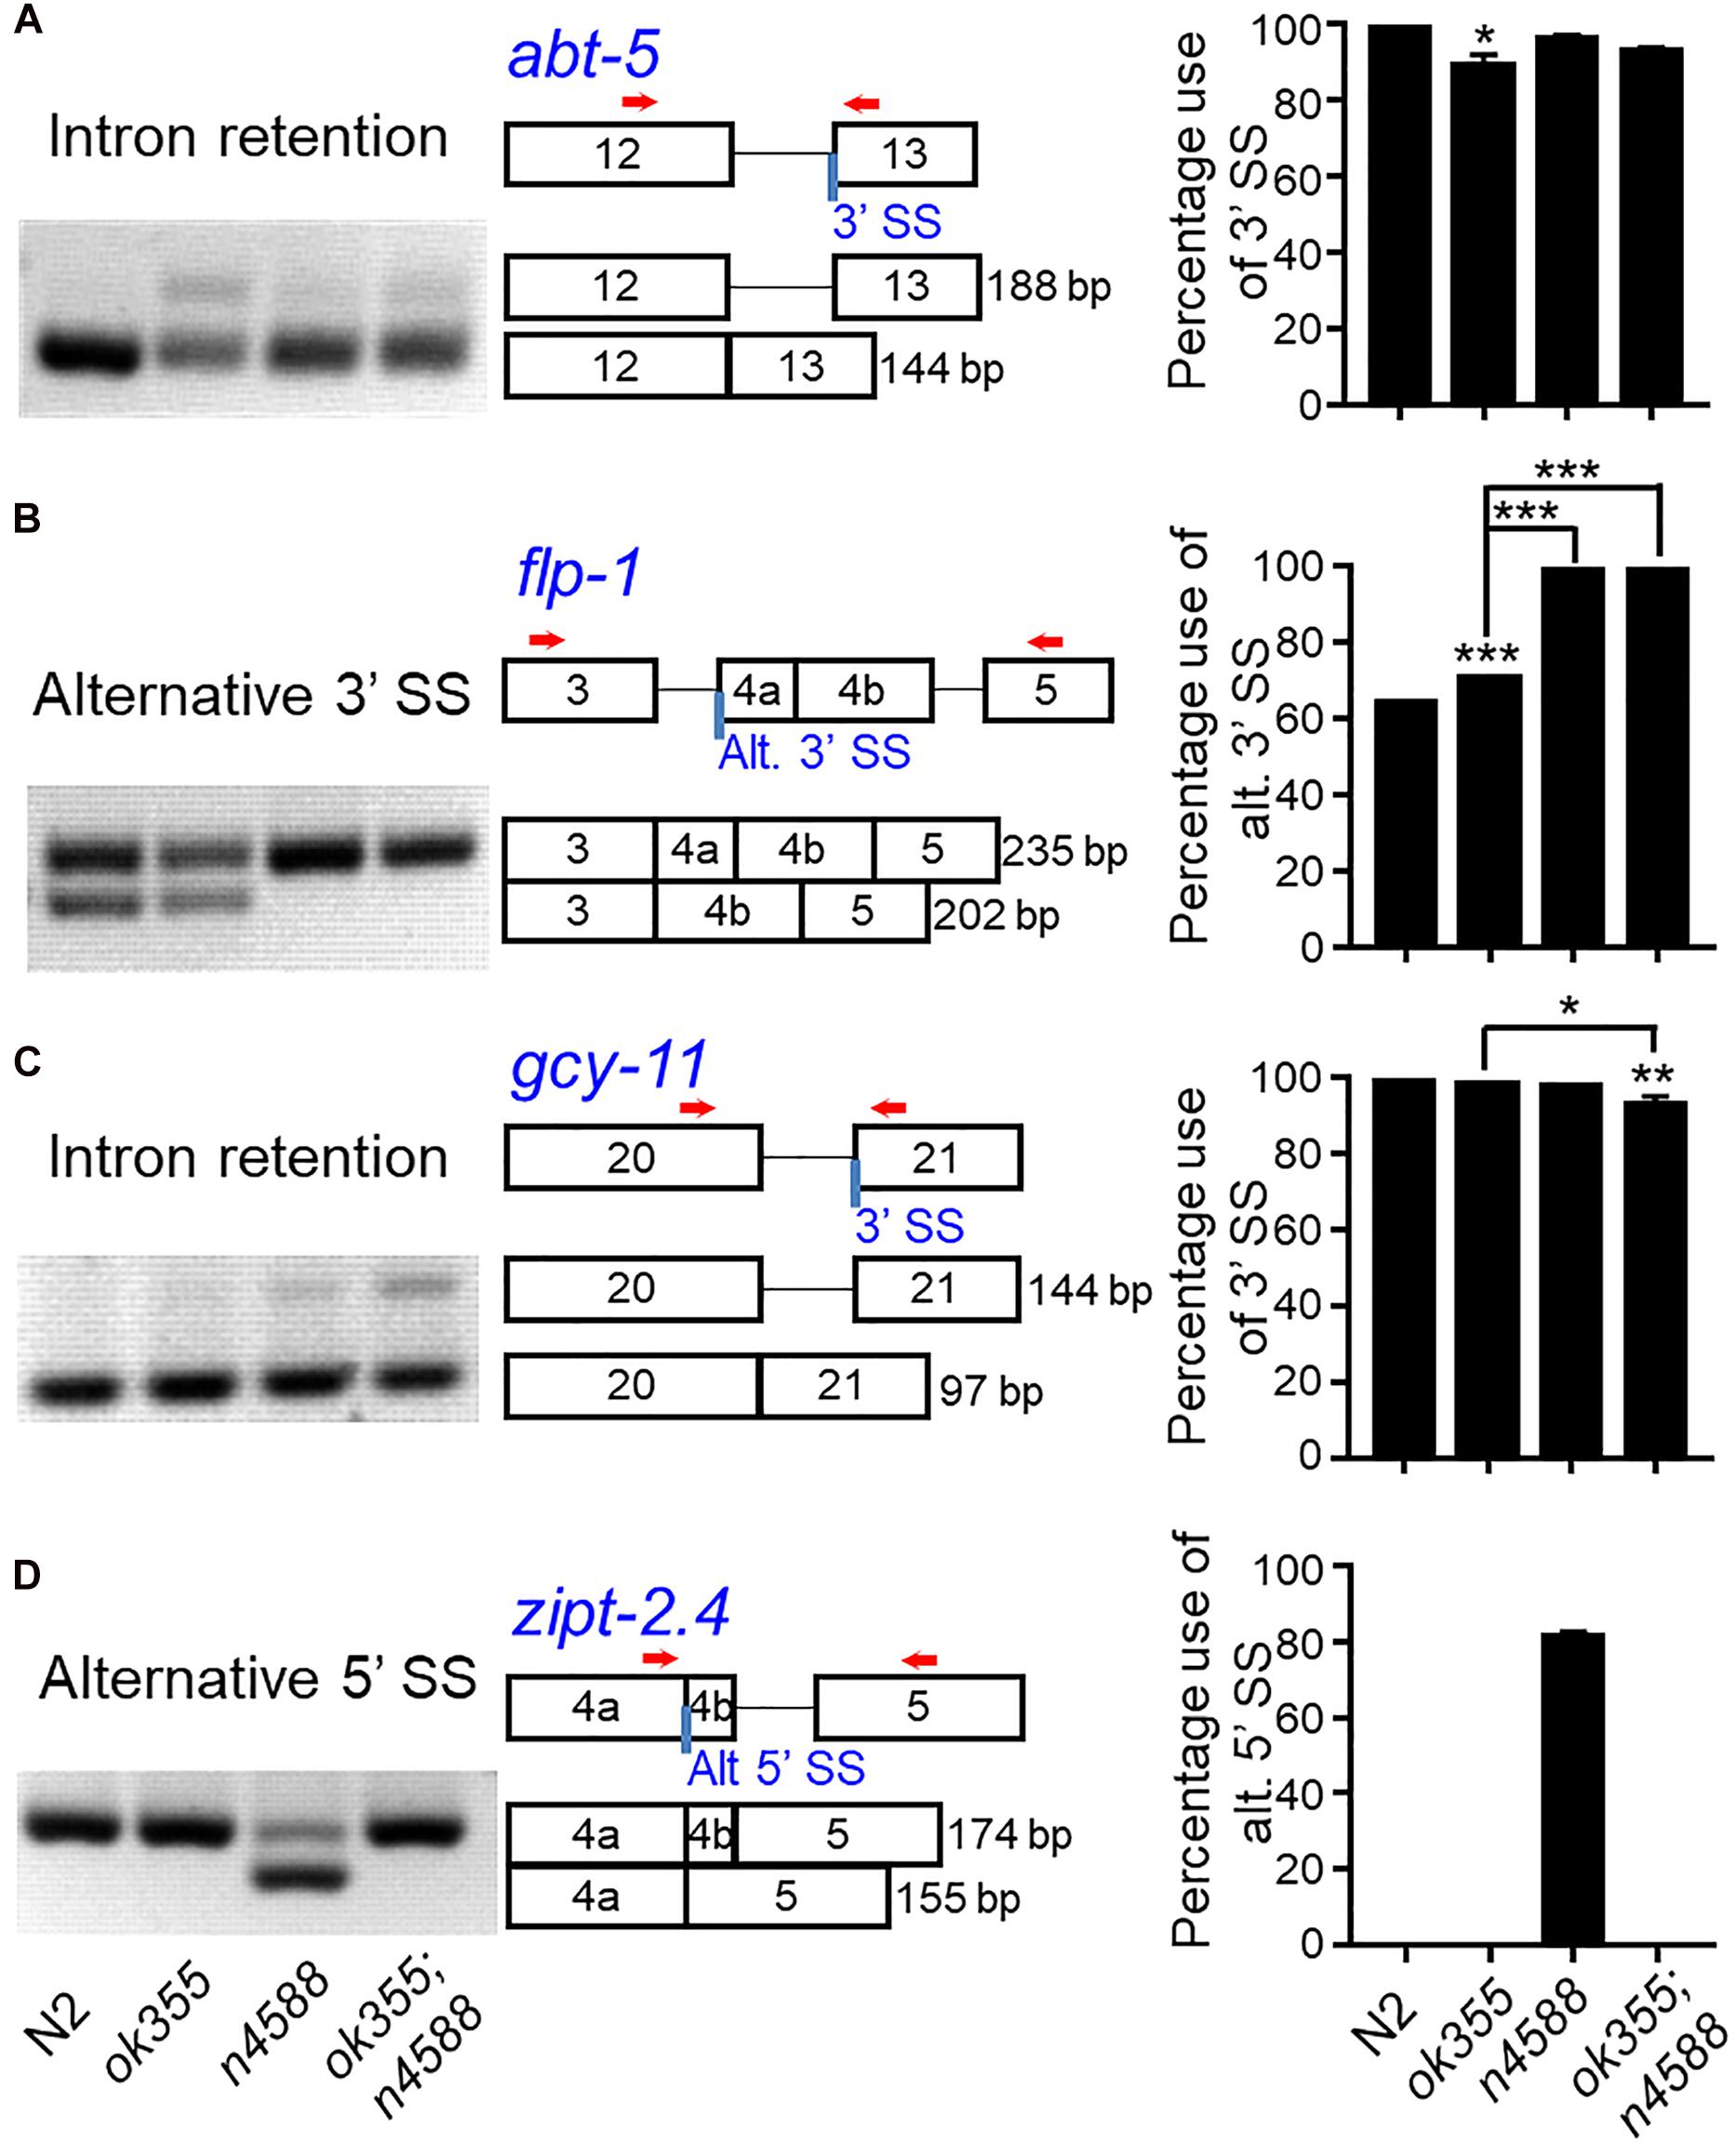
Figure 5. RT-PCR examination of alternative splicing in smn-1(ok355) mutants. smn-1(ok355) increased the intron retention of the abt-5 gene (A) and the recognition of an alternative 3′ splice site of the flp-1 gene (B). (C) smn-1(ok355) and uaf-1(n4588) together can increase the intron retention of the gcy-11 gene. (D) smn-1(ok355) can strongly suppress the recognition of a cryptic 5′ splice site in uaf-1(n4588) mutants. Representative gel pictures, gene structures and splicing quantifications are shown from left to right, with genotypes indicated at the bottom. Red arrows: positions of PCR primers. Each dataset is the average of three biological replicates. Statistics: Bonferroni multiple comparison with one-way ANOVA. ∗p < 0.05; ∗∗p < 0.01; ∗∗∗p < 0.001. Error bars: standard errors.
At the pre-symptomatic larval stage, RT-PCR showed that smn-1(ok355) could apparently increase the intron retention of the abt-5 gene (Figure 5A) and the splicing at an alternative 3′ splice site of the flp-1 gene (Figure 5B). smn-1(ok355) also appeared to act together with uaf-1(n4588) to increase the intron retention of the gcy-11 gene (Figure 5C). Surprisingly, smn-1(ok355) completely suppressed the recognition of a cryptic 5′ splice site within the zipt-2.4 gene in uaf-1(n4588) mutants, though smn-1 had no effect by itself (Figure 5D). For the other five genes, smn-1(ok355) did not alter their splicing in either wild-type or uaf-1(n4588) background (Supplementary Figure S4).
Discussion
In this study, we analyzed the global gene expression of a C. elegans model of SMA at the pre-symptomatic stage and validated the down-regulation of a subset of genes encoding mitochondrial, vacuolar H+-ATPase, UGTs and cytochrome P450. Different from mitochondrial and other genes, most histone genes were up-regulated in this model. Our findings suggest that abnormal expression of mitochondrial, V-ATPase and histone genes could be considered in understanding SMA pathogenesis.
Defective Expression of Mitochondrial and V-ATPase Genes in SMN Mutants
Abnormal expression and/or splicing of numerous genes are found in different SMA models, including human, mouse, zebrafish, Drosophila, C. elegans and S. pombe (Zhang et al., 2008, 2013; Baumer et al., 2009; Campion et al., 2010; Boulisfane et al., 2011; Lotti et al., 2012; Praveen et al., 2012; Garcia et al., 2013, 2016; Tisdale et al., 2013; Maeda et al., 2014; See et al., 2014; Sleigh et al., 2014; Miller et al., 2016; Bernabo et al., 2017; Jangi et al., 2017; O’Hern et al., 2017). Though multiple genes and pathways have been described, common molecular changes shared by these SMA models, except for snRNP formation, remain to be uncovered.
Mitochondrial dysfunctions have been described in human iPSC and zebrafish models of SMA (Xu C.C. et al., 2016; Boyd et al., 2017). Defective mitochondrial gene expression and mitochondrial dysfunction were detected in pre-symptomatic motor neurons of a mouse SMA model (Miller et al., 2016). Similarly, defective mitochondrial biogenesis was found in the muscles of SMA patients (Ripolone et al., 2015). We found that smn-1(ok355) caused reduced expression of multiple mitochondrial genes in C. elegans.
The molecular mechanisms underlying the effects of SMN on mitochondrial functions and gene expression remain to be understood. A recent study in C. elegans found that SMN-1 promotes the localization of mitochondria to the I bands of body wall muscles, which requires the Arp2/3 actin-nucleation complex (Schultz et al., 2017). Consistently, smn-1 deficiency causes defects in mitochondrial morphology and subcellular position in body wall muscles, a function likely independent of the regulation of RNA splicing by SMN-1 (Schultz et al., 2017). Together, these findings suggest that SMN can impact mitochondrial functions by different mechanisms, including the regulation of mitochondrial gene expression, mitochondrial morphology and subcellular localization.
Defects in the morphology, number and endocytosis of synaptic vesicles were described in human (Hosseinibarkooie et al., 2016; Riessland et al., 2017), mouse (Kong et al., 2009; Torres-Benito et al., 2011; Tejero et al., 2016; Xu Y. et al., 2016) and C. elegans (Dimitriadi et al., 2016) models of SMA. V-ATPases are proton pumps that regulate the acidity of a variety of cellular organelles, including lysosomes, exosomes, endosomes and synaptic vesicles (Futai, 2007). The reduced expression of multiple V-ATPase genes in smn-1(ok355) mutants might compromise the luminal acidity of these vesicles, causing defects in endosome, lysosome and/or synaptic vesicles. Hence, it is plausible that reduced V-ATPase expression could contribute to the vesicle defects in SMN mutants.
Multiple genes related to lifespan, motor functions and neuronal activities were also affected in smn-1(ok355) mutants (Supplementary Table S7). The related KEGG pathways or GO terms, however, were not significantly affected based on bioinformatics analyses (Supplementary Table S14). Though the expression of these genes is yet to be validated, it is interesting to note that the GO terms containing the largest numbers of DEGs include determination of adult lifespan, locomotion and neurogenesis (Supplementary Table S14). Further analyses of these genes might facilitate the understanding of the deterioration of the motor behavior and shortened lifespan of smn-1(ok355) mutants.
Up-Regulated Expression of Histone Genes in SMN Mutants
In mammals, SMN is required for the formation of U7 snRNP (Pillai et al., 2003) that cleaves after the stem-loop structure of replication-dependent histone transcripts to generate poly(A)- transcripts (Hoffmann and Birnstiel, 1990). In mouse cells, SMN deficiency leads to defective U7 snRNP formation and increased levels of poly(A)+ transcripts of replication-dependent histone genes (Tisdale et al., 2013). A previous transcriptome study on the spinal cord of a mouse model of SMA also found up-regulation of the histone cluster 1 genes (Baumer et al., 2009), which are replication-dependent. We found that poly(A)+ transcripts of replication-dependent histone genes were similarly up-regulated in smn-1(ok355) mutants. However, this up-regulation might not involve defective U7 snRNP formation like that in mouse, as conserved U7 snRNA sequence was not identified in the C. elegans genome by bioinformatics analyses (Dávila López and Samuelsson, 2008). Interestingly, C. elegans appears to have evolved an alternative pathway to cleave the transcripts of replication-dependent histone genes using the CSR-1 endogenous RNAi pathway in germline (Avgousti et al., 2012). It remains to be determined whether the CSR-1 RNAi pathway extends its effect to neurons and muscles.
Besides poly(A)+ transcripts, the total transcripts of three out of four replication-dependent histone genes, as well as four replication-independent histone genes, were also up-regulated in smn-1(ok355) mutants (Figure 3F). This result implies that smn-1 might broadly regulate histone gene expression by affecting their transcription, stability and/or degradation, the detailed mechanism of which remains to be elucidated.
Considering the functional multiplicity of SMN on RNA splicing, transcription, translation, mRNA trafficking and ncRNA biogenesis, etc. (Singh et al., 2017), caution has to be exercised when interpreting the expression changes of the aforementioned genes as SMN-1-specific. For example, some or all the changes of gene expression might be similarly caused by defects in transcription, splicing or RNA metabolism involving other biomolecules. Therefore, global gene expression studies on mutants of more splicing factors or gene expression regulators are warranted to clarify these possibilities.
The Effect of smn-1 on RNA Splicing and Gene Expression
Studies in human (Jangi et al., 2017), mouse (Zhang et al., 2008, 2013; Van Alstyne et al., 2018), Drosophila (Garcia et al., 2016), and S. pombe (Campion et al., 2010) suggest that SMN deficiency can cause intron retention and/or exon skipping, both likely due to reduced recognition of 3′ splice sites.
By examining nine previously validated alternative splicing events (Zhou et al., 2018), we found that smn-1(ok355) caused reduced recognition of weak 3′ splice sites in two genes (Figures 5A,C). This finding is consistent with our previous studies using the tos-1 reporter transgenes (Ma et al., 2011), in which we found that weak 3′ splice sites were preferably affected in smn-1(ok355) mutants (Gao et al., 2014).
The molecular mechanism underlying the down-regulated expression of genes in smn-1(ok355) mutants remains to be elucidated. It is plausible that smn-1 deficiency causes defective splicing of these transcripts and as a result generates pre-mature stop codons. Such transcripts are often degraded by non-sense-mediated mRNA decay (NMD) (He and Jacobson, 2015), causing down-regulated expression of the target genes. For the same reason, these defectively spliced transcripts will be undetectable by RT-PCR, which might explain why we were not able to detect obviously altered splicing in 18 down-regulated DEGs (Supplementary Table S13). Interestingly, similar observation was made with a mouse model of SMA, in which Baumer et al. (2009) found that altered splicing events were very few in the spinal cord at early or pre-symptomatic stages but abundant at a late symptomatic stage. Apparently, NMD could similarly underlie the shortage of detectable splicing events in this mouse model. We postulate that, besides NMD, other mechanisms might also be involved in the down-regulation. For example, smn-1 deficiency might cause reduced transcription or transcript stability of these genes. Future studies in NMD mutant backgrounds (Mango, 2001) should provide new insights into these potential mechanisms.
In C. elegans, knocking down smn-1 specifically in motor neurons can cause degeneration (Gallotta et al., 2016), suggesting that smn-1, like SMN1 in human, is essential for the survival of motor neurons. In both species, however, the molecular changes underlying the motor neuron degeneration have been elusive. Similar to the findings in this study, our previous analysis of the spinal cord motor neurons of a mouse SMA model also identified defective expression of numerous mitochondrial genes and defects in mitochondrial bioenergetics (Miller et al., 2016). It is plausible that defective mitochondrial gene expression, even at a partial level, would harm the health of spinal cord neurons. However, how much this defect would contribute to the degeneration remains to be understood. Since many other genes are also affected by smn-1, a key future task is to determine whether and how these genes affect the survival and functions of motor neurons in C. elegans.
Our validation of the down-regulated DEGs (Figures 3A–D) indicates that the expression of some genes in smn-1(ok355) mutants was reduced to ∼50% of the wild-type levels. Though not dramatic, this level of change appears reasonable, as it was detected at the pre-symptomatic stage of smn-1(ok355) mutants when a residual amount of maternal smn-1 product was probably still expressed. The defects in gene expression might become more severe when the mutants enter later developmental stages, in which the maternal smn-1 will be completely depleted. The expression of the plst-1 gene provides such an example (see below). In addition, if any of these DEGs contribute to the defects of smn-1(ok355) mutants, it is more likely that they do so together with other DEGs, while the effects of an individual or a few genes could be weak. Hence, it is important to identify a comprehensive list of DEGs before we can have a more impartial understanding of the molecular changes related to the defects of smn-1(ok355) mutants.
The human PLS3 gene was identified as a protective modifier of SMA (Oprea et al., 2008). We previously found that the expression of plst-1, the C. elegans ortholog of PLS3, was significantly down-regulated in smn-1(ok355) mutants at later developmental stages (3 days or 5 days after the L1 stage) (Gao et al., 2014). In the RNA-Seq results, plst-1 was not identified as a DEG (fold change = 0.797, p-value = 0.77), suggesting that plst-1 expression might not be severely affected at the pre-symptomatic stage of smn-1(ok355) mutants.
The expression levels of U snRNAs could not be extracted from the RNA-Seq results because only poly(A)+ mRNAs were examined by the RNA-Seq experiments (see section “Materials and Methods”). We therefore used RT-qPCR to quantify their expression. The results showed that U2 and U4 were significantly up-regulated in smn-1(ok355) mutants (Supplementary Figure S5). In previous studies, we found that U2, U4, and U6 were also up-regulated in smn-1(ok355) mutants at later developmental stages (Gao et al., 2014). Though it is unclear what mechanism underlies this change, one possibility is that the up-regulation of these U snRNAs is a feedback response to smn-1 deficiency. Alternatively, smn-1 might negatively affect the expression of U2, U4, and U6. It remains to be determined whether the formation of U snRNPs is also affected in smn-1(ok355) mutants at the pre-symptomatic stage. Nevertheless, these results suggest that smn-1 can exert differential effects on the expression of U snRNAs and uncovering the underlying mechanism might facilitate our understanding of SMN functions.
smn-1 and uaf-1 Interact to Affect Alternative Splicing and Gene Expression
Intriguingly, smn-1 was required for the recognition of a cryptic 5′ splice site in uaf-1(n4588) background (Figure 5D, zipt-2.4) (Zhou et al., 2018). Such an activity of smn-1 is comparable to that of the rbm-5 gene (Zhou et al., 2018), which encodes an RNA-binding motif-containing splicing factor homologous to the tumor suppressor RBM5 (Sutherland et al., 2010). We postulate that RBM-5 might facilitate the recognition of this cryptic 5′ splice site at the initiation of splicing with direct or indirect assistance from the UAF-1(n4588) mutant protein, while snRNPs assembled by SMN-1 are required in parallel or in subsequent splicing reactions. In the absence of either RBM-5 or SMN-1, splicing at this cryptic site would not proceed, leading to the suppression. This finding raised the possibility that regulated snRNP formation might be utilized to increase the fidelity of RNA splicing by limiting splicing at cryptic sites.
We hypothesize two potential mechanisms that underlie the suppression of smn-1(ok355) by uaf-1(n4588) (Gao et al., 2014). Under one circumstance, the altered splicing or expression of some genes caused by smn-1(ok355) might be ameliorated by uaf-1(n4588), which would lead to the suppression. Under an alternative circumstance, the altered splicing or expression of a new set of genes might impact the phenotype of smn-1(ok355); uaf-1(n4588) double mutants, leading to the suppression.
It appears that the splicing of the abt-5 gene (Figure 5A) is consistent with the first circumstance: the presence of uaf-1(n4588) suppressed the defective splicing at the 3′ splice site in smn-1(ok355) mutants. We found that uaf-1(n4588) also suppressed the up-regulated expression of two genes in smn-1(ok355) background (Supplementary Figure S3B). Considering that uaf-1(n4588) can increase or decrease the recognition of 3′ splice sites in a gene-specific manner (Ma and Horvitz, 2009; Ma et al., 2011; Zhou et al., 2018), such a suppression might result from reduced splicing of these two genes caused by uaf-1(n4588), which might generate splicing isoforms that are degraded by NMD. Alternatively, uaf-1(n4588) might affect a gene that is required for the normal expression of these genes. Similarly, expression studies in an NMD mutant background should help dissect these potential mechanisms.
In short, we identified the defective expression of a broad spectrum of genes that encode mitochondrial, V-ATPase, histone, UGT and cytochrome P450 proteins as a probable pre-symptomatic effect of smn-1 deficiency in C. elegans. The splicing of a subset of genes was also partially affected at this stage. Though the molecular mechanisms underlying this phenomenon remain to be investigated, our results, together with findings in other SMA models, suggest a cross-species effect of SMN on mitochondrial and histone gene expression. Future examination of the expression of more genes and analyses of their functions should further the understanding of SMN functions.
Materials and Methods
Strains
Caenorhabditis elegans strains were grown at 20°C, unless otherwise indicated. N2 (Bristol) was the reference wild-type strain. Strains used in this study include:
LM99 smn-1(ok355) I/hT2[bli-4(e937) let-?(q782) qIs48](I, III) (Briese et al., 2009)
MT16492 uaf-1(n4588) III (Ma and Horvitz, 2009)
CSM1111 smn-1(ok355) I/hT2[bli-4(e937) let-?(q782) qIs48] (I; III); uaf-1(n4588) III
CSM1112 smn-1(ok355) I/hT2[bli-4(e937) let-?(q782) qIs48] (I; III); macEx588[hil-3::mCherry; myo-3p::GFP]
CSM1113 smn-1(ok355) I/hT2[bli-4(e937) let-?(q782) qIs48] (I; III); macEx589[his-35::mCherry; myo-3p::GFP]
CSM1114 smn-1(ok355) I/hT2[bli-4(e937) let-?(q782) qIs48] (I; III); macEx590[his-41::mCherry; myo-3p::GFP]
CSM1111 was grown at 15°C before being analyzed at 20°C.
RNA-Seq and Transcriptome Analyses
smn-1(ok355) homozygous mutants arrest at late larval stages and were maintained as heterozygotes using the balancer hT2 (I; III). Heterozygous mutants or wild-type animals were synchronized by bleaching and allowed to grow for 2 days post the L1 larval stage. For smn-1(ok355) single mutants or smn-1(ok355); uaf-1(n4588) double mutants, ∼2,500 individuals were picked for each biological replicate under a fluorescence dissecting microscope (Olympus SZX16). Animals were washed with M9 three times and kept in M9 for 3 h to remove intestinal bacteria. Total RNAs were extracted using TRI Reagent Solution according to manufacturer’s instructions (Invitrogen).
RNA-Seq was performed by Annoroad Gene Technology (Beijing). Specifically, mRNAs were enriched with oligo(dT) beads. The constructed libraries were sequenced as 150 bp paired-ends on an Illumina platform. Raw data was filtered by Perl scripts using the following criteria: (1) reads containing more than five adapter-polluted bases were filtered out; (2) reads with the number of low quality bases (Phred quality value < 19) in more than 15% of total bases were removed; (3) reads with the number of N bases accounting for more than 5% were removed; (4) both reads would be filtered out if either one of the paired-end reads was adaptor-polluted.
More than 39 million mapped reads and more than 6 GB of clean bases were obtained for each sample (Supplementary Table S15). Bowtie/Bowtie2 was used for building C. elegans genome index, and clean data was mapped to the reference genome (WS235) using TopHat v2.0.12. Differential gene expression analysis was performed by DESeq v1.14.0. The p-value was adjusted by Benjamini and Hochberg’s method as q-value for controlling false discovery rate (FDR). Genes with q ≤ 0.05 and | log2_ratio|≥ 1 were identified as DEGs.
Alternative splicing events were predicted by ASprofile v1.0.44, a package of software programs for analyzing alternative splicing events from RNA-Seq data. The ratio of a given alternative splicing event was determined by the following formula, e.g., the percentage of an intron retention event = FPKMwithintron/(FPKMwithintron + FPKMwithoutintron). The ratios of the same splicing event were compared between genotypes to identify potential splicing differences.
KEGG and GO enrichment analyses on the DEGs were implemented by hypergeometric test using all genes in the C. elegans genome (WS235) with annotated functions in the two databases as the background gene set. P-value for the enrichment level was calculated and adjusted as q-value. KEGG or GO terms with q ≤ 0.05 were considered significantly affected by the DEGs.
In total, two biological replicates for wild-type animals or smn-1(ok355); uaf-1(n4588) double mutants and three biological replicates for uaf-1(n4588) or smn-1(ok355) single mutants were analyzed by RNA-Seq. We examined the correlation coefficients between the biological replicates for each genotype (Supplementary Figure S6) and found that except for smn-1(ok355); uaf-1(n4588), replicates of all other genotypes were highly correlated (r > 0.9). The coefficient for the two replicates of smn-1(ok355); uaf-1(n4588) mutants was 0.8260 (Supplementary Figure S6), which might explain why we detected a significant number of false negative DEGs in these mutants (Supplementary Figure S3).
RT-PCR Experiments
Synchronized animals were grown on NGM plates for 2 days post L1. For smn-1(ok355) and smn-1(ok355); uaf-1(n4588) mutants, ∼250 animals were picked for each biological replicate. Total RNAs were prepared using TRI Reagent Solution (Invitrogen) with 15 μg yeast tRNA (Invitrogen) added as co-precipitant, followed by RNase-Free DNase I (TAKARA) digestion. cDNAs were synthesized with random hexamers using Maxima First Strand cDNA Synthesis Kit (Thermo Scientific) or with oligo(dT)20 primers (only for replication-dependent histone genes) using SuperScript IV First-Strand Synthesis System (Invitrogen). 2 μg total RNA (including yeast tRNA as co-precipitant) from each sample was used for RT experiments. qPCR was performed using Maxima SYBR Green qPCR Master Mix (Thermo Scientific) on a Bio-Rad CFX96 real-time cycler. The reaction mix contains 2 μL of diluted template (derived from 5 ng total RNA) and 0.3 μM of each primer in a final volume of 15 μL. Thermal cycling was performed using a two-step cycling protocol: 10 min at 95°C, followed by 40 cycles of 15 s at 95°C and 60 s at 60°C. Bio-Rad CFX Manager v3.0 was used to calculate the relative expression level of each gene with tba-1 as the reference gene. Melting curve for each sample contained one single peak. Alternative splicing was detected using the following PCR protocol: 90 s at 94°C, followed by 40 cycles of 15 s at 94°C, 15 s at 60°C and 30 s at 72°C, with a final extension of 3 min at 72°C. The proportion of each splice isoform was quantified using ImageJ 1.52a. Three biological replicates were analyzed for each genotype. PCR primers are listed in Supplementary Table S16.
Plasmids
his-41 expression plasmid was constructed using the In-Fusion HD Cloning Kit (Clontech) following the manufacturer’s instruction. First, the genomic fragment containing the full-length his-41 CDS and a 1.1 kb endogenous promoter was amplified and subcloned into pMD18T vector (Takara). Second, the mCherry gDNA from the pCFJ90 (myo-2p::mCherry) plasmid (Frokjaer-Jensen et al., 2008) and a 3′ UTR fragment (0.9 kb downstream of the his-41 stop codon) were amplified and subcloned into pMD18T-his-41p::his-41 gDNA backbone using the KpnI site.
The his-35 and hil-3 expression plasmids were constructed in a similar manner. For his-35, a 1.3 kb promoter and a 1.2 kb 3′ UTR were used. For hil-3, a 1.8 kb promoter and a 0.6 kb 3′ UTR were used. All plasmids were verified by sequencing. Primers for plasmid construction are listed in Supplementary Table S16.
Transgene Experiments
Germline transgene experiments were performed as described (Mello et al., 1991). The transgenic mixture contained 20 ng/μL of the transgene of interest with 20 ng/μL of pPD95_86-myo-3p::GFP as co-injection marker.
C. elegans Microscopy
Synchronized animals were mounted on 2% (vol/vol) agar pads on day 2 post the L1 larval stage and immobilized using 40 mM NaN3 in M9 buffer. Images were captured with Zeiss 880 confocal microscope (10× objective). Total fluorescence intensity was quantified as un-calibrated OD, and fluorescence density was calculated using total intensity divided by area using ImageJ 1.52a.
Statistics
P-values were determined by two-tailed unpaired Student’s t-test for pairwise comparison or Bonferroni multiple comparison with one-way ANOVA for multiple comparison using GraphPad Prism 7.0 software.
Author Contributions
XG and LM designed the experiments. XG performed the genetic, molecular, and transcriptome analyses with the assistance of JX, HC, DX, WP, and CZ. XG, YCM, and LM wrote the manuscript. LM managed the project.
Funding
The study was supported by National Natural Science Foundation of China grants (31371253 and 31571045) and a MOST grant (2016YFC1201805) to LM and by National Institutes of Health grant numbers R01NS094564 and R21NS106307, and grants from The Hartwell Foundation, Cure SMA and the Chicago Biomedical Consortium to YCM. YCM is the Ann Marie and Francis Klocke M.D. Research Scholar supported by the Joseph and Bessie Feinberg Foundation.
Conflict of Interest Statement
The authors declare that the research was conducted in the absence of any commercial or financial relationships that could be construed as a potential conflict of interest.
Acknowledgments
We thank members of the Ma laboratory for suggestions. Some strains were provided by the CGC, which was funded by NIH Office of Research Infrastructure Programs (P40 OD010440).
Supplementary Material
The Supplementary Material for this article can be found online at: https://www.frontiersin.org/articles/10.3389/fgene.2019.00410/full#supplementary-material
FIGURE S1 | Expression levels of predicted DEGs not confirmed by RT-qPCR. (A) Mitochondrial genes. Genes in red are encoded by the mitochondrial genome and genes in black by the nuclear genome. (B) V-ATPase genes. (C) UGT genes. (D) CYP genes. Each dataset is the average of three biological replicates. Statistics: two-tailed unpaired Student’s t-test. Error bars: standard errors.
FIGURE S2 | Comparison of affected KEGG pathways and GO cellular component terms between smn-1(ok355) single and smn-1(ok355); uaf-1(n4588) double mutants. (A) Comparison of affected KEGG pathways between smn-1(ok355) single and smn-1(ok355); uaf-1(n4588) double mutants using wild type as reference. (B) Comparison of affected GO cellular component terms between smn-1(ok355) single and smn-1(ok355); uaf-1(n4588) double mutants. Note, the KEGG pathways and GO terms for smn-1(ok355) single mutants, which are presented in Figure 2, are shown here for comparison purpose. The colors of the scale bars indicate the statistical significance (q-value) of the affected pathways or terms, with q-value above 0.05 considered non-significant.
FIGURE S3 | RT-qPCR quantification of mitochondrial and V-ATPase gene expression in smn-1(ok355); uaf-1(n4588) double mutants. (A) List of selected genes with predicted significant changes in smn-1(ok355) single mutants but insignificant changes in smn-1(ok355); uaf-1(n4588) double mutants. Fold changes and q values are derived from RNA-Seq results. (B) Expression levels of mitochondrial genes. (C) Expression levels of V-ATPase genes. Each dataset is the average of three biological replicates. Statistics: Bonferroni multiple comparison with one-way ANOVA. ∗p < 0.05; ∗∗p < 0.01; ∗∗∗p < 0.001. Error bars: standard errors.
FIGURE S4 |smn-1(ok355) does not obviously affect the alternative splicing of five other genes in the wild-type or uaf-1(n4588) background. Gene names are on the left. Representative gel pictures, gene structures and splicing quantifications are shown from left to right, with genotypes indicated at the bottom. Red arrows: positions of PCR primers. Each dataset is the average of three biological replicates. Statistics: Bonferroni multiple comparison with one-way ANOVA. ∗p < 0.05; ∗∗p < 0.01; ∗∗∗p < 0.001. Error bars: standard errors.
FIGURE S5 | RT-qPCR quantification of U snRNA expression in smn-1(ok355) mutants at the pre-symptomatic stage. cDNAs of U snRNAs were generated by reverse transcription using random oligo primers. Each dataset is the average of three biological replicates. Statistics: two-tailed unpaired Student’s t-test. ∗p < 0.05, ∗∗∗p < 0.001. Error bars: standard errors.
FIGURE S6 | Scatter plots comparing the expression levels of all detectable genes between biological replicates of different genotypes. (A) N2a sample vs. N2b sample comparison. (B) smn-1(ok355)a vs. smn-1(ok355)b. (C) smn-1(ok355)a vs. smn-1(ok355)c. (D) smn-1(ok355)b vs. smn-1(ok355)c. (E) uaf-1(n4588)a vs. uaf-1(n4588)b. (F) uaf-1(n4588)a vs. uaf-1(n4588)c. (G) uaf-1(n4588)b vs. uaf-1(n4588)c. (H) smn-1(ok355); uaf-1(n4588)a vs. smn-1(ok355); uaf-1(n4588)b. The correlation coefficient (r) for each comparison is indicated. Each dot represents a unique gene.
TABLE S1 | List of all DEGs in smn-1(ok355) single mutants. Genes were sorted to an up-regulated group and a down-regulated group. DEGs with gradually increasing q-values are listed from the top to the bottom.
TABLE S2 | List of top 200 up-regulated DEGs and top 200 down-regulated DEGs in smn-1(ok355) single mutants. DEGs with gradually decreasing fold changes are listed from the top to the bottom. Up-regulated DEGs are highlighted in red, and down-regulated DEGs are highlighted in green.
TABLE S3 | RNA-Seq raw sequencing reads and FPKMs of smn-1 transcripts in different biological replicates.
TABLE S4 | List of DEGs in affected KEGG pathways in smn-1(ok355) single mutants.
TABLE S5 | List of non-redundant DEGs in affected KEGG pathways in smn-1(ok355) single mutants. Shared DEGs between smn-1(ok355) single mutants and smn-1(ok355); uaf-1(n4588) double mutants are highlighted in red.
TABLE S6 | List of non-redundant DEGs in affected GO cellular component terms in smn-1(ok355) single mutants. Shared DEGs between smn-1(ok355) single mutants and smn-1(ok355); uaf-1(n4588) double mutants are highlighted in red. Some genes annotated in GO but not in KEGG, e.g., dhs-26 and T22B7.7, were validated in Supplementary Figure S3.
TABLE S7 | List of DEGs in GO terms related to lifespan, motor functions or neuron activities in smn-1(ok355) mutants. DEGs related to mitochondrion are highlighted in red, and those related to V-ATPases are highlighted in green. atp-2, C47E12.2, msra-1 and W03A5.1 are related to both lifespan and motor functions.
TABLE S8 | List of DEGs encoding mitochondrial proteins, V-ATPases, UDP glycosyltransferases, cytochrome P450 proteins and histones in smn-1(ok355) single mutants. Genes selected for RT-qPCR validation are highlighted in red. Validation results are indicated in Column B.
TABLE S9 | List of DEGs in affected KEGG pathways in smn-1(ok355); uaf-1(n4588) double mutants.
TABLE S10 | Affected GO terms in uaf-1(n4588) single mutants.
TABLE S11 | List of DEGs in GO terms from the comparison between smn-1(ok355); uaf-1(n4588) and smn-1(ok355). DEGs related to mitochondrion are highlighted in red. vit-1 to vit-6 are related to both extracellular region and nutrient reservoir activity. F35D2.3, slt-1 and W03F11.4 are related to both extracellular region and motor functions or neuron activities.
TABLE S12 | List of DEGs the expression of which was significantly changed to the opposite direction in smn-1(ok355); uaf-1(n4588) vs. smn-1(ok355) comparison relative to the smn-1(ok355) vs. N2 comparison.
TABLE S13 | List of mitochondrial and V-ATPase DEGs with altered splicing in smn-1(ok355) mutants as predicted by RNA-Seq.
TABLE S14 | DEG-associated GO terms (biological processes) related to lifespan, motor functions or neuron activities in smn-1(ok355) mutants.
TABLE S15 | Total RNA-Seq reads of each biological replicate.
TABLE S16 | List of primers for RT-PCR experiments and transgene construction.
Footnotes
- ^ https://www.genome.jp/kegg/
- ^ www.wormbase.org
- ^ http://www.geneontology.org
- ^ https://ccb.jhu.edu/software/ASprofile/
References
Alkema, M. J., Hunter-Ensor, M., Ringstad, N., and Horvitz, H. R. (2005). Tyramine functions independently of octopamine in the Caenorhabditis elegans nervous system. Neuron 46, 247–260. doi: 10.1016/j.neuron.2005.02.024
Avgousti, D. C., Palani, S., Sherman, Y., and Grishok, A. (2012). CSR-1 RNAi pathway positively regulates histone expression in C. elegans. EMBO J. 31, 3821–3832. doi: 10.1038/emboj.2012.216
Baumer, D., Lee, S., Nicholson, G., Davies, J. L., Parkinson, N. J., Murray, L. M., et al. (2009). Alternative splicing events are a late feature of pathology in a mouse model of spinal muscular atrophy. PLoS Genet. 5:e1000773. doi: 10.1371/journal.pgen.1000773
Bernabo, P., Tebaldi, T., Groen, E. J. N., Lane, F. M., Perenthaler, E., Mattedi, F., et al. (2017). In Vivo translatome profiling in spinal muscular atrophy reveals a role for SMN protein in ribosome biology. Cell Rep. 21, 953–965. doi: 10.1016/j.celrep.2017.10.010
Bertrandy, S., Burlet, P., Clermont, O., Huber, C., Fondrat, C., Thierry-Mieg, D., et al. (1999). The RNA-binding properties of SMN: deletion analysis of the zebrafish orthologue defines domains conserved in evolution. Hum. Mol. Genet. 8, 775–782. doi: 10.1093/hmg/8.5.775
Boulisfane, N., Choleza, M., Rage, F., Neel, H., Soret, J., and Bordonné, R. (2011). Impaired minor tri-snRNP assembly generates differential splicing defects of U12-type introns in lymphoblasts derived from a type I SMA patient. Hum. Mol. Genet. 20, 641–648. doi: 10.1093/hmg/ddq508
Boyd, P. J., Tu, W. Y., Shorrock, H. K., Groen, E. J. N., Carter, R. N., Powis, R. A., et al. (2017). Bioenergetic status modulates motor neuron vulnerability and pathogenesis in a zebrafish model of spinal muscular atrophy. PLoS Genet. 13:e1006744. doi: 10.1371/journal.pgen.1006744
Briese, M., Esmaeili, B., Fraboulet, S., Burt, E. C., Christodoulou, S., Towers, P. R., et al. (2009). Deletion of smn-1, the Caenorhabditis elegans ortholog of the spinal muscular atrophy gene, results in locomotor dysfunction and reduced lifespan. Hum. Mol. Genet. 18, 97–104. doi: 10.1093/hmg/ddn320
Burghes, A. H., and Beattie, C. E. (2009). Spinal muscular atrophy: why do low levels of survival motor neuron protein make motor neurons sick? Nat. Rev. Neurosci. 10, 597–609. doi: 10.1038/nrn2670
Burt, E. C., Towers, P. R., and Sattelle, D. B. (2006). Caenorhabditis elegans in the study of SMN-interacting proteins: a role for SMI-1, an orthologue of human Gemin2 and the identification of novel components of the SMN complex. Invert Neurosci. 6, 145–159. doi: 10.1007/s10158-006-0027-x
Campion, Y., Neel, H., Gostan, T., Soret, J., and Bordonné, R. (2010). Specific splicing defects in S. pombe carrying a degron allele of the survival of motor neuron gene. EMBO J. 29, 1817–1829. doi: 10.1038/emboj.2010.70
Cartegni, L., Hastings, M. L., Calarco, J. A., de Stanchina, E., and Krainer, A. R. (2006). Determinants of exon 7 splicing in the spinal muscular atrophy genes, SMN1 and SMN2. Am. J. Hum. Genet. 78, 63–77. doi: 10.1086/498853
Chang, H. C., Dimlich, D. N., Yokokura, T., Mukherjee, A., Kankel, M. W., Sen, A., et al. (2008). Modeling spinal muscular atrophy in Drosophila. PLoS One 3:e3209. doi: 10.1371/journal.pone.0003209
Custer, S. K., and Androphy, E. J. (2014). Autophagy dysregulation in cell culture and animals models of spinal muscular atrophy. Mol. Cell. Neurosci. 61, h. doi: 10.1016/j.mcn.2014.06.006
Dávila López, M., and Samuelsson, T. (2008). Early evolution of histone mRNA 3’ end processing. RNA 14, 1–10. doi: 10.1261/rna.782308
Dimitriadi, M., Derdowski, A., Kalloo, G., Maginnis, M. S., O’Hern, P., Bliska, B., et al. (2016). Decreased function of survival motor neuron protein impairs endocytic pathways. Proc. Natl. Acad. Sci. U.S.A. 113, E4377–E4386.
Dimitriadi, M., Kye, M. J., Kalloo, G., Yersak, J. M., Sahin, M., and Hart, A. C. (2013). The neuroprotective drug riluzole acts via small conductance Ca2+-activated K+ channels to ameliorate defects in spinal muscular atrophy models. J. Neurosci. 33, 6557–6562. doi: 10.1523/jneurosci.1536-12.2013
Dimitriadi, M., Sleigh, J. N., Walker, A., Chang, H. C., Sen, A., Kalloo, G., et al. (2010). Conserved genes act as modifiers of invertebrate SMN loss of function defects. PLoS Genet. 6:e1001172. doi: 10.1371/journal.pgen.1001172
Edens, B. M., Ajroud-Driss, S., Ma, L., and Ma, Y. C. (2015). Molecular mechanisms and animal models of spinal muscular atrophy. Biochim. Biophys. Acta 1852, 685–692.
Fischer, U., Liu, Q., and Dreyfuss, G. (1997). The SMN-SIP1 complex has an essential role in spliceosomal snRNP biogenesis. Cell 90, 1023–1029. doi: 10.1016/s0092-8674(00)80368-2
Frokjaer-Jensen, C., Davis, M. W., Hopkins, C. E., Newman, B. J., Thummel, J. M., Olesen, S. P., et al. (2008). Single-copy insertion of transgenes in Caenorhabditis elegans. Nat. Genet. 40, 1375–1383. doi: 10.1038/ng.248
Futai, M. (2007). Our research on proton pumping ATPases over three decades: their biochemistry, molecular biology and cell biology. Proc. Jpn. Acad. Ser. B Phys. Biol. Sci. 82, 416–438. doi: 10.2183/pjab.82.416
Gallotta, I., Mazzarella, N., Donato, A., Esposito, A., Chaplin, J. C., Castro, S., et al. (2016). Neuron-specific knock-down of SMN1 causes neuron degeneration and death through an apoptotic mechanism. Hum. Mol. Genet. 25, 2564–2577.
Gao, X., Teng, Y., Luo, J., Huang, L., Li, M., Zhang, Z., et al. (2014). The survival motor neuron gene smn-1 interacts with the U2AF large subunit gene uaf-1 to regulate Caenorhabditis elegans lifespan and motor functions. RNA Biol. 11, 1148–1160. doi: 10.4161/rna.36100
Garcera, A., Bahi, N., Periyakaruppiah, A., Arumugam, S., and Soler, R. M. (2013). Survival motor neuron protein reduction deregulates autophagy in spinal cord motoneurons in vitro. Cell Death Dis. 4:e686. doi: 10.1038/cddis.2013.209
Garcia, E. L., Lu, Z., Meers, M. P., Praveen, K., and Matera, A. G. (2013). Developmental arrest of Drosophila survival motor neuron (Smn) mutants accounts for differences in expression of minor intron-containing genes. RNA 19, 1510–1516. doi: 10.1261/rna.038919.113
Garcia, E. L., Wen, Y., Praveen, K., and Matera, A. G. (2016). Transcriptomic comparison of Drosophila snRNP biogenesis mutants reveals mutant-specific changes in pre-mRNA processing: implications for spinal muscular atrophy. RNA 22, 1215–1227. doi: 10.1261/rna.057208.116
Hare, E. E., and Loer, C. M. (2004). Function and evolution of the serotonin-synthetic bas-1 gene and other aromatic amino acid decarboxylase genes in Caenorhabditis. BMC Evol. Biol. 4:24. doi: 10.1186/1471-2148-4-24
He, F., and Jacobson, A. (2015). Nonsense-mediated mRNA decay: degradation of defective transcripts is only part of the story. Annu. Rev. Genet. 49, 339–366. doi: 10.1146/annurev-genet-112414-054639
Hoffmann, I., and Birnstiel, M. L. (1990). Cell cycle-dependent regulation of histone precursor mRNA processing by modulation of U7 snRNA accessibility. Nature 346, 665–668. doi: 10.1038/346665a0
Hosseinibarkooie, S., Peters, M., Torres-Benito, L., Rastetter, R. H., Hupperich, K., Hoffmann, A., et al. (2016). The power of human protective modifiers: PLS3 and CORO1C unravel impaired endocytosis in spinal muscular atrophy and rescue SMA phenotype. Am. J. Hum. Genet. 99, 647–665. doi: 10.1016/j.ajhg.2016.07.014
Ishii, Y., Takeda, S., and Yamada, H. (2010). Modulation of UDP-glucuronosyltransferase activity by protein-protein association. Drug Metab Rev. 42, 145–158. doi: 10.3109/03602530903208579
Jangi, M., Fleet, C., Cullen, P., Gupta, S. V., Mekhoubad, S., Chiao, E., et al. (2017). SMN deficiency in severe models of spinal muscular atrophy causes widespread intron retention and DNA damage. Proc. Natl. Acad. Sci. U.S.A. 114, E2347–E2356.
Kashima, T., and Manley, J. L. (2003). A negative element in SMN2 exon 7 inhibits splicing in spinal muscular atrophy. Nat. Genet. 34, 460–463. doi: 10.1038/ng1207
Keall, R., Whitelaw, S., Pettitt, J., and Müller, B. (2007). Histone gene expression and histone mRNA 3’ end structure in Caenorhabditis elegans. BMC Mol. Biol. 8:51. doi: 10.1186/1471-2199-8-51
Knights, K. M., Rowland, A., and Miners, J. O. (2013). Renal drug metabolism in humans: the potential for drug-endobiotic interactions involving cytochrome P450 (CYP) and UDP-glucuronosyltransferase (UGT). Br. J. Clin. Pharmacol. 76, 587–602.
Kong, L., Wang, X., Choe, D. W., Polley, M., Burnett, B. G., Bosch-Marce, M., et al. (2009). Impaired synaptic vesicle release and immaturity of neuromuscular junctions in spinal muscular atrophy mice. J. Neurosci. 29, 842–851. doi: 10.1523/jneurosci.4434-08.2009
Kye, M. J., Niederst, E. D., Wertz, M. H., Goncalves Ido, C., Akten, B., Dover, K. Z., et al. (2014). SMN regulates axonal local translation via miR-183/mTOR pathway. Hum. Mol. Genet. 23, 6318–6331. doi: 10.1093/hmg/ddu350
Lefebvre, S., Burglen, L., Reboullet, S., Clermont, O., Burlet, P., Viollet, L., et al. (1995). Identification and characterization of a spinal muscular atrophy-determining gene. Cell 80, 155–165.
Liu, Q., Fischer, U., Wang, F., and Dreyfuss, G. (1997). The spinal muscular atrophy disease gene product, SMN, and its associated protein SIP1 are in a complex with spliceosomal snRNP proteins. Cell 90, 1013–1021. doi: 10.1016/s0092-8674(00)80367-0
Lotti, F., Imlach, W. L., Saieva, L., Beck, E. S., Hao le, T., Li, D. K., et al. (2012). An SMN-dependent U12 splicing event essential for motor circuit function. Cell 151, 440–454. doi: 10.1016/j.cell.2012.09.012
Ma, L., and Horvitz, H. R. (2009). Mutations in the Caenorhabditis elegans U2AF large subunit UAF-1 alter the choice of a 3’ splice site in vivo. PLoS Genet. 5:e1000708. doi: 10.1371/journal.pgen.1000708
Ma, L., Tan, Z., Teng, Y., Hoersch, S., and Horvitz, H. R. (2011). In vivo effects on intron retention and exon skipping by the U2AF large subunit and SF1/BBP in the nematode Caenorhabditis elegans. RNA 17, 2201–2211. doi: 10.1261/rna.027458.111
Maeda, M., Harris, A. W., Kingham, B. F., Lumpkin, C. J., Opdenaker, L. M., McCahan, S. M., et al. (2014). Transcriptome profiling of spinal muscular atrophy motor neurons derived from mouse embryonic stem cells. PLoS One 9:e106818. doi: 10.1371/journal.pone.0106818
Makarov, E. M., Makarova, O. V., Urlaub, H., Gentzel, M., Will, C. L., Wilm, M., et al. (2002). Small nuclear ribonucleoprotein remodeling during catalytic activation of the spliceosome. Science 298, 2205–2208. doi: 10.1126/science.1077783
Mango, S. E. (2001). Stop making nonSense: the C. elegans smg genes. Trends Genet. 17, 646–653. doi: 10.1016/s0168-9525(01)02479-9
Maniatis, T., and Reed, R. (2002). An extensive network of coupling among gene expression machines. Nature 416, 499–506. doi: 10.1038/416499a
Marzluff, W. F., Wagner, E. J., and Duronio, R. J. (2008). Metabolism and regulation of canonical histone mRNAs: life without a poly(A) tail. Nat. Rev. Genet. 9, 843–854. doi: 10.1038/nrg2438
McWhorter, M. L., Monani, U. R., Burghes, A. H., and Beattie, C. E. (2003). Knockdown of the survival motor neuron (Smn) protein in zebrafish causes defects in motor axon outgrowth and pathfinding. J. Cell Biol. 162, 919–931.
Mello, C. C., Kramer, J. M., Stinchcomb, D., and Ambros, V. (1991). Efficient gene transfer in C. elegans: extrachromosomal maintenance and integration of transforming sequences. EMBO J. 10, 3959–3970. doi: 10.1002/j.1460-2075.1991.tb04966.x
Miguel-Aliaga, I., Culetto, E., Walker, D. S., Baylis, H. A., Sattelle, D. B., and Davies, K. E. (1999). The Caenorhabditis elegans orthologue of the human gene responsible for spinal muscular atrophy is a maternal product critical for germline maturation and embryonic viability. Hum. Mol. Genet. 8, 2133–2143. doi: 10.1093/hmg/8.12.2133
Miller, N., Shi, H., Zelikovich, A. S., and Ma, Y. C. (2016). Motor neuron mitochondrial dysfunction in spinal muscular atrophy. Hum. Mol. Genet. 25, 3395–3406. doi: 10.1093/hmg/ddw262
O’Hern, P. J., do Carmo, G. G. I., Brecht, J., Lopez Soto, E. J., Simon, J., Chapkis, N., et al. (2017). Decreased microRNA levels lead to deleterious increases in neuronal M2 muscarinic receptors in spinal muscular atrophy models. Elife 6:e20752.
Oprea, G. E., Krober, S., McWhorter, M. L., Rossoll, W., Muller, S., Krawczak, M., et al. (2008). Plastin 3 is a protective modifier of autosomal recessive spinal muscular atrophy. Science 320, 524–527. doi: 10.1126/science.1155085
Pellizzoni, L., Kataoka, N., Charroux, B., and Dreyfuss, G. (1998). A novel function for SMN, the spinal muscular atrophy disease gene product, in pre-mRNA splicing. Cell 95, 615–624. doi: 10.1016/s0092-8674(00)81632-3
Pillai, R. S., Grimmler, M., Meister, G., Will, C. L., Lührmann, R., Fischer, U., et al. (2003). Unique Sm core structure of U7 snRNPs: assembly by a specialized SMN complex and the role of a new component, Lsm11, in histone RNA processing. Genes Dev. 17, 2321–2333. doi: 10.1101/gad.274403
Praveen, K., Wen, Y., and Matera, A. G. (2012). A Drosophila model of spinal muscular atrophy uncouples snRNP biogenesis functions of survival motor neuron from locomotion and viability defects. Cell Rep. 1, 624–631. doi: 10.1016/j.celrep.2012.05.014
Rajendra, T. K., Gonsalvez, G. B., Walker, M. P., Shpargel, K. B., Salz, H. K., and Matera, A. G. (2007). A Drosophila melanogaster model of spinal muscular atrophy reveals a function for SMN in striated muscle. J. Cell Biol. 176, 831–841. doi: 10.1083/jcb.200610053
Reed, R. (2000). Mechanisms of fidelity in pre-mRNA splicing. Curr. Opin. Cell Biol. 12, 340–345. doi: 10.1016/s0955-0674(00)00097-1
Riessland, M., Kaczmarek, A., Schneider, S., Swoboda, K. J., Lohr, H., Bradler, C., et al. (2017). Neurocalcin delta suppression protects against spinal muscular atrophy in humans and across species by restoring impaired endocytosis. Am. J. Hum. Genet. 100, 297–315. doi: 10.1016/j.ajhg.2017.01.005
Ripolone, M., Ronchi, D., Violano, R., Vallejo, D., Fagiolari, G., Barca, E., et al. (2015). Impaired muscle mitochondrial biogenesis and myogenesis in spinal muscular atrophy. JAMA Neurol. 72, 666–675.
Rossoll, W., Jablonka, S., Andreassi, C., Kroning, A. K., Karle, K., Monani, U. R., et al. (2003). Smn, the spinal muscular atrophy-determining gene product, modulates axon growth and localization of beta-actin mRNA in growth cones of motoneurons. J. Cell Biol. 163, 801–812. doi: 10.1083/jcb.200304128
Schultz, J., Lee, S.-J., Cole, T., Hoang, H. D., Vibbert, J., Cottee, P. A., et al. (2017). The secreted MSP domain of C. elegans VAPB homolog VPR-1 patterns the adult striated muscle mitochondrial reticulum via SMN-1. Development 144, 2175–2186. doi: 10.1242/dev.152025
See, K., Yadav, P., Giegerich, M., Cheong, P. S., Graf, M., Vyas, H., et al. (2014). SMN deficiency alters Nrxn2 expression and splicing in zebrafish and mouse models of spinal muscular atrophy. Hum. Mol. Genet. 23, 1754–1770. doi: 10.1093/hmg/ddt567
Sen, A., Dimlich, D. N., Guruharsha, K. G., Kankel, M. W., Hori, K., Yokokura, T., et al. (2013). Genetic circuitry of Survival motor neuron, the gene underlying spinal muscular atrophy. Proc. Natl. Acad. Sci. U.S.A. 110, E2371–E2380.
Singh, R. N., Howell, M. D., Ottesen, E. W., and Singh, N. N. (2017). Diverse role of survival motor neuron protein. Biochim. Biophys. Acta 1860, 299–315. doi: 10.1016/j.bbagrm.2016.12.008
Sleigh, J. N., Barreiro-Iglesias, A., Oliver, P. L., Biba, A., Becker, T., Davies, K. E., et al. (2014). Chondrolectin affects cell survival and neuronal outgrowth in in vitro and in vivo models of spinal muscular atrophy. Hum. Mol. Genet. 23, 855–869. doi: 10.1093/hmg/ddt477
Sleigh, J. N., Buckingham, S. D., Esmaeili, B., Viswanathan, M., Cuppen, E., Westlund, B. M., et al. (2011). A novel Caenorhabditis elegans allele, smn-1(cb131), mimicking a mild form of spinal muscular atrophy, provides a convenient drug screening platform highlighting new and pre-approved compounds. Hum. Mol. Genet. 20, 245–260. doi: 10.1093/hmg/ddq459
Stincone, A., Prigione, A., Cramer, T., Wamelink, M. M., Campbell, K., Cheung, E., et al. (2015). The return of metabolism: biochemistry and physiology of the pentose phosphate pathway. Biol. Rev. Camb. Philos. Soc. 90, 927–963. doi: 10.1111/brv.12140
Sutherland, L. C., Wang, K., and Robinson, A. G. (2010). RBM5 as a putative tumor suppressor gene for lung cancer. J. Thorac. Oncol. 5, 294–298. doi: 10.1097/jto.0b013e3181c6e330
Tejero, R., Lopez-Manzaneda, M., Arumugam, S., and Tabares, L. (2016). Synaptotagmin-2, and -1, linked to neurotransmission impairment and vulnerability in spinal muscular atrophy. Hum. Mol. Genet. 25, 4703–4716.
Tisdale, S., Lotti, F., Saieva, L., Van Meerbeke, J. P., Crawford, T. O., Sumner, C. J., et al. (2013). SMN is essential for the biogenesis of U7 small nuclear ribonucleoprotein and 3’-end formation of histone mRNAs. Cell Rep. 5, 1187–1195. doi: 10.1016/j.celrep.2013.11.012
Torres-Benito, L., Neher, M. F., Cano, R., Ruiz, R., and Tabares, L. (2011). SMN requirement for synaptic vesicle, active zone and microtubule postnatal organization in motor nerve terminals. PLoS One 6:e26164. doi: 10.1371/journal.pone.0026164
Van Alstyne, M., Simon, C. M., Sardi, S. P., Shihabuddin, L. S., Mentis, G. Z., and Pellizzoni, L. (2018). Dysregulation of Mdm2 and Mdm4 alternative splicing underlies motor neuron death in spinal muscular atrophy. Genes Dev. 32, 1045–1059. doi: 10.1101/gad.316059.118
Xu, C. C., Denton, K. R., Wang, Z. B., Zhang, X., and Li, X. J. (2016). Abnormal mitochondrial transport and morphology as early pathological changes in human models of spinal muscular atrophy. Dis. Model Mech. 9, 39–49. doi: 10.1242/dmm.021766
Xu, Y., Halievski, K., Henley, C., Atchison, W. D., Katsuno, M., Adachi, H., et al. (2016). Defects in neuromuscular transmission may underlie motor dysfunction in spinal and bulbar muscular atrophy. J. Neurosci. 36, 5094–5106. doi: 10.1523/jneurosci.3485-15.2016
Zhang, Z., Lotti, F., Dittmar, K., Younis, I., Wan, L., Kasim, M., et al. (2008). SMN deficiency causes tissue-specific perturbations in the repertoire of snRNAs and widespread defects in splicing. Cell 133, 585–600. doi: 10.1016/j.cell.2008.03.031
Zhang, Z., Pinto, A. M., Wan, L., Wang, W., Berg, M. G., Oliva, I., et al. (2013). Dysregulation of synaptogenesis genes antecedes motor neuron pathology in spinal muscular atrophy. Proc. Natl. Acad. Sci. U.S.A. 110, 19348–19353. doi: 10.1073/pnas.1319280110
Zhou, C., Gao, X., Hu, S., Gan, W., Xu, J., Ma, Y. C., et al. (2018). RBM-5 modulates U2AF large subunit-dependent alternative splicing in C. elegans. RNA Biol. 15, 1295–1308. doi: 10.1080/15476286.2018.1526540
Keywords: SMN, mitochondria, vacuolar H+-ATPase, histone, C. elegans
Citation: Gao X, Xu J, Chen H, Xue D, Pan W, Zhou C, Ma YC and Ma L (2019) Defective Expression of Mitochondrial, Vacuolar H+-ATPase and Histone Genes in a C. elegans Model of SMA. Front. Genet. 10:410. doi: 10.3389/fgene.2019.00410
Received: 21 October 2018; Accepted: 15 April 2019;
Published: 03 May 2019.
Edited by:
Naoyuki Kataoka, The University of Tokyo, JapanReviewed by:
Tohru Yoshihisa, University of Hyogo, JapanMichael Briese, Institut für Klinische Neurobiologie, Universitätsklinikum Würzburg, Germany
Sung Min Han, University of Florida, United States
Copyright © 2019 Gao, Xu, Chen, Xue, Pan, Zhou, Ma and Ma. This is an open-access article distributed under the terms of the Creative Commons Attribution License (CC BY). The use, distribution or reproduction in other forums is permitted, provided the original author(s) and the copyright owner(s) are credited and that the original publication in this journal is cited, in accordance with accepted academic practice. No use, distribution or reproduction is permitted which does not comply with these terms.
*Correspondence: Yongchao C. Ma, bWFAbm9ydGh3ZXN0ZXJuLmVkdQ== Long Ma, bWFsb25nQHNrbG1nLmVkdS5jbg==