 Ping Xuan
 Chang Sun1*
- 1School of Computer Science and Technology, Heilongjiang University, Harbin, China
- 2School of Mathematical Science, Heilongjiang University, Harbin, China
Determining the target genes that interact with drugs—drug–target interactions—plays an important role in drug discovery. Identification of drug–target interactions through biological experiments is time consuming, laborious, and costly. Therefore, using computational approaches to predict candidate targets is a good way to reduce the cost of wet-lab experiments. However, the known interactions (positive samples) and the unknown interactions (negative samples) display a serious class imbalance, which has an adverse effect on the accuracy of the prediction results. To mitigate the impact of class imbalance and completely exploit the negative samples, we proposed a new method, named DTIGBDT, based on gradient boosting decision trees, for predicting candidate drug–target interactions. We constructed a drug–target heterogeneous network that contains the drug similarities based on the chemical structures of drugs, the target similarities based on target sequences, and the known drug–target interactions. The topological information of the network was captured by random walks to update the similarities between drugs or targets. The paths between drugs and targets could be divided into multiple categories, and the features of each category of paths were extracted. We constructed a prediction model based on gradient boosting decision trees. The model establishes multiple decision trees with the extracted features and obtains the interaction scores between drugs and targets. DTIGBDT is a method of ensemble learning, and it effectively reduces the impact of class imbalance. The experimental results indicate that DTIGBDT outperforms several state-of-the-art methods for drug–target interaction prediction. In addition, case studies on Quetiapine, Clozapine, Olanzapine, Aripiprazole, and Ziprasidone demonstrate the ability of DTIGBDT to discover potential drug–target interactions.
Introduction
Computational prediction of drug–target interactions (DTIs) plays a key role in drug discovery and repositioning (Chen et al., 2015; Yu et al., 2015, 2017b). Drugs exert their functions by interacting with various targets, of which genes are one important group. Through binding, drugs can either enhance or inhibit the expressions of genes and thereby affect disease processes (Overington et al., 2006; Yu et al., 2016; Santos et al., 2017). However, in most cases, drugs may cause multiple side-effects because they can interact with several unintended targets. The identification of targets that interact with drugs by biological and chemical experiments is very laborious and expensive (Langley et al., 2017). Therefore, many studies have attempted to predict DTIs by using computational methods, to reduce the workload and costs in providing candidate DTIs for biologists to verify (Ding et al., 2017a,b, 2019; Shen et al., 2017).
Several prediction methods concentrate primarily on incorporating information from drug–target homogeneous networks (Mei et al., 2012; Xu et al., 2014a,b, 2016; Li et al., 2015; Hao et al., 2017; Yu et al., 2017a). For example, Bleakley and Yamanishi constructed a support vector machine (SVM) framework named BLM, which is based on a bipartite local model, to predict DTIs (Bleakley and Yamanishi, 2009). However, because this method is trained with a large-scale bipartite graph model, high computational power is needed. Mei et al. analyzed DTI features from neighbors and predicted novel interactions (Mei et al., 2012); it is difficult to obtain enough neighbor information for this method. Ezzat et al. and Luo et al. incorporated topological information by applying a random walk on the homogeneous network and used graph regularized matrix factorization to calculate the propensities of DTIs (Ezzat et al., 2017; Luo et al., 2017). However, the accuracy of the results may be influenced when the features are projected into low-dimensional space, because some valuable information may be lost. Hao et al. proposed a method based on non-linear integral of similarity measurements (Hao et al., 2017). Although this method showed good performance, its accuracy depended heavily on the similarity measurements. DTI prediction has been treated as a binary classification problem in Lee's methods (Lee and Nam, 2018). The features of drugs and targets that were used for training a k-nearest-neighbors model were weighted by random walks. However, the known and unknown DTIs have a serious class imbalance, which has an adverse impact on prediction accuracy. In DDR, which was applied by Olayan et al., path category-based feature vectors were constructed to incorporate the topological information of the network, and a random forest was used for DTI prediction (Olayan et al., 2017). Random forest does not perform as well as in classification when it solves the regression problem, because it cannot yield a continuous output.
In this work, in order to further improve the accuracy of DTI prediction and mitigate the impact of class imbalance, we propose a novel computational method named DTIGBDT. We construct a drug–target heterogeneous network to extract features. A gradient boosting decision tree (GBDT)-based prediction model is used for calculating the propensities of interactions. We compare our approach with other prediction methods using various performance measurements: the results show that DTIGBDT outperforms the other methods.
Materials and Methods
Our goal is to predict novel (that is, unknown) interactions between drugs and targets. In order to integrate the information of various connections and the node attributes, we construct a drug–target heterogeneous network. We then design a novel prediction model based on GBDT for the network, to obtain the interaction scores of drug–target pairs. The higher the score, the more likely they are to interact (Zou et al., 2015; Zeng et al., 2017a).
Dataset for DTI Prediction
We obtained the drug–target interaction data from a published work (Luo et al., 2017). In this dataset, there are 1923 known DTIs, involving 708 drugs from DrugBank 5.0 (Wishart et al., 2017) and 1,412 targets from HPRD 9.0 (Keshava Prasad et al., 2008). For each pair of drugs and each pair of targets, we also extracted the similarities between them from these two databases. The similarity between two drugs was calculated by using the Tanimoto coefficient (Francesco et al., 2010), based on their chemical structures. The similarity between two targets is measured by the Smith-Waterman score (Wenhui et al., 2014), based on their primary sequences.
Heterogeneous Network-Based Feature Extraction
Construction of Drug–Target Heterogeneous Network
We defined a set of DTIs, which consists of a set of drugs D and a set of targets T, where D = {d1, d2,…, dm} includes m drug nodes, and T = {t1, t2,…, tn} contains n target nodes. The drug–target network can be considered as a heterogeneous network, which is constructed by a drug network and a target network. In these two networks, we added an edge to connect two drug nodes or two target nodes when the similarity between them were >0. Furthermore, the edge was weighted by the similarity between the two nodes. The edge between a drug and a target represented a known DTI and was weighted by 1. This heterogeneous network can be represented as in Figure 1A.
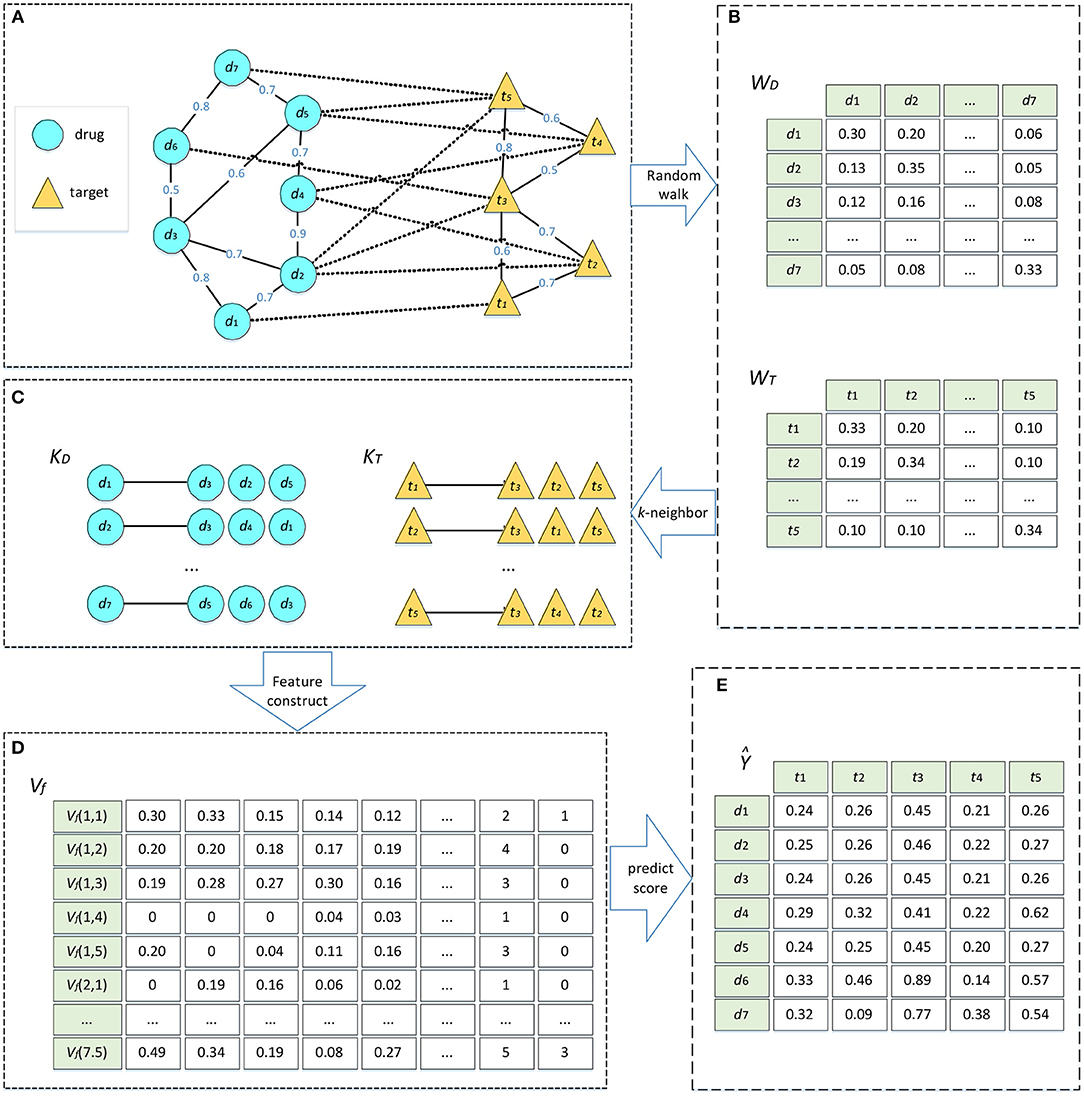
Figure 1. Algorithm flow of DTIGBDT. (A) Construct the heterogeneous network. (B) Random walk on drug network and target network, respectively. (C) Select most similar k neighbors. (D) Get feature vectors for each drug–target pair. (E) Train the DTIGBDT with the feature vectors.
The interactions between D and T could also be represented as a matrix Y where Yij is 1 if drug di and target tj are observed to interact and 0 otherwise. The set of similarities between drugs was represented by SDϵRm*m and the set of similarities between targets was represented by STϵRn*n. The element values in SD or ST are in the range of [0, 1] which represents how similar drugs or targets are to each other.
Similarity Calculation Based on Network and Selection of k Neighbors
Random walk with restart, a network diffusion algorithm, has been widely used to analyze complex biological network data (Köhler et al., 2008; Tong et al., 2008; Berger et al., 2010; Li and Patra, 2010; Xu et al., 2016; Cheng et al., 2018b; Gao et al., 2018). Random walk can consider the topological information of the network to fully analyze the potential associations between nodes. We conduct random walks on the drug and target networks separately, to extract the topological information of the networks. Based on these similarities, we select the k most similar neighbors for each node.
We take the drug network as an example to illustrate the random walk procedure. We defined a matrix ND, in which each element ND (i, j) describes the probability of a transition from di to dj.
where SD(i, j) represents the similarity between two drugs, di and dj. Next, we defined a matrix ϵRm*m where is the probability that the walker reaches dj from di after t iterations in the random walk process. The matrix WDt can be calculated as Equation (2).
where parameter a is the restart probability. The matrix can be initialized by Equation (3).
The convergence condition of the random walk procedure is . After the condition is satisfied, the converged probability can be regarded as a similarity score between two drugs. This score incorporates the topological information in the drug network and is used to update the weight of the edge between diand dj. Next, we selected the k most similar neighbors of di based on the similarities. We obtained the matrix KDϵRm*k where the ith row stores the k most similar neighbors of di. Similarly, we conducted random walk on the target network to obtain the similarity matrix ϵRn*n and the matrix of the k most similar neighbors, KTϵRn*k (Figures 1B,C).
Path Category-Based Features
Based on the assumption that similar drugs can usually interact with the same target and vice versa, we extracted an 18-dimensional feature vector based on the path category for each drug–target pair. In this study, we worked with the path categories whose lengths are 2 and 3 (but not longer than that, because of the computational cost). If we limit paths to start at the drug nodes and end at the target nodes, there are only two path categories with length 2. These two categories can be denoted as C1: (D–D–T) and C2: (D–T–T), where D represents a drug node and T represents a target node. The four categories with paths of length 3 are C3 :(D–T–T–T), C4 :(D–D–T–T), C5 :(D–D–D–T), and C6 :(D–T–D–T). We considered these six categories of paths to predict whether the drug can interact with the target. In this process, we started from a given drug di to reach a given target tj through a specific path category Ch, where h is selected from {1, 2, 3, …, 6}. We only considered paths that pass through the k nearest neighbors of di or tj. We denoted the set of such paths as Rijh. Next, for the qth path pq between di and tj, we calculated a weight s by multiplying all weights on the edges of path pq as Equation (4).
where exis the xth edge of pq, and wx is the weight of the edge. We defined three matrices V1ϵRi*j*h, V2ϵRi*j*h, and V3ϵRi*j*h, to store the features between di and tj under each path category Ch. V1(i, j, h) is the sum of the s-values in set Rijh. V2(i, j, h) is the maximum s-value in set Rijh, and V3(i, j, h) is the number of paths in the set.
We combined the three matrices into a new matrix VfϵRi*j*(3*h), where the row Vf (i, j) represents the feature vector of di and tj (Figure 1D).
We take the drug–target pair (d7, t3) in Figure 1A as an example to describe the process of heterogeneous network-based feature extraction. The paths from d7 to t3 are shown in Figure 2A, and the values of s for each path are listed in Figure 2B. There are two paths in the set R733, p1: d7-t5-t2-t3 and p2: d7-t5-t4-t3, and the values of s for these paths are 0.03 and 0.05, respectively. V1(7,3,3) is set as the sum of these s-values, 0.08. V2(7,3,3) is set as the maximum of them, 0.05. V3(7,3,3) is set as the number of the paths, 2.
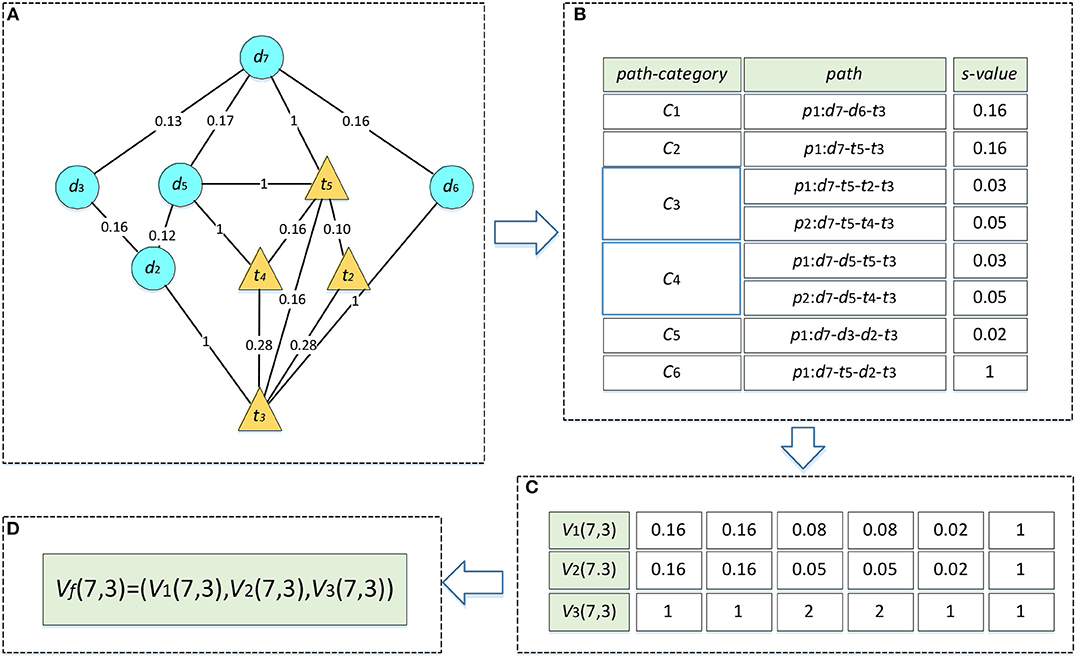
Figure 2. Feature vector calculation of d7-t3. The edges between drug nodes or target nodes are weighted by the similarities between two nodes. The edges between drugs and target nodes represent the known DTIs and are weighted by 1. (A) Paths between d7 and t3. (B) The s-values of all the paths. (C) Three types of path feature vectors. (D) Connection of three feature vectors.
In terms of the fifth type of path categories C5, there is only one path p1: d7-d3-d2-t3 in the set R735, and the s of p1 is 0.02. Therefore, V1(7,3,5) and V2(7,3,5) are both set as 0.02 and V3(7,3,5) is set as 1. Similarly, we can compute the features for the other path categories. As a result, the rows which represent the feature vectors of (d7, t2) in matrix V1, V2, V3 are set as (0.16, 0.16, 0.08, 0.08, 0.02, 1), (0.16, 0.16, 0.05, 0.05, 0.02, 1), and (1, 1, 2, 2, 1, 1), respectively (Figure 2C). Finally, these three vectors are combined into a single vector of Vf, namely Vf (7,3) (Figure 2D).
DTI Prediction Model Based on GBDT
In our dataset, there are only 1,923 known drug–target interactions, while more than 300,000 interactions are unknown, which causes a serious class imbalance. Aiming to reduce the impact of class imbalance and make full use of the negative samples in the dataset, we constructed an ensemble learning model based on GBDT (Ye et al., 2009), and refer to it as DTIGBDT.
The feature of a drug–target pair (di, tj) is denoted by a vector Vf(i, j). Let Xi,j = {x1,x2…,xz} represent z subsets of Vf(i, j), xk was obtained by randomly sampling some of the features from Vf(i, j). For each element in Xi,j, we built a decision tree model that is used for predicting the potential DTIs. In this way, we obtained a set Ti,j = {T1, T2…, Tz} that denotes z decision trees. Finally, we obtained the interaction score of the pair by summing the score of all decision trees. This can be calculated as Equation (8).
where Tk(xk) represents the score of the decision tree Tk. λk is used to adjust the contribution of Tk. The greater the value of score(i, j), the more likely di is to interact with tj. We thereby obtained a matrix ŶϵRm*n where Ŷij = score (i, j) (Figure 1E). We used the negative log-likelihood to calculate the loss of DTIGBDT.
where Yi,j is the actual interaction between di and tj. We defined the objective function as Equation (10).
The first term is the loss of DTIGBDT. The second term is the regular term to prevent overfitting, and λ is the regularization parameter for adjusting this term's contribution. The converged Ŷ is the interaction score matrix, which can be calculated by Figure 3.
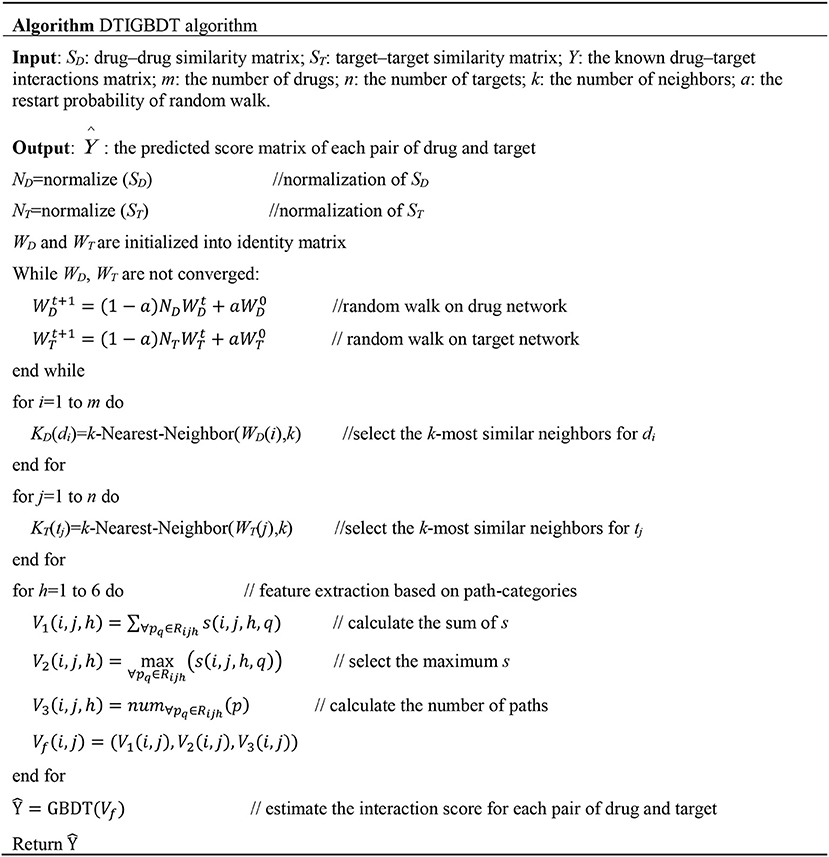
Figure 3. Algorithm for predicting the potential drug–target interactions.
Experimental Evaluation and Discussion
Performance Evaluation Metrics
To evaluate our method and the state-of-the-art methods for DTI prediction, we performed five-fold cross validation (Cheng et al., 2015; Chen et al., 2017; Lin et al., 2017; Wei et al., 2017a, 2018; Zeng et al., 2017b; Bu et al., 2018; Su et al., 2018; Xu et al., 2018b,c). All known DTIs were randomly divided into five subsets with equal size, and the same operation was applied to the unknown interactions (Liu et al., 2017; Zhang et al., 2017; Zeng et al., 2018). In each cross-validation trial, a subset of known DTIs and another subset of unknown DTIs were selected in turn as the test set, while the remaining DTIs were used for training a prediction model. The known and unknown interactions were regarded as the positive and negative samples, respectively. After the prediction is performed, each sample was given a predicted score which represents the propensity of the drug to interact with the target. The positive and negative samples were ranked by their score. The higher the positive samples were ranked, the better was the prediction performance.
For a given threshold δ, if the score of a positive sample was >δ, it was considered as a true positive sample (TP), and if the score was <δ, it would be considered as a false negative sample (FN). If the score of a negative sample was lower than δ, it would be regarded as a true negative sample (TN). If the score was <δ, it would be regarded as a false positive sample (FP). We obtained a receiver operating characteristic (ROC) curve (Streiner and Cairney, 2007) by calculating the true positive rates (TPRs) and false positive rates (FPRs) for various values of δ.
The areas under the ROC curves (AUCs) were used to evaluate the performance of each method (Lobo et al., 2008; Cheng et al., 2014, 2018a; Dao et al., 2018; Feng et al., 2018; Nie et al., 2018; Tang et al., 2018; Xu et al., 2018a; Yang et al., 2018). It is generally believed that the closer the value of AUC is to 1, the better the performance is. However, in the case of imbalanced data, AUPR (the area under the precision–recall curve) can provide a more valuable metric (van Laarhoven et al., 2011; Saito and Rehmsmeier, 2015; Patel et al., 2017; Sahiner et al., 2017; Wei et al., 2017b; Jiang et al., 2018a,b). Therefore, we also used AUPR as another measurement to evaluate the performance of each method. The precision–recall curve was constructed by precision rates and recall rates, which are defined as Equation (12).
In addition, biologists usually select the top section of the prediction result for a wet-lab experiment to further validate. As a result, the accuracy of the top k candidates is more important for discovering novel DTIs. We demonstrate the recall rates within the top k (k = 50, 100, 150, 200, 250, 300) candidates to reveal how many of these positive samples are identified successfully.
Comparison With Other Methods
We compared DTIGBDT with four state-of-the-art methods for DTI prediction, including GRMF (Ezzat et al., 2017), DTINet (Luo et al., 2017), Lee's method (Lee and Nam, 2018), and DDR (Olayan et al., 2017). We describe these methods in more detail below.
GRMF: This method proposed a matrix factorization-based model to predict novel DTIs. The drug–target interaction matrix Y were decomposed into two low-rank latent feature matrices A (for drugs) and B (for targets) by using the SVD algorithm. Alternating least squares was used to iteratively update A and B. The optimization problem can be described as:
where and are the normalized graph Laplacians that were computed based on the similarities between drugs or targets. λl, λd, and λt are parameters that adjust the contribution of the terms. The interaction score Ŷi,j of drug di and target tj can be calculated as:
where ai is the ith row of A and bj is the jth row of B.
DTINet: Heterogeneous data sources provide diverse information for DTI prediction, so Luo et al. integrated four types of drug similarities and three types of target similarities. The random walk with restart algorithm was applied to extract the topological information of the drug network and the target network, and the result of the algorithm was a matrix SD. The low-rank model used X to represent the corresponding low-dimensional feature vector of each drug. Similarly, the low-dimensional feature vectors of targets could be calculated and were represented by a matrix Y. Let P denote the interactions between drugs and targets; matrix Z can then be calculated by Equation (15).
The interaction score between drug di and target tj was defined as follows:
where xi is the ith row of X and is the feature vector of di, and yj is the jth row of Y and is the feature vector of tj.
Lee's method: In this method, each drug was represented by a bit vector, in which each bit suggests whether a specific sub molecular structure is contained by the drug. In addition, Lee et al. constructed a model based on random walk with restart to extract the topological information of the drug–drug interaction network. The rows of the matrix Fd were used to store the bit vectors of each drug and a matrix Nd was defined to denote the result of the random walk. The final representation of drug di, denoted by , was calculated by Equation (17):
where and are the ith row of Nd and Fd, respectively. Similarly, Lee et al. can calculate a vector to represent the target tj. The feature vector of the drug–target pair (di, tj) can be obtained by connecting and . On the basis of the Euclidean distance between each pair of drug and target, a k-nearest-neighbor model was trained to infer whether a target interacted with the drug.
DDR: DDR constructed a drug-target heterogeneous graph that contains the known DTIs with multiple drug similarities and target similarities. A non-linear similarity fusion method was performed to obtain the optimized drug similarities and the target similarities. For each drug–target pair, DDR constructed a path-category-based feature, which integrates the sum of the paths' weight and the maximum weight of the paths. A random forest-based model was performed to analyze the potential associations between each drug–target pair with these features.
Several parameters may influence the performance of DTIGBDT, including the restart probability a, the number of neighbors k, and the regularization parameter λ. The ranges of a, k, and λ are set to {0.2,0.4,0.6,0.8}, {10,20,30,40,50}, and {0.01,0.1,1,10}, respectively. The results of cross validation showed that our method achieves the best performance when a = 0.4, k = 30, and λ = 0.1. For fair comparison, the parameters of the other methods were also adjusted to obtain their best performance (n = 600, k = 5 in DDR; r = 0.8 in Lee's method; η = 0.5, d = 0.1, t = 0.1, l = 2 in GRMF; and λ = 1, r = 0.8 in DTINet). The performance of each method was obtained by using the optimum parameters in each case. The ROC curves and precision–recall curves of all these methods are shown in Figure 4.
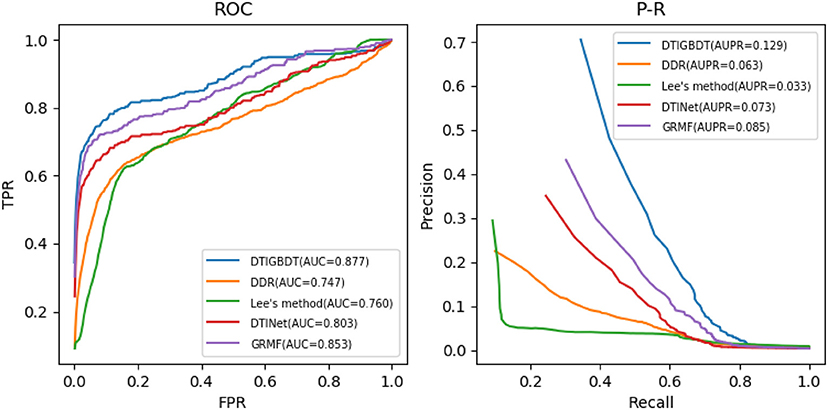
Figure 4. ROC curves and precision–recall curves of DTI prediction by different methods.
DTIGBDT achieves the best performance (AUC = 0.877, AUPR = 0.129), and it achieves 2.3% higher AUC and 4.3% higher AUPR than the second-best method, GRMF. Comparing to DTINet, DTIGBDT achieves 7.3% higher AUC and 5.7% higher AUPR. Both GRMF and DTINet have applied a low-rank model to reduce the dimension of the drug features and target features. However, a great deal of valuable information may be lost in this process. Lee's method does not perform well because it only used the same quantities of negative samples as that of the positive samples to train the k-nearest-neighbor model and most of the negative samples were discarded. The AUC and AUPR of DTIGBDT are 11.6% and 9.7% higher than Lee's method, respectively. DDR shows the worst performance because its' prediction model fails to accurately estimate the interaction scores, and the AUC and AUPR of DTIGBDT are 12.9 and 6.6% higher than DDR, respectively. The superior performance of DTIGBDT is mainly due to our model based on GBDT that completely exploits all the negative samples.
We performed a paired t-test to evaluate whether DTIGBDT's performance (AUC and AUPR) is significantly better than that of other methods (Ruxton, 2006). The p-values are listed in Table 1. These statistical results show that DTIGBDT achieves a significantly better performance than all other methods at the significance level 0.05.
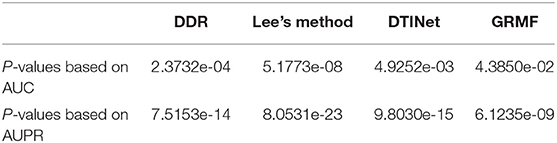
Table 1. P-values between DTIGBDT and other methods based on AUCs and AUPRs.
A higher recall value for the top k reveals that more positive samples are identified successfully. The average recall values of all drugs, for various k values, are shown in Figure 5. DTIGBDT outperforms the other methods at each of the k cutoffs, and successfully identified 78.1% of the positive samples in the top 50, 82.1% in the top 100, and 90.9% in the top 200. GRMF achieved the second-best performance, for which identified 73.1% in the top 50, 77.5% in the top 100, and 86.1% in the top 200. DTINet identified 68.1% in the top 50, 72.2% in the top 100, and 79.9% in the top 200. Lee's method identifies 52.9% in the top 50, 66.8% in the top 100, and 79.4% in the top 200, which is worse than DTINet but better than DDR. DDR suffers the worst performance, which only identified 59.1% positive samples in the top 50, 71.4% in the top 100, and 75.1% in the top 400.
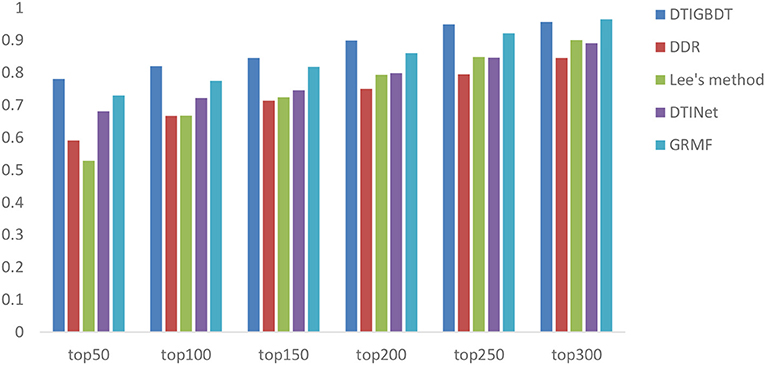
Figure 5. The average recalls across all the tested drugs at different top k-values.
Case Studies on Five Drugs
To demonstrate the ability of DTIGBDT to discover potential DTIs, we used it to predict novel drug-related targets. We performed DTIGBDT for all the drugs. All the known DTIs were used to train the model, and the prediction results are listed in Supplementary Table 1. In particular, we executed case studies on five drugs, including Quetiapine, Clozapine, Olanzapine, Aripiprazole, and Ziprasidone. The top-ranked five candidate targets for each drug were collected and listed in Table 2. To confirm these novel interactions, we consulted several reference databases and the biomedical literature to support them.
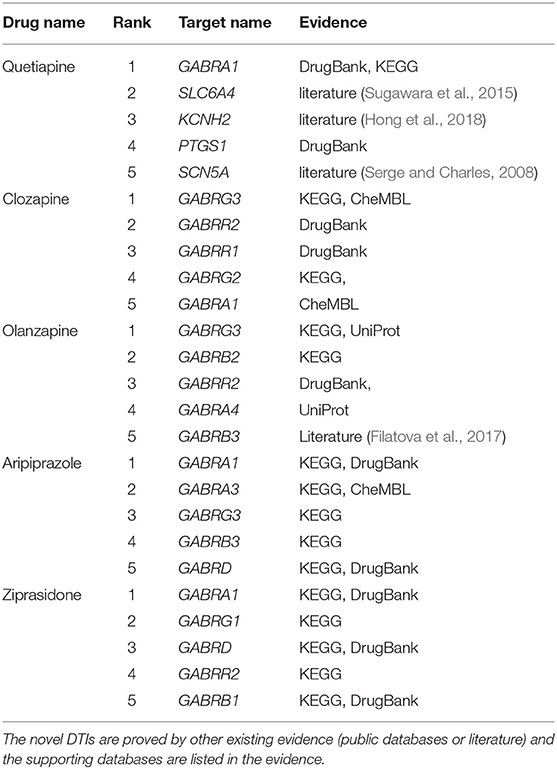
Table 2. Top-ranked five candidates of five drugs.
DrugBank (Wishart et al., 2017) is a database with annotated cheminformatics resources which combines detailed drug data with target information. As shown in Table 2, 10 of the 25 novel interactions were reported in DrugBank, which confirms the drugs were indeed interacted with the targets. CheMBL (Gaulton et al., 2016) contains the binding and functional information of drug-like bioactive compounds and the information of their binding targets. Three of the 25 interactions were contained in CheMBL, indicating that these drugs can interact with their candidate targets. KEGG (Kanehisa and Goto, 2000) is another useful database dealing with genomes, biological pathways, drugs, and chemical substances. There are 15 interactions that can be found in KEGG, which suggests the expression of the genes can be upregulated or downregulated by the drugs. For example, the drug Aripiprazole can act as a potentiator to enhance the expression of the target gene GABRA1 in combination with another drug Phenobarbital.
In addition, a database named UniProt (Consortium, 2014), which collects the protein sequence and function information from research literature, is used to find whether a drug can interact with a specific target; this database includes two interactions. Specifically, the expression of two target genes, GABRG3 and GABRA4, can be reduced by drug Olanzapine to inhibit the activity of extracellular ligand-gated ion channels.
Finally, four novel interactions, which are labeled with “literature,” were confirmed by some of the published literature that can be found in PubMed (McEntyre and Lipman, 2001). These drugs were confirmed that they can enhance or inhibit the expressions of their candidate genes. For instance, Sugawara et al. found that drug Quetiapine can decrease the DNA methylation level of the promoter region of the gene SLC6A4 (Sugawara et al., 2015). Case studies suggests that DTIGBDT has powerful ability to discover the potential drug-interacted targets.
Conclusions
In this paper, we proposed a novel method, DTIGBDT, for predicting the target genes that interact with drugs. We incorporated topological information from the heterogeneous interaction network, and the feature vectors between the drug–target pairs were constructed based on the path categories. A GBDT-based model was constructed for predicting candidate target genes, and it can mitigate the impact of class imbalance by completely exploiting the negative samples. The results of 5-fold cross-validation experiments confirm the superiority of DTIGBDT for DTI prediction. The case studies on five drugs further prove the ability of our model to discover the potential interactions. Therefore, DTIGBDT is a powerful tool which may provide reliable candidate target genes for subsequent identification of actual drug–target interactions with wet-lab experiments. In the future, we will develop our methods on parallel platforms (Zou et al., 2013; Guo et al., 2018) for handling the big data problem.
Data Availability
All datasets analyzed for this study are included in the manuscript and the Supplementary Files.
Author Contributions
PX and CS conceived the prediction method. PX, CS, and YY they wrote the paper. CS and TS developed the computer programs. TZ and YD analyzed the results and revised the paper.
Funding
The work was supported by the Natural Science Foundation of China (61702296, 61302139), the Natural Science Foundation of Heilongjiang Province (LH2019F049, LH2019A029), China Postdoctoral Science Foundation (2019M650069), the Heilongjiang Postdoctoral Scientific Research Staring Foundation (BHL-Q18104), the Fundamental Research Foundation of Universities in Heilongjiang Province for Technology Innovation (KJCX201805), the Fundamental Research Foundation of Universities in Heilongjiang Province for Youth Innovation Team (RCYJTD201805), and the Foundation of Graduate Innovative Research (YJSCX2018-047HLJU, YJSCX2018-139HLJU).
Conflict of Interest Statement
The authors declare that the research was conducted in the absence of any commercial or financial relationships that could be construed as a potential conflict of interest.
Acknowledgments
We would like to thank Editage (www.editage.com) for English language editing.
Supplementary Material
The Supplementary Material for this article can be found online at: https://www.frontiersin.org/articles/10.3389/fgene.2019.00459/full#supplementary-material
Supplementary Table 1. Potential candidate target genes interacted with 549 drugs.
References
Berger, S. I., Ma'ayan, A., and Iyengar, R. (2010). Systems pharmacology of arrhythmias. Sci. Signal. 3, ra30–ra30. doi: 10.1126/scisignal.2000723
Bleakley, K., and Yamanishi, Y. (2009). Supervised prediction of drug–target interactions using bipartite local models. Bioinformatics 25, 2397–2403. doi: 10.1093/bioinformatics/btp433
Bu, H., Hao, J., Guan, J., and Zhou, S. (2018). Predicting enhancers from multiple cell lines and tissues across different developmental stages based on SVM method. Curr. Bioinform. 13, 655–660. doi: 10.2174/1574893613666180726163429
Chen, L., Chu, C., Zhang, Y.-H., Zheng, M., Zhu, L., Kong, X., et al. (2017). Identification of drug-drug interactions using chemical interactions. Curr. Bioinform. 12, 526–534. doi: 10.2174/1574893611666160618094219
Chen, X., Yan, C. C., Zhang, X., Zhang, X., Dai, F., Yin, J., et al. (2015). Drug–target interaction prediction: databases, web servers and computational models. Brief. Bioinform. 17, 696–712. doi: 10.1093/bib/bbv066
Cheng, L., Hu, Y., Sun, J., Zhou, M., and Jiang, Q. (2018a). DincRNA: a comprehensive web-based bioinformatics toolkit for exploring disease associations and ncRNA function. Bioinformatics 34, 1953–1956. doi: 10.1093/bioinformatics/bty002
Cheng, L., Jiang, Y., Ju, H., Sun, J., Peng, J., Zhou, M., et al. (2018b). InfAcrOnt: calculating cross-ontology term similarities using information flow by a random walk. BMC Genomics 19:919. doi: 10.1186/s12864-017-4338-6
Cheng, L., Li, J., Hu, Y., Jiang, Y., Liu, Y., Chu, Y., et al. (2015). Using semantic association to extend and infer literature-oriented relativity between terms. IEEE/ACM Trans. Comput. Biol. Bioinform. 12, 1219–1226. doi: 10.1109/TCBB.2015.2430289
Cheng, L., Li, J., Ju, P., Peng, J., and Wang, Y. (2014). SemFunSim: a new method for measuring disease similarity by integrating semantic and gene functional association. PLoS ONE 9:e99415. doi: 10.1371/journal.pone.0099415
Consortium, U. (2014). UniProt: a hub for protein information. Nucleic Acids Res. 43, D204–D212. doi: 10.1093/nar/gku989
Dao, F. Y., Lv, H., Wang, F., Feng, C. Q., Ding, H., Chen, W., et al. (2018). Identify origin of replication in Saccharomyces cerevisiae using two-step feature selection technique. Bioinformatics doi: 10.1093/bioinformatics/bty943. [Epub ahead of print].
Ding, Y., Tang, J., and Guo, F. (2017a). Identification of drug-target interactions via multiple information integration. Inf. Sci. 418, 546–560. doi: 10.1016/j.ins.2017.08.045
Ding, Y., Tang, J., and Guo, F. (2017b). Identification of protein–ligand binding sites by sequence information and ensemble classifier. J. Chem. Inf. Model. 57, 3149–3161. doi: 10.1021/acs.jcim.7b00307
Ding, Y., Tang, J., and Guo, F. (2019). Identification of drug-side effect association via multiple information integration with centered kernel alignment. Neurocomputing 325, 211–224. doi: 10.1016/j.neucom.2018.10.028
Ezzat, A., Zhao, P., Wu, M., Li, X.-L., and Kwoh, C.-K. (2017). Drug-target interaction prediction with graph regularized matrix factorization. IEEE/ACM Trans. Comput. Biol. Bioinform. (TCBB) 14, 646–656. doi: 10.1109/TCBB.2016.2530062
Feng, C.-Q., Zhang, Z.-Y., Zhu, X.-J., Lin, Y., Chen, W., Tang, H., et al. (2018). iTerm-PseKNC: a sequence-based tool for predicting bacterial transcriptional terminators. Bioinformatics 35:1469–1477. doi: 10.1093/bioinformatics/bty827
Filatova, E., Kasian, A., Kolomin, T., Rybalkina, E., Alieva, A., Andreeva, L., et al. (2017). GABA, Selank, and olanzapine affect the expression of genes involved in GABAergic neurotransmission in IMR-32 Cells. Front. Pharmacol. 8:89. doi: 10.3389/fphar.2017.00089
Francesco, I., Roberta, B., Emanuela, S., Vincenzo, B., Pratibha, M., Rosa, F., et al. (2010). Discovery of drug mode of action and drug repositioning from transcriptional responses. Proc. Natl. Acad. Sci. U.S.A. 107, 14621–14626. doi: 10.1073/pnas.1000138107
Gao, Y., Wang, P., Wang, Y., Ma, X., Zhi, H., Zhou, D., et al. (2018). Lnc2Cancer v2. 0: updated database of experimentally supported long non-coding RNAs in human cancers. Nucleic Acids Res. 47, D1028–D1033. doi: 10.1093/nar/gky1096
Gaulton, A., Hersey, A., Nowotka, M., Bento, A. P., Chambers, J., Mendez, D., et al. (2016). The ChEMBL database in 2017. Nucleic Acids Res. 45, D945–D954. doi: 10.1093/nar/gkw1074
Guo, R., Zhao, Y., Zou, Q., Fang, X., and Peng, S. (2018). Bioinformatics applications on Apache Spark. GigaScience 7:giy098. doi: 10.1093/gigascience/giy098
Hao, M., Bryant, S. H., and Wang, Y. (2017). Predicting drug-target interactions by dual-network integrated logistic matrix factorization. Sci. Rep. 7:40376. doi: 10.1038/srep40376
Hong, J. L., Choi, J. S., Choi, B. H., and Sang, J. H. (2018). Effects of norquetiapine, the active metabolite of quetiapine, on cloned hERG potassium channels. Neurosci. Lett. 664, 66–73. doi: 10.1016/j.neulet.2017.11.029
Jiang, L., Ding, Y., Tang, J., and Guo, F. (2018a). MDA-SKF: similarity kernel fusion for accurately discovering miRNA-disease association. Front. Genet. 9:618. doi: 10.3389/fgene.2018.00618
Jiang, L., Xiao, Y., Ding, Y., Tang, J., and Guo, F. (2018b). FKL-Spa-LapRLS: an accurate method for identifying human microRNA-disease association. BMC Genomics 19:911. doi: 10.1186/s12864-018-5273-x
Kanehisa, M., and Goto, S. (2000). KEGG: kyoto encyclopedia of genes and genomes. Nucleic Acids Res. 28, 27–30. doi: 10.1093/nar/28.1.27
Keshava Prasad, T., Goel, R., Kandasamy, K., Keerthikumar, S., Kumar, S., Mathivanan, S., et al. (2008). Human protein reference database−2009 update. Nucleic Acids Res. 37(suppl_1), D767–D772. doi: 10.1093/nar/gkn892
Köhler, S., Bauer, S., Horn, D., and Robinson, P. N. (2008). Walking the interactome for prioritization of candidate disease genes. Am. J. Hum. Genet. 82, 949–958. doi: 10.1016/j.ajhg.2008.02.013
Langley, G. R., Adcock, I. M., Busquet, F., Crofton, K. M., Csernok, E., Giese, C., et al. (2017). Towards a 21st-century roadmap for biomedical research and drug discovery: consensus report and recommendations. Drug Discov. Today 22, 327–339. doi: 10.1016/j.drudis.2016.10.011
Lee, I., and Nam, H. (2018). Identification of drug-target interaction by a random walk with restart method on an interactome network. BMC Bioinform. 19:208. doi: 10.1186/s12859-018-2199-x
Li, J., Zheng, S., Chen, B., Butte, A. J., Swamidass, S. J., and Lu, Z. (2015). A survey of current trends in computational drug repositioning. Brief. Bioinform. 17, 2–12. doi: 10.1093/bib/bbv020
Li, Y., and Patra, J. C. (2010). Genome-wide inferring gene–phenotype relationship by walking on the heterogeneous network. Bioinformatics 26, 1219–1224. doi: 10.1093/bioinformatics/btq108
Lin, Y., Min, X., Li, L., Yu, H., Ge, S., Zhang, J., et al. (2017). Using a machine-learning approach to predict discontinuous antibody-specific B-cell epitopes. Curr. Bioinform. 12, 406–415. doi: 10.2174/1574893611666160815102521
Liu, Y., Zeng, X., He, Z., and Zou, Q. (2017). Inferring microRNA-disease associations by random walk on a heterogeneous network with multiple data sources. IEEE/ACM Trans. Comput. Biol. Bioinform. 14, 905–915. doi: 10.1109/TCBB.2016.2550432
Lobo, J. M., Jiménez-Valverde, A., and Real, R. (2008). AUC: a misleading measure of the performance of predictive distribution models. Global Ecol. Biogeograph. 17, 145–151. doi: 10.1111/j.1466-8238.2007.00358.x
Luo, Y., Zhao, X., Zhou, J., Yang, J., Zhang, Y., Kuang, W., et al. (2017). A network integration approach for drug-target interaction prediction and computational drug repositioning from heterogeneous information. Nat. Commun. 8:573. doi: 10.1038/s41467-017-00680-8
Mei, J.-P., Kwoh, C.-K., Yang, P., Li, X.-L., and Zheng, J. (2012). Drug–target interaction prediction by learning from local information and neighbors. Bioinformatics 29, 238–245. doi: 10.1093/bioinformatics/bts670
Nie, L., Deng, L., Fan, C., Zhan, W., and Tang, Y. (2018). Prediction of protein s-sulfenylation sites using a deep belief network. Curr. Bioinform. 13, 461–467. doi: 10.2174/1574893612666171122152208
Olayan, R. S., Ashoor, H., and Bajic, V. B. (2017). DDR: efficient computational method to predict drug–target interactions using graph mining and machine learning approaches. Bioinformatics 34, 1164–1173. doi: 10.1093/bioinformatics/btx731
Overington, J. P., Al-Lazikani, B., and Hopkins, A. L. (2006). How many drug targets are there? Nat. Rev. Drug Discov. 5:993. doi: 10.1038/nrd2199
Patel, S., Tripathi, R., Kumari, V., and Varadwaj, P. (2017). DeepInteract: deep neural network based protein-protein interaction prediction tool. Curr. Bioinform. 12, 551–557. doi: 10.2174/1574893611666160815150746
Ruxton, G. D. (2006). The unequal variance t-test is an underused alternative to Student's t-test and the Mann–Whitney U test. Behav. Ecol. 17, 688–690. doi: 10.1093/beheco/ark016
Sahiner, B., Chen, W., Pezeshk, A., and Petrick, N. (2017). “Comparison of two classifiers when the data sets are imbalanced: the power of the area under the precision-recall curve as the figure of merit versus the area under the ROC curve”, in Medical Imaging 2017: Image Perception, Observer Performance, and Technology Assessment: International Society for Optics and Photonics (Orlando, FL), 101360G.
Saito, T., and Rehmsmeier, M. (2015). The precision-recall plot is more informative than the ROC plot when evaluating binary classifiers on imbalanced datasets. PLoS ONE 10:e0118432. doi: 10.1371/journal.pone.0118432
Santos, R., Ursu, O., Gaulton, A., Bento, A. P., Donadi, R. S., Bologa, C. G., et al. (2017). A comprehensive map of molecular drug targets. Nat. Rev. Drug Discov. 16:19. doi: 10.1038/nrd.2016.230
Serge, S., and Charles, A. (2008). Sudden cardiac death secondary to antidepressant and antipsychotic drugs. Expert Opin. Drug Saf. 7, 181–194. doi: 10.1517/14740338.7.2.181
Shen, C., Ding, Y., Tang, J., Xu, X., and Guo, F. (2017). An ameliorated prediction of drug–target interactions based on multi-scale discrete wavelet transform and network features. Int. J. Mol. Sci. 18:1781. doi: 10.3390/ijms18081781
Streiner, D. L., and Cairney, J. (2007). What's under the ROC? an introduction to receiver operating characteristics curves. Canad. J. Psychiatry 52, 121–128. doi: 10.1177/070674370705200210
Su, R., Wu, H., Xu, B., Liu, X., and Wei, L. (2018). Developing a multi-dose computational model for drug-induced hepatotoxicity prediction based on toxicogenomics data. IEEE/ACM Trans. Comput. Biol. Bioinform. doi: 10.1109/TCBB.2018.2858756. [Epub ahead of print].
Sugawara, H., Bundo, M., Asai, T., Sunaga, F., Ueda, J., Ishigooka, J., et al. (2015). Effects of quetiapine on DNA methylation in neuroblastoma cells. Prog. Neuropsychopharmacol. Biol. Psychiatry 56, 117–121. doi: 10.1016/j.pnpbp.2014.08.010
Tang, H., Zhao, Y.-W., Zou, P., Zhang, C.-M., Chen, R., Huang, P., et al. (2018). HBPred: a tool to identify growth hormone-binding proteins. Int. J. Biol. Sci. 14:957. doi: 10.7150/ijbs.24174
Tong, H., Faloutsos, C., and Pan, J.-Y. (2008). Random walk with restart: fast solutions and applications. Knowl. Inf. Syst. 14, 327–346. doi: 10.1007/s10115-007-0094-2
van Laarhoven, T., Nabuurs, S. B., and Marchiori, E. (2011). Gaussian interaction profile kernels for predicting drug–target interaction. Bioinformatics 27, 3036–3043. doi: 10.1093/bioinformatics/btr500
Wei, L., Chen, H., and Su, R. (2018). M6APred-EL: a sequence-based predictor for identifying N6-methyladenosine sites using ensemble learning. Mol. Ther. Nucleic Acids 12, 635–644. doi: 10.1016/j.omtn.2018.07.004
Wei, L., Wan, S., Guo, J., and Wong, K. K. (2017a). A novel hierarchical selective ensemble classifier with bioinformatics application. Artif. Intell. Med. 83, 82–90. doi: 10.1016/j.artmed.2017.02.005
Wei, L., Xing, P., Zeng, J., Chen, J., Su, R., and Guo, F. (2017b). Improved prediction of protein–protein interactions using novel negative samples, features, and an ensemble classifier. Artif. Intell. Med. 83, 67–74. doi: 10.1016/j.artmed.2017.03.001
Wenhui, W., Sen, Y., Xiang, Z., and Jing, L. (2014). Drug repositioning by integrating target information through a heterogeneous network model. Bioinformatics 30, 2923–2930. doi: 10.1093/bioinformatics/btu403
Wishart, D. S., Feunang, Y. D., Guo, A. C., Lo, E. J., Marcu, A., Grant, J. R., et al. (2017). DrugBank 5.0: a major update to the DrugBank database for 2018. Nucleic Acids Res. 46, D1074–D1082. doi: 10.1093/nar/gkx1037
Xu, L., Liang, G., Liao, C., Chen, G.-D., and Chang, C.-C. (2018a). An efficient classifier for Alzheimer's disease genes identification. Molecules 23:3140. doi: 10.3390/molecules23123140
Xu, L., Liang, G., Shi, S., and Liao, C. (2018b). SeqSVM: a sequence-based support vector machine method for identifying antioxidant proteins. Int. J. Mol. Sci. 19:1773. doi: 10.3390/ijms19061773
Xu, L., Liang, G., Wang, L., and Liao, C. (2018c). A novel hybrid sequence-based model for identifying anticancer peptides. Genes (Basel) 9:158. doi: 10.3390/genes9030158
Xu, Y., Guo, M., Liu, X., Wang, C., and Liu, Y. (2014a). Inferring the soybean (Glycine max) microRNA functional network based on target gene network. Bioinformatics 30, 94–103. doi: 10.1093/bioinformatics/btt605
Xu, Y., Guo, M., Liu, X., Wang, C., Liu, Y., and Liu, G. (2016). Identify bilayer modules via pseudo-3D clustering: applications to miRNA-gene bilayer networks. Nucleic Acids Res. 44, e152–e152. doi: 10.1093/nar/gkw679
Xu, Y., Guo, M., Zou, Q., Liu, X., Wang, C., and Liu, Y. (2014b). System-level insights into the cellular interactome of a non-model organism: inferring, modelling and analysing functional gene network of soybean (Glycine max). PLoS ONE 9:e113907. doi: 10.1371/journal.pone.0113907
Yang, H., Lv, H., Ding, H., Chen, W., and Lin, H. (2018). iRNA-2OM: a sequence-based predictor for identifying 2′-O-methylation sites in homo sapiens. J. Comput. Biol. 25, 1266–1277. doi: 10.1089/cmb.2018.0004
Ye, J., Chow, J.-H., Chen, J., and Zheng, Z. (2009). “Stochastic gradient boosted distributed decision trees,” in Proceedings of the 18th ACM conference on Information and knowledge management. (Hong Kong: ACM), 2061–2064.
Yu, L., Huang, J., Ma, Z., Zhang, J., Zou, Y., and Gao, L. (2015). Inferring drug-disease associations based on known protein complexes. BMC Med. Genomics 8:S2. doi: 10.1186/1755-8794-8-S2-S2
Yu, L., Ma, X., Zhang, L., Zhang, J., and Gao, L. (2016). Prediction of new drug indications based on clinical data and network modularity. Sci. Rep. 6:32530. doi: 10.1038/srep32530
Yu, L., Su, R., Wang, B., Zhang, L., Zou, Y., Zhang, J., et al. (2017a). Prediction of novel drugs for hepatocellular carcinoma based on multi-source random walk. IEEE/ACM Trans. Comput. Biol. Bioinform. 14, 966–977. doi: 10.1109/TCBB.2016.2550453
Yu, L., Zhao, J., and Gao, L. (2017b). Drug repositioning based on triangularly balanced structure for tissue-specific diseases in incomplete interactome. Artif. Intell. Med. 77, 53–63. doi: 10.1016/j.artmed.2017.03.009
Zeng, X., Ding, N., Rodríguez-Patón, A., and Zou, Q. (2017a). Probability-based collaborative filtering model for predicting gene–disease associations. BMC Med. Genomics 10:76. doi: 10.1186/s12920-017-0313-y
Zeng, X., Liao, Y., Liu, Y., and Zou, Q. (2017b). Prediction and validation of disease genes using hetesim scores. IEEE/ACM Trans. Comput. Biol. Bioinform. 14, 687–695. doi: 10.1109/tcbb.2016.2520947
Zeng, X., Liu, L., Lü, L., and Zou, Q. (2018). Prediction of potential disease-associated microRNAs using structural perturbation method. Bioinformatics 34, 2425–2432. doi: 10.1093/bioinformatics/bty112
Zhang, X., Zou, Q., and Rodriguez-Paton, A. (2017). Meta-path methods for prioritizing candidate disease miRNAs. IEEE/ACM Trans. Comput. Boil. Bioinform. 16, 283–291. doi: 10.1109/TCBB.2017.2776280
Zou, Q., Li, J., Song, L., Zeng, X., and Wang, G. (2015). Similarity computation strategies in the microRNA-disease network: a survey. Brief. Funct. Genomics 15, 55–64. doi: 10.1093/bfgp/elv024
Keywords: drug–target interaction prediction, class imbalance, ensemble learning, path category-based features, gradient boosting decision tree
Citation: Xuan P, Sun C, Zhang T, Ye Y, Shen T and Dong Y (2019) Gradient Boosting Decision Tree-Based Method for Predicting Interactions Between Target Genes and Drugs. Front. Genet. 10:459. doi: 10.3389/fgene.2019.00459
Received: 12 February 2019; Accepted: 30 April 2019;
Published: 31 May 2019.
Edited by:
Quan Zou, University of Electronic Science and Technology of China, ChinaReviewed by:
Zhu-Hong You, Xinjiang Technical Institute of Physics & Chemistry (CAS), ChinaFang Bai, Rice University, United States
Copyright © 2019 Xuan, Sun, Zhang, Ye, Shen and Dong. This is an open-access article distributed under the terms of the Creative Commons Attribution License (CC BY). The use, distribution or reproduction in other forums is permitted, provided the original author(s) and the copyright owner(s) are credited and that the original publication in this journal is cited, in accordance with accepted academic practice. No use, distribution or reproduction is permitted which does not comply with these terms.
*Correspondence: Chang Sun, c3VuY2hhbmdjbkBvdXRsb29rLmNvbQ==; Tiangang Zhang, emhhbmdAaGxqdS5lZHUuY24=