 Yutong Zou1†
 Thuy Tien Bui
 Kumar Selvarajoo
- 1Department of Statistics and Applied Probability, National University of Singapore, Singapore, Singapore
- 2Biotransformation Innovation Platform (BioTrans), Agency for Science, Technology and Research (A*STAR), Singapore, Singapore
Here we report a bio-statistical/informatics tool, ABioTrans, developed in R for gene expression analysis. The tool allows the user to directly read RNA-Seq data files deposited in the Gene Expression Omnibus or GEO database. Operated using any web browser application, ABioTrans provides easy options for multiple statistical distribution fitting, Pearson and Spearman rank correlations, PCA, k-means and hierarchical clustering, differential expression (DE) analysis, Shannon entropy and noise (square of coefficient of variation) analyses, as well as Gene ontology classifications.
Introduction
Large-scale gene expression analysis requires specialized statistical or bioinformatics tools to rigorously interpret the complex multi-dimensional data, especially when comparing between genotypes. There are already several such tools developed with fairly user-friendly features (Russo and Angelini, 2014; Poplawski et al., 2016; Velmeshev et al., 2016). Nevertheless, there still is a need for more specialized, focused and “click-and-go” analysis tools for different groups of bioinformatics and wet biologists. In particular, software tools that perform gene expression variability through entropy and noise analyses are lacking. Here, we focused on very commonly used statistical techniques, namely, Pearson and Spearman rank correlations, Principal Component Analysis (PCA), k-means and hierarchical clustering, Shannon entropy, noise (square of coefficient of variation), differential expression (DE) analysis, and gene ontology classifications (Tsuchiya et al., 2009; Piras et al., 2014; Piras and Selvarajoo, 2015; Simeoni et al., 2015).
Using R programming as the backbone, we developed a web-browser based user interface to simply perform the above-mentioned analyses by a click of a few buttons, rather than using a command line execution. Our interface is specifically made simple considering wet lab biologists as the main users. Nevertheless, our tool will also benefit bioinformatics and computational biologists at large, as it saves much time for running the R script files for analyses and saving the results in pdf.
Main Interface and Data Input
Upon loading ABioTrans.R, the homepage window pops up and displays a panel to choose the RNA-Seq data and supporting files (Figure 1). The data file, in comma-separated value (.csv) format, should contain the gene names in rows and genotypes (conditions: wildtype, mutants, and replicates, etc.) in columns, following the usual format of files deposited in the GEO database (Clough and Barrett, 2016). Supporting files (if applicable) include gene length, list of negative
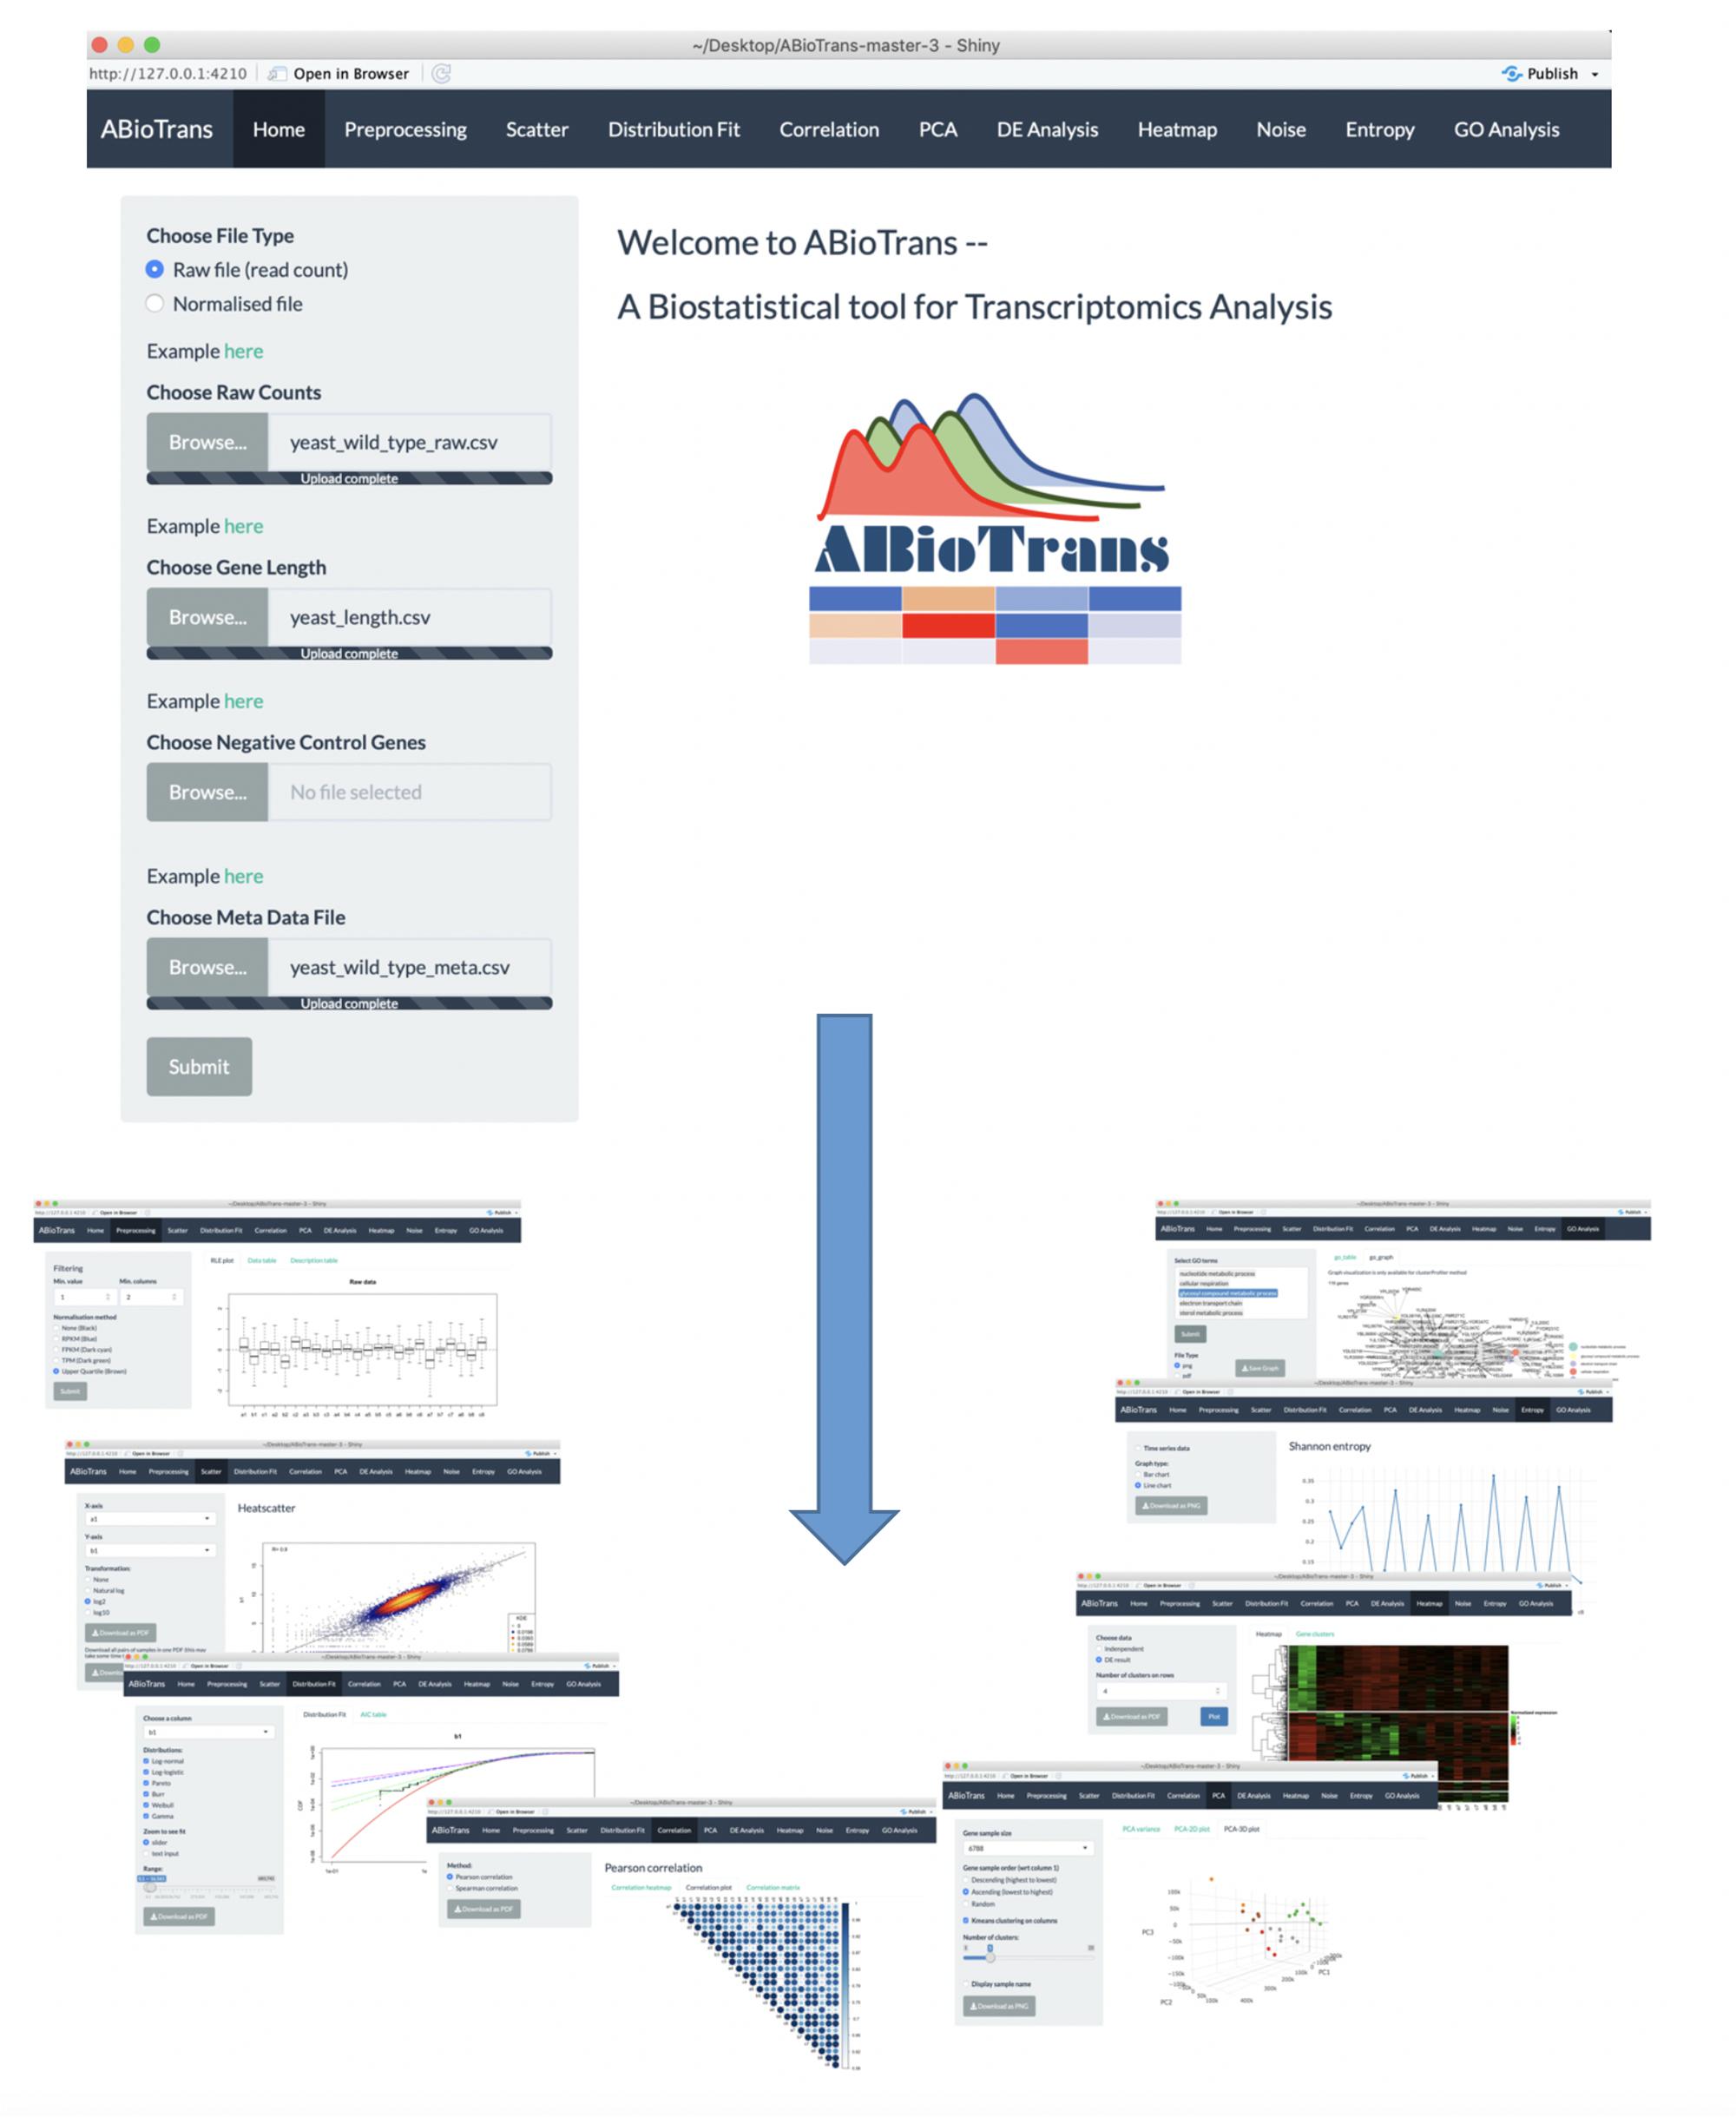
Figure 1. ABioTrans main interface and snapshots of various analysis mode.
control genes, and metadata file. If the data files contain raw read counts, the user can perform normalization using 5 popular methods: FPKM, RPKM, TPM, Remove Unwanted Variation (RUV), or upper quartile in the pre-processing step (Mortazavi et al., 2008; Trapnell et al., 2010; Wagner et al., 2012; Risso et al., 2014). FPKM, RPKM, and TPM normalization requires inputting gene length file, which should provide matching gene name and their length in base pair in two-column csv file. RUV normalization requires a list of negative control genes (genes that are stably expressed in all experimental conditions), which should be contained in a one-column csv file. If negative control genes are not available, upper quartile normalization option will replace RUV. The metadata file is required for DE analysis, and should specify experimental conditions (e.g., Control, Treated, etc.) for each genotype listed in the data file. Otherwise, the user can move to the next option to perform/click all available analysis buttons (scatter plot, distribution fit, and Pearson Correlation, etc.) once a data file is loaded (whether normalized or in raw count).
Data Pre-Processing
Upon submitting data files and all supporting files (gene length, negative control genes, and metadata table), the user can filter the lowly expressed genes by indicating the minimum expression value and the minimum number of samples that are required to exceed the threshold for each gene. If input data contain raw read counts, user can choose one of the normalization options (FPKM, RPKM, TPM, upper quartile, and RUV) listed upon availability of supporting files. FPKM, RPKM, and TPM option perform normalization for sequencing depth and gene length, whereas RUV and upper quartile eliminate unwanted variation between samples. To check for sample variation, Relative Log Expression (RLE) plots (Gandolfo and Speed, 2018) of input and processed data are displayed for comparison.
Scatter Plot and Distributions
The scatter plot displays all gene expressions between any two columns selected from the datafile. This is intended to show, transcriptome-wide, how each gene expression varies between any two samples. The lower the scatter, the more similar the global responses and vice-versa (Piras et al., 2014). That is, this option allows the user to get an indication of how variable the gene expressions are between any two samples (e.g., between 2 different genotypes or replicates).
After knowing this information, the next process is to make a distribution (cumulative distribution function) plot and compare with the common statistical distributions. As gene expressions are known to follow certain statistical distributions such as power-law or lognormal (Furusawa and Kaneko, 2003; Bengtsson et al., 2005; Beal, 2017; Bui et al., 2018), we included the distribution test function. Previously, we have used power-law distribution to perform low signal-to-noise expression cutoff with FPKM expression threshold of less than 10 (Simeoni et al., 2015). Thus, this mode allows the user to check the deviation of their expression pattern with appropriate statistical distributions to select reliable genes for further analysis.
ABioTrans allows the comparison with (i) log-normal, (ii) Pareto or power-law, (iii) log-logistic (iv) gamma, (v) Weibull, and (vi) Burr distributions. To compare the quality of statistical distribution fit, the Akaike information criterion (AIC) can also be evaluated on this screen.
Pearson and Spearman Correlations
This mode allows the user to compute linear (Pearson) and monotonic non-linear (Spearman) correlations, (i) in actual values in a table or (ii) as a density gradient plot between the samples.
Pca and K-Means Clustering
The PCA button plots the variance of all principal components and allows 2-D and 3-D plots of any PC-axis combination. There is also a slide bar selector for testing the number of k-means clusters.
Entropy and Noise
These functions measure the disorder or variability between samples using Shannon entropy and expressions scatter (Shannon, 1948; Bar-Even et al., 2006). Entropy values are obtained through binning approach and the number of bins are determined using Doane’s rule (Doane, 1976; Piras et al., 2014).
To quantify gene expressions scatter, the noise function computes the squared coefficient of variation (Gandolfo and Speed, 2018), defined as the variance (σ2) of expression divided by the square mean expression (μ2), for all genes between all possible pairs of samples (Piras et al., 2014).
Differential Expression Analysis
ABioTrans provides users with 3 options to carry out DE analysis on data with replicates: edgeR, DESeq2, and NOISeq (McCarthy et al., 2012; Love et al., 2014; Tarazona et al., 2015). In case there are no replicates available for any of the experimental condition, technical replicates can be simulated by NOISeq. edgeR and DESeq2 requires filtered raw read counts, therefore, it is recommended that the user provide input data file containing raw counts if DE analysis is required using either of the two methods. On the other hand, if only normalized gene expression data is available, NOISeq is recommended.
To better visualize DE analysis result by edgeR and DESeq, volcano plot (plot of log10-p-value and log2-fold change for all genes) distinguishing the significant and insignificant, DE and non-DE genes, is displayed. Plot of dispersion estimation, which correlates to gene variation, is also available in accordance to the selected analysis method.
Hierarchical Clustering and Heatmap
This function allows clustering of differentially expressed genes. User can either utilize the result from DE analysis, or carry out clustering independently by indicating the minimum fold change between 2 genotypes.
For clustering independently, normalized gene expression (output from pre-processing tab) first undergo scaling defined by where is the scaled expression of the jth gene, is expression of the jth gene in sample pi, is the mean expression across all samples and is the standard deviation (Simeoni et al., 2015). Subsequently, Ward hierarchical clustering is applied on the scaled normalized gene expression.
ABioTrans also lists the name of genes for each cluster.
Gene Ontology
This function is used to define the biological processes or enrichment of differentially regulated genes in a chosen sample or cluster. User can select among 3 gene ontology enrichment test: enrichR, clusterProfiler and GOstats (Falcon and Gentleman, 2007; Yu et al., 2012; Kuleshov et al., 2016).
The user needs to create a new csv file providing the name of genes (for each cluster) in 1 column (foreground genes). Background genes (or reference genes), if available, should be prepared in the same format. Next, the sample species, gene ID type (following NCBI database (Clough and Barrett, 2016)) and one of the three subontology (biological process, molecular function, or cellular component) need selection. The output results in a gene list, graph (clusterProfiler), and pie chart (clusterProfiler and GOstats) for each ontology.
Typical Analysis Time Estimation
The loading time of ABioTrans for a first time R user is about 30 min on a typical Windows notebook or Macbook. This is due to the installation of the various R-packages that are prerequisite to run ABioTrans. For regular R users, who have installed most packages, the initial loading can take between a few to several minutes depending on whether package updates are required. Once loaded, the subsequent re-load will take only a few seconds.
The typical time taken from pre- to post-processing using all features in ABioTrans is between 10–20 min. Table 1 below highlights the typical time taken for each execution for 3 sample data deposited in ABioTrans Github folder (zfGenes, Biofilm-Yeast, and Yeast-biofilm2).
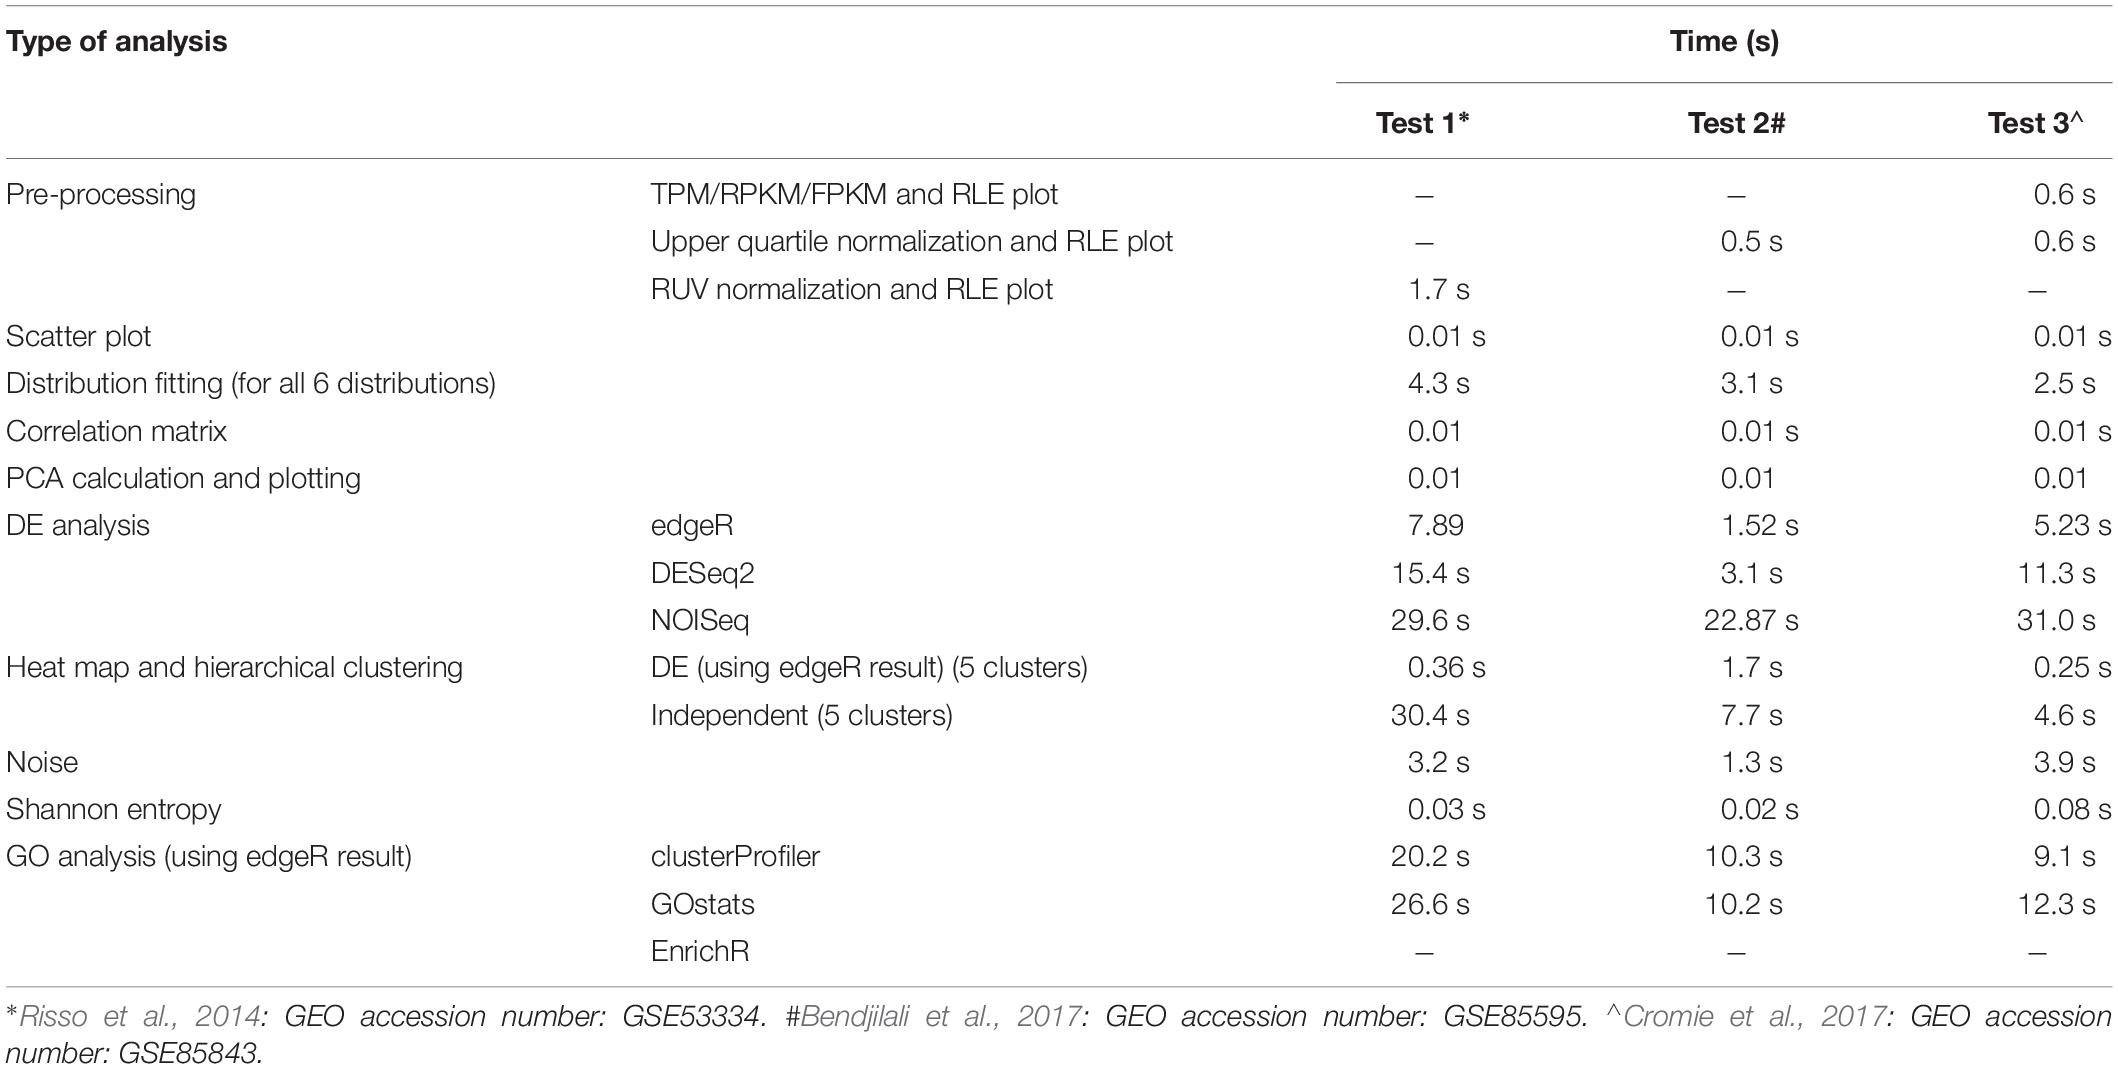
Table 1. Time comparison of functionalities for different test data.
ABioTrans has also been compared with other similar freely available RNA-Seq GUI tools, and it
demonstrates better functionalities and capabilities (Supplementary Table S1).
Summary
ABioTrans is a user-friendly, easy-to-use, point-and-click statistical tool tailored to analyse RNA-Seq data files. It can also be used to analyse any high throughput data as long as they follow the format listed in this technology report. The complete user manual to operate ABioTrans is available as Supplementary Data Sheet S1 in Supplementary Material posted online.
Availability and implementation
ABioTrans is available at: https://github.com/buithuytien/ABioTrans, Operating system(s): Platform independent (web browser), Programming language: R (RStudio), Other requirements: Bioconductor genome wide annotation databases, R-packages (shiny, LSD, fitdistrplus, actuar, entropy, moments, RUVSeq, edgeR, DESeq2, NOISeq, AnnotationDbi, ComplexHeatmap, circlize, clusterProfiler, reshape2, DT, plotly, shinycssloaders, dplyr, ggplot2). These packages will automatically be installed when the ABioTrans.R is executed in RStudio. No restriction of usage for non-academic.
Author Contributions
YZ and TTB developed the software tool. KS planned, designed the tool and wrote the manuscript. Supplementary Data Sheet S1 (user manual) was prepared by TTB.
Conflict of Interest Statement
The authors declare that the research was conducted in the absence of any commercial or financial relationships that could be construed as a potential conflict of interest.
Funding
The authors thank the Biotransformation Innovation Platform (BioTrans, A*STAR) for funding the work.
Acknowledgments
The authors thank Lin Yifeng, Ng Shi Yuan, and Nic Lindley for discussion of the work.
Supplementary Material
The Supplementary Material for this article can be found online at: https://www.frontiersin.org/articles/10.3389/fgene.2019.00499/full#supplementary-material
TABLE S1 | Comparison of functionalities of ABioTrans with other RNA-Seq tools.
References
Bar-Even, A., Paulsson, J., Maheshri, N., Carmi, M., O’Shea, E., Pilpel, Y., et al. (2006). Noise in protein expression scales with natural protein abundance. Nat. Genet. 38, 636–643.
Beal, J. (2017). Biochemical complexity drives log-normal variation in genetic expression. IET Eng. Biol. 1, 55–60.
Bendjilali, N., MacLeon, S., Kalra, G., Willis, S. D., Hossian, A. K., Avery, E., et al. (2017). Time-course analysis of gene expression during the saccharomyces cerevisiae hypoxic response. G3 7, 221–231.
Bengtsson, M., Stahlberg, A., Rorsman, P., and Kubista, M. (2005). Gene expression profiling in single cells from the pancreatic islets of Langerhans reveals lognormal distribution of mRNA levels. Genome Res. 15, 1388–1392.
Bui, T. T., Giuliani, A., and Selvarajoo, K. (2018). Statistical Distribution as a Way for Lower Gene Expressions Threshold Cutoff. J. Biol. Sci. 2, 55–57. doi: 10.13133/2532-5876_4.6
Clough, E., and Barrett, T. (2016). The gene expression omnibus database. Methods Mol. Biol. 1418, 93–110. doi: 10.1007/978-1-4939-3578-9_5
Cromie, G. A., Tan, Z., Hays, M., and Jeffery, E. W. (2017). Dissecting gene expression changes accompanying a ploidy-based phenotypic switch. G3 7, 233–246. doi: 10.1534/g3.116.036160
Falcon, S., and Gentleman, R. (2007). Using GOstats to test gene lists for GO term association. Bioinformatics 23, 257–258.
Gandolfo, L. C., and Speed, T. P. (2018). RLE plots: visualizing unwanted variation in high dimensional data. PLoS One 13:e0191629. doi: 10.1371/journal.pone.0191629
Kuleshov, M. V., Jones, M. R., Rouillard, A. D., Fernandez, N. F., Duan, Q., Wang, Z., et al. (2016). Enrichr: a comprehensive gene set enrichment analysis web server 2016 update. Nucleic Acids Res. 44, W90–W97. doi: 10.1093/nar/gkw377
Love, M. I., Huber, W., and Anders, S. (2014). Moderated estimation of fold change and dispersion for RNA-seq data with DESeq2. Genome Biol. 15:550.
McCarthy, D. J., Chen, Y., and Smyth, G. K. (2012). Differential expression analysis of multifactor RNA-Seq experiments with respect to biological variation. Nucleic Acids Res. 40, 4288–4297. doi: 10.1093/nar/gks042
Mortazavi, A., Williams, B. A., McCue, K., Schaeffer, L., and Wold, B. (2008). Mapping and quantifying mammalian transcriptomes by RNA-Seq. Nat. Methods 5, 621–628. doi: 10.1038/nmeth.1226
Piras, V., and Selvarajoo, K. (2015). The reduction of gene expression variability from single cells to populations follows simple statistical laws. Genomics 105, 137–144. doi: 10.1016/j.ygeno.2014.12.007
Piras, V., Tomita, M., and Selvarajoo, K. (2014). Transcriptome-wide variability in single embryonic development cells. Sci. Rep. 4:7137. doi: 10.1038/srep07137
Poplawski, A., Marini, F., Hess, M., Zeller, T., Mazur, J., and Binder, H. (2016). Systematically evaluating interfaces for RNA-seq analysis from a life scientist perspective. Brief. Bioinform. Mar. 17, 213–223. doi: 10.1093/bib/bbv036
Risso, D., Ngai, J., Speed, T. P., and Dudoit, S. (2014). Normalization of RNA-seq data using factor analysis of control genes or samples. Nat. Biotechnol. 32, 896–902. doi: 10.1038/nbt.2931
Russo, F., and Angelini, C. (2014). RNASeqGUI: a GUI for analysing RNA-Seq data. Bioinformatics 30, 2514–2516. doi: 10.1093/bioinformatics/btu308
Shannon, C. E. (1948). A mathematical theory of communication. Bell. Syst. Tech. J. 379–423, 623–656.
Simeoni, O., Piras, V., Tomita, M., and Selvarajoo, K. (2015). Tracking global gene expression responses in T cell differentiation. Gene 569, 259–266. doi: 10.1016/j.gene.2015.05.061
Tarazona, S., Furió-Tarí, P., Turrà, D., Pietro, A. D., Nueda, M. J., Ferrer, A., et al. (2015). Data quality aware analysis of differential expression in RNA-seq with NOISeq R/Bioc package. Nucleic Acids Res. 43:e140. doi: 10.1093/nar/gkv711
Trapnell, C., Williams, B. A., Pertea, G., Mortazavi, A., Kwan, G., van Baren, M. J., et al. (2010). Transcript assembly and quantification by RNA-seq reveals unannotated transcripts and isoform switching during cell differentiation. Nat. Biotechnol. 28, 511–515. doi: 10.1038/nbt.1621
Tsuchiya, M., Piras, V., Choi, S., Akira, S., Tomita, M., Giuliani, A., et al. (2009). Emergent genome-wide control in wildtype and genetically mutated lipopolysaccarides-stimulated macrophages. PLoS One 4:e4905. doi: 10.1371/journal.pone.0004905
Velmeshev, D., Lally, P., Magistri, M., and Faghihi, M. A. (2016). CANEapp: a user-friendly application for automated next generation transcriptomic data analysis. BMC Genomics 17:49. doi: 10.1186/s12864-015-2346-y
Wagner, G. P., Kin, K., and Lynch, V. J. (2012). Measurement of mRNA abundance using RNA-seq data: RPKM measure is inconsistent among samples. Theory Biosci. 131, 281–285. doi: 10.1007/s12064-012-0162-3
Keywords: transcriptomics, correlation, entropy, noise, DEG (differentially expressed genes), RNA-seq, clustering, gene expression data
Citation: Zou Y, Bui TT and Selvarajoo K (2019) ABioTrans: A Biostatistical Tool for Transcriptomics Analysis. Front. Genet. 10:499. doi: 10.3389/fgene.2019.00499
Received: 17 August 2018; Accepted: 07 May 2019;
Published: 31 May 2019.
Edited by:
Juilee Thakar, University of Rochester, United StatesReviewed by:
Gaurav Sablok, Finnish Museum of Natural History, FinlandFrederico Moraes Ferreira, University of São Paulo, Brazil
Copyright © 2019 Zou, Bui and Selvarajoo. This is an open-access article distributed under the terms of the Creative Commons Attribution License (CC BY). The use, distribution or reproduction in other forums is permitted, provided the original author(s) and the copyright owner(s) are credited and that the original publication in this journal is cited, in accordance with accepted academic practice. No use, distribution or reproduction is permitted which does not comply with these terms.
*Correspondence: Kumar Selvarajoo, a3VtYXJfc2VsdmFyYWpvb0BiaW90cmFucy5hLXN0YXIuZWR1LnNn
†These authors have contributed equally to this work