 Tao Wang1†
 Zhifa Han1†
 Yu Yang2†
 Rui Tian1
 Wenyang Zhou1
 Peng Ren1
 Pingping Wang1
 Jian Zong1
 Yang Hu1Qinghua Jiang*
- 1School of Life Sciences and Technology, Harbin Institute of Technology, Harbin, China
- 2Information Department, Jiangsu Singch Pharmaceutical Co., Ltd., Lianyungang, China
Alzheimer’s disease (AD) is a common neurodegenerative disease. APOE is the strong genetic risk factor of AD. The existing genome-wide association studies have identified many single nucleotide polymorphisms (SNPs) with minor effects on AD risk and the polygenic risk score (PRS) is presented to combine the effect of these SNPs. On the other hand, the volumes of various brain regions in AD patients have significant changes compared to that in normal individuals. Ch4 brain region containing at least 90% cholinergic neurons is the most extensive and conspicuous in the basal forebrain. Here, we investigated the relationship between the combined effect of AD-associated SNPs and Ch4 volume using the PRS approach. Our results showed that Ch4 volume in AD patients is significantly different from that in normal control subjects (p-value < 2.2 × 10⁻¹⁶). AD PRS, is not associated with the Ch4 volume in AD patients, excluding the APOE region (p-value = 0.264) and including the APOE region (p-value = 0.213). However, AD best-fit PRS, excluding the APOE region, is associated with Ch4 volume in normal control subjects (p-value = 0.015). AD PRS based on 8070 SNPs could explain 3.35% variance of Ch4 volume. In addition, the p-value of AD PRS model in normal control subjects, including the APOE region, is 0.006. AD PRS based on 8079 SNPs could explain 4.23% variance of Ch4 volume. In conclusion, PRS based on AD-associated SNPs is significantly related to Ch4 volume in normal subjects but not in patients.
Introduction
Alzheimer’s disease (AD) is a complex and severe neurodegenerative disorder. It is characterized by progressive deterioration in cognition and behavior, which seriously affects people’s daily life (Hu et al., 2017; Jiang et al., 2017; Liu et al., 2018). Genetic factors can lead to 60–80% of AD risk (Lambert et al., 2010). The APOE gene is the strongest genetic risk factor for late-onset AD (Corder et al., 1993). Several existing AD genome-wide association studies (GWASs) have identified many common single nucleotide polymorphisms (SNPs) with relatively small effect size (Hindorff et al., 2009; Lambert et al., 2013). The combined effect of these SNPs could make a significant contribution to AD risk. The polygenic risk score (PRS) was described to depict quantitatively the combined effect of SNPs on disease risk (International Schizophrenia Consortium, 2009). It has been reported that PRS based on disease-related SNPs was associated with disease risk and can work as a predictor of disease risk (Escott-Price et al., 2015; Lupton et al., 2016; Escott-Price et al., 2017). In addition, several authors investigated the effect of PRS on both disease status and disease-associated phenotypes (also called endo-phenotype) (Harris et al., 2014; Marden et al., 2016; Axelrud et al., 2018). Axelrud et al. (2018) found AD PRS was an implication for memory performance and hippocampus volumes in early life. Harris et al. (2014) found there was no significant association between polygenic risk for AD and cognitive ability in non-demented older people. PRS for AD was utilized to predict memory decline in black and white Americans (Marden et al., 2016). Some studies have reported that the brain structure changes significantly in some nervous system disease compared to normal subjects by using magnetic resonance imaging (MRI) (Zhang et al., 2011; Alattas and Barkana, 2015; Mattavelli et al., 2015). In addition, brain-associated endo-phenotypes were commonly used to analyze the effect of disease-associated SNPs. Late-onset AD PRS was used to predict hippocampus function (Xiao et al., 2017). AD polygenic risk was proved to modulate precuneal volume (Li et al., 2018). Terwisscha van Scheltinga et al. (2013) found schizophrenia-associated genetic risk variants jointly modulate total brain and white matter volume by PRS approach.
Recently, a study demonstrated that basal forebrain degeneration precedes the cortical spread of AD pathology (Schmitz et al., 2016). There is the early pathological change of the nucleus basalis of meynert (NbM) in the basal forebrain (Grothe et al., 2012, 2013). Basal forebrain consists of magnocellular cholinergic cells and designated into Ch1–Ch4 according to the distribution difference of cholinergic neurons, with Ch4 corresponding to NbM (Mesulam et al., 1983). Ch4 region is the most extensive and conspicuous of Ch1–Ch4, containing more than 90% of cholinergic neurons (Mesulam et al., 1983). In fact, the Ch4 region provides the entire cortical surface with the single major source of cholinergic innervation (Mesulam et al., 1983). Ch4 region has plenty of functions, such as memory, attention, and modulation of the behavioral state (Gratwicke et al., 2013). Increasing studies have revealed that Ch4 region plays a major role in the function of memory (Butt and Hodge, 1995; Leanza et al., 1996; McGaugh, 2002). In addition, the Ch4 region and its cholinergic projections play an essential role in regulating a wide variety of attention functions (Voytko, 1996; McGaughy et al., 2002). Grothe et al. (2012) found atrophy of the cholinergic basal forebrain especially NBM (Ch4 region) in progressive AD. Previous studies have demonstrated that maximum 96% of Ch4 neuronal loss occurs in AD compared to normal control subjects (Whitehouse et al., 1981; Candy et al., 1983; Etienne et al., 1986). Volumetric MR imaging reveals that NBM (Ch4 region) significantly degenerates in AD patients compared with age-matched normal subjects (Hanyu et al., 2002). Teipel et al. (2011) discovered that the NBM (Ch4 region) cholinergic projection axons shrink in AD patients by high-resolution diffusion tensor imaging. Considering the early degeneration of Ch4 neurons in AD patients, we selected Ch4 brain region as an ideal candidate endo-phenotype to investigate the effect of AD-associated genetic risk variants.
It is well known that the APOE gene is significantly associated with AD risk. Therefore, in order to explore the APOE influence on AD PRS, PRS in this article is constructed based on AD-associated SNPs, excluding the APOE region and including the APOE region, respectively. This paper is aimed at exploring the relationship between AD PRS and Ch4 volume to answer following questions. Firstly, is there a significant difference of Ch4 volume between AD patients and normal control subjects? Secondly, is AD PRS significantly related with Ch4 volume in AD patients and normal control subjects, respectively?
Materials and Methods
Discovery Samples
Alzheimer’s disease GWAS summary data was obtained from the International Genomics of Alzheimer’s Project (IGAP) (Lambert et al., 2013). IGAP is a large two-stage study based on GWAS on individuals of European ancestry. In stage 1, IGAP performed a meta-analysis on four previous-published GWAS datasets containing 17,008 AD patients and 37,154 normal controls using 7,055,881 SNPs. In stage 2, 11,632 SNPs were genotyped and tested for association in an independent population consisting of 8,572 AD patients and 11,312 normal controls (Lambert et al., 2013). The stage 1 dataset is used to identify risk variants, their P values and corresponding odds ratios.
Target Samples
Magnetic resonance imaging and genetic data used in this paper were available from the Alzheimer’s Disease Neuroimaging Initiative (ADNI) database1. The ADNI was launched in 2003 as a public-private partnership, led by Principal Investigator Michael W. Weiner, MD. The primary goal of ADNI has been to test whether serial MRI, positron emission tomography (PET), other biological markers, and clinical and neuropsychological assessment can be combined to measure the progression of mild cognitive impairment (MCI) and early AD. We can obtain the SNP data and neuroimaging data of every participant at the same time in the ADNI database. In other words, both SNP and neuroimaging data are sampled from each participant in the ADNI database. We selected 108 AD patients and 182 normal control (NC) subjects according to sample diagnostic results. We removed four samples (099_S_4086, 027_S_1387, 116_S_1232, 037_S_4432) owing to their outliers of Ch4 volume. The remaining 106 AD patients (Supplementary Table S1) and 180 normal control subjects (Supplementary Table S2) were used as target samples for further analysis. All information on recruitment and diagnostic criteria could be reached on the ADNI website.
MRI Analysis
Magnetic resonance imaging data were acquired according to a standardized protocol, which included a high-quality T1-weight, magnetization prepared rapid gradient echo (MP-RAGE) sequence (Jack et al., 2008). MP-RAGE acquisition parameters for one platform (Philips Medical Systems) are as follows: TR = 6.76 ms, TE = 3.11 ms, FA = 9°, matrix size = 256 × 256, slice thickness = 1.2 mm, number of slices = 170, voxel size x = 1.05 mm and voxel size y = 1.05 mm. Quality control of MRI data was performed at the Mayo Clinic based on centralized and standardized criteria (Jack et al., 2008).
All MRI data were transformed into NII files in the first place using MRIConvert software tool. All anatomical images were preprocessed by using the diffeomorphic anatomical registration through exponentiated lie algebra (DARTEL) in SPM12 (Ashburner, 2007). Basically, neuroimages were first segmented into the grey matter (GM), white matter (WM), cerebrospinal fluid (CSF), skull and soft tissue. Then, DARTEL was used to increase the accuracy of inter-subject alignment for generating a population template in montreal neurological institute (MNI) space. Finally, all GM neuroimages were normalized to MNI space based on the population template and smoothed with a Gaussian kernel of 8 mm, and they were subjected to modulation that depicted the tissue volumes. Voxel size for GM neuroimage was specified with 1.5 mm3. GM, WM and CSF volumes were available from the files containing segmentation parameters. The sum of these three tissues was computed as the total intracranial volume (ICV), and the sum of GM and WM volume was computed as the total parenchymal brain volume (TBV).
ROI for Ch4 in MNI space was achieved by using the SPM Anatomy toolbox (Eickhoff et al., 2005). Zaborszky et al. (2008) presented stereotaxic probabilistic maps of the magnocellular cell groups in human basal forebrain based on 10 postmortem brains, including Ch4 region. The ROI for Ch4 was created based on Ch4 probabilistic map. Because voxel size for the Ch4 ROI is 1 mm3, which is not consistent with smoothed and modulated GM neuroimage. It is necessary to co-register the Ch4 ROI with smoothed and modulated GM neuroimage. Co-registering Ch4 ROI and extracting ROI signals were performed utilizing DPABI software (Yan et al., 2016).
Genetic Analysis
The genetic data were available from the ADNI webpage. ADNI participants were genotyped using the Illumina Omni 2.5M SNP arrays. The genetic data consist of 2,379,855 SNPs. We extracted 2,134,825 SNPs with rs or kgp prefix, which are located in 1–22 chromosomes. We performed a series of quality control procedures on these genetic data using PLINK tool set (Purcell et al., 2007). Firstly, individuals with more than 5% missing SNPs were removed. All participants approved the filter. Then, we removed 789,861 variants owing to minor allele frequencies of less than 0.02. Thirdly, 84,891 SNPs were taken away due to more than 1% missing genotypes. Next, we removed 2,597 variants according to Hardy-Weinberg exact test at a specified significant threshold of 1 × 10⁻⁶. Finally, in order to remove SNPs in linkage disequilibrium, 1,024,426 SNPs were pruned according to a pairwise R2 cutoff of 0.25 and a window of 50 SNPs with shifting five SNPs at every step (Terwisscha van Scheltinga et al., 2013). In the end, 233,050 variants with rs or kgp prefix were selected. 76,312 of 233,050 variants were available in the AD summary dataset. The genomic location for APOE gene is chr19: 45,409,011 – 45,412,650 (GRCh37/hg19). There are 11 SNPs with a 70 kb region which surround the APOE gene (rs1871047, rs11879589, rs387976, rs6859, rs283814, rs157582, rs405509, rs439401, rs445925, rs3760627, rs204479). We obtained 76,301 SNPs, excluding the APOE gene, and 76,312 SNPs, including the APOE gene, for subsequent analysis.
Statistical Analysis
Individual age was computed as study date minus birth date. ICV was adjusted for age and gender. TBV, GM volume, WM volume and Ch4 volume were corrected for age, gender and ICV using linear regression in total groups. The correction method was described by Terwisscha van Scheltinga et al. (2013). Briefly, non-standard residual of volume for every participant could be obtained by linear regression. Then, the sum of non-standard residue of volume, intercept and was calculated as corrected volume, where m refers to the number of the covariate, betai represents the regression coefficient of covariate i, and meani denotes the mean of covariate i. All adjusted brain volumes are normally distributed in the total groups, AD patients and normal control subjects, respectively.
Polygenic risk score model is described by International Schizophrenia Consortium (2009). Every SNP has a corresponding P value for its association with AD. Basically, for each SNP, the variant risk score is calculated by multiplying the risk allele number (0, 1, 2) with the corresponding effect size, by the logarithm of the odds ratio. For each participant, the PRS is summed on all SNPs with P value below a threshold, PT. PRS is calculated at a series of P value thresholds, e.g., PT = 0.0001, 0.0002, …, 0.05, …, 0.1, …,0.5. The P value threshold, PT, with the largest R2 is the most predictive cutoff. We calculated the PRS using a lower bound of P = 0, an upper bound of P = 0.6 and an increment of 0.0001 by PRSice software (version 1.25) (Euesden et al., 2015). PRSice can calculate PRS at a great number of cutoffs, apply PRS and plot the results of PRS.
The first ten principal components of population structure for AD patients and normal control subjects were achieved in PLINK software using the multidimensional scaling plot option (Purcell et al., 2007). And the number of non-missing SNPs used for scoring and inbreeding coefficient for AD patients and normal control subjects were also calculated in PLINK using the het option (Purcell et al., 2007). APOE status is coded as 0, 1, or 2, according to the number of APOE ε4. We performed linear regressions using Ch4 volume as an outcome variable in AD patients and normal control subjects, respectively, and the number of non-missing SNPs, inbreeding coefficient, the first ten population structure components and APOE status were as covariates. R2 was compared with a model only containing these covariates and a model containing these covariates and PRS. The difference in R2 between the two models is used to measure variance explained by PRS. These regression analyses were performed using PRSice (Euesden et al., 2015).
Gender difference between AD patients and normal control subjects is examined by the chi-square test in SPSS (version 22; IBM). Welch t-test is applied to examine brain volume and age difference between two groups using the R script. The p-value < 0.05 is considered statistically significant in this paper.
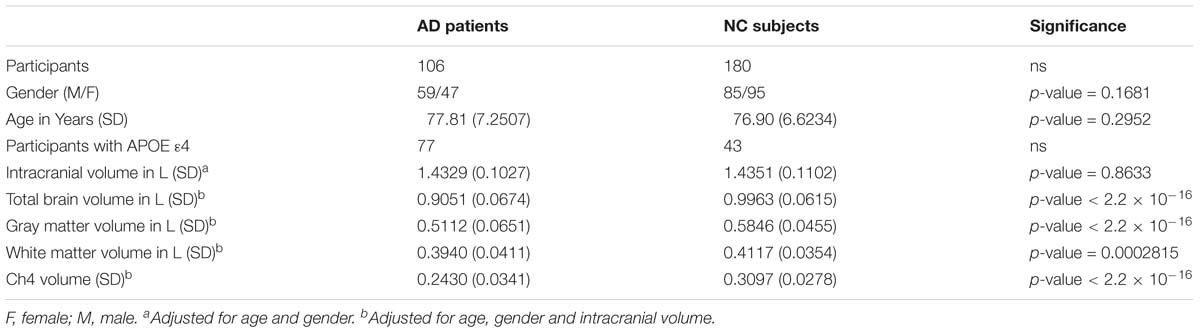
Table 1. Demographic information.
Results
Statistical Analysis of Brain Volume
Demographic information is shown in Table 1. There is no significant differences in age (p-value = 0.2952) and in gender distribution (p-value = 0.1681) between AD group and normal control group. The number of participants with APOE ε4 in AD patients and normal control subjects is 77 and 43, respectively. In addition, it does not seem to make a difference in intracranial volume corrected for age and gender between the two groups (p-value = 0.8633). Total brain volume corrected for age, gender and intracranial volume in normal control subjects is larger than that in AD patients (p-value < 2.2 × 10⁻¹⁶). Our results indicated that both GM and WM volume adjusted for age, gender and intracranial volume in AD patients are smaller than that in normal control subjects (p-value < 2.2 × 10⁻¹⁶ and p-value = 0.0002815, respectively). In addition, Ch4 volume corrected age, gender and intracranial volume in AD patients is smaller than that in normal control subjects. Most importantly, there is a significant difference in Ch4 volume between AD patients and normal subjects (p-value < 2.2 × 10⁻¹⁶; Figure 1).
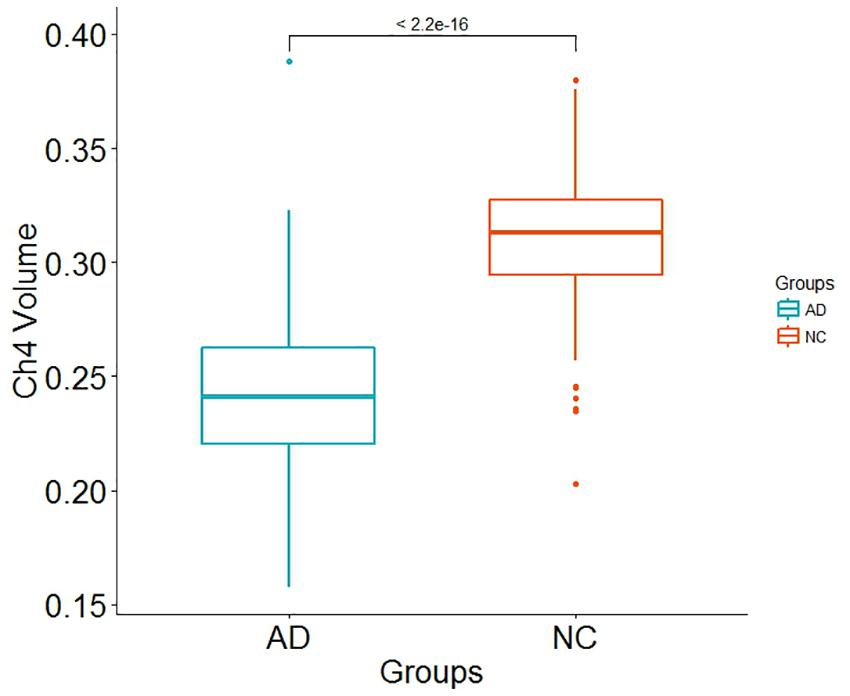
Figure 1. Box plot for Ch4 volume difference between AD patients and normal control subjects.
The AD Polygenic Risk Score Is Not Associated With Ch4 Volume in AD Patients
Alzheimer’s disease PRS based on AD-associated SNPs, excluding the APOE region, was used to predict Ch4 volume in AD patients using linear regression. There is no significant relationship between AD PRS and Ch4 volume at the different P value cutoffs (PT = 0.001, 0.05, 0.1, 0.2, 0.3, 0.4, 0.5), because of all p-value of PRS model (p-value = 0.674, 0.546, 0.667, 0.428, 0.638, 0.726, 0.836) > 0.05, according to the PRS bar plot (Figure 2). On the basis of high-resolution PRS plot (Figure 3), the best-fit P value threshold for the PRS model is 0.2106. However, the p-value of PRS model at the best-fit cutoff is 0.264. These high-resolution scores indicate that the results from the broad P value cutoff of Figure 2 are not false negatives due to the small number of cutoff considered. The PRS base on AD-associated SNPs, excluding the APOE gene, is not related with Ch4 volume in AD patients. In addition, AD PRS, including the APOE gene, was utilized to predict Ch4 volume in AD patients. According to bar plot of PRS results (Supplementary Figure S1) and high-resolution plot (Supplementary Figure S2), the best-fit P value threshold for PRS model is 0.0068, and the p-value of PRS model at PT = 0.0068 is 0.213. AD PRS, including the APOE gene, is also not related to Ch4 volume in AD patients. Therefore, AD PRS is not associated with Ch4 volume in AD patients. And AD PRS could not successfully measure Ch4 volume in AD patients.
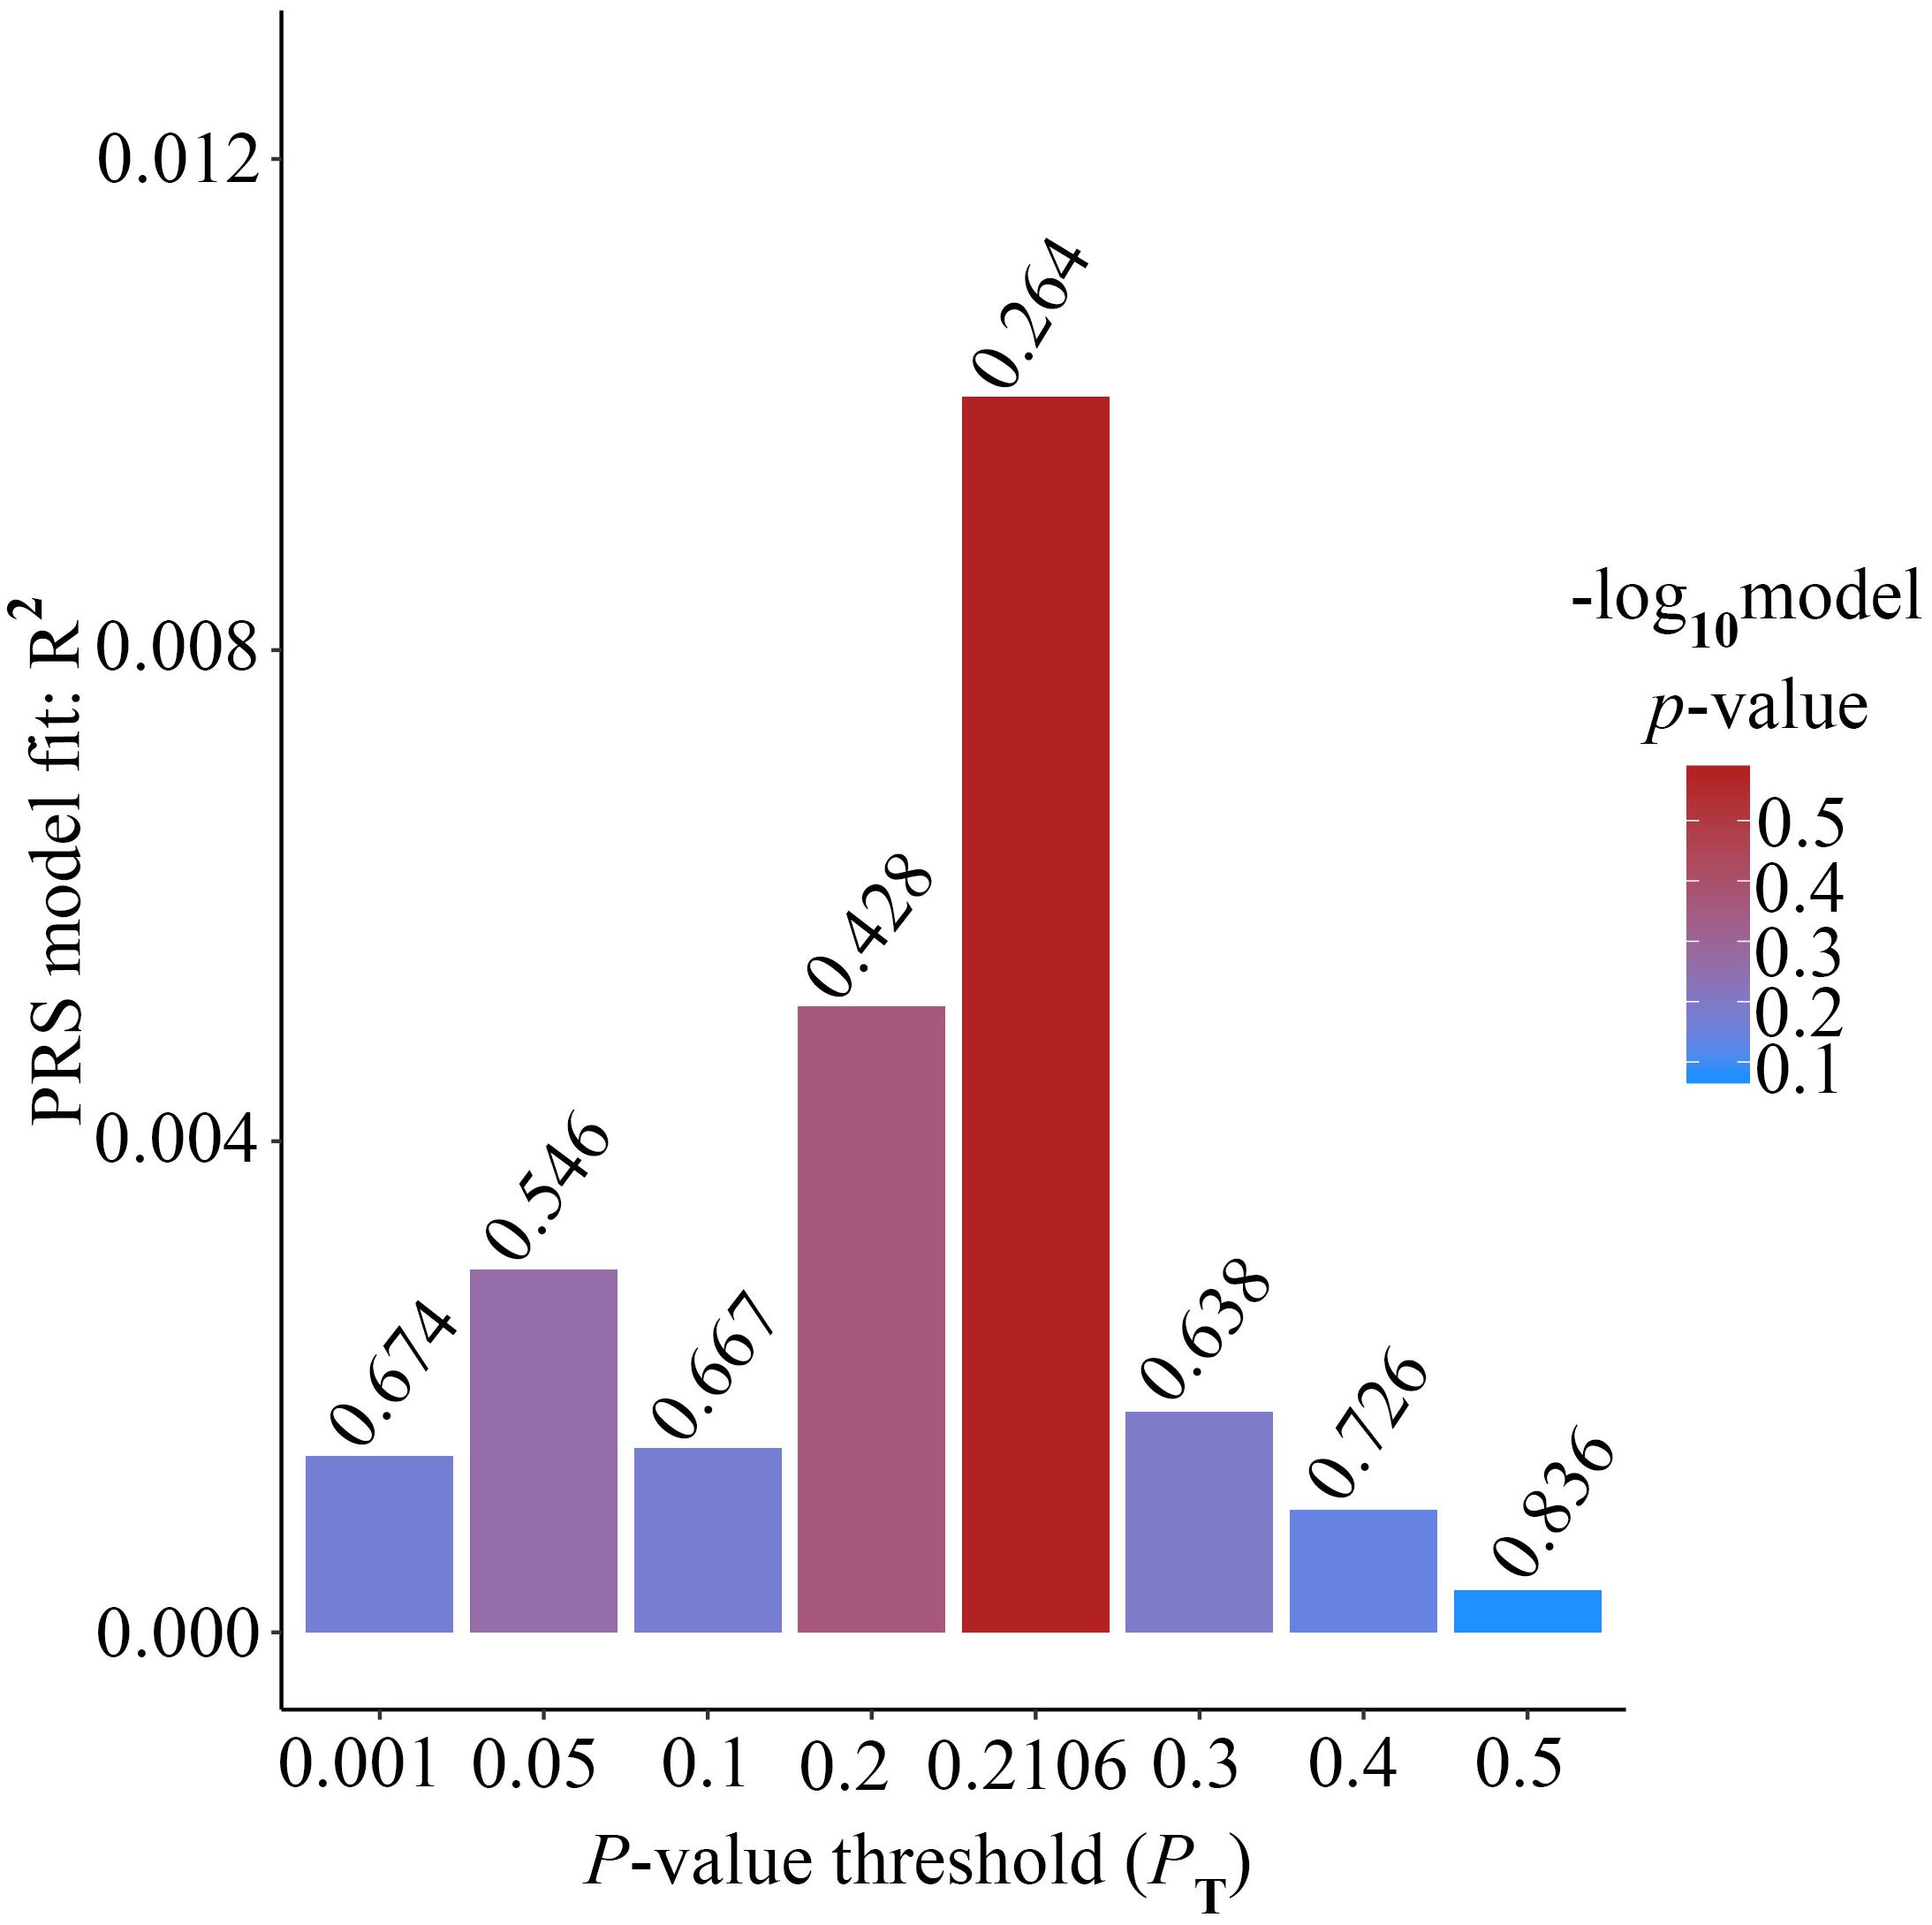
Figure 2. Bar plot showing at broad P value thresholds for AD PRS, excluding the APOE region, predicting Ch4 volume in AD patients, including a bar for the best-fit PRS from the high-resolution run.
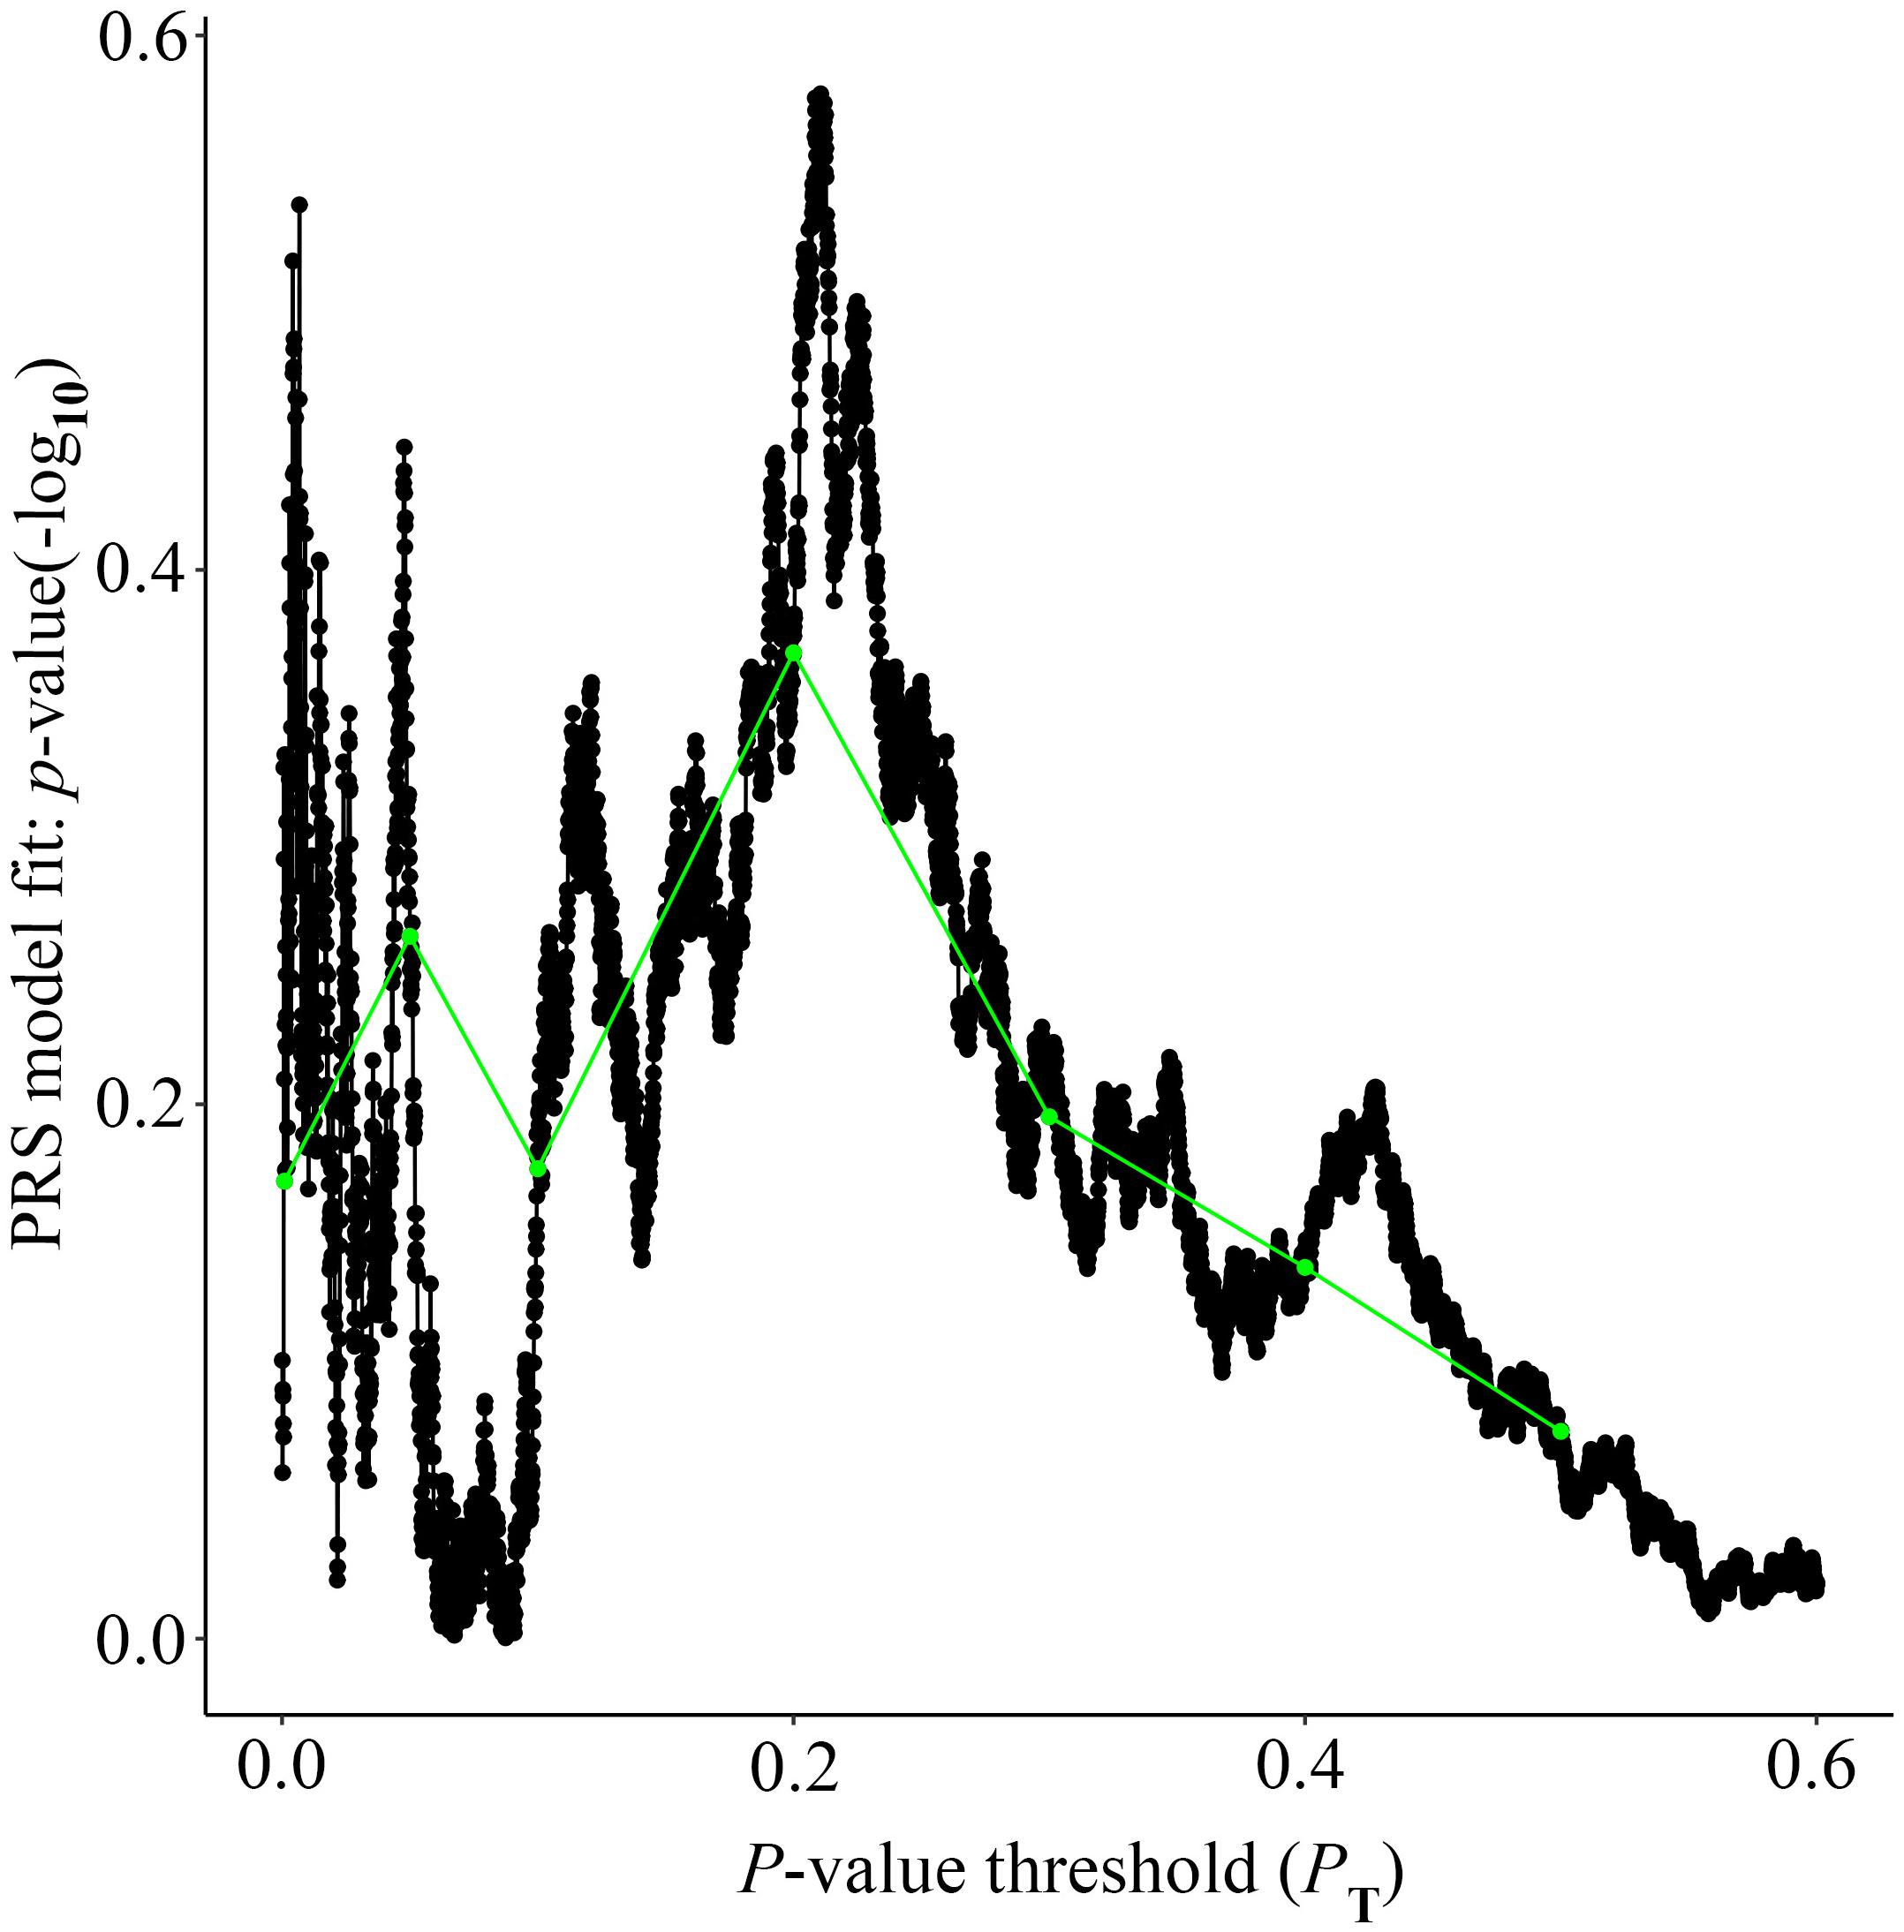
Figure 3. High-resolution plot for AD PRS, excluding the APOE region, predicting Ch4 volume in AD patients. The thick line connects points at the broad P value thresholds of Figure 2. The best-fit PRS is at PT of 0.2106.
The AD Polygenic Risk Score Is Significantly Associated With Ch4 Volume in Normal Control Subjects
Alzheimer’s disease PRS based on AD-associated SNPs, excluding the APOE region, was used to predict Ch4 volume in normal control subjects. According to bar plot of PRS results (Figure 4), the p-value of the PRS model at P value threshold of 0.1 is 0.028. There is a significant relationship between AD PRS and Ch4 volume in normal control subjects at P value threshold of 0.1. On the basis of the high-resolution plot for PRS results (Figure 5), the best threshold for PRS model is 0.0944, the p-value of the PRS model is 0.015. There are 8070 SNPs (Supplementary Table S3) with their P value < 0.0944. AD PRS based on 8070 SNPs could explain 3.35% variance of Ch4 volume in normal control subjects. When P value threshold is more or less than the best P value threshold (PT = 0.0944), the p-value of the PRS model will become greater than 0.015. When AD PRS contains more or fewer SNPs, the ability to account for the variance of Ch4 volume will decrease. AD PRS based on 8070 SNPs could act as a reliable measure for Ch4 volume in normal control subjects. In other words, AD PRS based on 8070 SNPs, excluding the APOE gene, is related to Ch4 volume in normal control subjects. Moreover, AD PRS, including the APOE gene, was used to predict Ch4 volume in normal control subjects. According to bar plot of PRS results (Supplementary Figure S3) and high-resolution plot (Supplementary Figure S4), the best-fit P value threshold for PRS model is 0.0944, and the p-value of PRS model at PT = 0.0944 is 0.006. There are 8079 SNPs with their P value < 0.0944. AD PRS based on 8079 SNPs could explain 4.23% variance of Ch4 volume in normal control subjects. In other words, AD PRS based on 8079 SNPs, including the APOE gene, is significantly related to Ch4 volume in normal controls. Therefore, AD polygenic risk score is significantly associated with Ch4 volume in normal control subjects.
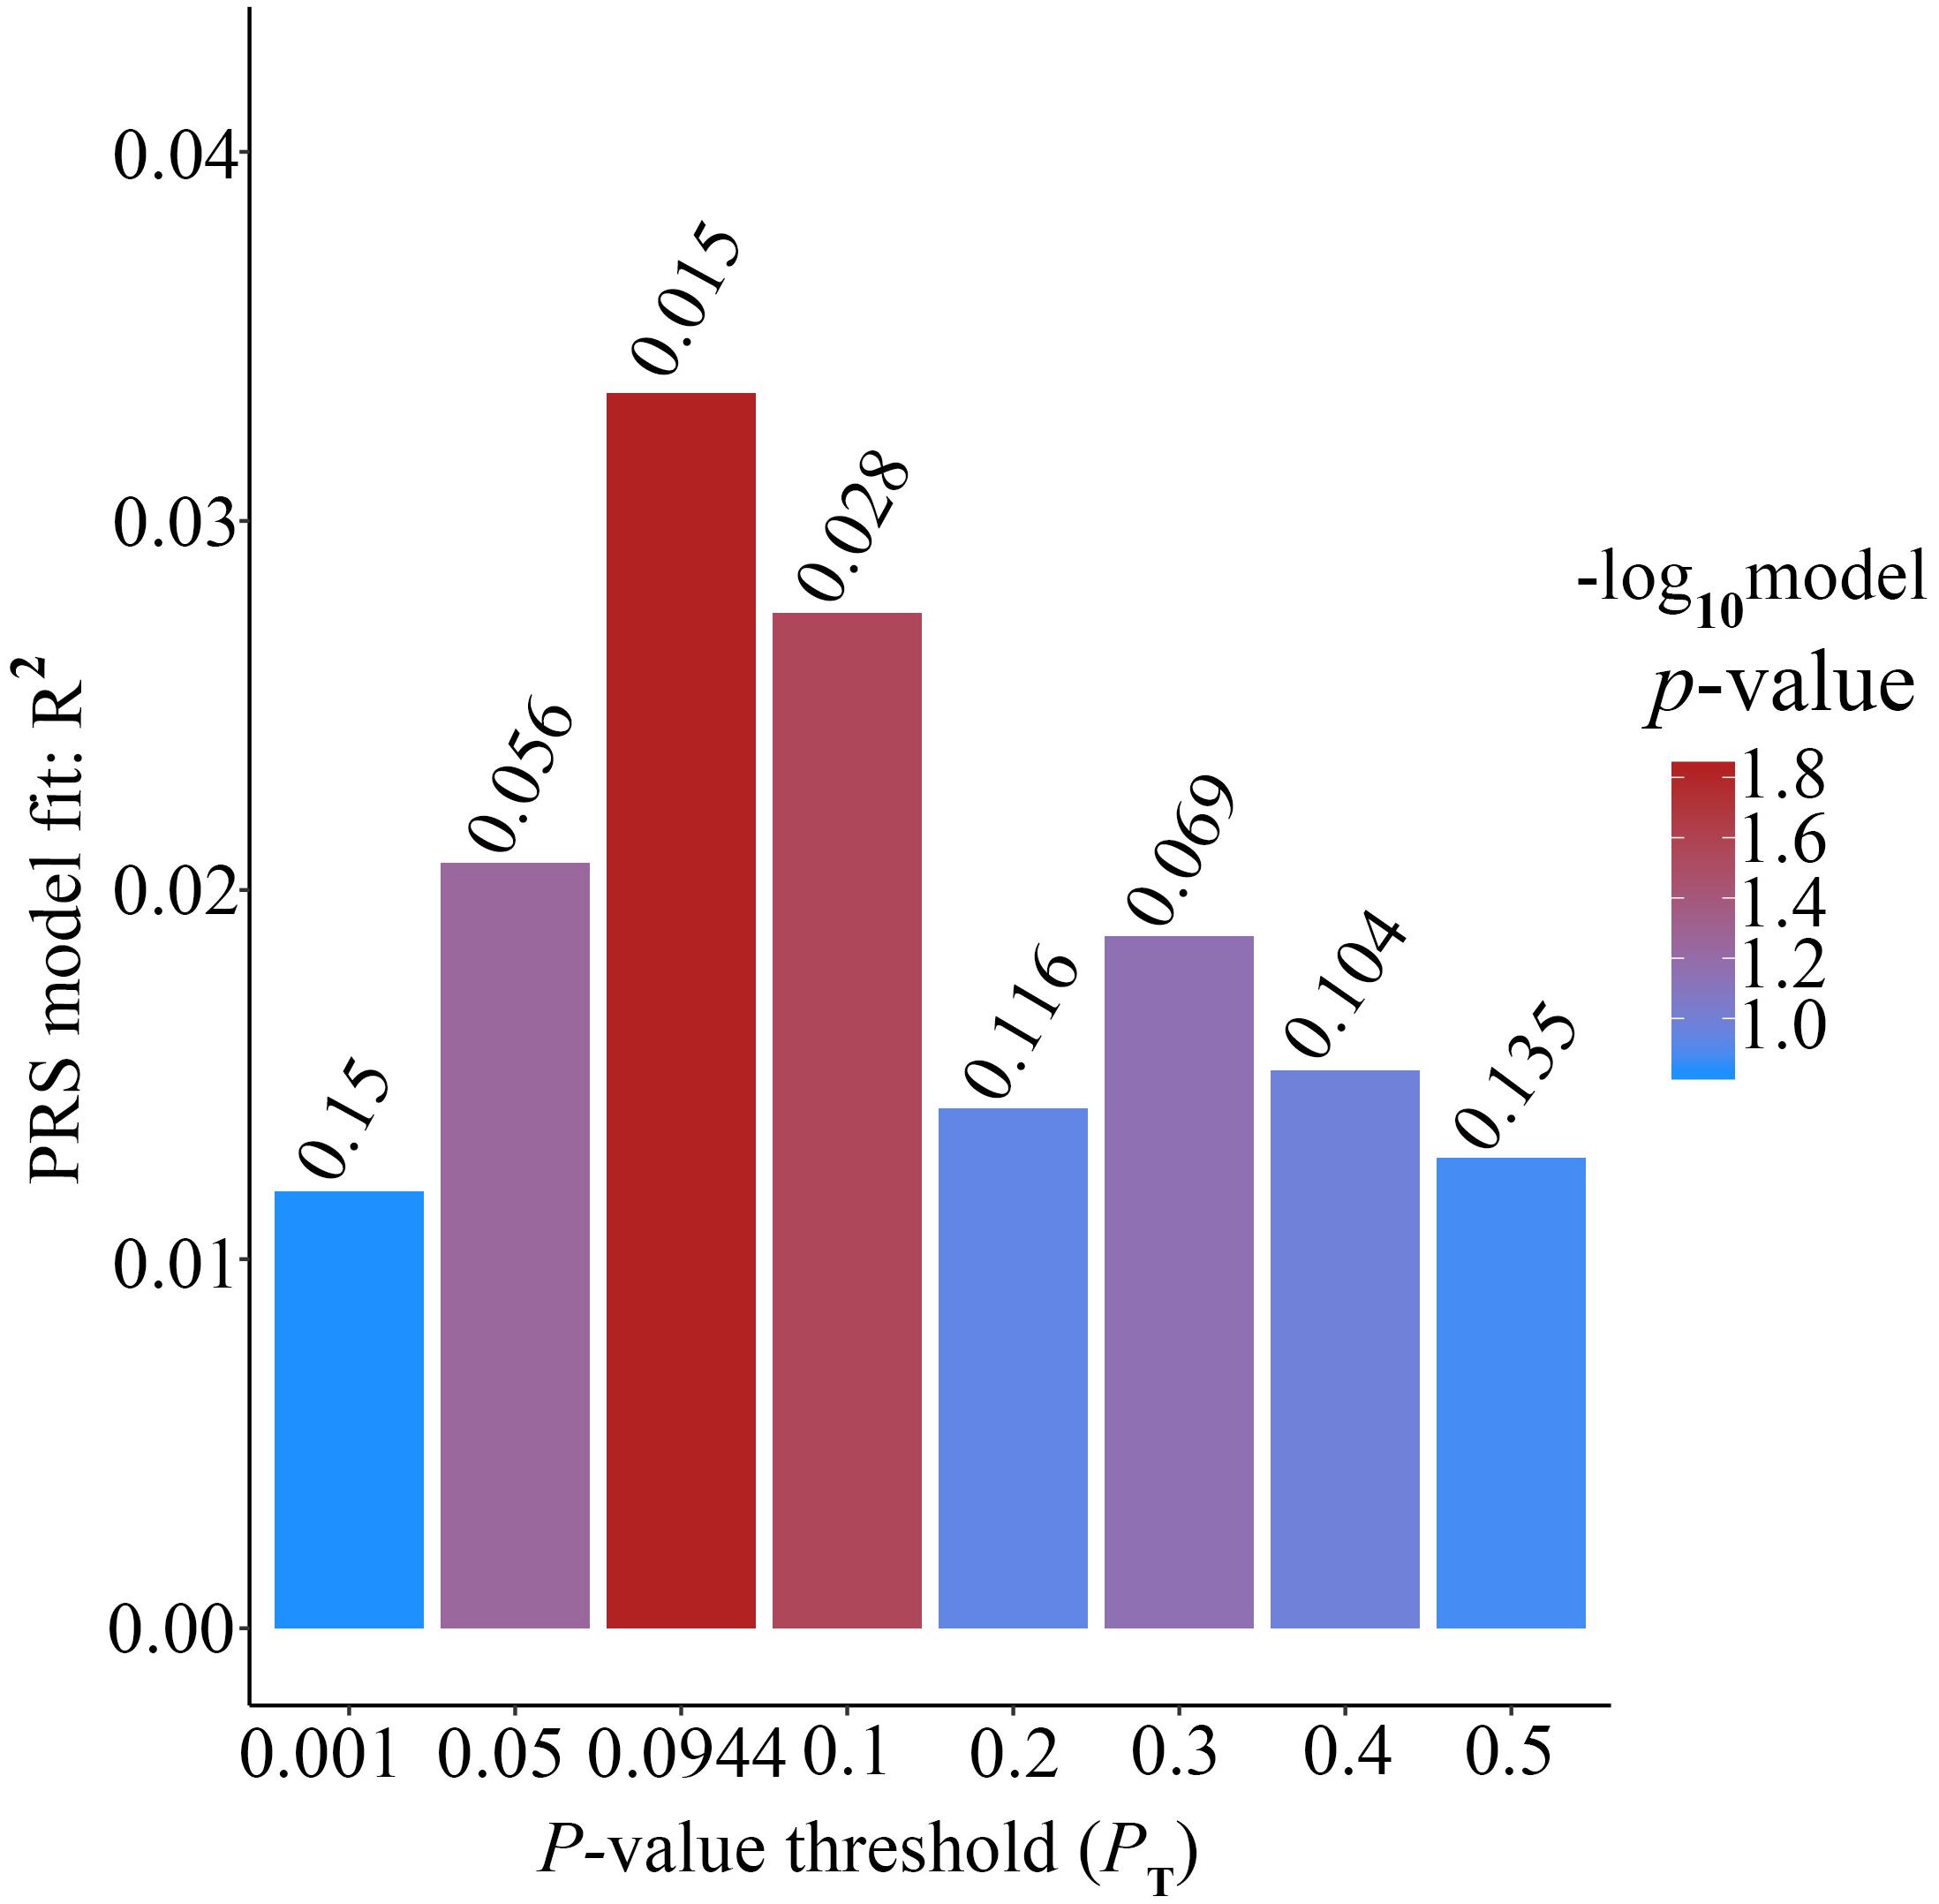
Figure 4. Bar plot showing at broad P value thresholds for AD PRS, excluding the APOE region, predicting Ch4 volume in normal control subjects, including a bar for the best-fit PRS from the high-resolution run.
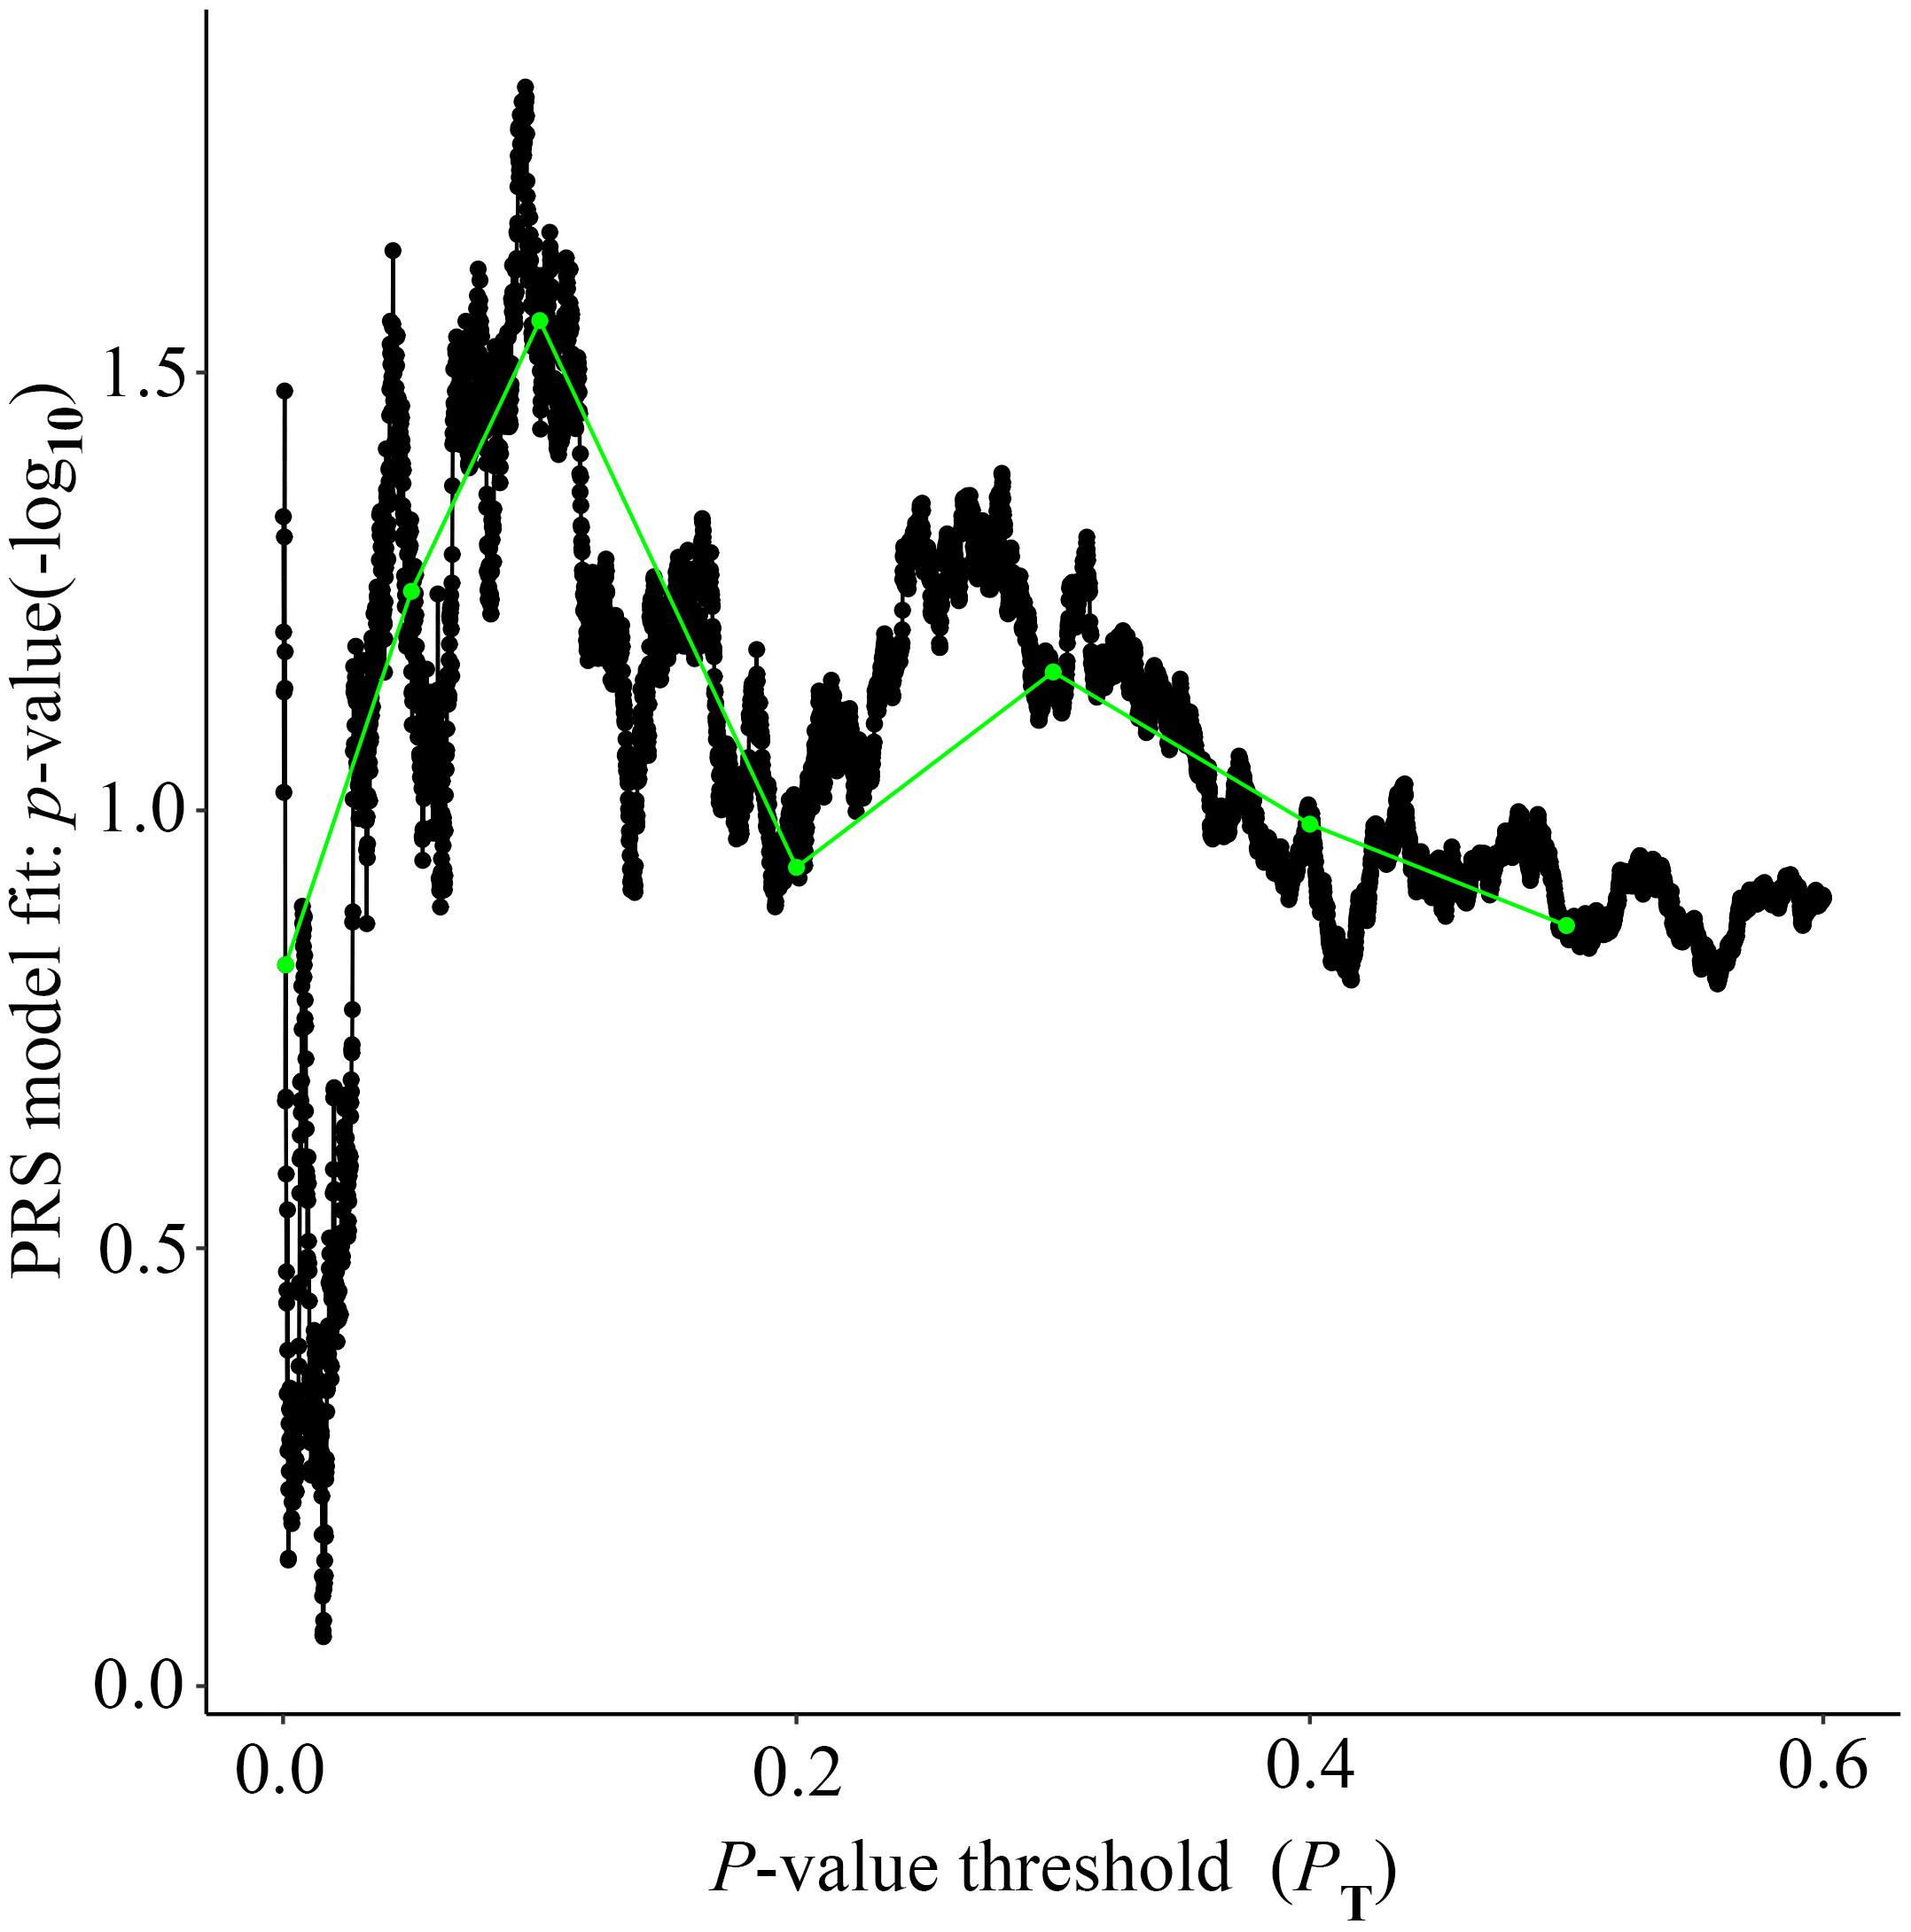
Figure 5. High-resolution plot for AD PRS, excluding the APOE region, predicting Ch4 volume in normal control subjects. The thick line connects points at the broad P value thresholds of Figure 4. The best-fit PRS is at PT of 0.0944.
Discussion
Alzheimer’s disease is a complex and polygenic disease. Current studies have demonstrated that many genetic variations are associated with AD. These genetic variations may be beneficial to understand the mechanism of AD to some extent. On the other hand, some brain regions associated with AD atrophy in AD patients by structural MRI technology. However, the details of association between some brain regions and genetic variation is still unknown. If we know this kind of detailed association, we could further get the regulatory relationship between genetic variation and brain region, which will provide valuable insights into disease mechanism, prevention and treatment. Ch4 brain region is associated with memory and cognition functions. Therefore, it is very important and necessary to analyze the association between genetic variation and Ch4 brain region.
The Ch4 brain region contains the largest, most hyper-chromic and polymorphic neurons in the basal forebrain, which supplies the single major source cholinergic innervation to the entire cortical surface (Mesulam et al., 1983). Ch4 volume could act as a phenotype associated with Alzheimer’s disease. In this article, we investigated the relationship between the combined effect of SNPs and Ch4 volume by using PRS. Our results indicated that the Ch4 volume in AD patients is smaller than that in normal control subjects, and there is the significant difference between the two groups (p-value < 2.2 × 10⁻¹⁶), which is consistent with the previous conclusions (Grothe et al., 2012, 2013; Schmitz et al., 2016). In addition, AD PRS, excluding or including APOE gene, is not linked with Ch4 volume in AD patients. However, AD PRS, excluding or including APOE gene, is significantly associated with Ch4 volume in normal control subjects. AD PRS could work as a reliable measure for Ch4 volume in normal control subjects.
Many studies found up to 96% of Ch4 neuronal loss in AD patients (Whitehouse et al., 1981; Candy et al., 1983; Etienne et al., 1986). AD PRS, excluding or including APOE gene, cannot measure successfully Ch4 volume in AD patients. This may be because Ch4 brain region in AD patients have shrunk severely so that there is no difference of Ch4 volume. Therefore, AD PRS, excluding or including APOE gene, may not be a suitable way to measure Ch4 volume in AD patients.
Many studies investigated AD-associated variants in biomarker measurements among healthy subjects using polygenic score approach (Small et al., 2000; Reiman et al., 2004; Filippini et al., 2009; Sheline et al., 2010; Sabuncu et al., 2012; Mormino et al., 2016). Sabuncu et al. (2012) found that the polygenic risk score was correlated with AD-specific cortical thickness in clinically normal human individuals, even after controlling for APOE genotype and other factors. AD genetic risk score can be used to predict the thinning of hippocampus complex sub-regions in normal older subjects (Harrison et al., 2016). Elizabeth et al. discovered that higher AD PRS was associated with smaller hippocampus volume in the younger healthy group (Mormino et al., 2016). The influences of common genetic risk variants are detectable among healthy subjects and may begin in early life (Mormino et al., 2016). Furthermore, some evidence reveals that AD-specific atrophy patterns can be identified before cognitive impairment (Csernansky et al., 2005; Jagust et al., 2006). In this study, AD PRS is significantly associated with Ch4 volume in normal control individuals. Our primary analysis suggests this association could be explained by a genetic modulation of neuro-degeneration, which is consistent with the interpretation of Sabuncu et al. (2012). This result agrees that AD-associated atrophy rates accelerate before the beginning of cognitive impairment (Mori et al., 2002; Schott et al., 2010; Andrews et al., 2016). AD PRS, excluding the APOE gene, at best-fit P value threshold (PT = 0.0944) is significantly associated with Ch4 volume in normal controls. The p-value of PRS model at PT = 0.0944 is 0.015. AD PRS based on 8070 SNPs could explain 3.35% variance of Ch4 volume. We further obtained 5397 genes of index 8070 SNPs from the dbSNP database. There are 3163 SNPs which do not have corresponding gene. 4452 SNPs have a unique corresponding gene. The rest of 455 SNPs have more than one gene. Then, we downloaded gene expression (transcripts per million, TPM) of brain nucleus accumbens (basal ganglion) tissue from Genotype-Tissue Expression (GTEx) database. We found that TPM of 3807 genes among 5397 genes is more than 0, which is about 70.54%. TPM of 3205 genes is greater than 0.5 (59.38%) and TPM of 2959 genes is more than 1 (54.83%). We will further validate these genes using biological experiments in the following studies. Furthermore, AD PRS, including APOE gene, at best-fit P value threshold is dramatically related with Ch4 volume in normal controls (p-value = 0.006). In addition, AD PRS based on 8079 SNPs could explain 4.23% variance of Ch4 volume. AD PRS including other nine SNPs in APOE gene could explain more variance of Ch4 volume (rs1871047, rs387976, rs6859, rs283814, rs157582, rs405509, rs439401, rs3760627, rs204479).
In this study, we investigated the relationship between AD-associated SNPs and Ch4 volume using PRS method. The polygenic risk score combines the weak effect of every candidate SNP in an additive model (International Schizophrenia Consortium, 2009). A great number of studies explore disease-associated genetic variants in disease status and disease-associated phenotypes (Small et al., 2000; Reiman et al., 2004; Filippini et al., 2009; Sheline et al., 2010; Sabuncu et al., 2012; Harris et al., 2014; Marden et al., 2016; Mormino et al., 2016; Axelrud et al., 2018). PRS model can capture nearly all common genetic risk for AD (Escott-Price et al., 2017). In fact, PRS cannot capture rare genetic risk variants and gene-gene interactions (Sabuncu et al., 2012; Escott-Price et al., 2017). In addition, there are some genetic risk variants contributing to Ch4 volume but without effect on AD, and AD PRS cannot capture. Lastly, some environmental factors may result in the change in brain volume, such as drugs (Navari and Dazzan, 2009; Moncrieff and Leo, 2010; Ebdrup et al., 2013). In future research, more sophisticated models considering these above factors should be constructed.
Considering that PRS based on AD-associated SNPs, excluding or including the APOE region, is associated with Ch4 volume in normal control subjects but not in AD patients. That is possibly because disease status severely changes the Ch4 volume to some extent (Whitehouse et al., 1981; Candy et al., 1983; Etienne et al., 1986). In conclusion, PRS based on AD-associated genetic risk variants is significantly associated with Ch4 volume in normal control subjects but not in AD patients.
Alzheimer’s Disease Neuroimaging Initiative database is a very canonical dataset for AD. Many scholars all over the world make their contributions to the mechanism of AD based on mining the ADNI dataset. We find the association between AD PRS and Ch4 brain volume based on the 180 normal control subjects download from the ADNI database. We want to replicate this result in another independent dataset. Therefore, we divided 180 normal subjects into several subsets.
There are 136 ADNI 2 stage normal subjects, 29 ADNI GO stage normal subjects and 15 ADNI 1 stage normal subjects among 180 normal subjects according to the diagnose information. We utilized 136 normal subjects as a discovery dataset and 29 normal subjects as an independent dataset. The first ten principal components of population structure, the number of non-missing SNPs used for scoring and inbreeding coefficient for 136 normal subjects were obtained using PLINK. AD PRS based on AD-associated SNPs, including the APOE region, was used to predict Ch4 volume in 136 normal subjects. According to the PRS results (Supplementary Figures S5, S6), the best threshold for PRS model is 0.0428, the p-value of the PRS model is 0.001. Therefore, AD PRS is related to the Ch4 volume in 136 normal subjects. As for the independent dataset (29 normal subjects), we also obtained the first ten principal components of population structure, the number of non-missing SNPs used for scoring and inbreeding coefficient by PLINK. We used the PRSice to obtain the PRS results (Supplementary Figures S7, S8). The p-value of the best PRS model is 0.00011. So AD PRS is also associated with Ch4 volume in an independent dataset. In other word, the association between AD PRS and Ch4 volume can be replicated in an independent dataset.
In order to further validate the reality of this kind of association, we divided the 136 normal subjects into two equal groups. We took one group and another group as training set and test set, respectively. We utilized PLINK to obtain the first ten principal components of population structure, the number of non-missing SNPs used for scoring and inbreeding coefficient for training set and test set, respectively. The PRS results for the training set is showed as (Supplementary Figures S9, S10). The best cutoff for PRS model is 0.05 and the p-value of the PRS model is 0.015. According to the PRS results for the test set (Supplementary Figures S11, S12), the p-value of the best PRS model is 0.028.Therefore, the AD PRS is related to the Ch4 volume in training set and test set.
All in all, AD PRS is associated with the Ch4 volume in normal subjects. Our study presents several limitations. First of all, the sample size is relatively small. ADNI database provides genetic and images data of more than 800 subjects, including normal control subjects, mild cognitive impairment (MCI) subjects and AD patients. In fact, MCI subjects account for a major portion and AD patients constitute a minor percentage. We selected normal controls and AD patients according to the diagnosis information. Accordingly, we obtained the 106 AD patients and 180 normal control subjects after removing poor-quality subjects in this study. Another limitation is that AD patients were not divided into severe, moderate and mild subgroups according to disease severity. That is mainly because subgroups of AD patients cannot be achieved from the ADNI database. In the future studies, we will collect more sample size as possible as we can and categorize the sample into subgroups to explore the relationship between AD PRS and brain-associated endo-phenotypes. It is not only essential but also meaningful for academic studies.
Ethics Statement
Data used in preparation of this article were obtained from the ADNI database (adni.loni.usc.edu). Summary results data were obtained from the International Genomics of Alzheimer’s Project (IGAP). Gene expression (median TPM) in multiple human tissues were downloaded from Genotype-Tissue Expression (GTEx) database.
Author Contributions
QJ and YH designed the experiments. WZ and PR downloaded the MRI data from ADNI database. TW, ZH, and YY performed the experiments. All authors contributed to writing, and approved the final manuscript.
Funding
This work was supported by the National Natural Science Foundation of China (61822108 and 61571152), the National Science and Technology Major Project (2016YFC1202302), and the Natural Science Foundation of Heilongjiang Province (F2015006).
Conflict of Interest Statement
YY employed by company Jiangsu Singch Pharmaceutical Co., Ltd.
The remaining authors declare that the research was conducted in the absence of any commercial or financial relationships that could be construed as a potential conflict of interest.
Acknowledgments
We thank the International Genomics of Alzheimer’s Project (IGAP) for providing summary results data for these analyses. The investigators within IGAP contributed to the design and implementation of IGAP and/or provided data but did not participate in analysis or writing of this report. IGAP was made possible by the generous participation of the control subjects, the patients, and their families. The i-Select chips was funded by the French National Foundation on Alzheimer’s disease and related disorders. EADI was supported by the LABEX (laboratory of excellence program investment for the future) DISTALZ grant, Inserm, Institut Pasteur de Lille, Université de Lille 2, and the Lille University Hospital. GERAD was supported by the Medical Research Council (Grant No. 503480), Alzheimer’s Research United Kingdom (Grant No. 503176), the Wellcome Trust (Grant No. 082604/2/07/Z), and German Federal Ministry of Education and Research (BMBF): Competence Network Dementia (CND) Grant No. 01GI0102, 01GI0711, 01GI0420. CHARGE was partly supported by the NIH/NIA grant R01 AG033193 and the NIA AG081220 and AGES contract N01-AG-12100, the NHLBI grant R01 HL105756, the Icelandic Heart Association, and the Erasmus Medical Center and Erasmus University. ADGC was supported by the NIH/NIA grants: U01 AG032984, U24 AG021886, U01 AG016976, and the Alzheimer’s Association grant ADGC-10-196728.
Data used in preparation of this article were obtained from the ADNI database (adni.loni.usc.edu). As such, the investigators within the ADNI contributed to the design and implementation of ADNI and/or provided data but did not participate in analysis or writing of this report. A complete listing of ADNI investigators can be found at: http://adni.loni.usc.edu/wp-content/uploads/how_to_apply/ADNI_Acknowledgement_List.pdf. Data collection and sharing for this project was funded by the ADNI (National Institutes of Health Grant U01 AG024904) and DOD ADNI (Department of Defense award number W81XWH-12-2-0012). ADNI is funded by the National Institute on Aging, the National Institute of Biomedical Imaging and Bioengineering, and through generous contributions from the following: AbbVie, Alzheimer’s Association; Alzheimer’s Drug Discovery Foundation; Araclon Biotech; BioClinica, Inc.; Biogen; Bristol-Myers Squibb Company; CereSpir, Inc.; Cogstate; Eisai Inc.; Elan Pharmaceuticals, Inc.; Eli Lilly and Company; EuroImmun; F. Hoffmann-La Roche Ltd., and its affiliated company Genentech, Inc.; Fujirebio; GE Healthcare; IXICO Ltd.; Janssen Alzheimer Immunotherapy Research and Development, LLC.; Johnson and Johnson Pharmaceutical Research & Development, LLC.; Lumosity; Lundbeck; Merck & Co., Inc.; Meso Scale Diagnostics, LLC.; NeuroRx Research; Neurotrack Technologies; Novartis Pharmaceuticals Corporation; Pfizer Inc.; Piramal Imaging; Servier; Takeda Pharmaceutical Company; and Transition Therapeutics. The Canadian Institutes of Health Research is providing funds to support ADNI clinical sites in Canada. Private sector contributions are facilitated by the Foundation for the National Institutes of Health (www.fnih.org). The grantee organization is the Northern California Institute for Research and Education, and the study is coordinated by the Alzheimer’s Therapeutic Research Institute at the University of Southern California. ADNI data are disseminated by the Laboratory for Neuro Imaging at the University of Southern California. We sincerely thank the Alzheimer’s Disease Neuroimaging Initiative for providing the imaging and genomic data.
Supplementary Material
The Supplementary Material for this article can be found online at: https://www.frontiersin.org/articles/10.3389/fgene.2019.00519/full#supplementary-material
FIGURE S1 | Bar plot showing at broad P value thresholds for AD PRS, including the APOE region, predicting Ch4 volume in AD patients, including a bar for the best-fit PRS from the high-resolution run.
FIGURE S2 | High-resolution plot for AD PRS, including the APOE region, predicting Ch4 volume in AD patients. The thick line connects points at the broad P value thresholds of Supplementary Figure S1. The best-fit PRS is at PT of 0.0068.
FIGURE S3 | Bar plot showing at broad P value thresholds for AD PRS, including the APOE region, predicting Ch4 volume in normal control subjects, including a bar for the best-fit PRS from the high-resolution run.
FIGURE S4 | High-resolution plot for AD PRS, including the APOE region, predicting Ch4 volume in normal control subjects. The thick line connects points at the broad P value thresholds of Supplementary Figure S3. The best-fit PRS is at PT of 0.0944.
FIGURE S5 | Bar plot showing at broad P value thresholds for AD PRS, including the APOE region, predicting Ch4 volume in 136 normal subjects, including a bar for the best-fit PRS from the high-resolution run.
FIGURE S6 | High-resolution plot for AD PRS, including the APOE region, predicting Ch4 volume in 136 normal subjects. The thick line connects points at the broad P value thresholds of Supplementary Figure S5.
FIGURE S7 | Bar plot showing at broad P value thresholds for AD PRS, including the APOE region, predicting Ch4 volume in 29 normal subjects, including a bar for the best-fit PRS from the high-resolution run.
FIGURE S8 | High-resolution plot for AD PRS, including the APOE region, predicting Ch4 volume in 29 normal subjects. The thick line connects points at the broad P value thresholds of Supplementary Figure S7.
FIGURE S9 | Bar plot showing at broad P value thresholds for AD PRS, including the APOE region, predicting Ch4 volume in training set, including a bar for the best-fit PRS from the high-resolution run.
FIGURE S10 | High-resolution plot for AD PRS, including the APOE region, predicting Ch4 volume in training set. The thick line connects points at the broad P value thresholds of Supplementary Figure S9.
FIGURE S11 | Bar plot showing at broad P value thresholds for AD PRS, including the APOE region, predicting Ch4 volume in test set, including a bar for the best-fit PRS from the high-resolution run.
FIGURE S12 | High-resolution plot for AD PRS, including the APOE region, predicting Ch4 volume in test set. The thick line connects points at the broad P value thresholds of Supplementary Figure S11.
TABLE S1 | The neuroimage ID of 106 AD patients.
TABLE S2 | The neuroimage ID of 180 NC subjects.
TABLE S3 | 8070 SNPs with P value below 0.0944.
Footnotes
References
Alattas, R., and Barkana, B. D. (2015). “A comparative study of brain volume changes in Alzheimer’s disease using MRI scans,” in Proceedings of the 2015 IEEE Long Island Systems, Applications and Technology Conference, (Farmingdale: IEEE).
Andrews, K. A., Frost, C., Modat, M., Cardoso, M. J., and Aibl Rowe, C. C. (2016). Acceleration of hippocampal atrophy rates in asymptomatic amyloidosis. Neurobiol. Aging 39, 99–107. doi: 10.1016/j.neurobiolaging.2015.10.013
Ashburner, J. (2007). A fast diffeomorphic image registration algorithm. Neuroimage 38, 95–113. doi: 10.1016/j.neuroimage.2007.07.007
Axelrud, L. K., Santoro, M. L., Pine, D. S., Talarico, F., Gadelha, A., Manfro, G. G., et al. (2018). Polygenic risk score for alzheimer’s disease: implications for memory performance and hippocampal volumes in early life. Am. J. Psychiatry 175, 555–563. doi: 10.1176/appi.ajp.2017.17050529
Butt, A. E., and Hodge, G. K. (1995). Acquisition, retention, and extinction of operant discriminations in rats with nucleus basalis magnocellularis lesions. Behav. Neurosci. 109, 699–713. doi: 10.1037/0735-7044.109.4.699
Candy, J. M., Perry, R. H., Perry, E. K., Irving, D., Blessed, G., Fairbairn, A. F., et al. (1983). Pathological changes in the nucleus of Meynert in Alzheimer’s and Parkinson’s diseases. J. Neurol. Sci. 59, 277–289.
Corder, E. H., Saunders, A. M., Strittmatter, W. J., Schmechel, D. E., Gaskell, P. C., Small, G. W., et al. (1993). Gene dose of apolipoprotein E type 4 allele and the risk of Alzheimer’s disease in late onset families. Science 261, 921–923. doi: 10.1126/science.8346443
Csernansky, J. G., Wang, L., Swank, J., Miller, J. P., Gado, M., McKeel, D., et al. (2005). Preclinical detection of Alzheimer’s disease: hippocampal shape and volume predict dementia onset in the elderly. Neuroimage 25, 783–792. doi: 10.1016/j.neuroimage.2004.12.036
Ebdrup, B. H., Norbak, H., Borgwardt, S., and Glenthoj, B. (2013). volumetric changes in the basal ganglia after antipsychotic monotherapy: a systematic review. Curr. Med. Chem. 20, 438–447. doi: 10.2174/0929867311320030015
Eickhoff, S. B., Stephan, K. E., Mohlberg, H., Grefkes, C., Fink, G. R., Amunts, K., et al. (2005). A new SPM toolbox for combining probabilistic cytoarchitectonic maps and functional imaging data. Neuroimage 25, 1325–1335. doi: 10.1016/j.neuroimage.2004.12.034
Escott-Price, V., Shoai, M., Pither, R., Williams, J., and Hardy, J. (2017). Polygenic score prediction captures nearly all common genetic risk for Alzheimer’s disease. Neurobiol. Aging 49:214 e 21, e211. doi: 10.1016/j.neurobiolaging.2016.07.018
Escott-Price, V., Sims, R., Bannister, C., Harold, D., Vronskaya, M., Majounie, E., et al. (2015). Common polygenic variation enhances risk prediction for Alzheimer’s disease. Brain 138(Pt 12), 3673–3684. doi: 10.1093/brain/awv268
Etienne, P., Robitaille, Y., Wood, P., Gauthier, S., Nair, N. P., and Quirion, R. (1986). Nucleus basalis neuronal loss, neuritic plaques and choline acetyltransferase activity in advanced Alzheimer’s disease. Neuroscience 19, 1279–1291. doi: 10.1016/0306-4522(86)90142-9
Euesden, J., Lewis, C. M., and O’Reilly, P. F. (2015). PRSice: polygenic Risk Score software. Bioinformatics 31, 1466–1468. doi: 10.1093/bioinformatics/btu848
Filippini, N., MacIntosh, B. J., Hough, M. G., Goodwin, G. M., Frisoni, G. B., Smith, S. M., et al. (2009). Distinct patterns of brain activity in young carriers of the APOE-epsilon4 allele. Proc. Natl. Acad. Sci. U.S.A. 106, 7209–7214. doi: 10.1073/pnas.0811879106
Gratwicke, J., Kahan, J., Zrinzo, L., Hariz, M., Limousin, P., Foltynie, T., et al. (2013). The nucleus basalis of Meynert: a new target for deep brain stimulation in dementia? Neurosci. Biobehav. Rev. 37(10 Pt 2), 2676–2688. doi: 10.1016/j.neubiorev.2013.09.003
Grothe, M., Heinsen, H., and Teipel, S. (2013). Longitudinal measures of cholinergic forebrain atrophy in the transition from healthy aging to Alzheimer’s disease. Neurobiol. Aging 34, 1210–1220. doi: 10.1016/j.neurobiolaging.2012.10.018
Grothe, M., Heinsen, H., and Teipel, S. J. (2012). Atrophy of the cholinergic Basal forebrain over the adult age range and in early stages of Alzheimer’s disease. Biol. Psychiatry 71, 805–813. doi: 10.1016/j.biopsych.2011.06.019
Hanyu, H., Asano, T., Sakurai, H., Tanaka, Y., Takasaki, M., and Abe, K. (2002). MR analysis of the substantia innominata in normal aging. Alzheimer disease, and other types of dementia. AJNR Am. J. Neuroradiol. 23, 27–32.
Harris, S. E., Davies, G., Luciano, M., Payton, A., Fox, H. C., Haggarty, P., et al. (2014). Polygenic risk for Alzheimer’s disease is not associated with cognitive ability or cognitive aging in non-demented older people. J. Alzheimers Dis. 39, 565–574. doi: 10.3233/JAD-131058
Harrison, T. M., Mahmood, Z., Lau, E. P., Karacozoff, A. M., Burggren, A. C., Small, G. W., et al. (2016). An alzheimer’s disease genetic risk score predicts longitudinal thinning of hippocampal complex subregions in healthy older adults. eNeuro 3, ENEURO.98-16.2016. doi: 10.1523/ENEURO.0098-16.2016
Hindorff, L. A., Sethupathy, P., Junkins, H. A., Ramos, E. M., Mehta, J. P., Collins, F. S., et al. (2009). Potential etiologic and functional implications of genome-wide association loci for human diseases and traits. Proc. Natl. Acad. Sci. U.S.A. 106, 9362–9367. doi: 10.1073/pnas.0903103106
Hu, Y., Zheng, L. K., Cheng, L., Zhang, Y., Bai, W. Y., Zhou, W. Y., et al. (2017). GAB2 rs2373115 variant contributes to Alzheimer’s disease risk specifically in European population. J. Neurol. Sci. 375, 18–22. doi: 10.1016/j.jns.2017.01.030
International Schizophrenia Consortium, Purcell, S. M., Wray, N. R., Stone, J. L., Visscher, P. M., O’Donovan, M. C., et al. (2009). Common polygenic variation contributes to risk of schizophrenia and bipolar disorder. Nature 460, 748–752. doi: 10.1038/nature08185
Jack, C. R., Jr., Bernstein, M. A., Fox, N. C., Thompson, P., and Alexander, G. (2008). The Alzheimer’s Disease Neuroimaging Initiative (ADNI): MRI methods. J. Magn. Reson. Imaging 27, 685–691. doi: 10.1002/jmri.21049
Jagust, W., Gitcho, A., Sun, F., Kuczynski, B., Mungas, D., and Haan, M. (2006). Brain imaging evidence of preclinical Alzheimer’s disease in normal aging. Ann. Neurol. 59, 673–681. doi: 10.1002/ana.20799
Jiang, Q. H., Jin, S. L., Jiang, Y. S., Liao, M. Z., Feng, R. N., Zhang, L. C., et al. (2017). Alzheimer’s disease variants with the genome-wide significance are significantly enriched in immune pathways and active in immune cells. Mol. Neurobiol. 54, 594–600. doi: 10.1007/s12035-015-9670-9678
Lambert, J. C., Grenier-Boley, B., Chouraki, V., Heath, S., Zelenika, D., Fievet, N., et al. (2010). Implication of the immune system in Alzheimer’s Disease: evidence from genome-wide pathway analysis. J. Alzheimers Dis. 20, 1107–1118. doi: 10.3233/Jad-2010-100018
Lambert, J. C., Ibrahim-Verbaas, C. A., Harold, D., Naj, A. C., Sims, R., Bellenguez, C., et al. (2013). Meta-analysis of 74,046 individuals identifies 11 new susceptibility loci for Alzheimer’s disease. Nat. Genet. 45, 1452–U1206. doi: 10.1038/ng.2802
Leanza, G., Muir, J., Nilsson, O. G., Wiley, R. G., Dunnett, S. B., and Bjorklund, A. (1996). Selective immunolesioning of the basal forebrain cholinergic system disrupts short-term memory in rats. Eur. J. Neurosci. 8, 1535–1544. doi: 10.1111/j.1460-9568.1996.tb01616.x
Li, J., Zhang, X., Li, A., Liu, S., Qin, W., Yu, C., et al. (2018). Polygenic risk for Alzheimer’s disease influences precuneal volume in two independent general populations. Neurobiol. Aging 64, 116–122. doi: 10.1016/j.neurobiolaging.2017.12.022
Liu, G., Zhang, Y., Wang, L. C., Xu, J. Y., Chen, X. Y., Bao, Y. J., et al. (2018). Alzheimer’s disease rs11767557 variant regulates EPHA1 gene expression specifically in human whole blood. J. Alzheimers Dis. 61, 1077–1088. doi: 10.3233/Jad-170468
Lupton, M. K., Strike, L., Hansell, N. K., Wen, W., Mather, K. A., Armstrong, N. J., et al. (2016). The effect of increased genetic risk for Alzheimer’s disease on hippocampal and amygdala volume. Neurobiol. Aging 40, 68–77. doi: 10.1016/j.neurobiolaging.2015.12.023
Marden, J. R., Mayeda, E. R., Walter, S., Vivot, A., Tchetgen Tchetgen, E. J., Kawachi, I., et al. (2016). Using an alzheimer disease polygenic risk score to predict memory decline in black and white americans Over 14 years of follow-up. Alzheimer Dis. Assoc. Disord. 30, 195–202. doi: 10.1097/WAD.0000000000000137
Mattavelli, D., Agosta, F., Weiler, M., Canu, E., Copetti, M., Magnani, G., et al. (2015). Following the spreading of brain structural changes in Alzheimer’s disease: a longitudinal, multimodal MRI study. Eur. J. Neurol. 22, 124–124. doi: 10.3233/JAD-150196
McGaugh, J. L. (2002). Memory consolidation and the amygdala: a systems perspective. Trends Neurosci. 25:456. doi: 10.1016/s0166-2236(02)02211-7
McGaughy, J., Dalley, J. W., Morrison, C. H., Everitt, B. J., and Robbins, T. W. (2002). Selective behavioral and neurochemical effects of cholinergic lesions produced by intrabasalis infusions of 192 IgG-saporin on attentional performance in a five-choice serial reaction time task. J. Neurosci. 22,1905–1913. doi: 10.1523/jneurosci.22-05-01905.2002
Mesulam, M. M., Mufson, E. J., Levey, A. I., and Wainer, B. H. (1983). Cholinergic innervation of cortex by the basal forebrain: cytochemistry and cortical connections of the septal area, diagonal band nuclei, nucleus basalis (substantia innominata), and hypothalamus in the rhesus monkey. J. Comp. Neurol. 214, 170–197. doi: 10.1002/cne.902140206
Moncrieff, J., and Leo, J. (2010). A systematic review of the effects of antipsychotic drugs on brain volume. Psychol. Med. 40, 1409–1422. doi: 10.1017/S0033291709992297
Mori, E., Lee, K., Yasuda, M., Hashimoto, M., Kazui, H., Hirono, N., et al. (2002). Accelerated hippocampal atrophy in Alzheimer’s disease with apolipoprotein E epsilon4 allele. Ann. Neurol. 51, 209–214. doi: 10.1002/ana.10093
Mormino, E. C., Sperling, R. A., Holmes, A. J., Buckner, R. L., De Jager, P. L., Smoller, J. W., et al. (2016). Polygenic risk of Alzheimer disease is associated with early- and late-life processes. Neurology 87, 481–488. doi: 10.1212/WNL.0000000000002922
Navari, S., and Dazzan, P. (2009). Do antipsychotic drugs affect brain structure? A systematic and critical review of MRI findings. Psychol. Med. 39, 1763–1777. doi: 10.1017/S0033291709005315
Purcell, S., Neale, B., Todd-Brown, K., Thomas, L., Ferreira, M. A., Bender, D., et al. (2007). PLINK: a tool set for whole-genome association and population-based linkage analyses. Am. J. Hum. Genet. 81, 559–575. doi: 10.1086/519795
Reiman, E. M., Chen, K., Alexander, G. E., Caselli, R. J., Bandy, D., Osborne, D., et al. (2004). Functional brain abnormalities in young adults at genetic risk for late-onset Alzheimer’s dementia. Proc. Natl. Acad. Sci. U.S.A. 101, 284–289. doi: 10.1073/pnas.2635903100
Sabuncu, M. R., Buckner, R. L., Smoller, J. W., Lee, P. H., Fischl, B., Sperling, R. A., et al. (2012). The association between a polygenic Alzheimer score and cortical thickness in clinically normal subjects. Cereb. Cortex 22, 2653–2661. doi: 10.1093/cercor/bhr348
Schmitz, T. W., Nathan Spreng, R., and Alzheimer’s Disease Neuroimaging Initiative (2016). Basal forebrain degeneration precedes and predicts the cortical spread of Alzheimer’s pathology. Nat. Commun. 7:13249. doi: 10.1038/ncomms13249
Schott, J. M., Bartlett, J. W., Fox, N. C., Barnes, J., and Alzheimer’s Disease Neuroimaging Initiative (2010). Increased brain atrophy rates in cognitively normal older adults with low cerebrospinal fluid Abeta1-42. Ann. Neurol. 68, 825–834. doi: 10.1002/ana.22315
Sheline, Y. I., Morris, J. C., Snyder, A. Z., Price, J. L., Yan, Z., D’Angelo, G., et al. (2010). APOE4 allele disrupts resting state fMRI connectivity in the absence of amyloid plaques or decreased CSF Abeta42. J. Neurosci. 30, 17035–17040. doi: 10.1523/JNEUROSCI.3987-10.2010
Small, G. W., Ercoli, L. M., Silverman, D. H., Huang, S. C., Komo, S., Bookheimer, S. Y., et al. (2000). Cerebral metabolic and cognitive decline in persons at genetic risk for Alzheimer’s disease. Proc. Natl. Acad. Sci. U.S.A. 97, 6037–6042. doi: 10.1073/pnas.090106797
Teipel, S. J., Meindl, T., Grinberg, L., Grothe, M., Cantero, J. L., Reiser, M. F., et al. (2011). The cholinergic system in mild cognitive impairment and Alzheimer’s disease: an in vivo MRI and DTI study. Hum. Brain Mapp. 32, 1349–1362. doi: 10.1002/hbm.21111
Terwisscha van Scheltinga, A. F., Bakker, S. C., van Haren, N. E., Derks, E. M., Buizer-Voskamp, J. E., Boos, H. B., et al. (2013). Genetic schizophrenia risk variants jointly modulate total brain and white matter volume. Biol. Psychiatry 73, 525–531. doi: 10.1016/j.biopsych.2012.08.017
Voytko, M. L. (1996). Cognitive functions of the basal forebrain cholinergic system in monkeys: memory or attention? Behav. Brain Res. 75, 13–25. doi: 10.1016/0166-4328(95)00143-3
Whitehouse, P. J., Price, D. L., Clark, A. W., Coyle, J. T., and DeLong, M. R. (1981). Alzheimer disease: evidence for selective loss of cholinergic neurons in the nucleus basalis. Ann. Neurol. 10, 122–126. doi: 10.1002/ana.410100203
Xiao, E., Chen, Q., Goldman, A. L., Tan, H. Y., Healy, K., Zoltick, B., et al. (2017). Late-onset alzheimer’s disease polygenic risk profile score predicts hippocampal function. Biol. Psychiatry Cogn. Neurosci. Neuroimaging 2, 673–679. doi: 10.1016/j.bpsc.2017.08.004
Yan, C. G., Wang, X. D., Zuo, X. N., and Zang, Y. F. (2016). DPABI: data processing & analysis for (Resting-State) brain imaging. Neuroinformatics 14, 339–351. doi: 10.1007/s12021-016-9299-9294
Zaborszky, L., Hoemke, L., Mohlberg, H., Schleicher, A., Amunts, K., and Zilles, K. (2008). Stereotaxic probabilistic maps of the magnocellular cell groups in human basal forebrain. Neuroimage 42, 1127–1141. doi: 10.1016/j.neuroimage.2008.05.055
Zhang, N. N. N., Song, X. W., Zhang, Y. T., Chen, W., D’Arcy, R. C. N., Darvesh, S., et al. (2011). An MRI brain atrophy and lesion index to assess the progression of structural changes in alzheimer’s disease. mild cognitive impairment, and normal aging: a follow-up study. J. Alzheimers Dis. 26, 359–367. doi: 10.3233/Jad-2011-2048
Keywords: Alzheimer’s disease, single nucleotide polymorphisms, polygenic risk score, Ch4 region, APOE
Citation: Wang T, Han Z, Yang Y, Tian R, Zhou W, Ren P, Wang P, Zong J, Hu Y and Jiang Q (2019) Polygenic Risk Score for Alzheimer’s Disease Is Associated With Ch4 Volume in Normal Subjects. Front. Genet. 10:519. doi: 10.3389/fgene.2019.00519
Received: 08 September 2018; Accepted: 13 May 2019;
Published: 10 July 2019.
Edited by:
Wenbo Zhang, The University of Texas Medical Branch at Galveston, United StatesReviewed by:
Gang Wang, Shanghai Jiao Tong University, ChinaJianjun Chen, Tongji University School of Medicine, China
Copyright © 2019 Wang, Han, Yang, Tian, Zhou, Ren, Wang, Zong, Hu and Jiang. This is an open-access article distributed under the terms of the Creative Commons Attribution License (CC BY). The use, distribution or reproduction in other forums is permitted, provided the original author(s) and the copyright owner(s) are credited and that the original publication in this journal is cited, in accordance with accepted academic practice. No use, distribution or reproduction is permitted which does not comply with these terms.
*Correspondence: Qinghua Jiang, cWhqaWFuZ0BoaXQuZWR1LmNu
†These authors have contributed equally to this work