Abstract
In light of the complex nature of multiple sclerosis (MS) and the recently estimated contribution of low-frequency variants into disease, decoding its genetic risk components requires novel variant prioritization strategies. We selected, by reviewing MS Genome Wide Association Studies (GWAS), 107 candidate loci marked by intragenic single nucleotide polymorphisms (SNPs) with a remarkable association (p-value ≤ 5 × 10⁻⁶). A whole exome sequencing (WES)-based pilot study of SNPs with minor allele frequency (MAF) ≤ 0.04, conducted in three Italian families, revealed 15 exonic low-frequency SNPs with affected parent-child transmission. These variants were detected in 65/120 Italian unrelated MS patients, also in combination (22 patients). Compared with databases (controls gnomAD, dbSNP150, ExAC, Tuscany-1000 Genome), the allelic frequencies of C6orf10 rs16870005 and IL2RA rs12722600 were significantly higher (i.e., controls gnomAD, p = 9.89 × 10⁻⁷ and p < 1 × 10-20). TET2 rs61744960 and TRAF3 rs138943371 frequencies were also significantly higher, except in Tuscany-1000 Genome. Interestingly, the association of C6orf10 rs16870005 (Ala431Thr) with MS did not depend on its linkage disequilibrium with the HLA-DRB1 locus. Sequencing in the MS cohort of the C6orf10 3′ region revealed 14 rare mutations (10 not previously reported). Four variants were null, and significantly more frequent than in the databases. Further, the C6orf10 rare variants were observed in combinations, both intra-locus and with other low-frequency SNPs. The C6orf10 Ser389Xfr was found homozygous in a patient with early onset of the MS. Taking into account the potentially functional impact of the identified exonic variants, their expression in combination at the protein level could provide functional insights in the heterogeneous pathogenetic mechanisms contributing to MS.
Introduction
Multiple Sclerosis (MS) is a chronic autoimmune disease of the central nervous system (CNS), involving inflammatory-based mechanisms and characterized by demyelination, neurodegeneration and progressive accumulation of neurological dysfunction (Ciccarelli et al., 2014). The heterogeneous manifestation and clinical course of MS are explained by its complex multi-factorial nature, where the interaction of genetic, lifestyle, and environmental factors confer the susceptibility (Morandi et al., 2015; Olsson et al., 2017). The heritable contribution to MS risk is supported by investigations on families (Patsopoulos, 2018).
To date, the majority of genetic studies on MS have been focused on susceptibility variants. In particular, several genome-wide association studies (GWAS), and subsequent replication studies, have identified hundreds of variants within susceptibility gene loci (Bashinskaya et al., 2015).
The single nucleotide polymorphisms (SNPs) identified through GWAS are mainly located within non-coding regions of the genome, which could pinpoint the presence of disease-associated variants in linkage disequilibrium.
The very recent study, made by the International Multiple Sclerosis Genetics Consortium, provides for the first time the evidence that low-frequency variants (minor allele frequency, MAF < 5%) explain 11.34% of the observed difference between cases and controls (International Multiple Sclerosis Genetics Consortium, 2018). The majority of low-frequency variants which contributed to MS risk were not individually detectable at genome-wide thresholds and among those associated with MS, only 1/3 were in linkage disequilibrium with the common variants from the GWAS (International Multiple Sclerosis Genetics Consortium, 2018).
Genetic studies in MS have used whole exome sequencing (WES) to investigate somatic mutations (Kemppinen et al., 2014), to define the genetic contribution to MS clinical outcomes (Sadovnick et al., 2017) and to suggest new potential causative variants in families (Dyment et al., 2012; Garcia-Rosa et al., 2017; Maver et al., 2017; Mescheriakova et al., 2018) or unrelated patients (Bernales et al., 2018). WES data in families, suggesting monogenic disease forms caused by rare variants with strong functional impact (Ramagopalan et al., 2011; Wang et al., 2016), were not confirmed in the subsequent replication studies (Ban et al., 2013; International Multiple Sclerosis Genetics Consortium, 2016; Minikel and MacArthur, 2016). Based on the aforementioned findings, decoding the genetic risk components of MS still represents a challenge, and novel strategies are required to prioritize variants (Wang and Biernacka, 2015).
We set up a targeted WES-based pilot study in MS families, followed by low-frequency variants investigation in a cohort of unrelated patients in Italy, where a high prevalence and incidence of MS have been reported (Battaglia and Bezzini, 2017; Granieri et al., 2018).
The main aim of this study was to identify new exonic and potentially functional low-frequency variants for MS risk within genes marked by intragenic common variants from the GWAS.
Materials and Methods
Study Population
The study population included (i) three Italian families with MS-affected members (clinical characteristics and pedigree shown in Figure 1) and (ii) 120 Italian unrelated MS patients coming from the mainland, selected from previous studies (Gemmati et al., 2012; Marchetti et al., 2018; Ziliotto et al., 2018) for having age of MS onset under 52 and mean age of MS onset (34.5 ± 9.7) similar to that of the affected family members (34.1 ± 8.2; Student’s t-test p-value = 0.371). MS diagnosis was assessed according to the 2010 revised McDonald criteria (Polman et al., 2011). All MS patients underwent neurological visits, MRI examinations and assessment of the Expanded Disability Status Scale (EDSS) (Kurtzke, 1983). All patients were over 18 years of age and the patients’ medical records were examined in order to ascertain age of diagnosis and type of MS at the time of blood sample collection. Among the 120 unrelated MS patients, 44 patients were relapsing remitting MS (RR-MS), 53 were secondary progressive MS (SP-MS) and 23 had primary progressive (PP-MS) course of the disease. Written informed consent was obtained from all subjects, and the study was approved by the Ethical Committee of the S. Anna University-Hospital, Ferrara, Italy. Demographic and clinical characteristics of the unrelated MS patients are summarized in Table 1.
FIGURE 1
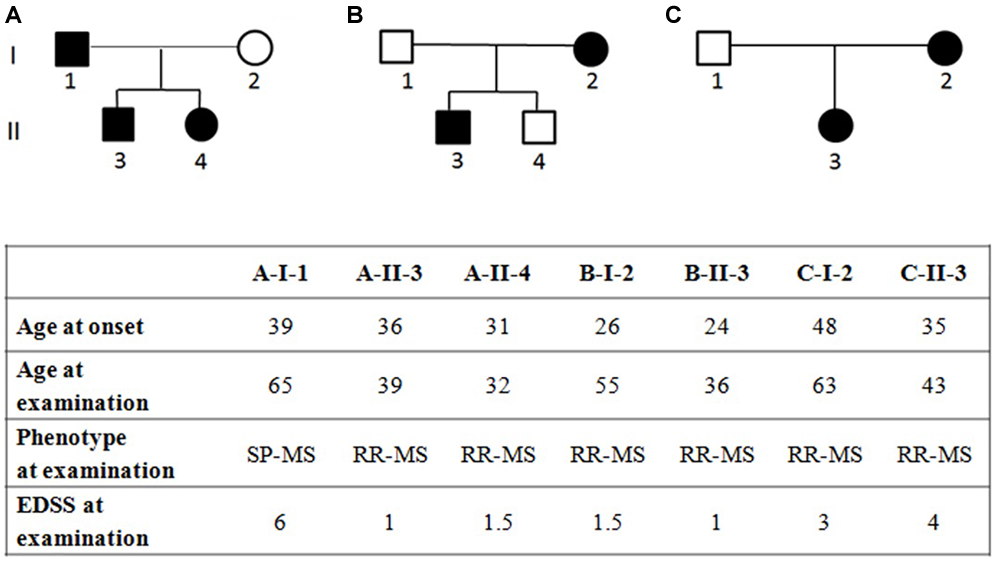
Pedigree of families (A–C) with multiple sclerosis and clinical characteristics of the affected family members, RR-MS, relapsing-remitting multiple sclerosis; SP-MS, secondary-progressive multiple sclerosis; PP-MS, primary progressive multiple sclerosis; EDSS, expanded disability status scale. EDSS ranges from 0 to 10 in 0.5-point increments; higher scores indicate more disability.
Table 1
| Clinical phenotype | |||||
|---|---|---|---|---|---|
| All MS | RR-MS | SP-MS | PP-MS | p-value | |
| Sample size, n | 120 | 44 | 53 | 23 | |
| Female, n (%) | 74 (61.7) | 27 (61.4) | 31 (58.5) | 16 (69.6) | |
| Onset, mean y ± SD | 34.5 ± 9.7 | 33.9 ± 9.3 | 32.9 ± 9.5 | 39.1 ± 9.8 | 0.032 |
| EDSS at examination, median (IQR) | 6 (2–6.5) | 2 (1–2.5) | 6.5 (6–6.5) | 6 (6–6.5) | <0.0001 |
Demographic and clinical characteristics of the unrelated MS patients cohort.
RR-MS, relapsing-remitting multiple sclerosis; SP-MS, secondary-progressive multiple sclerosis; PP-MS, primary progressive multiple sclerosis; n, number; SD, standard deviation; y, years; EDSS, expanded disability status scale; IQR, inter quartile range. Descriptive analysis between RR-MS, SP-MS, and PP-MS was performed using ANOVA for age of onset, and Kruskal–Wallis test for EDSS at examination. Multiple comparison tests provided differences in age of onset between SP-MS and PP-MS (p = 0.031, Bonferroni’s test), and in EDSS of RR-MS with SP-MS and with PP-MS (both p < 0.0001, Dunn’s test).
Search Strategy and Selection Criteria of Candidate Genes
A systematic review of the literature was performed for all years available through December 31, 2017. The primary source was the PubMed database1, for which search terms “GWAS” and “multiple sclerosis” were used. Further search included NHGRI-EBI GWAS catalog2. Variants identified by GWAS in MS were selected for being intragenic, non-HLA, and having p-value ≤ 5 × 10⁻⁶. On the basis of these selected common variants, we generated the final gene reference list for the present study (Supplementary Table 1). The study design is schematically described in Figure 2.
FIGURE 2
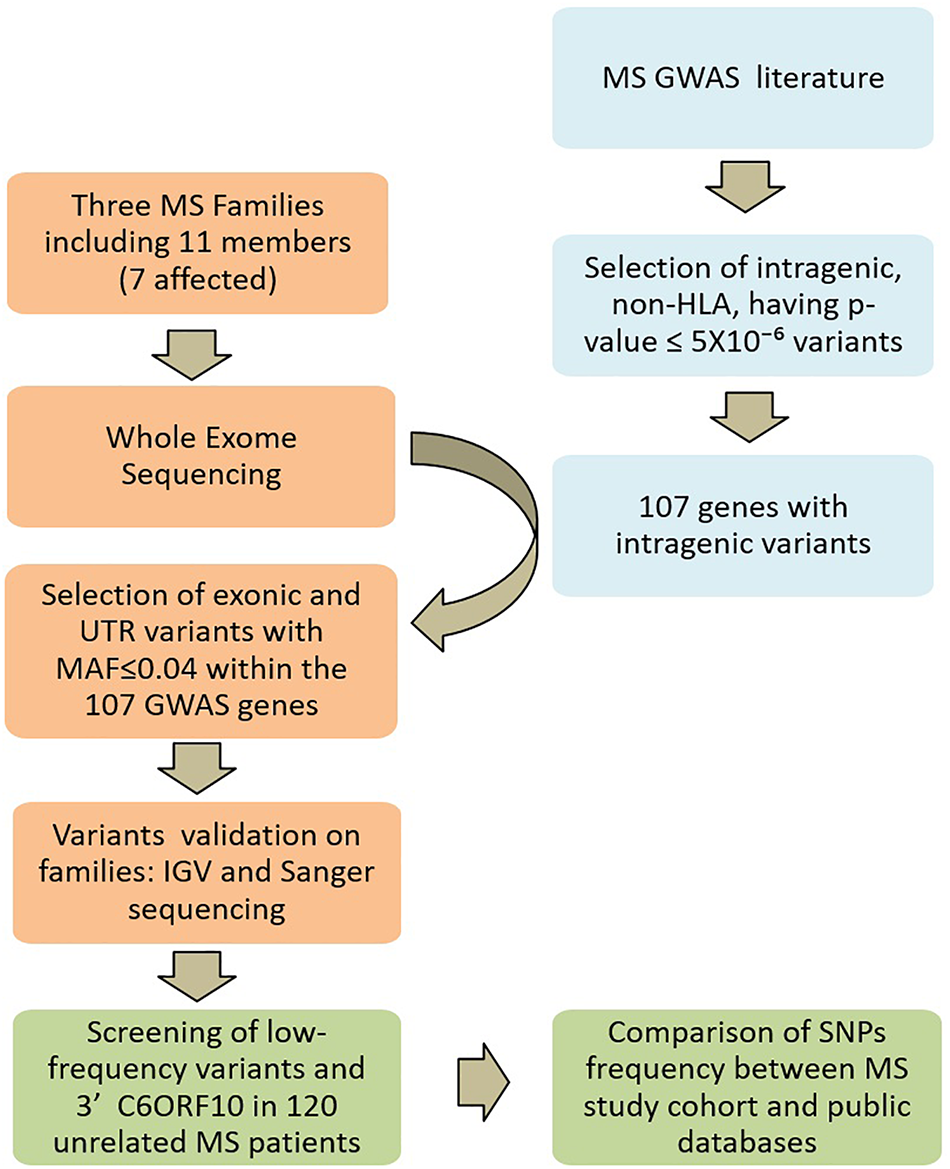
Study design. Multiple sclerosis (MS) GWAS and WES SNP filtering is schematically described. In light blue, the search strategy and selection criteria of candidate genes; in orange the Whole-exome sequencing and the analysis on MS families; in green the screening strategy in the unrelated MS patients.
Whole-Exome Sequencing and Analysis
The genomic DNA (gDNA) was extracted from peripheral blood using the Wizard® Genomic DNA Purification Kit (Promega, Madison, WI, United States). WES was performed on eleven individuals, seven diagnosed with MS and four unaffected, from three independent families (Figure 1). Sequencing was performed by BGI (Shenzhen, China) using nanoarray-based short-read sequencing-by-ligation technology (cPALTM). Reads were mapped against the hg19 human reference sequence3 using SOAPaligner4. Variants calling was performed with the Complete Genomics Small Variant Caller5. Genetic variations were verified in: (i) the database of Single-Nucleotide Polymorphisms (dbSNP, Build 1506), (ii) the 1000 Genomes Project databases7, (iii) the Exome Aggregation Consortium (ExAC8), and (iv) controls of Genome Aggregation database (gnomAD v2.1.1 controls9).
The coverage of the target region was 99.26%, the average depth on target region was 129X and the target coverage with at least 20× was 90.6%. The filtering performed on WES-data is schematically described in Figure 2. In order to remove systematic artifacts, we visually verified the filtered low-frequency variants with IGV10. We considered a variant as true heterozygous with a call of 40% of the total reads.
The effects of new coding variations on protein structure and function were predicted using Provean/SIFT11, while the effects of low-frequency coding variations, already reported on databases as prediction by SIFT/PolyPhen, were extrapolated from Ensembl12. The whole-exome sequencing dataset generated during the current study is available in the https://www.ncbi.nlm.nih.gov/sra (Accession Number: PRJNA544162).
Mutation Screening
Low-frequency variants, identified through the filtering in MS families, were confirmed by Sanger sequencing (n = 13) or restriction analysis (n = 2, ADAMTS3 and GC). Primers to amplify the coding sequences containing the identified low-frequency variants were designed with Primer3 software v0.04.013. A total of 50 ng of gDNA was amplified by polymerase chain reaction (PCR) using a standard protocol with AmpliTaq Gold 360 DNA polymerase (Applied Biosystems, Foster City, CA, United States) (Balestra et al., 2016). PCR conditions were set up as follows: an initial denaturation at 94°C for 5 minutes and then at 65°C for 3 minutes, followed by 35 cycles at 94°C for 30 seconds, specific temperatures for each couple of primers for 30 seconds, 72°C for 30 second or 1 minute, and a final elongation at 72°C for 7 minutes. Detailed primer sequences and PCR conditions used for Sanger sequencing are reported in Table 2. The PCR products were purified with CleanSweepTM PCR Purification (Applied Biosystems) prior to direct sequencing (Macrogen, Madrid, Spain). Sequences were analyzed using the software NovoSNP (Weckx et al., 2005). Size of PCR amplicons and restriction products were examined through agarose gel electrophoresis.
Table 2
| Gene | SNP position GRCh37/hg19 | SNP ID | Forward primer sequence (5′-3′) | Reverse primer sequence (5′-3′) | Tm (°C) | Length (bp) |
|---|---|---|---|---|---|---|
| ANKRD55 | 5:55407449 | rs77017041 | TTGTCACTCCAGTTCCTAGCTT | CCTGATGAAGCATGTGGAAT | 60 | 850 |
| C6orf10 | 6:32261153 | rs16870005 | TTTAGGCAATGGCTGGGATA | TGTGCCAAGAAGACAGGAATC | 60 | 658 |
| CD86 | 3:121774281 | rs11575853 | TCTTCCTCAAGTGTGGTCAAAA | GCACCATCTTCAACCTCAGC | 60 | 297 |
| EVI5 | 1:92979432 | rs41286809 | TGGCAATGGTAAATCAGTGG | CATGGAATGTTTGCTTTTTGG | 60 | 595 |
| IL2RA | 10:6054765 | rs12722600 | ATAGAGACAAGGTTGCCACTGC | CCACAGCTATTGTCTGCCATATAAA | 66 | 468 |
| MALT1 | 18:56367823 | rs74847855 | CACTTTCAAAGCTTCATACTGAAATC | AAGACAAAACACATGGATCAAATCT | 60 | 427 |
| MMEL1 | 1:2530169 | rs147248515 | TAACCCCTCATGTCCCACAC | GGGGCTGGGTTTCTTAGATT | 63 | 353 |
| STAT4 | 2:191899319 | – | GAAATTCTCAAAACCCCATGT | AAATTGAGCACAAAATTGAAGC | 60 | 209 |
| TET2 | 4:106156163 | rs61744960 | TATTATCCAGATTGTGTTTCCATTG | CTTAGTGAACACTGAGCTTTGCTT | 63 | 471 |
| TOP3A | 17:18217958 | rs2230153 | TCGCCTTCATCTCGATTCTT | TGAGCCTCATCTCTGGCTTC | 55 | 342 |
| TRAF3 | 14:103371923 | rs138943371 | ATGTGTGCCAGGGTCTACCT | TCTTGAAGCTGCTGCTGTTG | 63 | 220 |
| WWOX | 16:78458807 | rs7201683 | AAAGAATTTCTCATTCCCGAAG | CACCCACATGTCTCAAGCAG | 60 | 444 |
Primer sequences and PCR conditions used for Sanger sequencing.
The presence of the selected low-frequency variants was investigated in a sample set of 120 Italian unrelated MS patients through Sanger sequencing (Table 2) or restriction analysis using the primer sequences and the restriction enzymes reported in Table 3.
Table 3
| Gene | SNP position GRCh37/hg19 | SNP ID | Forward primer sequence (5′-3′) | Reverse primer sequence (5′-3′) | Tm (°C) | Ref allele SNP allele | Restriction enzyme |
|---|---|---|---|---|---|---|---|
| ADAMTS3 | 4:73414590 | – | TCACCCCACAGATTTACCATTA | GGGCTTTAGTCGCAGATGAA | 60 | A:139+46+20 G:159+46 | MseI |
| ANKRD55 | 5:55407449 | rs77017041 | GGTGATGATGTCATTGACTGCTG | TACTCACATATCATCCCTGCTCTTT | 60 | A:201+21 G:222 | Bpu10I |
| CD86 | 3:121774281 | rs11575853 | CTGCTGTAACAGGGACTAGCTCA | AGGAACTAAGTGAAGGACACACATC | 60 | A:176+23 G:199 | Hpy188I |
| EVI5 | 1:92979432 | rs41286809 | ACACATAGAAGGCACTCAAAAATTAG | CTATAAAATCTTCATCGGAGGACTG | 60 | C:250+25 T: 275 | Bsr I |
| GC | 4:72669661 | rs76781122 | CCACTAATGCCAGCCAATCT | TGCTTTGCACAGAAATCCTC | 60 | G:361+48 T:266+95+48 | ApoI |
| IL2RA | 10:6054765 | rs12722600 | AACAGAAGTCATGAAGCCCACGT | AGTGGTTTTGCCCTTCCTC | 60 | G:219+21 A:240 | PmlI |
| MALT1 | 18:56367823 | rs74847855 | CACTTTCAAAGCTTCATACTGAAATC | AAGACAAAACACATGGATCAAATCT | 60 | A:248+179 G:427 | Hpy188III |
| MMEL1 | 1:2530169 | rs147248515 | CACTAAAGCTTAACCCCTCATGTC | TATCCTCTGTCAAAATCAAGCTGGT | 60 | G:221+27 T:248 | BanI |
| TET2 | 4:106156163 | rs61744960 | CTGATGATGCTGATAATGCCAGT | GTAAGCACCATTCATTTCATTTTGT | 60 | G:134+75+39 A:134+114 | NlaIV |
| TOP3A | 17:18217958 | rs2230153 | TCGCCTTCATCTCGATTCTT | TGAGCCTCATCTCTGGCTTC | 55 | G:190+134+18 A:190+152 | EaeI |
| TRAF3 | 14:103371923 | rs138943371 | ATGTGTGCCAGGGTCTACCT | TCTTGAAGCTGCTGCTGTTG | 63 | C:146+62 T:208 | AvaII |
| TYK2 | 19:10472452 | rs12720355 | GGACCCTAGTCACCATGAGAT | GTCTCGTAGAAGGCCTGTGG | 60 | C:197+18 T:215 | MboI |
| WWOX | 16:78458807 | rs7201683 | AAAGAATTTCTCATTCCCGAAG | CACCCACATGTCTCAAGCAG | 60 | C:444 G:259+185 | RsaI |
Primer sequences and restriction enzymes used for restriction analysis.
To verify the presence of the selected mutations, PCR products were digested with restriction enzymes. Nucleotides in bold and underlined are those modified to create specific restriction sites.
Bio-Informatics Analysis of Nucleotide Changes
The prediction of mi-RNA targets was conducted by using the tool at www.mirdb.org exploiting the support vector machines (SVMs) procedures. The computational prediction of splice sites and or splicing regulatory elements was conducted by using the www.umd.be/HSF/ online software.
Statistical Analysis
For populations comparison, we used MAFs obtained from: (i) the “dbSNP Build 150” (Homo sapiens Annotation Release 108) which combines all available frequencies from submitted SNPs clustered together into a reference SNP, (ii) the ExAC, which includes exome sequencing data from a wide variety of large-scale sequencing projects and in particular of European (not-Finnish) individuals, (iii) controls of gnomAD, which includes only samples from individuals who were not selected as a case in a case/control study of common disease, and (iv) 1000 Genome Project which contains allelic frequencies for a sample of 107 subjects from Tuscany, Italy, an optimal reference population for our MS individuals. The low prevalence (188 per 100’000 individuals) of MS in Tuscany (Bezzini et al., 2016) makes improbable the presence of individuals with MS in the Tuscany control sample.
To test the difference in MAFs between reference populations and the allelic frequencies observed in the study population, a two-proportion z-test, with a 0.05 two-sided significance level, was applied. A threshold of p < 0.0042, assuming the Bonferroni correction for multiple testing, was used for significance.
The potential enrichment of exonic low-frequency variants in MS patients was evaluated using a permutation approach based on the observed exonic polymorphisms. We first generated the null distribution of the number of low-frequency variants in a random sample of 107 genes, considering the exons composing the longest isoform of each gene, as defined by the human genome annotation (GRCh37/hg19). We took into account both the number and the length of exons, dividing the number of low-frequency variants by the total exon length, for each gene set. Then, we repeated the permutation process 1,000 times and the empirical p-value was defined as the proportion of replicates showing a number of variants higher than the observed value.
Results
Selection of Candidate Genes
Since GWAS and classical linkage studies have extensively investigated the HLA locus, harboring the greatest genetic risk for MS (reviewed in Hollenbach and Oksenberg, 2015), HLA genes were not included in this study.
The review of GWAS in MS literature, reporting polymorphisms associated with MS in case-control studies, identified 141 variants which were selected for being intragenic and for having a p-value ≤ 5 × 10⁻⁶, an arbitrary threshold potentially highlighting genes with remarkable disease association. These common variants established the list of 107 genes used for the purpose of this study. Variants and corresponding genes are listed in the Supplementary Table 1.
Search for Low-Frequency Variants in MS Families by WES
WES was performed in three independent Italian families with at least two affected members in each pedigree (Figure 1).
A targeted analysis within the 107 MS susceptibility genes was conducted in all pedigree members. SNPs with MAF ≤ 0.04 were taken into account when present in at least one affected family member. The selection of SNPs with MAF ≤ 0.04 was aimed at filtering low-frequency variants which did not emerge in GWAS.
These filtering criteria revealed 17 exonic mutations (ten missense and seven synonymous) and three in the UnTranslated Regions (UTRs), all in the heterozygous condition (Table 4).
Table 4
| Gene | SNP position GRCh37/hg19 | SNP ID | MAF % dbSNP150 | MAF % ExAC European (not Finnish) | MAF % controls GnomAD European (not Finnish) | Mutation type | SNPs carriers |
|---|---|---|---|---|---|---|---|
| ADAMTS3 | 4:73178175 | rs150270324 | 0.926 | 1.34 | 1.12 | Missense | A-I-2+ A-II-3 |
| ADAMTS3 | 4:73414590 | – | 0 | II-3 | |||
| ADAMTS3 | 4:73414590 | – | 0 | 0 | Missense | B-I-1+ B-II-3+ B-II-4 | |
| ANKRD55 | 5:55407449 | rs77017041 | 0.427 | 0.63 | 0.71 | Missense | C-I-2+C-II-3 |
| BTNL2 | 6:32363893 | rs28362679 | 1.825 | – | 0 | Missense | B-I-1+ C-I-1+ C-I-2 |
| C6orf10 | 6:32261153 | rs16870005 | 1.250 | 1.43 | 0.85 | Missense | B-I-2+ B-II-3 |
| GC | 4:72669661 | rs76781122 | 1.611 | 3.35 | 2.77 | Missense | B-I-2+ B-II-3 |
| MALT1 | 18:56367823 | rs74847855 | 3.734 | 4.28 | 4.20 | Missense | B-I-2+ B-II-3+ B-II-4 |
| MMEL1 | 1:2530169 | rs147248515 | 0.022 | 0.028 | 0.037 | Missense | B-I-2+ B-II-3 |
| TET2 | 4:106156163 | rs61744960 | 2.641 | 3.77 | 3.69 | Missense | B-I-2+ B-II-3+ C-I-2+C-II-3+ A-I-1+A-II-4 |
| WWOX | 16:78458807 | rs7201683 | 1.989 | 1.23 | 1.11 | Missense | B-I-2+ B-II-3+ B-II-4+ C-I-2 |
| EVI5 | 1:92979432 | rs41286809 | 1.116 | 1.55 | 1.61 | Synonymous | C-I-2+C-II-3+ A-I-1+ A-II-3+ A-II-4 |
| GC | 4:72620788 | rs76803094 | 1.799 | 2.56 | 2.14 | Synonymous | B-I-1+ B-II-3+ B-II-4 |
| GEMIN2 | 14:39587220 | rs150986614 | 0.251 | 0.37 | 0.37 | Synonymous | A-I-2+ A-II-3+ A-II-4 |
| STAT4 | 2:191899319 | – | – | – | Synonymous | C-I-2+C-II-3 | |
| TRAF3 | 14:103371923 | rs138943371 | 0.245 | 0.30 | 0.36 | Synonymous | C-I-2+C-II-3 |
| TOP3A | 17:18217958 | rs2230153 | 1.692 | 0.46 | 0.36 | Synonymous | C-I-2+C-II-3+ A-I-2 |
| TYK2 | 19:10472452 | rs12720355 | 0.962 | 1.38 | 1.45 | Synonymous | C-I-2+C-II-3 |
| CD86 | 3:121774281 | rs11575853 | 1.078 | – | 3.1 | UTR 5′ | B-I-2+ B-II-3+ C-I-1 |
| IL2RA | 10:6054765 | rs12722600 | 1.777 | – | 0.87 | UTR 3′ | B-I-2+ B-II-3+ C-I-1+ C-II-3 |
| RRAS2 | 11:14300827 | – | – | – | UTR 3′ | B-I-2+ B-II-4 |
List of low-frequency variants identified in the MS families.
In bold the genes including the exonic variants present only in affected family members defined as in Figure 1.
Among the 20 exonic and UTRs variants, nine were present only in the affected members of the families (rs77017041, ANKRD55; rs16870005, C6orf10; rs41286809, EVI5; rs76781122, GC; rs147248515, MMEL1; the new synonymous variant on STAT4; rs61744960, TET2; rs138943371, TRAF3; rs12720355, TYK2) and 14 variants were detected in at least two affected family members with parent-child transmission.
The number of low-frequency exonic variants in these families was investigated by a permutation test. No significant difference was observed between our result and that expected by chance (p = 0.231).
Screening of WES-Selected Low Frequency Variants in Unrelated Multiple Sclerosis Patients
We focused our investigation on the 14 low-frequency variants with parent-child transmission and on the new variant of ADAMTS3 (Table 5). The 15 candidate SNPs were explored in a sample set of 120 Italian unrelated MS patients (Table 1).
Table 5
| Gene | SNP position GRCh37/hg19 | SNP ID | Transcript (exon) | Amino acid change | SIFT/ PolyPhen prediction | Nucleotide change | MAF % in MS patients alleles n = 240 (n alleles) | MAF % 1000 GP (Tuscany) alleles n = 214 | MAF % dbSNP150 | MAF % ExAC European (not Finnish) | MAF % controls GnomAD European (not Finnish) | P-value° (Tuscany) | P-value° (dbSNP150) | P-value°(ExAC) | P-value° (controls GnomAD) |
|---|---|---|---|---|---|---|---|---|---|---|---|---|---|---|---|
| ADAMTS3 | 4:73414590 | – | ENST0000 0286657 (3/22) | Lys37Glu | 0.17/-0.01$ | T > C | 0(0) | – | – | – | – | – | – | – | – |
| ANKRD55 | 5:55407449 | rs77017041 | ENST0000 0341048 (10/12) | Ser376Pro | 0.01/0.767 | A > G | 0(0) | 0.47 | 0.427 | 0.63 | 0.71 | 0.2871 | 0.3103 | 0.2174 | 0.1902 |
| C6orf10 | 6:32261153 | rs16870005 | ENST000 00533191 (26/26) | Ala431Thr | 0.46/0.028 | C > T | 3.75 (9) | 1.4 | 1.250 | 1.43 | 0.85 | 0.0019 | 0.00049 | 0.0025 | 9.89 × 10-07 |
| CD86 | 3:121774281 | rs11575853 | ENST000 00330540 (5′UTR) | –56bp from +1 Met | n.a. | A > G | 3.75 (9) | 2.8 | 1.078 | – | 3.1 | 0.3723 | 6.1 × 10⁻⁵ | – | 0.5612 |
| EVI5 | 1:92979432 | rs41286809 | ENST000 00540033 (18/18) | Phe749Phe | – | G > A | 0.83 (2) | 0.47 | 1.116 | 1.55 | 1.61 | 0.4105 | 0.6768 | 0.3688 | 0.3391 |
| GC | 4:72669661 | rs76781122 | ENST0000 0504199 (1/14) | Met1Ile | 0.2/0 Start codon | G > T | 4.58 (11) | 5.61 | 1.611 | 3.35 | 2.77 | 0.4895 | 0.00025 | 0.2883 | 0.0869 |
| IL2RA | 10:6054765 | rs12722600 | ENST000 00379959 (3′UTR) | +70 from 273 stop | n.a. | G > A | 7.92 (19) | 4.21 | 1.777 | – | 0.87 | 0.0042 | 6.0 × 10⁻¹³ | – | <1.0 × 10⁻²⁰ |
| MALT1 | 18:56367823 | rs74847855 | ENST000 00348428 (4/17) | Arg217Gly | 0.69/0 | A > G | 4.58 (11) | 1.9 | 3.734 | 4.28 | 4.20 | 0.0019 | 0.4877 | 0.8164 | 0.7672 |
| MMEL1 | 1:2530169 | rs147248515 | ENST000 00378412 (12/24) | Pro368Thr | 0.14/0.326 | G > T | 0(0) | 0 | 0.022 | 0.028 | 0.037 | – | – | – | – |
| STAT4 | 2:191899319 | – | ENST000 00392320 (18/24) | Gln525Gln | – | A > G | 0∗ (0) | – | – | – | – | – | – | – | – |
| TET2 | 4:106156163 | rs61744960 | ENST000 00540549 (3/11) | Gly355Asp | 0.01/0.282 | G > A | 8.33 (20) | 5.6 | 2.614 | 3.77 | 3.69 | 0.0667 | 2.8 × 10-08 | 0.00021 | 0.00014 |
| TOP3A | 17:18217958 | rs2230153 | ENST000 00542570 (1/19) | Ala45Ala | – | G > A | 1.66 (4) | 0.47 | 1.692 | 0.46 | 0.36 | 0.0067 | 0.9757 | 0.0057 | 0.00073 |
| TRAF3 | 14:103371923 | rs138943371 | ENST000 00347662 (11/11) | Ser478Ser | – | C > T | 1.25 (3) | 0.47 | 0.245 | 0.30 | 0.36 | 0.0773 | 0.00164 | 0.0071 | 0.02133 |
| TYK2 | 19:10472452 | rs12720355 | ENST00 000525621 (13/25) | Ile651Ile | – | C > T | 1.66 (4) | 1.4 | 0.962 | 1.38 | 1.45 | 0.7251 | 0.2634 | 0.7034 | 0.77887 |
| WWOX | 16:78458807 | rs7201683 | ENST000 00566780 (7/9) | Leu216Val | 0.19/0.04 | C > G | 2.08 (5) | 0.47 | 1.989 | 1.23 | 1.11 | 0.00026 | 0.9166 | 0.2304 | 0.150086 |
Selected rare variants in the cohort of 120 unrelated multiple sclerosis patients.
The SIFT and PolyPhen scores (0.0 to 1.0) have opposite meanings. Prediction of the SIFT score ranges 0.0 to 0.05 deleterious; 0.05 to 1.0 tolerated. Prediction of the PolyPhen score ranges: 0.0 to 0.15, benign; 0.15 to 1.0 possibly damaging; 0.85 to 1.0 damaging. n.a., not applicable. $SIFT/Provean prediction for ADAMTS3 = (0.17) tolerated/(-0.01) neutral. ∗Investigated in 218 alleles. °Bonferroni’s correction p-value set to 0.0042. Significant p-values are in bold.
The predicted effects of the 15 analyzed low-frequency variants, each on the main encoded transcript, are reported in Table 5. In addition to the mutation of the start codon (GC, Met1Ile), expected to reduce the amount of the translated protein, missense variants were predicted as damaging (ANKRD55 Ser376Pro; TET2 Gly355Asp) or potentially damaging (MMEL1 Pro368Thr). For the rs147248515 (MMEL1) the proline to threonine change produced discrepant predictions. Among the four SNPs predicted as benign, two cause noticeable changes in amino acid polarity and size (Arg to Gly in MALT1; Ala to Thr in C6orf10).
Aimed at prioritizing low-frequency variants that may contribute to the disease-risk, we compared the MAFs observed in the unrelated MS cohort with those reported in public databases (Table 5). The new variants on STAT4 and ADAMTS3 genes were not found in the cohort of unrelated MS. The allelic frequencies of C6orf10 rs16870005 and IL2RA rs12722600 resulted significantly higher in MS patients compared with all the databases (even after Bonferroni’s correction). Based on frequencies in the Control gnomAD, the OR for the rs1687005 risk T-allele was 4.57 (95% CI 2.33–8.97) and the odds ratios for the rs12722600 risk T-allele was 9.88 (95% CI 5.71–17.09), both highly significant (p-value < 0.001).
The TET2 rs61744960 and TRAF3 rs76781122 showed significant MAF differences between MS patients and public databases with the exception of a nominal borderline p-values with the Italian Tuscany population. On the other hand, TOP3A rs2230153 showed significant MAF differences between MS patients and public databases, with the exception of dbSNP150.
For two SNPs (CD86, rs11575853 and GC, rs76781122) significant differences were observed only in the comparison between MS patients and the dbSNP150 population. Of note, for the MALT1 rs74847855, and WWOX rs7201683 highly significant MAFs differences between MS and Tuscany subjects were observed, that may reflect increased frequency of low-frequency alleles in MS Italian patients.
Within the unrelated MS cohort, 17 patients were carriers of two low-frequency variants and five patients were carrier of three variants. The combinations repeatedly included the C6orf10, TET2, and IL2RA variants (Table 6). The variants detected in combination were always located on different chromosomes.
Table 6
| ID | Gender | Age of MS onset | Phenotype at examination | C6orf10 rs16870005 | CD86 rs11575853 | EVI5 rs41286809 | GC rs76781122 | IL2RA rs12722600 | MALT1 rs74847855 | TET2 rs61744960 | TOP3A rs2230153 | TRAF3 rs138943371 | TYK2 rs12720355 | WWOX rs7201683 |
|---|---|---|---|---|---|---|---|---|---|---|---|---|---|---|
| 132 ZM | F | 20 | RR | Het | Het | |||||||||
| 159 ZM | M | 26 | RR | Het | Het | |||||||||
| 173 ZM | F | 31 | RR | Het | Het | |||||||||
| 194 ZM | F | 31 | RR | Het | Hom∗ | Het | ||||||||
| 27-WP3 | M | 31 | SP | Het | Het | |||||||||
| 43-WP3 | F | 31 | PP | Het | Het | |||||||||
| 155 ZM | F | 33 | SP | Het | Het | |||||||||
| 51-WP3 | M | 33 | SP | Het | Het | |||||||||
| 109 ZM | F | 37 | SP | Het | Het | |||||||||
| 63-WP3 | F | 37 | SP | Het | Het | Het | ||||||||
| 115 ZM | F | 38 | SP | Het | Het | Het | ||||||||
| 69-WP3 | M | 40 | SP | Het | Het | |||||||||
| 111 ZM | F | 41 | RR | Het | Het | Het | ||||||||
| 49-WP3 | F | 42 | PP | Het | Het | |||||||||
| 57-WP3 | M | 42 | SP | Het | Het | Het | ||||||||
| 208 ZM | F | 44 | RR | Het | Het | |||||||||
| MS18 | F | 45 | SP | Het | Hom∗ | |||||||||
| 184 ZM | M | 47 | SP | Het | Het | |||||||||
| 192 ZM | F | 48 | RR | Het | Het | |||||||||
| 72-WP3 | F | 48 | PP | Het | Het | |||||||||
| 204 ZM | M | 50 | RR | Het | Het | |||||||||
| MS07 | M | n.d.§ | SP | Het | Het |
Unrelated multiple sclerosis patients carriers of at least 2 low-frequency variants.
The heterozygous (Het) or homozygous (Hom∗) condition of the variants is specified. In bold, patients with combination of 3 low-frequency variants. §Age of onset below 50 years old.
The IL2RA rs12722600 and the TRAF3 rs138943371 were detected in the homozygous condition.
The comparison of age of MS onset between patients with or without the 15 investigated low-frequency variants did not provide significant differences.
Detection of Null Mutations in the 3′ Exon of C6orf10
The rs16870005 within C6orf10, a scarcely investigated locus, resulted the only missense variant with a significantly increased frequency in our cohort compared to dbSNP-Build150, Tuscany of 1000 Genome Project, ExAC -European (not Finnish)- and Control gnomAD -European (not Finnish)- (Table 5) and, in addition, it was frequently present in combination with other low-frequency variants (Table 6). Further, the nucleotide change C > T (rs16870005) in the 3′ region of the C6orf10 transcripts would substitute threonine for alanine in the carboxyl-terminal region of all the predicted proteins (reference transcript used for the study shown in Figure 3).
FIGURE 3
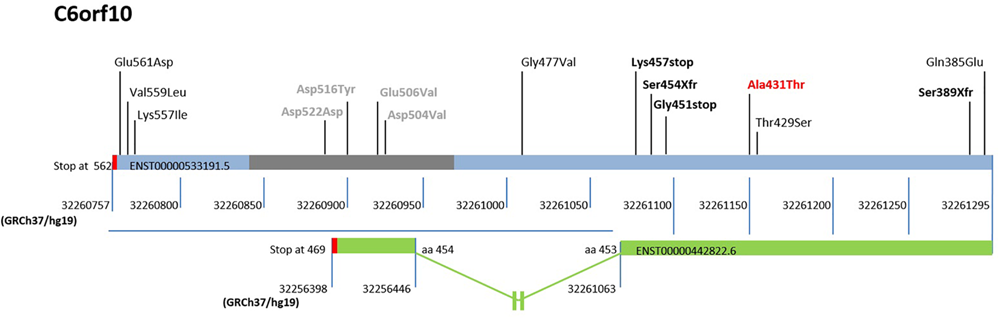
Schematic representation of the sequenced region and mutations in the 3′ exon of C6orf10. The low-frequency variants discovered by 3′ exon sequencing in the unrelated MS are reported upper the bar (light blue/gray) of the ENST00000533191.5 transcript, used as reference. The gray bar indicates the repetitive regions, and the red bars the translational stop codons of transcripts. The reference nucleotide position in GRCh37/hg19 is also shown below the transcript bars. The first variant identified by our WES is reported bold and red. The stop and frame shift variants are highlighted in bold and black. The transcript ENST0000442822.6, the only one undergoing splicing and ending at position 32256398 of Chr 6, is represented as a green bar. A blue horizontal line highlights the 3′ region with the different reference nucleotide position for each transcript. The out of scale intron is indicated with an interruption symbol. The different numbering of this transcript in the 3′ region is reported. The change in the reference nucleotide position in the ENST0000442822.6 starts after the aminoacid (aa) 453 at position 32261063.
Based on these observations we sequenced the region chr6:32261295-32260757 in the 120 MS patients, which revealed the presence of 14 low-frequency mutations (MAF ≤ 0.04), 10 not previously reported (Table 7).
Table 7
| SNP position GRCh37/hg19 | SNP ID | Amino acid change | Provean/SIFT prediction | Nucleotide change | MAF % dbSNP150 | MAF % ExAC European (not Finnish) | MAF % Controls GnomAD European (not Finnish) | MAF % in 120 MS patients (n alleles) |
|---|---|---|---|---|---|---|---|---|
| 6:32260761 | – | Glu561Asp | (-1.16) neutral/ (0) damaging | C > G | – | – | – | 0.42 (1) |
| 6:32260769 | – | Val559Leu | (-0.86) neutral/ (0.31) damaging | C > G | – | – | – | 0.42 (1) |
| 6:32260774 | – | Lys557Ile | (-1.6) neutral/ (0.004) damaging | T > A | – | – | – | 0.42 (1) |
| 6:32260878∗ | – | Asp522Asp | neutral/tolerated | G > A | – | – | – | 1.25 (3) |
| 6:32260898∗ | – | Asp516Tyr | (-2.38) neutral/ (0.011) damaging | C > A | – | – | – | 0.42 (1) |
| 6:32260927∗ | – | Glu506Val | (-1.42) neutral/ (0.028) damaging | T > A | – | – | – | 0.42 (1) |
| 6:32260933∗ | rs766126891 | Asp504Val | (-2.42) neutral/ (0) damaging | T > A | 0.001 | – | – | 0.42 (1) |
| 6:32261014 | rs7751028 | Gly477Val | (-3.43) deleterious/ (0.008) damaging | C > A | 2.480 | 0.98 | 0.99 | 0.42 (1) |
| 6:32261075 | – | Lys457stop | Damaging | T > A | – | – | – | 0.42 (1) |
| 6:32261084 | – | Ser454Xfr | Damaging | A > insG | – | – | – | 0.42 (1) |
| 6:32261093 | – | Gly451stop | Damaging | C > A | – | – | – | 0.42 (1) |
| 6:32261158 | rs114543649 | Thr429Ser | (1.30) neutral/ (1) tolerated | G > C | 2.479 | 0.98 | 0.99 | 0.42 (1) |
| 6:32261277 | – | Ser389Xfr | Damaging | T > delT | – | – | – | 0.83 (2) |
| 6:32261291 | – | Gln385Glu | (1.38) neutral/ (1) tolerated | G > C | 2.482 | 0.98 | 0.99 | 0.42 (1) |
Low-frequency variants in 3′ exon of C6orf10 detected by Sanger sequencing within the cohort of 120 unrelated MS patients.
The sequenced 3′ exonic region spans chr6:32261295-32260757 (GRCh37/hg19). The reference transcript is ENST00000533191.5, and the reference protein is ENSP00000431199 (exon position 26/26). The Provean cut off: equal or below -2.5, deleterious; above -2.5, neutral. The SIFT score range prediction: 0.0 to 0.05 deleterious; 0.05 to 1.0 tolerated. All variants were detected in heterozygous condition with the exception of Ser389Xfr (homozygous condition, bold and black). ∗Position in repetitive regions.
Of note, two mutations predicted premature termination of translation and two translational frameshift. Inspection of C6orf10 variants (Figure 3) pointed out that the four null mutations affected all C6orf10 transcripts. Among these, the ENST0000442822.6, after splicing, is shorter and encodes a different 3′ sequence. In the transcripts other than ENST0000442822.6, null mutations would remove a larger C-terminus portion (Figure 3) in which we detected several missense SNPs.
For missense changes the algorithms predicted discordant effects (Table 7), with the exception of the damaging Gly477Val (rs7751028).
Several databases were inspected for low-frequency (MAF ≤ 0.04) exonic variants within the full C6orf10 transcript ENST00000533191.5 (total length 80 Kb), and for the presence of null variants. In particular, (i) in the Control gnomAD database 301 variants were found, of which 24 were nonsense or frameshift, and (ii) in the ExAC database 271 variants were found, of which 20 were nonsense or frameshift. The proportion of null variants in the MS patients (4/14 within 538 bp) was higher than that in the Control gnomAD (p = 0.0254, Maximum Likelihood chi-square) and in the ExAC (p-value = 0.0184, Maximum Likelihood chi-square).
The distribution of the 14 low-frequency C6orf10 variants detected by Sanger sequencing in the unrelated MS patients is shown in Table 8. The frameshift mutations, of which the Ser389Xfr in the homozygous condition, were detected in two patients with young age of disease onset (21 and 25 years). Three patients were carriers of two/three missense C6orf10 mutations (Table 8). None of the 14 low-frequency variants was associated with the presence of the C6orf10 rs16870005.
Table 8
| ID | Gender | Age of MS onset | Phenotype at examination | C6orf10 |
|---|---|---|---|---|
| 138 ZM | F | 21 | RR | Ser454Xfr (Het) |
| 221 ZM | M | 22 | RR | Val559Leu (Het) Glu561Asp (Het) |
| 150 ZM | F | 25 | RR | Ser389Xfr (Hom) |
| 194 ZM | F | 31 | RR | Gln385Glu (Het) Thr429Ser (Het) Gly477Val (Het) |
| 106 ZM | M | 32 | SP | Asp504Val (Het)∗ Asp522Asp (Het)∗ |
| 128 ZM | F | 32 | RR | Glu506Val (Het)∗ |
| 109 ZM | F | 37 | SP | Asp522Asp (Het)∗ |
| 115 ZM | F | 38 | SP | Lys457stop (Het) |
| MS23 | F | 38 | RR | Gly451stop (Het) |
| 112 ZM | F | 41 | RR | Lys557Ile (Het) |
| 25-WP3 | F | 51 | PP | Asp516Tyr (Het)∗ |
| 65-WP3 | F | 51 | SP | Asp522Asp (Het)∗ |
Low-frequency variant genotypes in 3′ exon of C6orf10 within the unrelated MS patients.
MS patients carrying low-frequency C6orf10 variants (within the region chr6:32261295-32260757) are reported. The heterozygous (Het) or homozygous (Hom) condition of the variants is specified. In bold and black, the C6orf10 stop and frame shift variants. ∗C6orf10 variants in repetitive regions.
Seven patients over the 11 carriers of the C6orf10 variants were also carriers of SNPs detected in the family WES study (Supplementary Table 2).
Discussion
Taking into account the complex multi-factorial nature of MS, and the recently estimated contribution of low-frequency variants into disease risk, we aimed at investigating genetic risk components through combination of variant prioritization strategies. We explored by WES 107 candidate loci for exonic low-frequency variants in three Italian MS families with two or three affected members and validated the results in 120 unrelated Italian patients. This experimental approach brought to attention 15 exonic variants, firstly selected for parent-child transmission and further investigated for increased frequency as compared to public databases. Among these, STAT4 and ADAMTS3 variants were found to be private of the families under study, which might support the notion that a proportion of the unexplained MS heritability is accounted by additive effects of individual variants (International Multiple Sclerosis Genetics Consortium, 2018).
Noticeably, our screening identified a number of significant differences in the observed allelic frequencies as compared with public databases. The observed MAFs, higher in the Italian MS patients under study, point toward an increase in frequency of the detected variants in patients as compared to healthy population. The C6orf10 rs16870005 and IL2RA rs12722600 are the main signals identified in our study, as confirmed by comparison with all databases.
Through different experimental approaches, focused on low-frequency variants, we report several and novel findings in the C6orf10 locus. The 3′ region, including the potentially damaging variant rs16870005 which resulted associated with MS in our cohort, was found to contain 14 low-frequency mutations, among which 10 not previously reported and four potentially null variants. Furthermore, three patients showed combination of the C6orf10 heterozygous low-frequency variants, one was found to be homozygous for the Ser389Xfr, and seven displayed combinations of C6orf10 with low-frequency variants in other candidate genes. Although anecdotal, finding the homozygous Ser389Xfr in a patient with early onset of the MS disease fosters further investigation in relation to the recent study suggesting that C6orf10 could be implicated in the age of onset of other neurodegenerative disease (Zhang et al., 2018).
The interpretation of potential functional consequences was hampered by the C6orf10 chromosomal location and structure. As a matter of fact, this ORF is located on chromosome 6p21.32, in the major histocompatibility complex region which contains the major MS-associated risk gene HLA-DRB1 (Bashinskaya et al., 2015). To evaluate if the signals of associations between the C6orf10 variants could reflect linkage disequilibrium (LD) with DRB1 SNPs reported in the literature (reviewed in Bashinskaya et al., 2015), the data from the 1000 Genome project were explored (Supplementary Table 3). The low LD of C6orf10 rs16870005 with C6orf10 rs3129934 (r2 0.113), and with the HLA rs9271366 (r2 0.055), suggests that the association between C6orf10 rs16870005 and MS does not simply reflect the LD with the HLA-DRB1 locus.
The C6orf10 structure comprises several transcripts, including three isoforms of a validated, but not characterized, long non-coding RNA (NR_136244.1, NR_136245.1, and NR_136246.1) and a pseudogene hnRNP (HNRNPA1P2). Thus, the null mutations that we have found in the MS cohort would affect the C-terminal portion of several uncharacterized proteins expressed in brain and B cells 14both tissues of interest for MS.
The small sample size and the statistical power derived from our population do not permit an informative evaluation of the possible impact of the numerous newly detected C6orf10 variants on the disease onset or clinical course within an integrated multiple variants model.
Finding of the IL2RA 3′UTR low-frequency variant (rs12722600) (i) in two MS families, (ii) with a significantly higher frequency in the unrelated MS cohort than in the public databases, and (iii) in several combinations with the other low-frequency SNPs, is particularly intriguing. As for the other IL2RA polymorphisms previously associated with the risk of developing the disease (Matiello et al., 2011; Wang and Chen, 2018), the functional consequence of the rs12722600 can be only proposed (Maier et al., 2009) as affecting the post-transcriptional regulation of the IL2RA mRNA, of which little is known (Techasintana et al., 2017). Bio-informatics prediction of miRNA binding sites in the IL2RA 3′UTR did not reveal creation or disruption of regulatory sites produced by the rs12722600 nucleotide change. Interestingly, therapies for MS have been already developed to avoid the formation of the interleukin-2 receptor complex, and particularly targeting CD25 (Bielekova, 2018), the α-subunit encoded by the IL2RA. Our findings support further studies aimed at characterizing the IL2RA 3′UTR in patients undergoing this therapeutic approach.
The TET2 gene codifies for an enzyme that catalyzes the conversion of 5-methylcytosine to 5-hydroxymethylcytosine, thus modifying the DNA methylation pattern. As functional partner, TET2 may participate in histone modification (O-GlcNAcylation, Chen et al., 2013). Noteworthy, demethylation by TET2 is also actively involved in T cells differentiation and their cytokines production (Ichiyama et al., 2015; Wang et al., 2017). The presence of the low-frequency TET2 rs61744960 variant in MS patients of all the three families, and its frequency in unrelated MS patients cohort higher than in three databases support further investigation of this finding in relation to MS. It is of note that the SNP rs61744960 has been previously reported in an Italian study focused on leukemia, and two of the six patients, who carried this variant, had MS as a primary disease (Ottone et al., 2012).
For the TRAF3 rs138943371 we observed in the four databases a frequency pattern similar to that of TET2 rs61744960. TRAF3 gene codifies for tumor necrosis factor receptor-associated factor 3, a major regulator of innate immune response through different transduction signal pathways (Cullell et al., 2017). By “Human Splicing Finder” analysis, the rs138943371 C to T change, disrupting an exonic splicing enhancer, might create in the TRAF3 transcript a new exonic splicing silencer. Further investigation is needed to evaluate potential effects on transcription and splicing processes, that are strictly related and rely on regulatory elements in the 3′ gene region.
Although in the GWAS MS candidate genes we did not detect an increased number of low frequency variants in our MS families, those variants firstly found with parent-child transmission in MS families were detected in several combinations in unrelated patients, particularly in C6orf10, IL2RA and TET2. These observations further highlight the complexity of the MS genetic risk components.
Our study supports further investigation within genetics consortiums of multiple low-frequency risk variants in coding regions of MS candidate genes. Expression of specific protein variants, and their combinations, could provide functional insights in the heterogeneous pathogenetic mechanisms contributing to MS.
Statements
Ethics statement
Written informed consent was obtained from all subjects, and the study was approved by the Ethical Committee of the S. Anna University-Hospital, Ferrara, Italy.
Author contributions
NZ, GM, CS, MB, PZ, and FB conceived and designed the study. NZ, GM, CS, and FB wrote the manuscript. NZ, SM, and LL performed the literature revision. NZ, SM, LL, BL, NB, and IG carried out the lab experiments. NZ, CS, AB, and DB performed bio-informatic analyses of the data. FS, SS, DG, and PZ selected and recruited the patients, and performed their clinical evaluation. NZ, MB, SM, EM, and DG collected the samples and evaluated the pre-analytical variables. All authors critically evaluated the final version of the manuscript.
Funding
This study was partly supported by the grant 1786/2012 from the strategic 2010–2012 Research Program of the Emilia Romagna Region and the grant 2010XE5L2R_002 of the Italian Ministry of University and Research.
Acknowledgments
We thank Alberto Carrieri for his technical support. We are grateful to the families and the patients who took part in this study. We also thank the Italian “Fondazione Il Bene Onlus” for their support in the MS research.
Conflict of interest
The authors declare that the research was conducted in the absence of any commercial or financial relationships that could be construed as a potential conflict of interest. The reviewer RA declared a past co-authorship with the authors PZ, FB, and DG.
Supplementary material
The Supplementary Material for this article can be found online at: https://www.frontiersin.org/articles/10.3389/fgene.2019.00573/full#supplementary-material
Footnotes
1.^http://www.ncbi.nlm.nih.gov/pubmed/
4.^http://omictools.com/soapaligner-tool
5.^http://www.completegenomics.com/documents/Small_Variant_Assembler_Methods.pdf
6.^http://www.ncbi.nlm.nih.gov/projects/SNP/
7.^http://www.1000genomes.org/data
8.^http://exac.broadinstitute.org/
9.^https://gnomad.broadinstitute.org/
10.^http://software.broadinstitute.org/software/igv/
11.^http://sift.jcvi.org/www/SIFT_enst_submit.html
12.^http://www.ensembl.org/index.html
13.^http://bioinfo.ut.ee/primer3-0.4.0/
14.^http://www.genenetwork.org/webqtl/WebQTL.py?cmd=sch&refseq=NM_006781&species=human
References
1
BalestraD.ScaletD.PaganiF.RogalskaM. E.MariR.BernardiF.et al (2016). An exon-specific U1snRNA induces a robust factor IX activity in mice expressing multiple human FIX splicing mutants.Mol. Ther. Nucleic. Acids5:e370. 10.1038/mtna.2016.77
2
BanM.CaillierS.MeroI. L.MyhrK. M.CeliusE. G.AarsethJ.et al (2013). No evidence of association between mutant alleles of the CYP27B1 gene and multiple sclerosis.Ann. Neurol.73430–432. 10.1002/ana.23833
3
BashinskayaV. V.KulakovaO. G.BoykoA. N.FavorovA. V.FavorovaO. O. (2015). A review of genome-wide association studies for multiple sclerosis: classical and hypothesis-driven approaches.Hum. Genet.1341143–1162. 10.1007/s00439-015-1601-2
4
BattagliaM. A.BezziniD. (2017). Estimated prevalence of multiple sclerosis in Italy in 2015.Neurol. Sci.38473–479. 10.1007/s10072-016-2801-9
5
BernalesC. Q.EncarnacionM.CriscuoliM. G.YeeI. M.TraboulseeA. L.SadovnickA. D.et al (2018). Analysis of NOD-like receptor NLRP1 in multiple sclerosis families.Immunogenetics70205–207. 10.1007/s00251-017-1034-2
6
BezziniD.PolicardoL.MeucciG.UlivelliM.BartaliniS.ProfiliF.et al (2016). Prevalence of multiple sclerosis in tuscany (Central Italy): a study based on validated administrative data.Neuroepidemiology4637–42. 10.1159/000441567
7
BielekovaB. (2018). Daclizumab therapy for multiple sclerosis.Cold Spring Harb. Perspect Med.9:a034470.
8
ChenQ.ChenY.BianC.FujikiR.YuX. (2013). TET2 promotes histone O-GlcNAcylation during gene transcription.Nature493561–564. 10.1038/nature11742
9
CiccarelliO.BarkhofF.BodiniB.De StefanoN.GolayX.NicolayK.et al (2014). Pathogenesis of multiple sclerosis: insights from molecular and metabolic imaging.Lancet Neurol.13807–822. 10.1016/S1474-4422(14)70101-2
10
CullellN.MuinoE.CarreraC.TorresN.KrupinskiJ.Fernandez-CadenasI. (2017). Role of TRAF3 in neurological and cardiovascular diseases: an overview of recent studies.Biomol. Concepts8197–202. 10.1515/bmc-2017-0008
11
DymentD. A.CaderM. Z.ChaoM. J.LincolnM. R.MorrisonK. M.DisantoG.et al (2012). Exome sequencing identifies a novel multiple sclerosis susceptibility variant in the TYK2 gene.Neurology79406–411. 10.1212/WNL.0b013e3182616fc4
12
Garcia-RosaS.De AmorimM. G.ValierisR.MarquesV. D.LorenziJ. C. C.TollerV. B.et al (2017). Exome sequencing of multiple-sclerosis patients and their unaffected first-degree relatives.BMC Res. Notes.10:735. 10.1186/s13104-017-3072-0
13
GemmatiD.ZeriG.OrioliE.De GaetanoF. E.SalviF.BartolomeiI.et al (2012). Polymorphisms in the genes coding for iron binding and transporting proteins are associated with disability, severity, and early progression in multiple sclerosis.BMC Med. Genet.13:70. 10.1186/1471-2350-13-70
14
GranieriE.De MattiaG.LaudisiM.GovoniV.CastellazziM.CaniattiL.et al (2018). Multiple sclerosis in Italy: a 40-year follow-up of the prevalence in ferrara.Neuroepidemiology51158–165. 10.1159/000491548
15
HollenbachJ. A.OksenbergJ. R. (2015). The immunogenetics of multiple sclerosis: a comprehensive review.J. Autoimmun.6413–25. 10.1016/j.jaut.2015.06.010
16
IchiyamaK.ChenT.WangX.YanX.KimB. S.TanakaS.et al (2015). The methylcytosine dioxygenase Tet2 promotes DNA demethylation and activation of cytokine gene expression in T cells.Immunity42613–626. 10.1016/j.immuni.2015.03.005
17
International Multiple Sclerosis Genetics Consortium (2016). NR1H3 p.Arg415Gln Is not associated to multiple sclerosis risk.Neuron92333–335. 10.1016/j.neuron.2016.04.039
18
International Multiple Sclerosis Genetics Consortium (2018). Low-Frequency and Rare-Coding variation contributes to multiple sclerosis risk.Cell1751679–1687. 10.1016/j.cell.2018.09.049
19
KemppinenA. K.BakerA.LiaoW.FiddesB.JonesJ.CompstonA.et al (2014). Exome sequencing in single cells from the cerebrospinal fluid in multiple sclerosis.Mult. Scler.201564–1568. 10.1177/1352458514529613
20
KurtzkeJ. F. (1983). Rating neurologic impairment in multiple sclerosis: an expanded disability status scale (EDSS).Neurology331444–1452.
21
MaierL. M.AndersonD. E.SeversonC. A.Baecher-AllanC.HealyB.LiuD. V.et al (2009). Soluble IL-2RA levels in multiple sclerosis subjects and the effect of soluble IL-2RA on immune responses.J. Immunol.1821541–1547.
22
MarchettiG.ZiliottoN.MeneghettiS.BaroniM.LunghiB.MenegattiE.et al (2018). Changes in expression profiles of internal jugular vein wall and plasma protein levels in multiple sclerosis.Mol. Med.24:42. 10.1186/s10020-018-0043-4
23
MatielloM.WeinshenkerB. G.AtkinsonE. J.Schaefer-KleinJ.KantarciO. H. (2011). Association of IL2RA polymorphisms with susceptibility to multiple sclerosis is not explained by missense mutations in IL2RA.Mult. Scler.17634–636.
24
MaverA.LavtarP.RisticS.StopinsekS.SimcicS.HocevarK.et al (2017). Identification of rare genetic variation of NLRP1 gene in familial multiple sclerosis.Sci. Rep.7:3715. 10.1038/s41598-017-03536-9
25
MescheriakovaJ. Y.VerkerkA. J.AminN.UitterlindenA. G.Van DuijnC. M.HintzenR. Q. (2018). Linkage analysis and whole exome sequencing identify a novel candidate gene in a Dutch multiple sclerosis family.Mult. Scler.25909–917. 10.1177/1352458518777202
26
MinikelE. V.MacArthurD. G. (2016). Publicly available data provide evidence against NR1H3 R415Q causing multiple sclerosis.Neuron92336–338. 10.1016/j.neuron.2016.09.054
27
MorandiE.TarlintonR. E.GranB. (2015). Multiple sclerosis between genetics and infections: human endogenous retroviruses in monocytes and macrophages.Front. Immunol.6:647. 10.3389/fimmu.2015.00647
28
OlssonT.BarcellosL. F.AlfredssonL. (2017). Interactions between genetic, lifestyle and environmental risk factors for multiple sclerosis.Nat. Rev. Neurol.1325–36. 10.1038/nrneurol.2016.187
29
OttoneT.CicconiL.HasanS. K.LavorgnaS.DivonaM.VosoM. T.et al (2012). Comparative molecular analysis of therapy-related and de novo acute promyelocytic leukemia.Leuk. Res.36474–478. 10.1016/j.leukres.2011.10.015
30
PatsopoulosN. A. (2018). Genetics of multiple sclerosis: an overview and new directions.Cold Spring Harb. Perspect Med.8:a028951. 10.1101/cshperspect.a028951
31
PolmanC. H.ReingoldS. C.BanwellB.ClanetM.CohenJ. A.FilippiM.et al (2011). Diagnostic criteria for multiple sclerosis: 2010 revisions to the McDonald criteria.Ann. Neurol.69292–302. 10.1002/ana.22366
32
RamagopalanS. V.DymentD. A.CaderM. Z.MorrisonK. M.DisantoG.MorahanJ. M.et al (2011). Rare variants in the CYP27B1 gene are associated with multiple sclerosis.Ann. Neurol.70881–886. 10.1002/ana.22678
33
SadovnickA. D.TraboulseeA. L.ZhaoY.BernalesC. Q.EncarnacionM.RossJ. P.et al (2017). Genetic modifiers of multiple sclerosis progression, severity and onset.Clin. Immunol.180100–105. 10.1016/j.clim.2017.05.009
34
TechasintanaP.EllisJ. S.GlascockJ.GubinM. M.RidenhourS. E.MageeJ. D.et al (2017). The RNA-Binding protein HuR posttranscriptionally regulates IL-2 homeostasis and CD4(+) Th2 differentiation.Immunohorizons1109–123. 10.4049/immunohorizons.1700017
35
WangX.BiernackaJ. M. (2015). Assessing the effects of multiple markers in genetic association studies.Front. Genet.6:66. 10.3389/fgene.2015.00066
36
WangX.WangJ.YuY.MaT.ChenP.ZhouB.et al (2017). Decitabine inhibits T cell proliferation via a novel TET2-dependent mechanism and exerts potent protective effect in mouse auto- and allo-immunity models.Oncotarget856802–56815. 10.18632/oncotarget.18063
37
WangX. X.ChenT. (2018). Meta-analysis of the association of IL2RA polymorphisms rs2104286 and rs12722489 with multiple sclerosis risk.Immunol. Invest.47431–442. 10.1080/08820139.2018.1425699
38
WangZ.SadovnickA. D.TraboulseeA. L.RossJ. P.BernalesC. Q.EncarnacionM.et al (2016). Nuclear receptor NR1H3 in familial multiple sclerosis.Neuron90948–954. 10.1016/j.neuron.2016.04.039
39
WeckxS.Del-FaveroJ.RademakersR.ClaesL.CrutsM.De JongheP.et al (2005). novoSNP, a novel computational tool for sequence variation discovery.Genome Res.15436–442.
40
ZhangM.FerrariR.TartagliaM. C.KeithJ.SuraceE. I.WolfU.et al (2018). A C6orf10/LOC101929163 locus is associated with age of onset in C9orf72 carriers.Brain1412895–2907. 10.1093/brain/awy238
41
ZiliottoN.BaroniM.StraudiS.ManfrediniF.MariR.MenegattiE.et al (2018). Coagulation factor XII levels and intrinsic thrombin generation in multiple sclerosis.Front. Neurol.9:245. 10.3389/fneur.2018.00245
Summary
Keywords
multiple sclerosis, whole exome sequencing, low-frequency variants, rare variants, C6orf10
Citation
Ziliotto N, Marchetti G, Scapoli C, Bovolenta M, Meneghetti S, Benazzo A, Lunghi B, Balestra D, Laino LA, Bozzini N, Guidi I, Salvi F, Straudi S, Gemmati D, Menegatti E, Zamboni P and Bernardi F (2019) C6orf10 Low-Frequency and Rare Variants in Italian Multiple Sclerosis Patients. Front. Genet. 10:573. doi: 10.3389/fgene.2019.00573
Received
30 October 2018
Accepted
31 May 2019
Published
26 June 2019
Volume
10 - 2019
Edited by
Carlos Cruchaga, Washington University in St. Louis, United States
Reviewed by
Rosanna Asselta, Humanitas University, Italy; Nourtan F. Abdeltawab, Cairo University, Egypt
Updates
Copyright
© 2019 Ziliotto, Marchetti, Scapoli, Bovolenta, Meneghetti, Benazzo, Lunghi, Balestra, Laino, Bozzini, Guidi, Salvi, Straudi, Gemmati, Menegatti, Zamboni and Bernardi.
This is an open-access article distributed under the terms of the Creative Commons Attribution License (CC BY). The use, distribution or reproduction in other forums is permitted, provided the original author(s) and the copyright owner(s) are credited and that the original publication in this journal is cited, in accordance with accepted academic practice. No use, distribution or reproduction is permitted which does not comply with these terms.
*Correspondence: Nicole Ziliotto, zltncl1@unife.itorcid.org/0000-0003-1007-7266
This article was submitted to Neurogenomics, a section of the journal Frontiers in Genetics
Disclaimer
All claims expressed in this article are solely those of the authors and do not necessarily represent those of their affiliated organizations, or those of the publisher, the editors and the reviewers. Any product that may be evaluated in this article or claim that may be made by its manufacturer is not guaranteed or endorsed by the publisher.