 Ruixian Zhang1,2
 Xiaolan Li
- 1Department of Dermatology, The Second Affiliated Hospital of Kunming Medical University, Kunming, China
- 2Yunnan Center for Disease Control and Prevention, Kunming, China
Mutations in and reduced expression of the ETS1 gene may be associated with systemic lupus erythematosus (SLE). Here, we report a replication study to investigate associations of eight ETS1 single-nucleotide polymorphisms in the 3′-untranslated region (3′-UTR) with SLE and their regulation of ETS1 expression in a study population. We found that the rs4937333 T allele was associated with a significantly increased risk of SLE (odds ratio: 1.800, 95% confidence interval: 1.02–3.157, P = 0.040) and with dramatically reduced levels of ETS1 in B cells from SLE subjects. Functionally, the rs4937333 T allele alters the binding affinity between miR-5003 and its ETS1 3′-UTR target, thus enhancing suppression of ETS1 expression. Furthermore, immunoglobulin M-secreting plasmacytes were significantly reduced among B cells with the rs4937333 C allele versus the T allele according to FACS and ELISA. Additionally, miR-5003 expression was higher in B cells than in T cells from SLE patients, and a negative correlation between miR-5003 and ETS1 was found, especially in B cells with the T allele. These findings suggest that the rs4937333 T allele is a risk factor for susceptibility to SLE in the studied population. The rs4937333 T allele may enhance the binding of miR-5003 to ETS1, which probably promotes the involvement of ETS1 in the differentiation of B cells into plasmacytes.
Introduction
Systemic lupus erythematosus (SLE) is a complex, fatal, and heterogeneous chronic autoimmune disease (Carter et al., 2016). SLE pathogenesis includes abnormal T and B cells, aberrant autoantibody production, and dysregulated cytokine production (Anolik, 2007; Jacob and Stohl, 2011). Studies on both humans and mouse models of the disease have shown that genetic factors strongly contribute to the pathogenesis of SLE (Crampton et al., 2014). Genome-wide association studies (GWASs) have identified some SLE susceptibility genes, highlighting potential disease mechanisms (Mohan and Putterman, 2015).
One SLE-associated gene encodes the transcription factor ETS1, which is a member of the ETS family of transcription factors and plays a role in lymphocyte development and function, apoptosis, and inflammation (Pan et al., 2011). Over-activated B cells differentiate into plasma cells have an important role in the pathogenesis of SLE by producing anti-nuclear autoantibodies (including specific antibodies that bind to double-stranded DNA) and presenting autoantigens to T cells (Nashi et al., 2010; Malkiel et al., 2018). ETS1 is a negative regulator of B cell differentiation, and ETS1 deficiency is strongly correlated with an increase in immunoglobulin M (IgM)- and IgG-secreting plasma cells (Wang et al., 2005). Previous studies have found that ETS1 mRNA levels are lower in peripheral blood mononuclear cells (PBMCs) from SLE patients than in PBMCs from healthy controls (Yang et al., 2010). However, the ETS1 expression patterns in B cells and CD4+ T cells remain unclear, and the mechanism of ETS1 dysregulation is unknown.
Several studies have revealed the effects of genetic variants that decrease ETS1 expression in autoimmune diseases (Deng and Tsao, 2010; Yang et al., 2010; Shan et al., 2014). Evidence indicates that several single-nucleotide polymorphisms (SNPs) in the 3′-untranslated region (UTR) of ETS1 were associated with SLE (Han et al., 2009; Yang et al., 2010; Armstrong et al., 2014; Shan et al., 2014; Lessard et al., 2016). MicroRNAs (miRNAs) are non-protein-coding RNA molecules that regulate the translation and degradation of messenger RNA (mRNA) through sequence complementarity with 3′-UTR regions; such regulation has been implicated in a wide range of biological processes, including cell proliferation, differentiation, and death (Schickel et al., 2008; Catalanotto et al., 2016). SNPs in miRNA target sites in the 3′-UTRs of mRNA molecules represent a specific class of functional polymorphisms that may lead to dysregulation of posttranscriptional gene expression by disrupting regulatory miRNA binding. An increasing number of 3′-UTR SNPs in miRNA-binding sites has been found to be associated with SLE, including rs1057233 in the miR-569-binding site of SPI1 (Hikami et al., 2011) and rs3853839 in the miR-3148-binding site of toll-like receptor 7 (TLR7) (Deng et al., 2013). However, whether SNPs in the 3′-UTR of ETS1 are associated with SLE in the Chinese population remains unclear.
We hypothesized that SNPs in the 3′-UTR of ETS1 may change miRNA binding to ETS1, contributing to the disordered expression of the gene. In the present study, we found that rs4937333 was associated with an increased risk of SLE in the Han population in the Kunming area. The T variant of rs4937333 affected the binding affinity of miR-5003 to the 3′-UTR of the ETS1 gene, thus disrupting posttranscriptional regulation of the gene and resulting in enhanced differentiation of B cells into plasma cells.
Materials and Methods
Subjects
We recruited 108 unrelated subjects for this case–control study from January to October 2018, including 66 patients with SLE (62 females, 93.9%) from the Second Affiliated Hospital of Kunming Medical University. All patients, who had a mean age of 36 ± 7.3 years, met the modified criteria for SLE (Petri et al., 2012). We also recruited 42 unrelated, randomly sampled healthy controls (39 females, 92.9%) from a health check-up center at the hospital during the same period; the mean age of these subjects was 38 ± 8.2 years. The inclusion criteria for SLE were as follows: A Systemic Lupus Erythematosus Disease Activity Index (SLEDAI-2K) < 3, reflecting the stationary phase, and the use of only a low-maintenance dosage of prednisone within the past 3 months (Gladman et al., 2002). The protocol for this research was approved by the Ethics Committee of the Second Affiliated Hospital of Kunming Medical University, and all subjects in this study provided informed consent.
Isolation and Culture of PBMCs, B Cells, and CD4+ T Cells
Peripheral blood mononuclear cells were purified from heparinized venous blood by density gradient centrifugation with Lymphoprep (Axis-Shield, Oslo, Norway). Density gradient centrifugation was performed for 20 min at 400 × g and 18–20°C within 2 h after blood specimens were obtained. CD4+ cells were enriched by positive selection with CD4 magnetic microbeads (Miltenyi Biotec, Bergisch Gladbach, Germany) according to the manufacturer’s protocol. To obtain highly purified CD4 cells, the PBMCs were incubated with the microbeads (20 μL/107 cells) at 4°C for 15 min and then passed through LS columns using a QuadroMACS separator (Miltenyi Biotec). During this process, degassed buffer containing phosphate buffer saline (PBS, pH 7.2), bovine serum albumin (BSA, 0.5%), ethylenediaminetetraacetic acid (EDTA 2 mM) was used to wash the columns. The same procedure was used to isolate CD19+ lymphocytes from the remaining cells according to the manufacturer’s instructions.
SNP Selection and Genotyping
We selected eight SNPs (rs1128355, rs11554584, rs12288765, rs35034701, rs58920409, rs57498864, rs1128334, and rs4937333) in the 3′-UTR of ETS1 based on published studies (Han et al., 2009; Yang et al., 2010; Guo et al., 2013) and prediction results from miRdSNP (Bruno et al., 2012) and PolymiRTS Database 3.0 (Bhattacharya et al., 2013). Genomic DNA was extracted from blood leucocytes using a whole-blood genomic DNA extraction kit (Tiangen, China) following the manufacturer’s instructions. The gene polymorphisms were analyzed using PCR sequencing.
Quantitative PCR for ETS1
Total RNA was extracted from PBMCs, B cells, and T cells from 66 SLE patients and 42 healthy controls by the TRIzol reagent method (Invitrogen, United States) and then reverse transcribed into cDNA with a reverse transcription kit (Takara, Japan). Allele-specific expression of ETS1 was analyzed only in healthy controls. Real-time quantitative PCR (RT-qPCR) was performed to amplify cDNA with a Roche 480 RT-PCR system with SYBR Green Master Mix (Kapa Biosystems, United States). Relative expression was analyzed by the comparative threshold cycle (Ct) method and normalized to the expression of human glyceraldehyde-3-phosphate dehydrogenase (GAPDH). Expression values were calculated by the 2–Δ method and log 10 transformed. The primer sequences used for genotyping of the SNPs and qPCR of miRNA or ETS1 are shown in Supplementary Table S1. Melting curve analysis was used to confirm specificity, and three replicate wells were used for each subject (Schmittgen and Livak, 2008). Extracted total RNA was also subjected to RT-PCR to detect miRNA levels in subjects with and without the variant allele using an Ambion RT-PCR kit and a QuantStudio 12K Flex RT-PCR System.
Vector Construction
A 337-bp fragment containing the rs4937333 locus on the 3′-UTR of ETS1 was amplified by PCR from two homozygous patients (carrying TT or CC genotype) using the following primers: sense (5′-GCCTCTTGCTTGGGTCTGAT-3′) and antisense (5′-AAGCCACCCCTCCTCCTTAT-3′). The PCR product was subcloned into the SacI and XhoI site of firefly luciferase in the pGL3 vector (Promega, Biloxi, MS, United States).
To investigate the effect of a T mutation at the rs4937333 site in the human ETS1 gene in vitro, the human ETS1 ORF was cloned into the pEZ-LV201 vector (GeneCopoeia, Inc., Rockville, MD, United States), and the 337-bp fragment of the ETS1 3′-UTR containing either a T or C allele at the rs4937333 locus was inserted downstream of the human ETS1 gene. All constructs were confirmed by sequencing.
Lentiviral Production and Transduction
For lentivirus production, the Lenti-Pac 293Ta packaging cell line was transfected with various lentivirus expression plasmids using the Lenti-Pac HIV Expression Packaging Kit (GeneCopoeia, Inc., Rockville, MD, United States). Lentiviral supernatants were used to infect 3 × 10⁶ B cells, which were stimulated with 5 μg/ml CpG ODN (Class B, invivoGen, San Diego, CA, United States). Two days after infection, the GFP-positive population was sorted out using the FACsAria Cell Sorter (BD Biosciences Immunocytometry Systems). The resulting data were analyzed on a BD LSRFortessaTM cell analyzer using FlowJo software 6.0 (TreeStar Inc., Ashland, OR, United States).
After 48 h of incubation in CpG ODN, the supernatants were harvested, and ELISA was carried out using a commercial kit (NeoBioscience, China). The proliferation of sorted GFP+ virally infected cells was measured by CFSE assays as previously described (Aab et al., 2017).
Thermodynamic Model for Predicting miRNA–Target Interactions
We used MirSNP, the PolymiRTS Database 3.0, and MicroSNiPer to predict the SNP rs4937333 located in the seed region of the miR-5003 target sites of ETS1. To investigate the binding affinity of miR-5003 to the target sites with rs4937333 variants, we used a 60-bp region (containing the seed site) to calculate the energies of the secondary structures using a parameter-free thermodynamic model. Briefly, RNAFold (Vienna RNA Package) was used to compute Etarget, which is the secondary structure of the target with the lowest free energy based on its sequence. RNAcoFold was used to calculate Eintermediate and Ecomplex. Eintermediate is the local energy of the transition state when we force the binding site to be unpaired, and Ecomplex is the local energy of the miRNA and target mRNA dimer (Zhang et al., 2011).
miRNA Mimic Transfection
An miR-5003 mimic and negative control mimic were ordered from RiboBio Company (Guangzhou, China). The miRNA mimics were transfected into 293T cells and B cells for luciferase reporter assays and Western blot assays after 48 h of transduction as described below.
Luciferase Reporter Gene Assay
To analyze luciferase activity, 293T or B cells were seeded in 24-well culture plates 24 h before transfection. The miRNA-5003 mimic or control mimic was cotransfected with reporter vectors (pGL3 control empty vector or the rs4937333 T or C allele constructs) using Lipofectamine 2000 (Invitrogen, United States) following the manufacturer’s protocol. The vector pRL-SV40 (Promega, Biloxi, MS, United States) was used as an internal control. Firefly and Renilla luciferase activity levels were measured at 24 h after transfection using a Dual-Glo Luciferase Assay System (Promega, Biloxi, MS, United States). Relative reporter activity was obtained by normalization to Renilla luciferase activity (the ratio of firefly luciferase activity to Renilla luciferase activity). The experiments were independently performed in triplicate.
Western Blot Analysis
Whole-cell lysate was prepared using RIPA lysis buffer (Beyotime Biotechnology, China). Protein concentrations were determined by BCA quantification using a BCA protein assay kit (Tiangen, China). The samples were subjected to 10% SDS–PAGE and transferred to PVDF membranes (Millipore, United States). After blocking at room temperature for 2 h, the membranes were incubated at 4°C overnight with rabbit polyclonal anti-ETS1 (1:1000 dilution, clone C-20, Santa Cruz Biotechnology, Santa Cruz, CA, United States) and mouse monoclonal anti-β-actin (1:2000 dilution, clone C-20, Santa Cruz Biotechnology, Santa Cruz, CA, United States). Secondary antibodies labeled with horseradish peroxidase (1:5000 dilutions, Santa Cruz Biotechnology, Santa Cruz, CA, United States) and an ECL kit (Pierce, United States) were used to detect the protein signals. The Western blot bands were quantified by scanning densitometry using Quantity One software (Bio-Rad). All experiments were performed at least three times.
Flow Cytometry
Flow cytometry was performed to investigate the effects of SNPs on B cell differentiation into plasma cells. Briefly, lentivirus-transduced cells were stained with phycoerythrin-conjugated anti-mouse Syndecan-1 (CD138) (BD Biosciences Pharmingen). The samples were analyzed on a BD Biosciences Immunocytometry Systems FACSCalibur flow cytometer, and the resulting data were evaluated using FlowJo software 6.0 (TreeStar Inc., Ashland, OR, United States).
Elisa
Equivalent numbers of sorted GFP+ cells from the lentivirally transduced populations were resuspended in medium containing 5 μg/ml CpG ODN. After 48 h, the supernatants were harvested, and ELISA was carried out using a commercial kit (NeoBioscience, China).
Statistical Analysis
The SNPs were tested for adherence to Hardy–Weinberg equilibrium (HWE) by the Chi-squared test. The allele frequencies of the two SNPs in patients and controls were compared using SPSS19.0 with Fisher’s exact test. Differences in allelic expression were analyzed by t-tests and analysis of variance (ANOVA) with GraphPad Prism v6.0 (GraphPad Software, United States). The relationship between ETS1 transcript levels and miR-5003 was evaluated using linear regression. P < 0.05 was considered statistically significant.
Results
Association Study
We investigated the genotypes and allele distributions of two SNPs in ETS1 in 42 controls and 66 patients with SLE in the Kunming area (Figure 1). Neither SNP had an allele frequency that deviated significantly from HWE at the 0.05 significance level. The frequency of the rs4937333 T allele was significantly higher in SLE patients [P = 0.040, odds ratio (OR): 1.800, 95% confidence interval (CI): 1.026–3.157] than in healthy controls. The other SNPs were not associated with SLE (Table 1).
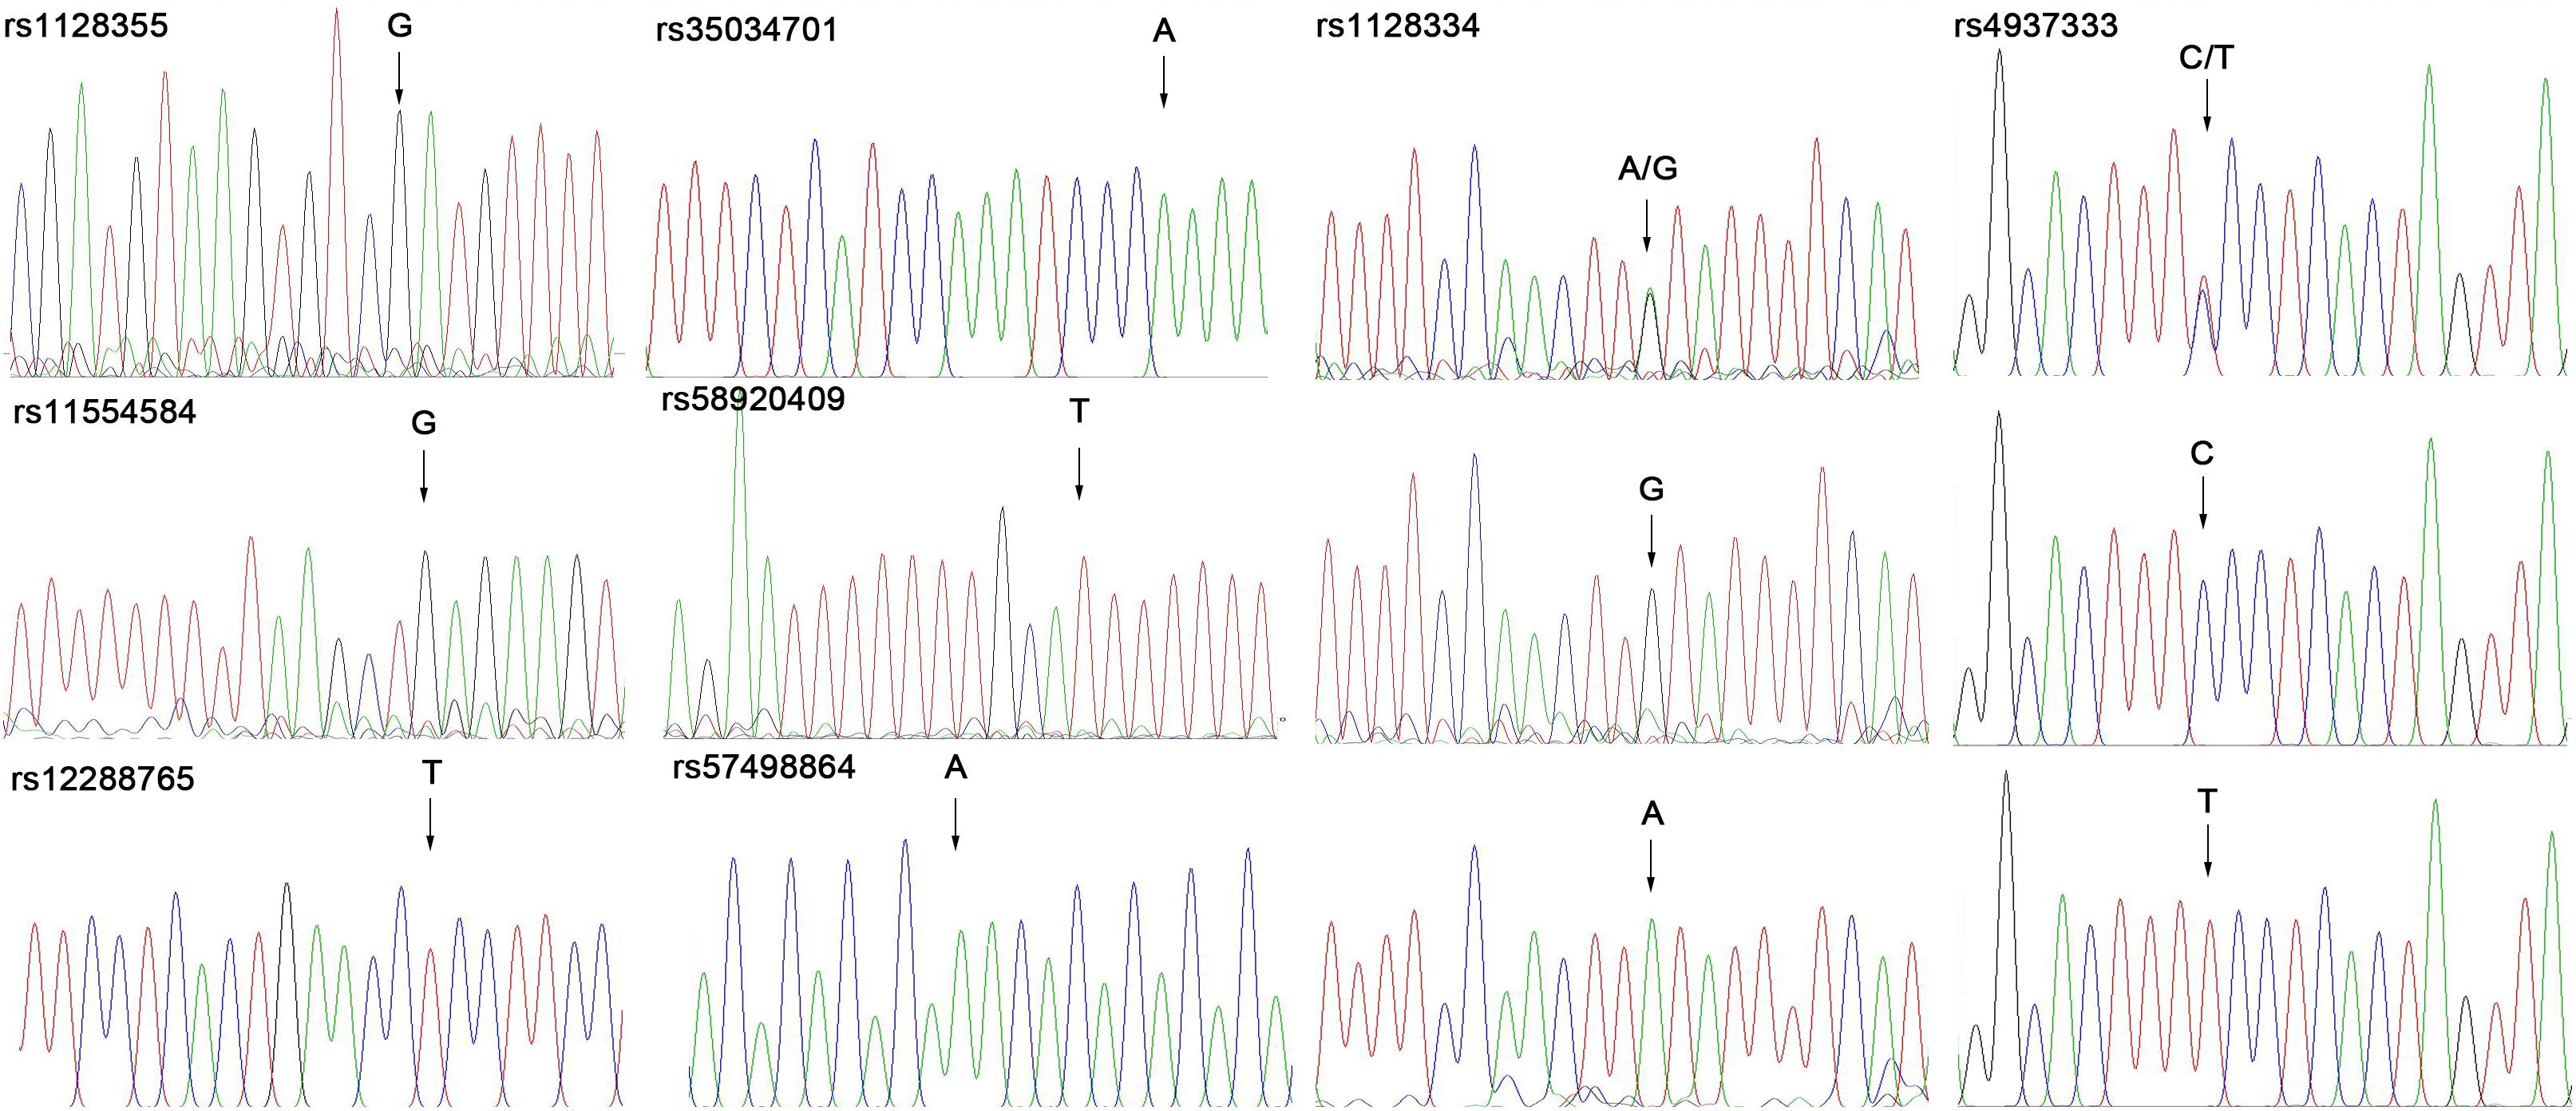
Figure 1. Use of sequencing technology to genotype the SNP in ETS1.
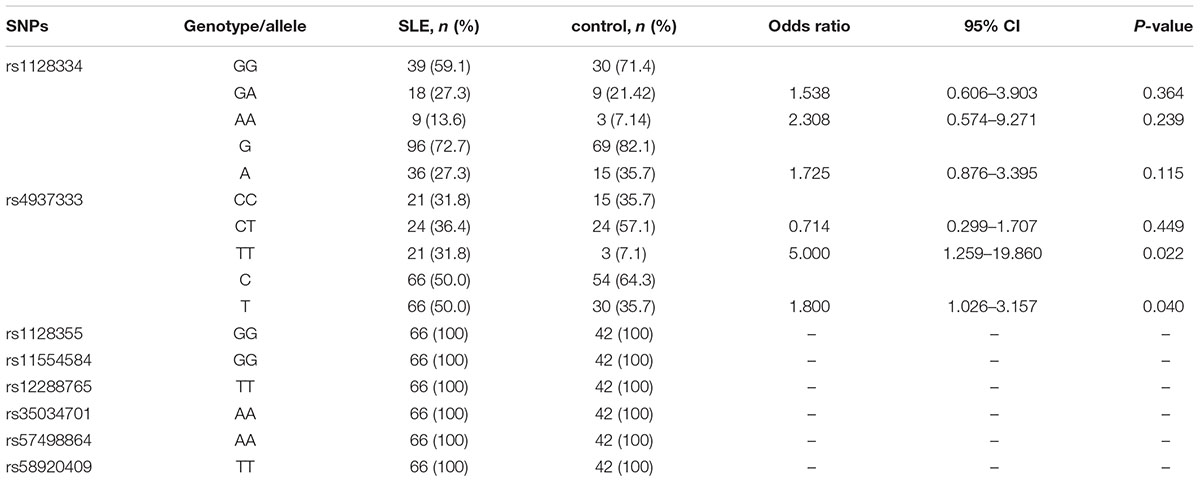
Table 1. Genotype and allele association analysis of SNPs in the ETS1 3′-UTR in the Kunming population.
mRNA Expression of ETS1 in PBMCs, CD4+ T Cells, and CD19+ B Cells
We examined the mRNA levels of ETS1 in PBMCs, CD19+ B cells, and CD4+ T cells from 66 SLE patients and 42 healthy controls. Relative ETS1 mRNA expression in PBMCs was lower in SLE patients than in controls (P = 0.011, Figure 2A). We also observed that ETS1 mRNA levels in CD19+ B cells from SLE patients were lower than those in CD19+ B cells from controls, but no difference in ETS1 expression in CD4+ T cells was found between the groups (Figures 2B,C).
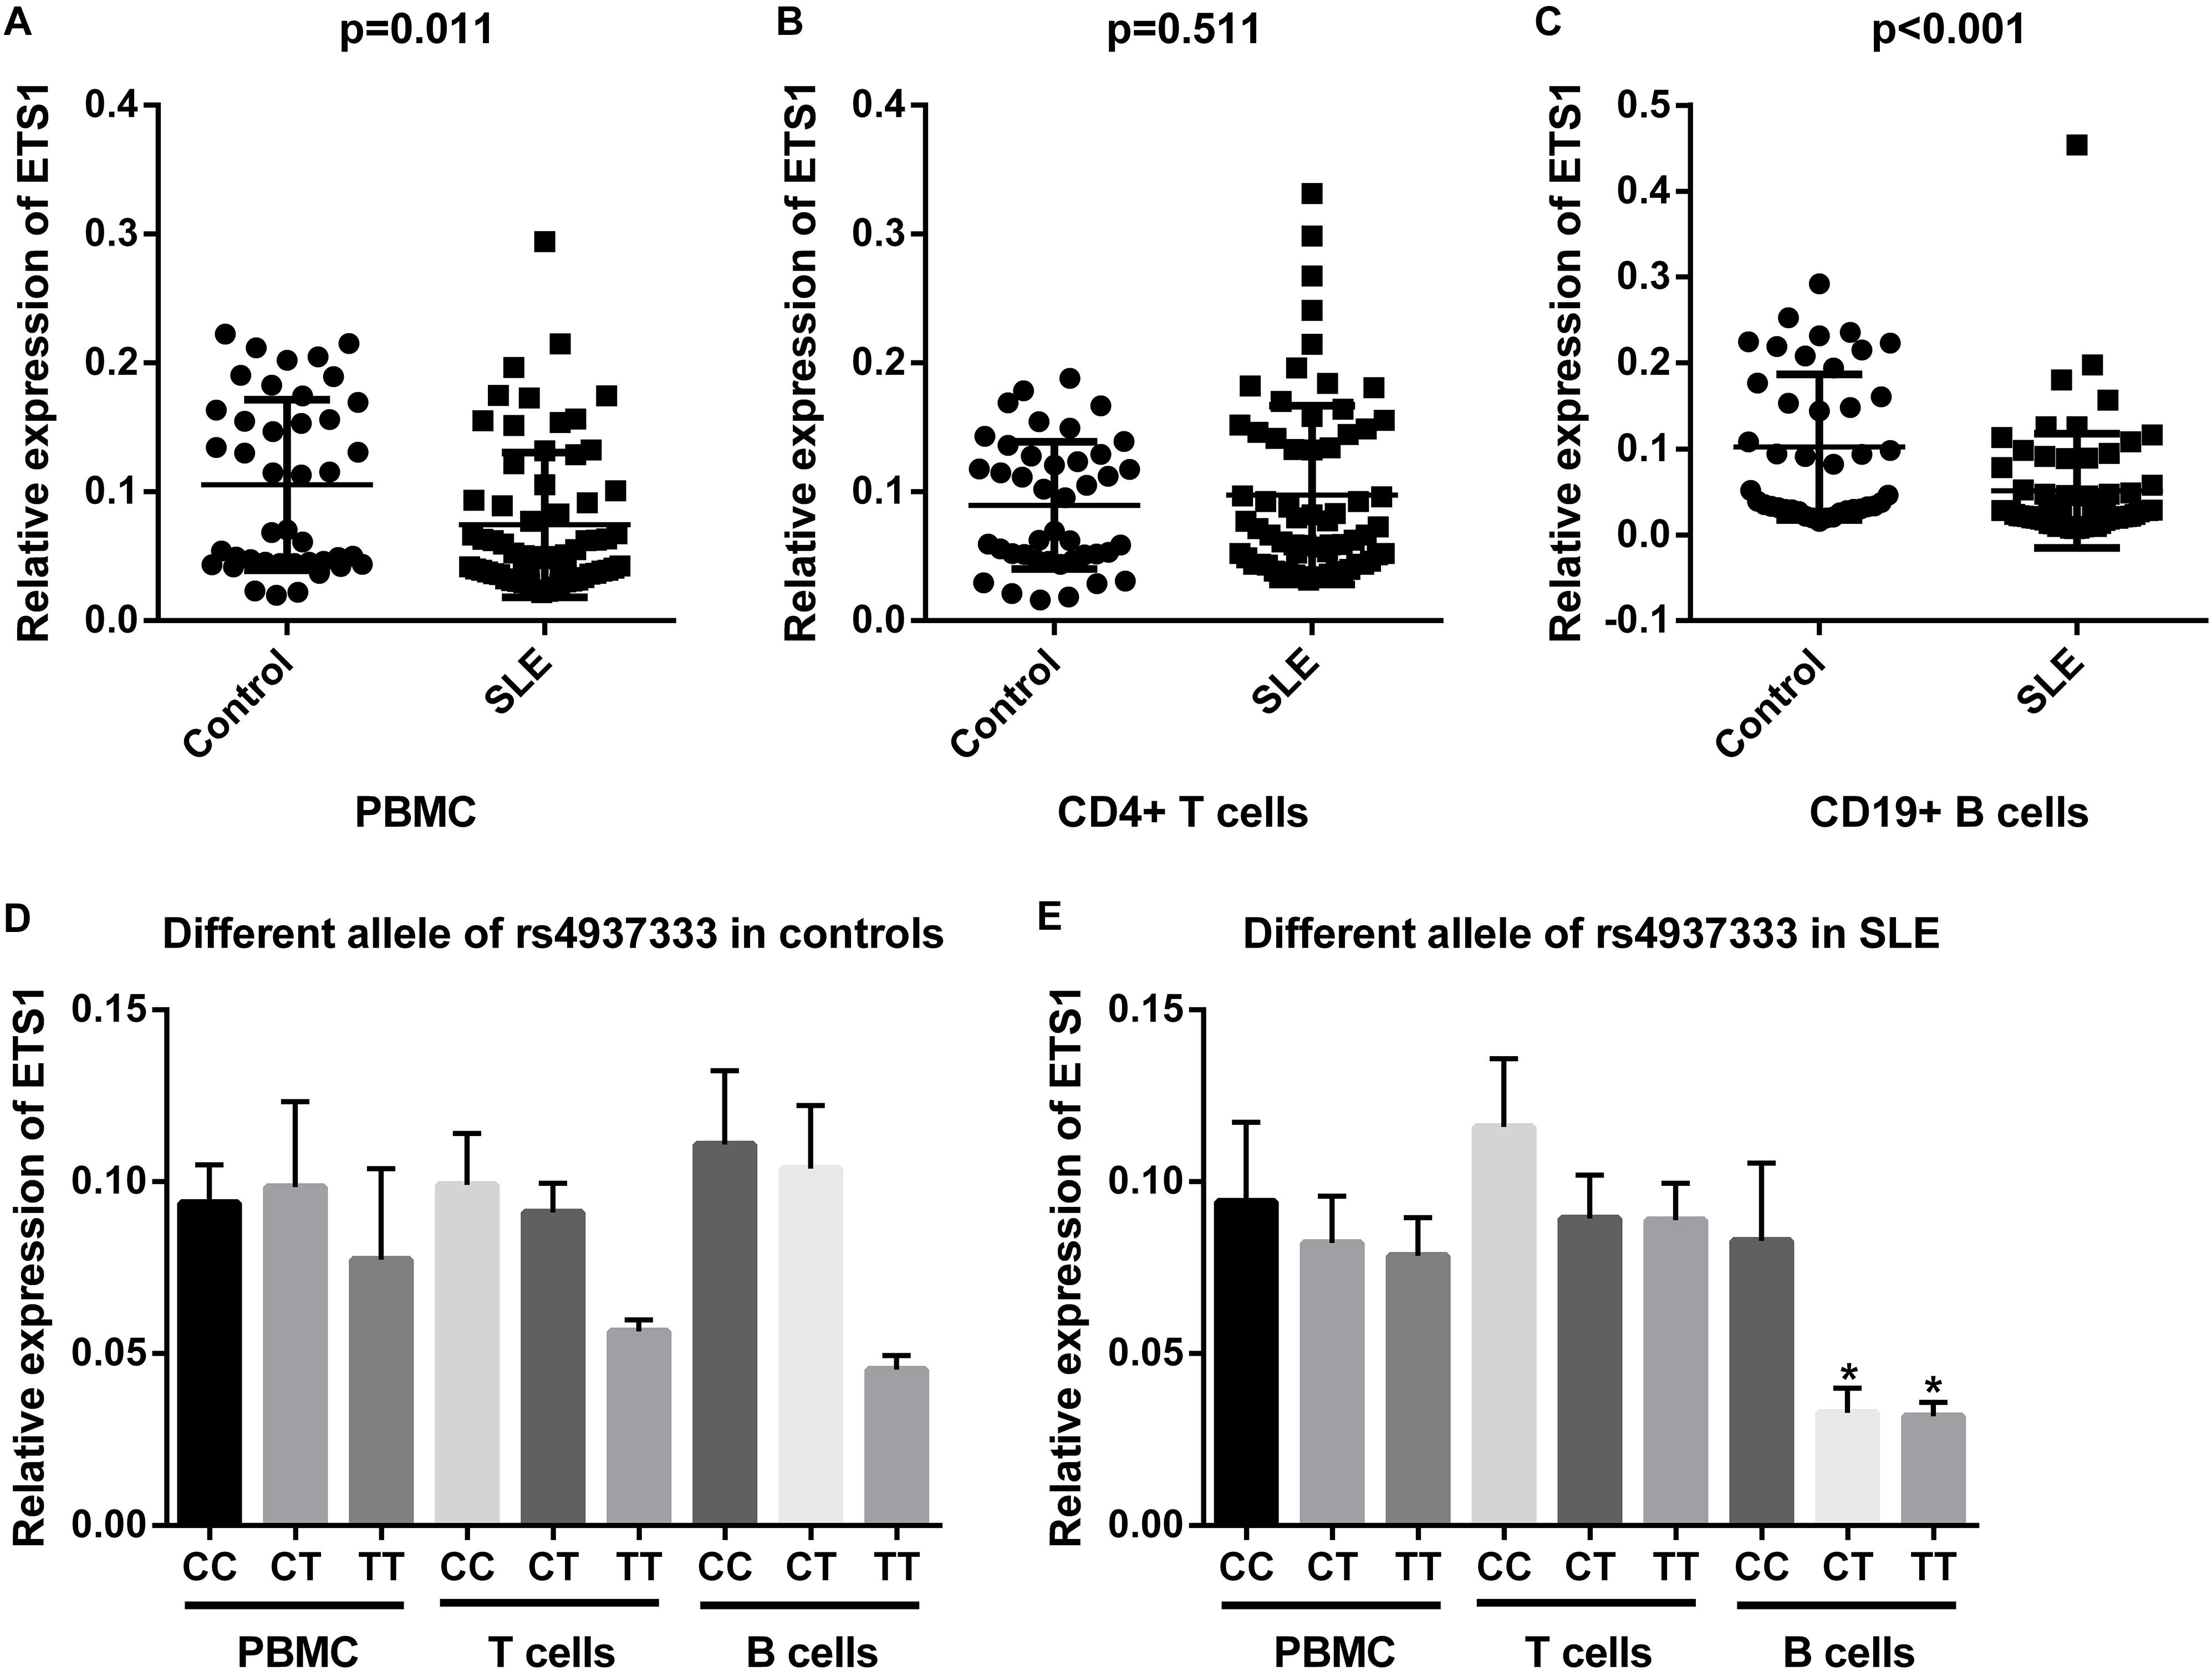
Figure 2. mRNA expression of ETS1 in (A) PBMCs, (B) CD4+ T cells, and (C) B cells from SLE patients and controls. rs4937333 allele-specific expression of ETS1 in PBMCs, B cells, and CD4+ T cells in (D) controls and (E) SLE patients. ∗P < 0.05 vs. the CC genotype in the same cells.
Next, we determined expression of ETS1 in SLE patients and controls with different rs4937333 alleles. In PBMCs from controls or SLE patients, no significant differences in ETS1 mRNA levels were found in any comparisons (Figure 2D). The association of ETS1 mRNA levels with SNPs was also analyzed in B cells and CD4+ T cells. In B cells from SLE patients, ETS1 mRNA levels were lower in patients with the TT (n = 21) or CT (n = 24) genotype than in CC (n = 21) homozygotes (Figure 2E). A similar trend was also observed in B cells from controls (Figure 2D). However, no significant associations were found in CD4+ T cells from controls or SLE patients. Thus, carriers of the risk allele T at rs4937333 may exhibit significantly lower ETS1 mRNA expression in B cells than do individuals with the C allele.
B Cells With the T Allele in the ETS1 3′-UTR Exhibit Enhanced Differentiation Into Plasma Cells
To investigate the effect of the SNP rs4937333 on expression of ETS1, we drove high-level constitutive expression of ETS1 using a lentiviral plasmid construct. As expected, cells harboring ETS1-C or ETS1-T exhibited substantially higher expression of ETS1 than did cells harboring the control virus (Figures 3A,B).
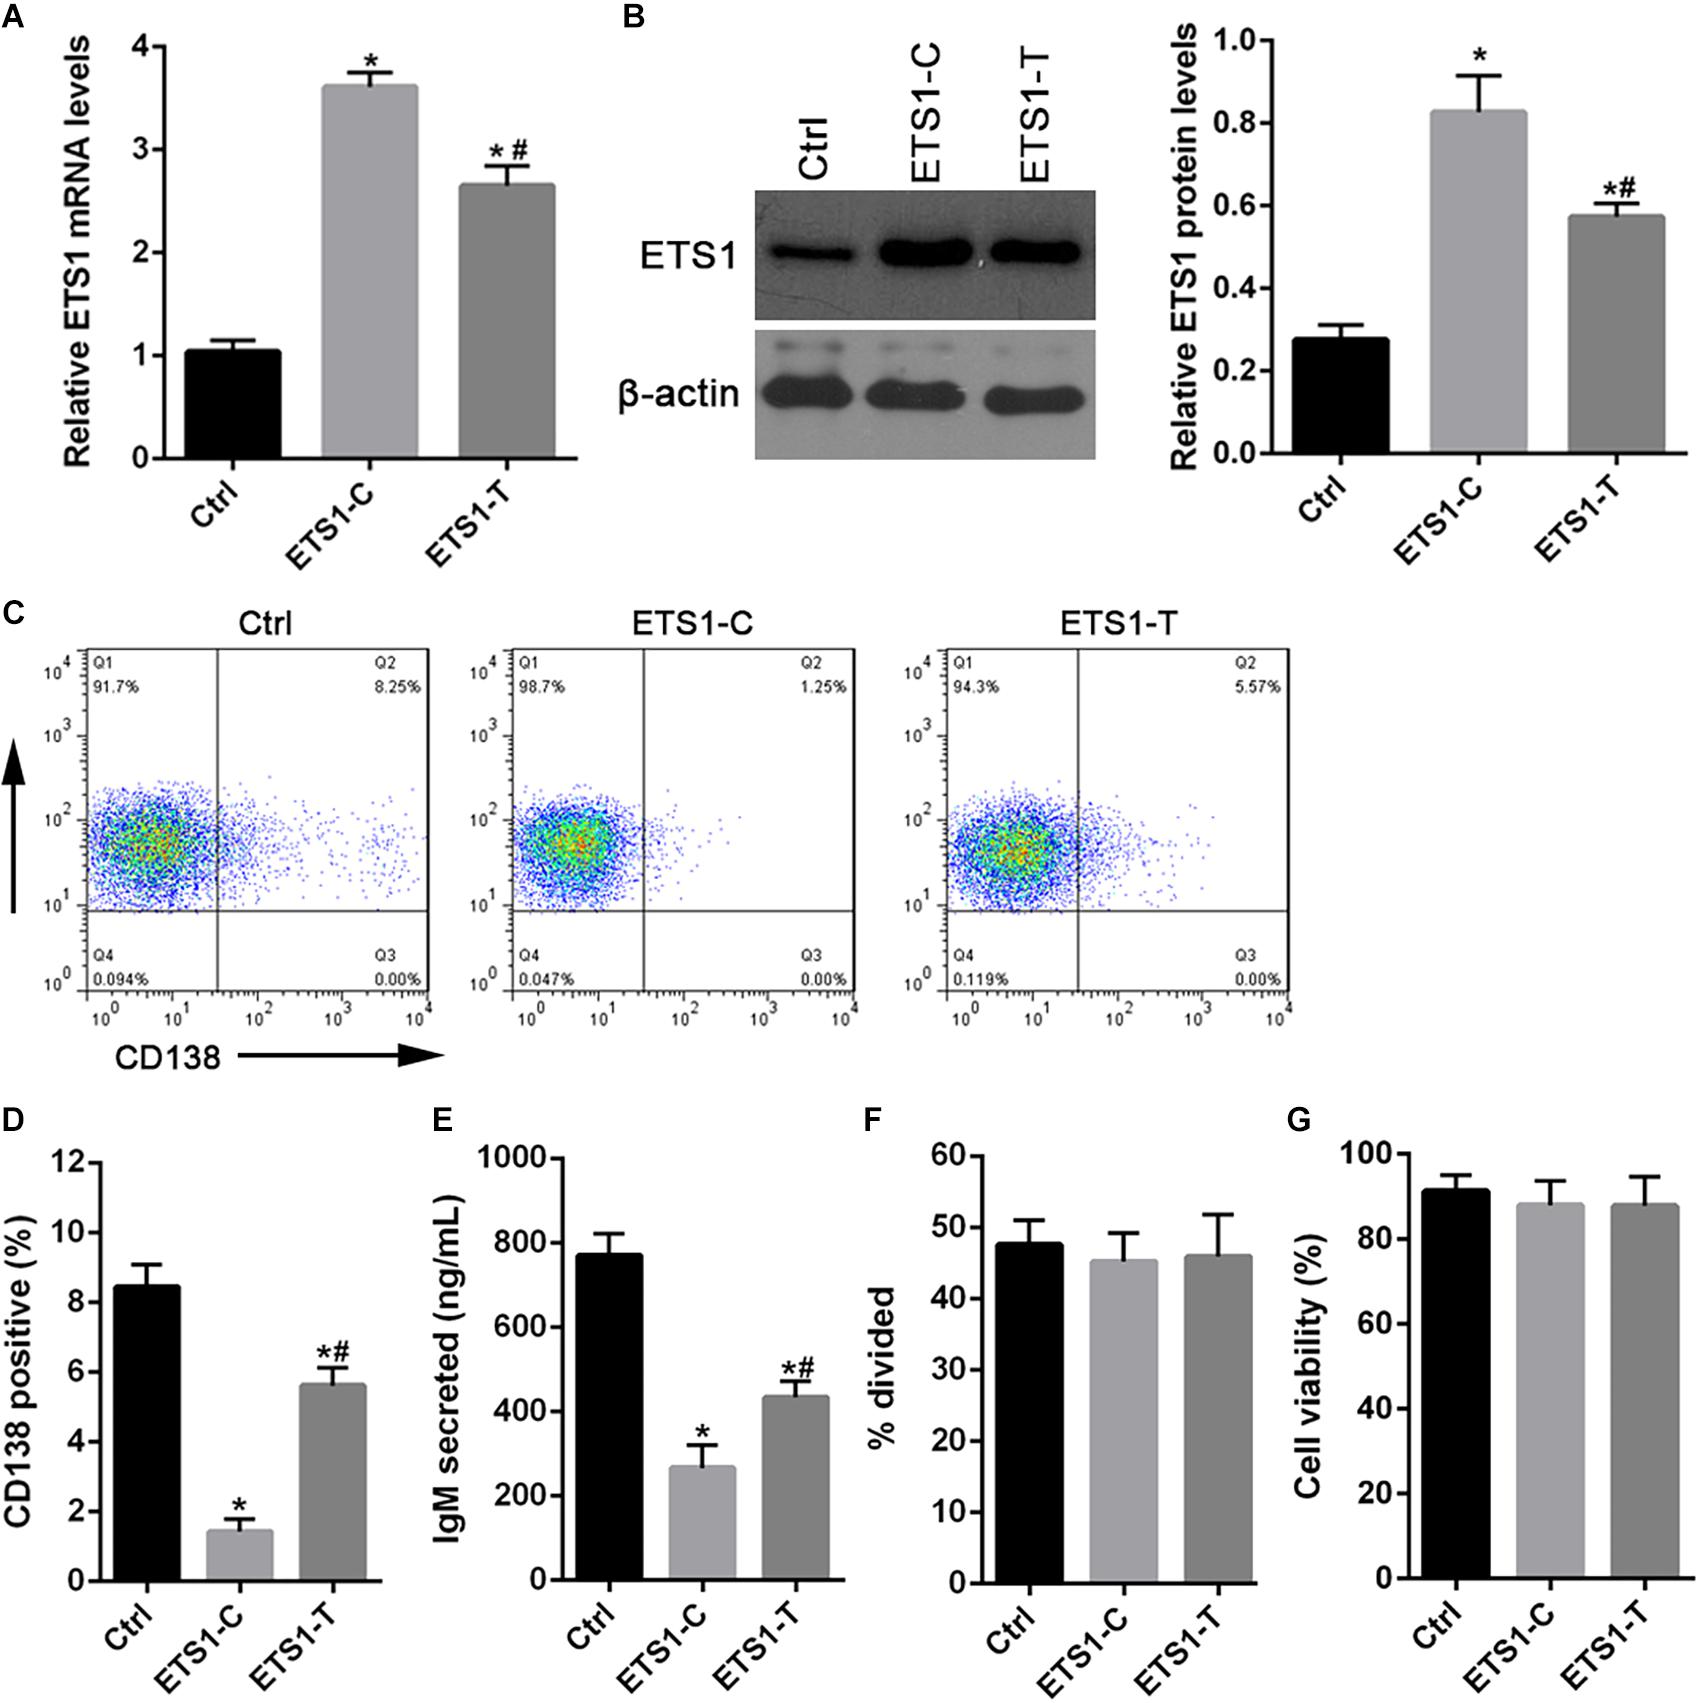
Figure 3. Forced expression of ETS1 in primary B cells inhibits plasmacytic differentiation. (A,B) Lentiviral constructs used for transduction experiments and Western blot analysis of ETS1 levels in lentivirally infected B cells. (C) Flow cytometry analysis of lentivirally infected primary B cells. B cells were stimulated with CpG ODN, infected with lentiviral constructs, and returned to culture in the presence of CpG ODN. (D) Two days later, the cells were stained with anti-CD138 antibody and analyzed by flow cytometry to quantify plasma cell differentiation. (E) ELISA was performed to assess IgM secretion after GFP+ cells were lentivirally infected and cultured in the presence of CpG ODN. (F) Proliferation of CpG ODN-stimulated, GFP+, sorted, virally infected B cells. (G) The numbers of live B cells. The data shown are the averages and SE from three independent experiments. ∗P < 0.05 vs. ctrl; #P < 0.05 vs. ETS1-C.
Then, we tested the effect of the SNP rs4937333 on B cell differentiation. After infection with ETS1-T lentivirus or ETS1-C lentivirus, B cells were cultured with CpG ODN for 48 h. Then, plasmacytic differentiation was assessed by staining for CD138 (Figure 3C). Cells infected with ETS1-C gave rise to four- to fivefold fewer CD138+GFP+ plasma cells than did those infected with ETS1-T (Figure 3D). Additionally, forced expression of high levels of ETS1 suppressed IgM secretion (Figure 3E).
Next, we tested whether B cell proliferation or survival was different between ETS1-T and ETS1-C B cells. The results shown in Figures 3F,G demonstrate that both proliferation and survival were identical between the genotypes.
The Allele of the SNP rs4937333 in the ETS1 3′-UTR Impacts miR-5003-Mediated Transcriptional Regulation of the ETS1 Gene
Three prediction tools (MirSNP, the PolymiRTS Database 3.0, and MicroSNiPer) showed that the SNP rs4937333 in the ETS1 3′-UTR is located in the seed region of the miR-5003-binding site (Figure 4A).
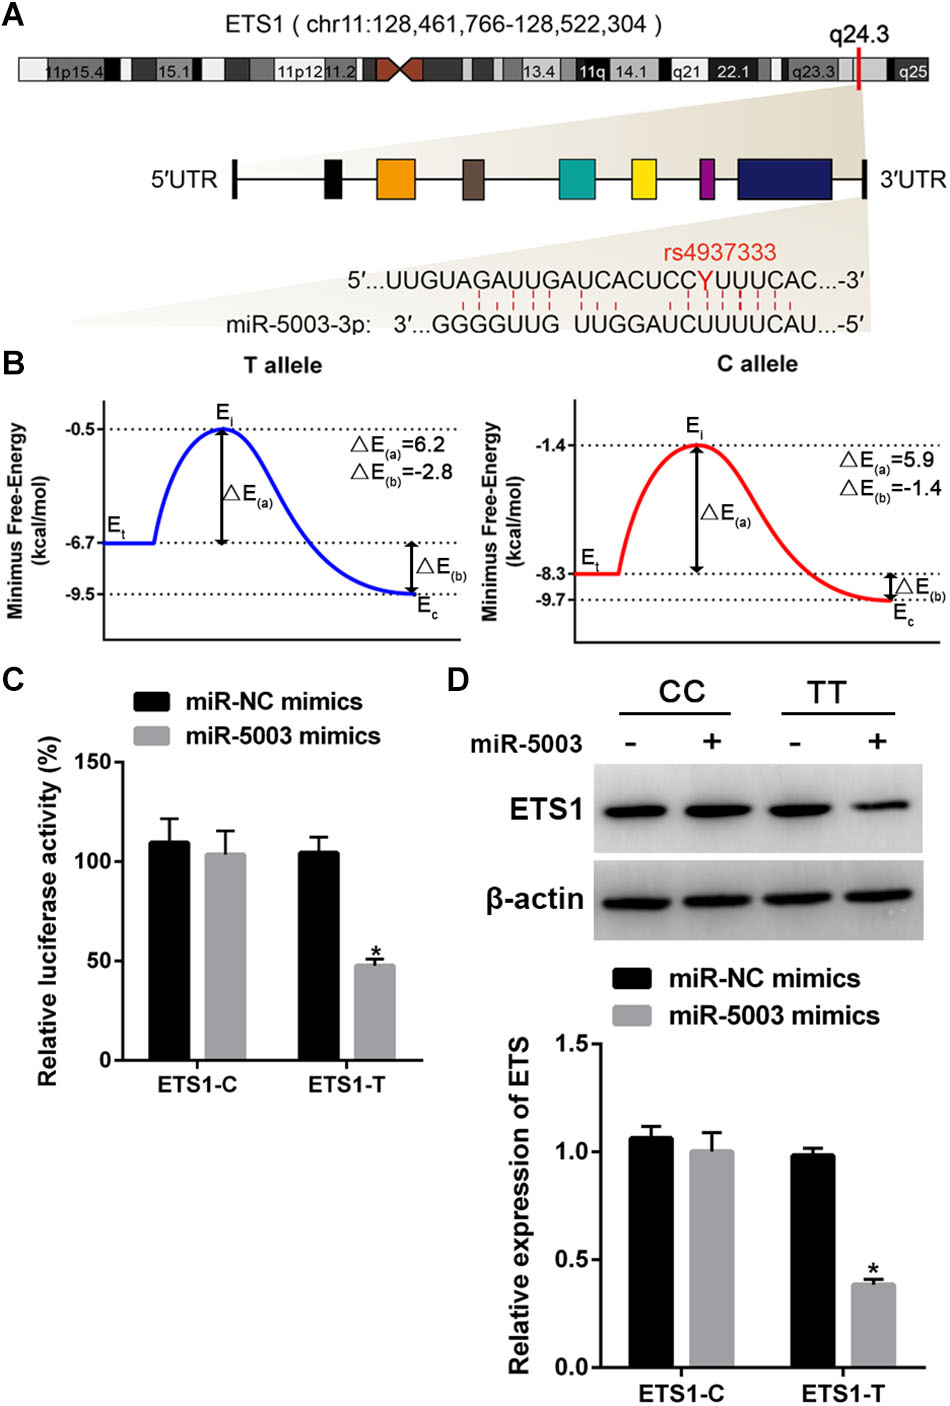
Figure 4. Functional validation of the miR-5003-binding site in the ETS1 3′-UTR and the influence of SNP rs4937333. (A) ETS1 gene structure and T/C polymorphism in the ETS1 3′-UTR at the miR-5003-binding site. chr, chromosome. (B) Binding energy diagram demonstrating the energy transformation of the process of miR-5003 binding to the ETS1 3′-UTR. Ei, Eintermediate; Et, Etarget; Ec, Ecomplex; ΔE(a) is the energy difference between the transition state and the original target, and the binding energy, ΔE(b), is the energy difference between the complex and the target. (C) The effect of the SNP rs4937333 on miR-5003-mediated transcriptional repression in 293T cells. Forty-eight hours after transfection with the reporter gene and miR-5003 mimic, cells with the T allele construct had significantly less relative luciferase activity than in cells with the reporter bearing the C allele. (D) The suppressive effect of miR-5003 on ETS1 gene expression was abolished by rs4937333 C in the ETS1 3′-UTR. ETS1-T or ETS1-C constructs were cotransfected into 293T cells with miR-5003 mimic or miR-NC. ETS1 expression in 293T cells was analyzed by Western blotting at 48 h after transfection. ∗P < 0.05 vs. miR-NC; n = 3.
To test whether the SNP rs4937333 could mediate differential regulation of ETS1 by miR-5003 due to differential binding affinity for the two ETS1 3′-UTR genotypes, we used a thermodynamic model to calculate the different energy parameters and then constructed corresponding binding energy diagrams for both 3′-UTR-T (the T allele) and 3′-UTR-C (the C allele) (Figure 4B). The higher energy of the dissociated target (Etarget) and smaller activation energy (ΔE(a)) of the T allele indicated that the T allele was more accessible to miR-5003 than was the C allele variant. The binding energy of the T allele (ΔE(b) = -2.8 kcal/mol) was much lower than that of the C allele (ΔE(b′) = -1.4 kcal/mol), suggesting that miR-5003 had a higher binding affinity for the T allele.
To further validate the results of computational modeling, a luciferase reporter assay was performed. We observed that the miR-5003 mimic significantly decreased luciferase activity in 293T cells transfected with ETS1-T but not ETS1-C (Figure 4C).
Additionally, we determined whether rs4937333 affects the expression of ETS1 in the 293T cell line. The results showed that the miR-5003 mimic markedly reduced ETS1 expression in ETS1-T-transfected cells but did not affect ETS1 expression in ETS1-C-transfected cells (Figure 4D).
These findings indicated that rs4937333 (C→T) could promote miR-5003 binding to ETS1, which may contribute to transcriptional repression of ETS1.
Elevated miR-5003 Levels in B Cells
We examined the potential miR-5003-mediated transcriptional regulation of the ETS1 gene in B cells with different alleles (the TT and CC genotypes), and the results showed that transfection with the miR-5003 mimic markedly suppressed endogenous ETS1 expression in B cells with the TT genotype in a concentration-dependent manner but did not affect expression of ETS1 in B cells with the CC genotype (Figures 5A,B).
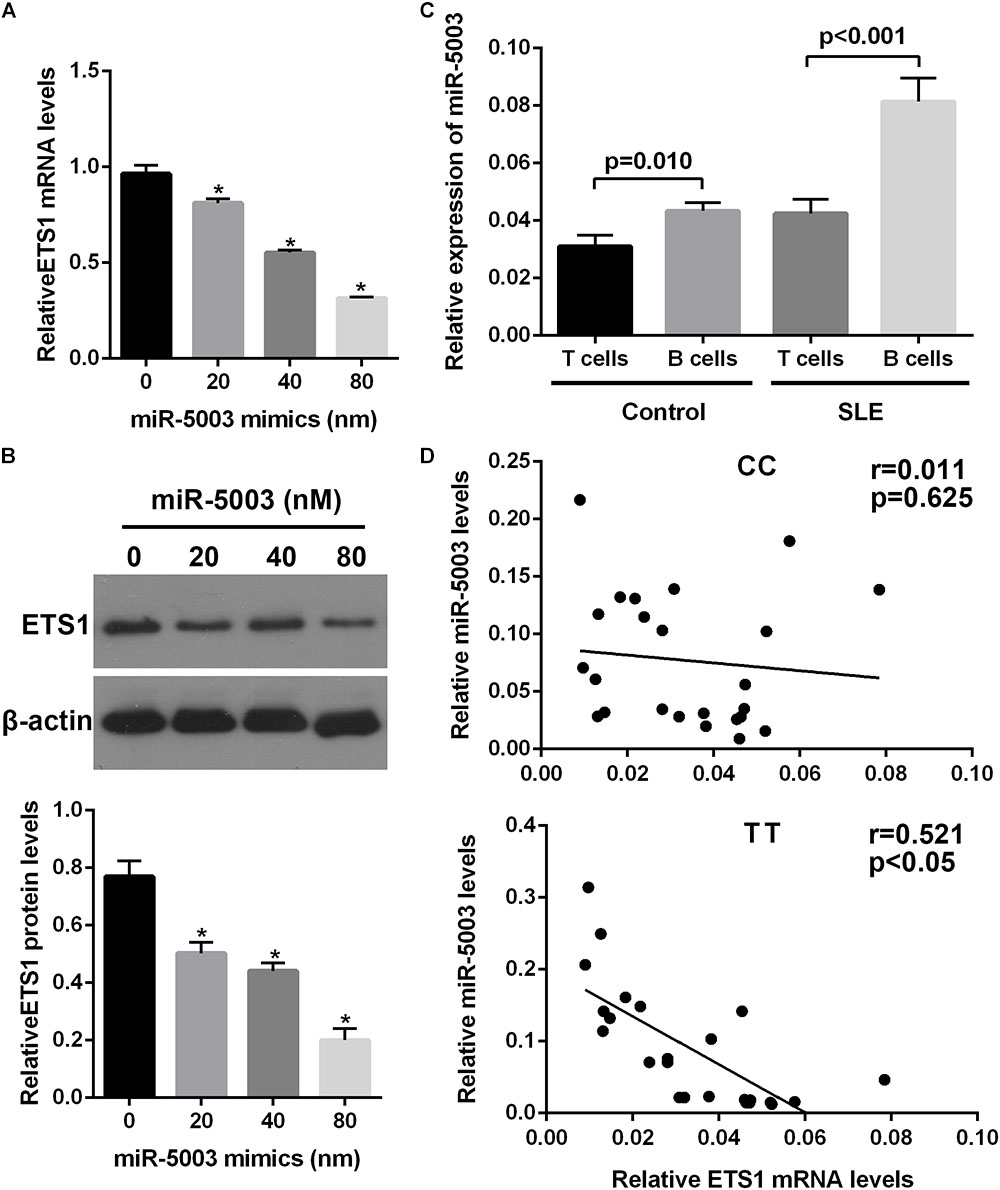
Figure 5. The effect of the variant allele on ETS1 and miR-5003-3p levels. (A) Real-time quantitative polymerase chain reaction (qPCR) analysis of relative ETS1 mRNA expression in primary B cells transfected with the miR-5003 mimic at the indicated concentrations. (B) Western blot analysis of endogenous ETS1 in primary B cells transfected with miR-5003-3p mimic at the indicated concentrations. (C) miR-5003 levels in B cells or T cells of SLE patients and controls. (D) Correlation analysis of miR-5003 levels and ETS1 mRNA levels in B cells from TT or CC carriers. ∗P < 0.05 vs. miR-NC; n = 3.
We also measured the levels of miR-5003 in T cells and B cells from control subjects or SLE patients using RT-qPCR and found that miR-5003 levels were higher in B cells from SLE patients than in B cells from control subjects. Moreover, miR-5003 levels were higher in B cells than in T cells in SLE patients but not in controls (Figure 5C). Furthermore, a significant negative correlation was observed between miR-5003 levels and ETS1 mRNA levels in the tested TT carriers (R2 = 0.255, P = 0.001; Figure 5D).
These findings suggested that the reduced levels of ETS1 associated with the variant allele may be associated with elevated miR-5003 levels.
Discussion
In the present study, we investigated the associations of SNPs in the 3′-UTR of ETS1 between SLE subjects and healthy controls. We also investigated the effect of SNPs on the expression level of ETS1 in T helper cells (CD4+ T cells) and B (CD19+) cells for the first time. We found that rs4937333 of ETS1 was associated with SLE. In addition, expression of ETS1 in individuals carrying the rs4937333 T allele was decreased, suggesting a functional explanation for the observed association.
Genetic variants in ETS1, including rs1128334, rs4937333, and rs6590330, are associated with SLE and other autoimmune diseases in the Asian population (Han et al., 2009; Yang et al., 2010), but these associations are less well replicated in the Asian population than in European populations (Wang et al., 2013; Morris et al., 2016). In previous studies, common variants of ETS1 have been found to be significantly associated with SLE in Chinese populations (Guo et al., 2013). In our study, rs4937333 of ETS1, but not rs1128334, was significantly associated with the risk of SLE in the Han population in the Kunming area. This discrepancy with respect to rs1128334 may be due to differences in sample sizes and ethnicity.
Several studies have found that ETS1 mRNA levels are lower in PBMCs from SLE patients than in PBMCs from healthy controls (Garrett-Sinha et al., 2016). Moreover, animal experiments have confirmed that knocking down or knocking out ETS1 results in lymphocyte abnormalities and loss of self-tolerance in the B cell compartment. (Russell et al., 2015). In our study, we indeed observed lower ETS1 expression in PBMCs from SLE patients than in PBMCs from controls. Additionally, ETS1 expression in B cells was significantly lower in SLE patients than in controls, but ETS1 expression in CD4+ T cells was not different between SLE patients and controls. To eliminate interference from treatment regimens on ETS1 expression, patients with SLE in the inactive period were selected, and the therapeutic regimens were consistent, with only a low-maintenance dosage of prednisone used within last 3 months. In addition, no evidence shows an effect of prednisone on ETS1 expression. Therefore, clinical treatment is not expected to affect the expression of the ETS1 gene in this study.
We further investigated whether the SNP site affected the expression of ETS1. However, no difference in ETS1 expression in PBMCs was observed between healthy individuals with the C allele and those with the T allele. A similar result was observed in SLE patients. We further examined the effects of the SNP on ETS1 mRNA levels in B cells and CD4+ T cells. Interestingly, ETS1 levels showed a decreasing trend in samples with the T allele, but a significant difference between the different genotypes was found only in B cells from SLE patients. Few studies have reported the relevance of SNPs to the expression patterns of ETS1. In the studies of Yang et al. (2010) and Shan et al. (2014), the A allele of rs1128334 was associated with decreased expression of ETS1.Wei et al. (2014) found that ETS1 expression in rs10893872 CC carriers was significantly higher than that in CT and TT individuals. Since the SNPs rs10893872 and rs4937333 have absolute LD with each other (Yang et al., 2010), expression of ETS1 with the T allele was reduced compared to that with the C allele. In our study, the results for rs4937333 are in accordance with those reported in the above studies. Because no association was found between rs1128334 and SLE, we did not investigate this allelic expression of ETS1.
In general, ETS1 functions to regulate B cell differentiation to plasma cell. Thus, the effect of the SNP on B cell differentiation was investigated. We observed that the differentiation of ETS1-C B cells into IgM-secreting cells was decreased in the presence of CpG ODN. ETS1 did not have a major impact on proliferation or survival, but alterations in CD138+ cell numbers and IgM secretion indicated that the SNP could affect B cell differentiation into plasma cells. John et al. (2008) found that purified splenic B cells isolated from ETS1-deficient mice exhibit greater terminal differentiation into IgM-secreting cells than those isolated from non-deficient mice, and that forced expression of ETS1 could block efficient differentiation into CD138 plasma cells and secretion of IgM.
Accumulating evidence has demonstrated that miRNAs can regulate target gene expression and affect mRNA translation into proteins through sequence-specific binding to the 3′-UTRs of target mRNAs (Ambros, 2004). The binding of miRNAs to target genes can be affected by SNPs residing in the miRNAs or in the target gene 3′-UTRs (Moszynska et al., 2017). Indeed, the effect of SNPs on binding affinity between miRNAs and target genes has been proposed to contribute to susceptibility to autoimmune diseases (Baulina et al., 2016). rs4937333 is located in the 3′-UTR of ETS1 and may affect expression of ETS1 via miRNA-binding activity. Therefore, we screened the miRNAs that bind to ETS1 at rs4937333. Three bioinformatics software programs showed that binding between miR-5003-3p and ETS1 was increased by the C to T mutation in rs4937333. Computational analysis revealed that the presence of a T allele in the ETS1 gene increased the binding affinity of miR-5003-3p to the target RNA. Thus, rs4937333 variants may enhance miR-5003 binding and suppress ETS1 gene expression as determined by a reporter assay.
Additionally, we demonstrated that miR-5003 effectively inhibited the mRNA and protein expression levels of ETS1-T and that this effect was dose-dependent in B cells. Since an effect of rs4937333 on ETS1 expression was observed in B cells from SLE patients but not in PBMC or CD4+ T cells, we hypothesized that miR-5003 was differentially expressed between B cells and T cells. As expected, the expression level of miR-5003 in B cells was significantly higher than that in T cells in both healthy subjects and SLE patients. Furthermore, a negative correlation between ETS1 mRNA levels and miR-5003 was observed in B cells. Therefore, high levels of miR-5003 were able to inhibit ETS1 expression more significantly with the enhanced binding to ETS1 mediated by the T allele. However, the effect of high miR-5003 expression in B cells still requires further study.
Unfortunately, there are some limitations taken into account in this research. The sample size for ETS1 expression and gene polymorphism detection is small, which may reduce the power of the study. And, we did not analyze the correlation between ETS1 and clinical data for the reason that SLE patients in the inactive phase were chosen, and the therapeutic regimen was consistent. Moreover, the association of autoimmune diseases and SNPs in ETS1 gene is inconsistent in the epidemiologic literature, besides we only measured the rs4937333 SNP that might be associated with SLE. More SNPs in the 3′-UTR of ETS1 genes and a larger sample should be conducted to confirm our observations in future research. In addition, positively selected T cells were only used for qPCR, rather than any functional analysis, assuming the mRNA level is insensitive to positive selection. Whether positive selection affects the ETS1 expression could be further examined in the following studies.
In summary, our data demonstrated that rs4937333 plays an important role in SLE susceptibility, modulating the epigenetic regulation of a critical SLE-related gene, ETS1, especially in B cells, rs4937333 impairs the binding of miR-5003-3p to ETS1 mRNA, which leads to enhanced differentiation of B cells into plasma cells. However, the impact of the ETS1 SNP on the development and function of SLE remains incompletely understood, and further exploration of the regulatory mechanism is warranted.
Ethics Statement
This study was carried out in accordance with the recommendations of “the ethical standards described in the 1964 Declaration of Helsinki, the Institutional Ethics Committee of Kunming Medical University”. All subjects gave written informed consent in accordance with the Declaration of Helsinki. The protocol was approved by the Ethics Committee of the Second Affiliated Hospital of Kunming Medical University. And the authorization number is Shen-PJ-2018-40.
Author Contributions
XL: study conception, design, and critical revision. RZ, BP, and YL: acquisition of data. BP: analysis. RZ: drafting of the manuscript. All authors were involved in the interpretation of the data.
Funding
This work was supported by the Applied Basic Research Foundation of Yunnan Province, China [Grant Number 2017FE468(-004)] and the National Natural Science Foundation of China (Grant Number 81360457).
Conflict of Interest Statement
The authors declare that the research was conducted in the absence of any commercial or financial relationships that could be construed as a potential conflict of interest.
Acknowledgments
We are grateful to the study participants for their involvement in this study.
Supplementary Material
The Supplementary Material for this article can be found online at: https://www.frontiersin.org/articles/10.3389/fgene.2019.00581/full#supplementary-material
References
Aab, A., Wirz, O., van de Veen, W., Sollner, S., Stanic, B., Ruckert, B., et al. (2017). Human rhinoviruses enter and induce proliferation of B lymphocytes. Allergy 72, 232–243. doi: 10.1111/all.12931
Armstrong, D. L., Zidovetzki, R., Alarcon-Riquelme, M. E., Tsao, B. P., Criswell, L. A., Kimberly, R. P., et al. (2014). GWAS identifies novel SLE susceptibility genes and explains the association of the HLA region. Genes Immun. 15, 347–354. doi: 10.1038/gene.2014.23
Baulina, N. M., Kulakova, O. G., and Favorova, O. O. (2016). MicroRNAs: the role in autoimmune inflammation. Acta Nat. 8, 21–33.
Bhattacharya, A., Ziebarth, J. D., and Cui, Y. (2013). PolymiRTS database 3.0: linking polymorphisms in microRNAs and their target sites with human diseases and biological pathways. Nucleic Acids Res. 42, D86–D91. doi: 10.1093/nar/gkt1028
Bruno, A. E., Li, L., Kalabus, J. L., Pan, Y., Yu, A., and Hu, Z. (2012). miRdSNP: a database of disease-associated SNPs and microRNA target sites on 3′UTRs of human genes. BMC Genomics 13:44. doi: 10.1186/1471-2164-13-44
Carter, E. E., Barr, S. G., and Clarke, A. E. (2016). The global burden of SLE: prevalence, health disparities and socioeconomic impact. Nat. Rev. Rheumatol. 12, 605–620. doi: 10.1038/nrrheum.2016.137
Catalanotto, C., Cogoni, C., and Zardo, G. (2016). MicroRNA in control of gene expression: an overview of nuclear functions. Int. J. Mol. Sci. 17:1712. doi: 10.3390/ijms17101712
Crampton, S. P., Morawski, P. A., and Bolland, S. (2014). Linking susceptibility genes and pathogenesis mechanisms using mouse models of systemic lupus erythematosus. Dis. Models Mech. 7, 1033–1046. doi: 10.1242/dmm.016451
Deng, Y., and Tsao, B. P. (2010). Genetic susceptibility to systemic lupus erythematosus in the genomic era. Nat. Rev. Rheumatol. 6, 683–692. doi: 10.1038/nrrheum.2010.176
Deng, Y., Zhao, J., Sakurai, D., Kaufman, K. M., Edberg, J. C., Kimberly, R. P., et al. (2013). MicroRNA-3148 modulates allelic expression of toll-like receptor 7 variant associated with systemic lupus erythematosus. PLoS Genet. 9:e1003336. doi: 10.1371/journal.pgen.1003336
Garrett-Sinha, L. A., Kearly, A., and Satterthwaite, A. B. (2016). The role of the transcription factor Ets1 in lupus and other autoimmune diseases. Crit. Rev. Immunol. 36, 485–510. doi: 10.1615/CritRevImmunol.2017020284
Gladman, D. D., Ibanez, D., and Urowitz, M. B. (2002). Systemic lupus erythematosus disease activity index 2000. J. Rheumatol. 29, 288–291.
Guo, X. F., Shan, S., Dang, J., Qiu, R. F., Zhao, H. L., Xin, Q., et al. (2013). [Association of two SNPs in 3′UTR of ETS1 gene with systemic lupus erythematosus in a northern Chinese Han population]. Zhonghua Yi Xue Yi Chuan Xue Za Zhi 30, 477–480. doi: 10.3760/cma.j.issn.1003-9406.2013.04.021
Han, J. W., Zheng, H. F., Cui, Y., Sun, L. D., Ye, D. Q., Hu, Z., et al. (2009). Genome-wide association study in a Chinese Han population identifies nine new susceptibility loci for systemic lupus erythematosus. Nat. Genet. 41, 1234–1237. doi: 10.1038/ng.472
Hikami, K., Kawasaki, A., Ito, I., Koga, M., Ito, S., Hayashi, T., et al. (2011). Association of a functional polymorphism in the 3′-untranslated region of SPI1 with systemic lupus erythematosus. Arthritis Rheum. 63, 755–763. doi: 10.1002/art.30188
Jacob, N., and Stohl, W. (2011). Cytokine disturbances in systemic lupus erythematosus. Arthritis Res. Ther. 13:228. doi: 10.1186/ar3349
John, S. A., Clements, J. L., Russell, L. M., and Garrett-Sinha, L. A. (2008). Ets-1 regulates plasma cell differentiation by interfering with the activity of the transcription factor Blimp-1. J. Biol. Chem. 283, 951–962. doi: 10.1074/jbc.M705262200
Lessard, C. J., Sajuthi, S., Zhao, J., Kim, K., Ice, J. A., Li, H., et al. (2016). Identification of a systemic lupus erythematosus risk locus spanning ATG16L2, FCHSD2, and P2RY2 in Koreans. Arthritis Rheumatol. 68, 1197–1209. doi: 10.1002/art.39548
Malkiel, S., Barlev, A. N., Atisha-Fregoso, Y., Suurmond, J., and Diamond, B. (2018). Plasma cell differentiation pathways in systemic lupus erythematosus. Front. Immunol. 9:427. doi: 10.3389/fimmu.2018.00427
Mohan, C., and Putterman, C. (2015). Genetics and pathogenesis of systemic lupus erythematosus and lupus nephritis. Nat. Rev. Nephrol. 11, 329–341. doi: 10.1038/nrneph.2015.33
Morris, D. L., Sheng, Y., Zhang, Y., Wang, Y. F., Zhu, Z., Tombleson, P., et al. (2016). Genome-wide association meta-analysis in Chinese and European individuals identifies ten new loci associated with systemic lupus erythematosus. Nat. Genet. 48, 940–946. doi: 10.1038/ng.3603
Moszynska, A., Gebert, M., Collawn, J. F., and Bartoszewski, R. (2017). SNPs in microRNA target sites and their potential role in human disease. Open Biol. 7:170019. doi: 10.1098/rsob.170019
Nashi, E., Wang, Y., and Diamond, B. (2010). The role of B cells in lupus pathogenesis. Int. J. Biochem. Cell Biol. 42, 543–550. doi: 10.1016/j.biocel.2009.10.011
Pan, H. F., Leng, R. X., Tao, J. H., Li, X. P., and Ye, D. Q. (2011). Ets-1: a new player in the pathogenesis of systemic lupus erythematosus? Lupus 20, 227–230. doi: 10.1177/0961203310389842
Petri, M., Orbai, A. M., Alarcon, G. S., Gordon, C., Merrill, J. T., Fortin, P. R., et al. (2012). Derivation and validation of the systemic lupus international collaborating clinics classification criteria for systemic lupus erythematosus. Arthritis Rheum. 64, 2677–2686. doi: 10.1002/art.34473
Russell, L., John, S., Cullen, J., Luo, W., Shlomchik, M. J., and Garrett-Sinha, L. A. (2015). Requirement for transcription factor Ets1 in B Cell Tolerance to Self-Antigens. J. Immunol. 195, 3574–3583. doi: 10.4049/jimmunol.1500776
Schickel, R., Boyerinas, B., Park, S., and Peter, M. J. O. (2008). MicroRNAs: key players in the immune system, differentiation, tumorigenesis and cell death. Oncogene 27:5959. doi: 10.1038/onc.2008.274
Schmittgen, T. D., and Livak, K. J. (2008). Analyzing real-time PCR data by the comparative C(T) method. Nat. Protoc. 3, 1101–1108. doi: 10.1038/nprot.2008.73
Shan, S., Dang, J., Li, J., Yang, Z., Zhao, H., Xin, Q., et al. (2014). ETS1 variants confer susceptibility to ankylosing spondylitis in Han Chinese. Arthritis Res. Ther. 16:R87. doi: 10.1186/ar4530
Wang, C., Ahlford, A., Jarvinen, T. M., Nordmark, G., Eloranta, M. L., Gunnarsson, I., et al. (2013). Genes identified in Asian SLE GWASs are also associated with SLE in caucasian populations. Eur. J. Hum. Genet. 21, 994–999. doi: 10.1038/ejhg.2012.277
Wang, D., John, S. A., Clements, J. L., Percy, D. H., Barton, K. P., and Garrett-Sinha, L. A. (2005). Ets-1 deficiency leads to altered B cell differentiation, hyperresponsiveness to TLR9 and autoimmune disease. Int. Immunol. 17, 1179–1191. doi: 10.1093/intimm/dxh295
Wei, L., Zhou, Q., Hou, S., Bai, L., Liu, Y., Qi, J., et al. (2014). MicroRNA-146a and Ets-1 gene polymorphisms are associated with pediatric uveitis. PLoS One 9:e91199. doi: 10.1371/journal.pone.0091199
Yang, W., Shen, N., Ye, D. Q., Liu, Q., Zhang, Y., Qian, X. X., et al. (2010). Genome-wide association study in Asian populations identifies variants in ETS1 and WDFY4 associated with systemic lupus erythematosus. PLoS Genet. 6:e1000841. doi: 10.1371/journal.pgen.1000841
Zhang, L., Liu, Y., Song, F., Zheng, H., Hu, L., Lu, H., et al. (2011). Functional SNP in the microRNA-367 binding site in the 3 UTR of the calcium channel ryanodine receptor gene 3 (RYR3) affects breast cancer risk and calcification. Proc. Natl. Acad. Sci. U.S.A. 108, 13653–13658. doi: 10.1073/pnas.1103360108
Keywords: systemic lupus erythematosus, ETS1, single-nucleotide polymorphism, B cell, miRNA, differentiation
Citation: Zhang R, Pan B, Li Y and Li X (2019) SNP rs4937333 in the miRNA-5003-Binding Site of the ETS1 3′-UTR Decreases ETS1 Expression. Front. Genet. 10:581. doi: 10.3389/fgene.2019.00581
Received: 02 February 2019; Accepted: 04 June 2019;
Published: 19 June 2019.
Edited by:
Andrew Landstrom, Duke University, United StatesReviewed by:
Muhammad Jawad Hassan, National University of Medical Sciences (NUMS), PakistanAya Kawasaki, University of Tsukuba, Japan
Jose Artur Chies, Federal University of Rio Grande do Sul, Brazil
Copyright © 2019 Zhang, Pan, Li and Li. This is an open-access article distributed under the terms of the Creative Commons Attribution License (CC BY). The use, distribution or reproduction in other forums is permitted, provided the original author(s) and the copyright owner(s) are credited and that the original publication in this journal is cited, in accordance with accepted academic practice. No use, distribution or reproduction is permitted which does not comply with these terms.
*Correspondence: Xiaolan Li, cHJvbGl4bEAxNjMuY29t