 Rachel Young1*
 Lucas Lefevre1
 Stephen J. Bush2
 Akshay Joshi1
 Salam Herojeet Singh3Santosh Kumar Jadhav4Velu Dhanikachalam4
 Zofia M. Lisowski1Daniela Iamartino5
 Kim M. Summers6
 John L. Williams7
 Alan L. Archibald1Suresh Gokhale4
 Satish Kumar3,8
 David A. Hume6*
- 1The Roslin Institute and Royal (Dick) School of Veterinary Studies, University of Edinburgh, Edinburgh, United Kingdom
- 2Nuffield Department of Clinical Medicine, University of Oxford, Oxford, United Kingdom
- 3Centre for Cellular and Molecular Biology, Hyderabad, India
- 4Central Research Station, BAIF Development Research Foundation, Pune, India
- 5ERBAFLOR, Research and Development, Peruzzo, Basaluzzo, Italy
- 6Mater Research Institute-University of Queensland, Translational Research Institute, Brisbane, QLD, Australia
- 7Davies Research Centre, School of Animal and Veterinary Sciences, University of Adelaide, Adelaide, SA, Australia
- 8School of Life Science, Central University of Haryana, Mahendergargh, India
The domestic water buffalo (Bubalus bubalis) makes a major contribution to the global agricultural economy in the form of milk, meat, hides, and draught power. The global water buffalo population is predominantly found in Asia, and per head of population more people depend upon the buffalo than on any other livestock species. Despite its agricultural importance, there are comparatively fewer genomic and transcriptomic resources available for buffalo than for other livestock species. We have generated a large-scale gene expression atlas covering multiple tissue and cell types from all major organ systems collected from three breeds of riverine water buffalo (Mediterranean, Pandharpuri and Bhadawari) and used the network analysis tool Graphia Professional to identify clusters of genes with similar expression profiles. Alongside similar data, we and others have generated for ruminants as part of the Functional Annotation of Animal Genomes Consortium; this comprehensive transcriptome supports functional annotation and comparative analysis of the water buffalo genome.
Introduction
The domestic water buffalo (Bubalus bubalis) has a world population of approximately 200 million1 distributed throughout 48 countries, making it the sixth most populous livestock species after chickens, cattle, sheep, goats, and pigs. Asia accounts for 97% of buffalo production with the largest population in India (>100 million). The water buffalo contributes significantly to global milk production, being the main milk-producing animal in India and Pakistan, as well as providing meat, hides and draught power. There are two subspecies of water buffalo, the river buffalo and swamp buffalo, which are found in separate geographical locations (Cockrill, 1981). River buffalo are widely distributed in the Indian subcontinent, the Middle East, Europe, and North Africa, whereas swamp buffalo are located in Northeast India, Bangladesh, China, and Southeast Asia. Analysis of molecular markers in river and swamp buffalo populations indicates that the subspecies were independently domesticated (Kumar et al., 2007; Lei et al., 2007; Colli et al., 2018). River buffalo have been selected for milk production. The Mediterranean breed of river buffalo produces around 2,000 kg of milk per lactation which is used in the production of dairy products such as buffalo mozzarella. Swamp buffalo have traditionally been used as draught animals, but in China and the Philippines, efforts have been made to improve dairy production by breeding them to river buffalo (Yang et al., 2013).
A draft water buffalo genome was released in 2013 and published in 2017 (Williams et al., 2017), assembled from a female Mediterranean (river) water buffalo. A new highly contiguous assembly for the river buffalo has recently been generated using long-read sequencing and other technologies (Low et al., 2019). There is no published genome sequence available for the swamp buffalo. A transcriptome of the Chinese swamp buffalo (Deng et al., 2016) was generated based upon RNA from 11 tissues collected from two Chinese swamp buffaloes (one male, one female). However, as the RNA from all tissues was pooled into a single RNA sequencing (RNA-Seq) library, this dataset provides no insight into tissue-specific expression.
Next-generation sequencing technologies allow us to generate genome-scale transcription maps providing information on both the structure and level of expression of a gene (Wang et al., 2009). The analysis of RNA-Seq data can benefit from, but is not limited by, existing knowledge of the genome, and is well suited to non-model species that lack high-quality reference genomes. RNA-Seq can be used to quantify the abundance of transcripts and identify the precise location of transcript boundaries to single base-pair resolution, depending on the technology used for library generation. Short-read sequencing technology is high-throughput and relatively cheap, and so suits the generation of a transcriptional atlas from a large-scale compendium of tissues and cell types from a given species. We previously established a transcriptional atlas for sheep (Clark et al., 2017) using this approach. We also devised a method to merge published RNA-Seq datasets from different laboratories to create an expression atlas for the chicken (Bush et al., 2018).
In the present study, we have constructed a comprehensive atlas of gene expression encompassing 220 tissue and cell samples collected from 10 river buffaloes of three different breeds (Mediterranean, Pandharpuri, and Bhadawari). We generated over 21 billion raw sequence reads which mapped to 18,730 unique genes. The dataset was used to support annotation of transcribed sequences in the new buffalo genome assembly (Low et al., 2019). Here, we use the data to analyze the patterns of expression of individual genes. These data will support functional annotation and interpretation of coding and non-coding variants associated with economically important traits and also allow comparative analysis with other ruminant and non-ruminant species.
Materials and Methods
Ethics Statement
Ethics approval was obtained from The Roslin Institute’s and the University of Edinburgh’s Protocols and Ethics Committees. All animal work was carried out under the regulations of the Animals (Scientific Procedures) Act 1986.
Sample Collection and RNA Isolation
All animals used in this study were healthy. Samples were collected from six Mediterranean water buffaloes and four Indian water buffaloes (Pandharpuri and Bhadawari breeds). Tissues from the major organ systems were dissected into small pieces (100 mg) and collected into RNAlater® or snap frozen in liquid nitrogen. Bone marrow, alveolar lavage, and peripheral blood mononuclear cells (PBMCs) were collected and cryopreserved at −155°C for subsequent culture and RNA extraction. Viable cell counts were performed using Trypan blue (Gibco). All cell viabilities were >90%. Bone marrow was flushed from the posterior ribs with RPMI-1640 containing 5 mM EDTA, filtered through a 100-µm cell strainer (Corning) then pelleted by centrifugation (400 × g for 5 min). Red blood cells were removed by lysis for 5 min at room temperature in RBC lysis buffer (BioLegend) then washed in phosphate buffered saline (PBS). Alveolar lavage was performed by removing the lungs and trachea, then flushing the lungs with PBS through an endotracheal tube. The lavage was then filtered through a 100-µm cell strainer (Corning) then pelleted by centrifugation (400 × g for 10 min). Alveolar macrophages were isolated from alveolar lavages by culturing them overnight in complete medium [RPMI-1640, 20% heat-inactivated fetal calf serum (FCS) (GE Healthcare), penicillin/streptomycin (Invitrogen), and GlutaMAX Supplement (Invitrogen)] supplemented with 104 U/ml rhCSF1 at 106 cells/ml in six-well plates. The following day, non-adherent cells were removed with the media, and remaining alveolar macrophages were collected in TRIzol (Ambion). PBMCs were isolated from whole blood by centrifuging at 1,200 × g for 15 min (no brake) to obtain buffy coats. The buffy coat was then diluted in an equal volume of PBS + 2% FCS then layered over Lymphoprep (Axis-Shield) and centrifuged at 1,200 × g for 25 min (no brake). The mononuclear cell fraction was collected and washed in PBS, then red blood cells removed by lysis as detailed above. Bone marrow-derived macrophages (BMDMs) and monocyte-derived macrophages (MDMs) were obtained by culturing bone marrow cells or PBMCs, respectively, at 106 cells/ml on sterile bacteriological plastic in the presence of recombinant human colony-stimulating factor (rhCSF1; 104 U/ml; gift from Chiron, Emeryville, CA) for 10–11 days. To capture inducible innate immune effector genes, BMDMs were stimulated with 100 ng/ml lipopolysaccharide (LPS) derived from Salmonella enterica serotype Minnesota (as described in Kapetanovic et al., 2012) and RNA extracted at 0 and 7 h.
Total RNA was isolated from 220 tissue and cell samples (Supplementary Table 1). RNA extractions were carried out in two laboratories (UK and India) using different extraction methods. For the Mediterranean buffalo samples, RNA was extracted using the TRIzol (Ambion) method and purified on RNeasy Mini Columns (Qiagen). Tissues were homogenized and lysed in 1 ml of TRIzol reagent using the Precellys 24 tissue homogenizing system with lysing kit CKM or CK14 depending on the tissue type, following the manufacturer’s instructions. For the Indian buffalo samples, RNA was extracted using RNAiso Plus reagent (Takara) and purified on RNeasy mini columns. Tissues were homogenized in 1 ml RNAiso Plus using a handheld homogenizer. Tissue lysates were incubated at room temperature for 5 min to allow for complete dissociation of the nucleoprotein complex. Tissues homogenized in RNAiso Plus were centrifuged at 12,000 × g for 5 min at 4°C; then, supernatants transferred to a new tube. The remaining steps were identical for both RNA extraction methods. Chloroform was added to the tissue lysate (200 µl), and tubes were shaken vigorously for 15 s then incubated for 5 min at room temperature. Samples were centrifuged for 15 min at 12,000 × g at 4°C; then, the aqueous layer containing RNA was collected and purified on RNeasy mini columns. An on-column DNase treatment was performed as per the manufacturer’s instructions. RNA concentration was measured using Qubit RNA BR Assay Kit (Thermo Fisher) and quality controlled by TapeStation using the RNA ScreenTape Kit (Agilent) to calculate the RNA integrity number (RIN). The samples taken forward for sequencing had an average RIN of 8 (minimum 6.5) and a 260/280 ratio of 2.
Library Preparation and Sequencing
Illumina TruSeq Stranded Total and mRNA libraries were generated and sequenced by Edinburgh Genomics using the Illumina TruSeq Stranded library protocols for total RNA library preparation (part: 15031048, revision E) and mRNA library preparation (part: 15031047, revision E). Briefly, ribosomal RNA (rRNA) was depleted from samples for total RNA-Seq, using biotinylated, target-specific oligonucleotides with Ribo-Zero rRNA removal beads. Following purification, the RNA was fragmented and first-strand cDNA synthesis performed. The RNA template was then removed, and a replacement strand was synthesized incorporating dUTP in place of dTTP to generate double-stranded (ds) cDNA. The incorporation of dUTP quenches the second strand during the subsequent PCR amplification step as the polymerase will not incorporate past this nucleotide. The ds cDNA was purified; then, the 3’ ends adenylated, and indexing adapters ligated to both ends before PCR enrichment of the library. For the TruSeq Stranded mRNA libraries, poly-A-containing mRNA was purified from total RNA using poly-T oligos attached to magnetic beads. From this point, the mRNA library protocol did not differ from the protocol for total RNA library preparation. The libraries were quality controlled using an Agilent Bioanalyzer DNA 1000 Chip and quantified by qPCR before hybridization onto a flow cell. TruSeq Stranded total RNA-Seq and mRNA-Seq libraries were sequenced using an Illumina HiSeq 2500 sequencer at depths of >100 million and >25 million 125-bp paired-end reads per sample, respectively.
Expression-Level Quantification
The sequence data for the buffalo atlas were processed using two different methods, one alignment-free and one alignment-based, as described in Clark et al. (2017). All expression-level estimates for the atlas, expressed as transcripts per million (TPM), were obtained using the high-speed transcript quantification tool Kallisto (Bray et al., 2016), which is an alignment-free method. Kallisto creates an index of k-mers from a set of reference transcripts and then uses the k-mers of each read to “pseudoalign” each read to this index. This method assigns reads to their transcript of origin without the time-consuming step of base-level alignment. Expression levels are then estimated, per transcript, as a function of the assigned reads, with transcript-level estimates summarized to the gene-level. The accuracy of Kallisto’s estimates therefore depends on the quality of the reference transcripts, and by extension, the k-mers derived from them. As the water buffalo genome at the time of creating the index had a comparatively fragmented assembly and an incomplete transcriptomic catalogue, we used an additional, alignment-based method to identify transcript models not initially available for use by Kallisto. This second method, employing the HISAT aligner (Kim et al., 2015) and StringTie assembler (Pertea et al., 2015), was used to identify novel gene and transcript models, both protein-coding and non-coding (described below).
Using both methods together, we progressively revised the Kallisto index and updated expression-level estimates accordingly. This iterative “multi-pass” approach to Kallisto has been described previously (Clark et al., 2017) and used to create comparable gene-level expression estimates from the otherwise distinct mRNA-Seq and total RNA-Seq libraries for the sheep expression atlas (Clark et al., 2017).
For the “first pass,” we ran Kallisto on all samples, using as its index the complete set of 45,402 predicted transcripts for the draft B. bubalis assembly UMD_CASPUR_WB_2.0 (ftp://ftp.ncbi.nlm.nih.gov/genomes/all/GCF/000/471/725/GCF_000471725.1_UMD_CASPUR_WB_2.0/GCF_000471725.1_UMD_CASPUR_WB_2.0_rna.fna.gz, downloaded 22nd April 2016). To aid in the presentation of findings, standardized placeholder IDs were—if unavailable—assigned to each gene, transcript, and exon model. These IDs are assigned arbitrarily and are of the form geneX, rnaY, and exonZ, respectively, where X, Y, and Z are numeric. IDs are available via the University of Edinburgh DataShare portal (http://dx.doi.org/10.7488/ds/2292).
We then parsed these “first pass” data, which comprised of approximately 22 billion pseudoalignments (Supplementary Table 2), capturing 94% of the known (UMD_CASPUR_WB_2.0) genes (Supplementary Table 3), to revise the Kallisto index. This revision was undertaken in order to include, in the second index, those transcripts that had been erroneously omitted (i.e., where the reference annotation was incomplete), and to exclude those transcripts that had been erroneously included (i.e., spurious models due to the comparatively poor assembly). For the first criterion, we obtained the subset of reads that Kallisto did not align and assembled these de novo into putative transcripts. Transcripts were retained only if they showed coding potential (using the online tool CPAT v1.2.2; Wang et al., 2013) and encoded a protein similar to one of known function (Supplementary Table 4). This annotation process is more fully detailed in (Clark et al., 2017). After the “first pass,” we also identified and discarded those members of the reference transcriptome for which TPM was 0 in all samples. Two thousand three hundred and three transcripts were also removed from the original index because they were low-quality predictions: the RefSeq transcript required modification relative to its underlying genome sequence to create a complete CDS. Kallisto was then re-run on all samples using this revised index.
This “two pass” method was previously used to create an expression atlas for the domestic sheep (Clark et al., 2017). We also reconstructed novel transcript models for the buffalo using an alignment-based approach to process RNA-Seq data which combined the HISAT aligner with the StringTie assembler. The new transcript models created (732 protein-coding transcripts, representing 631 genes, plus 6,756 lncRNAs) were then integrated with the “second pass” Kallisto index to create a “third pass” index, with expression quantification repeated as above. Transcript models were retained only if they could be robustly annotated, using the criteria described in Clark et al. (2017) for protein-coding genes, and the criteria described in Bush et al. (2018) for lncRNAs.
The StringTie assembly is accurate with respect to the draft annotation, reconstructing all existing exon models and 82% of the transcript models (Supplementary Table 5). None of the gene models are precisely reconstructed because the existing draft annotation considers “gene start” and “gene end” coordinates to be the start of the first, and end of the last, CDS, respectively, irrespective of 5’ and 3’ untranslated regions (UTRs).
In the transcriptome assembly created here, thousands of new transcript models are predicted, although in the absence of experimental verification, it is not easy to determine which are plausible, as opposed to stochastic noise in RNA processing or assembly artifacts. A large number of false positive transcripts are expected as the assembly integrates both mRNA-Seq and total RNA-Seq datasets. The latter measures nascent (ongoing) transcription (Ameur et al., 2011) and consequently has a larger proportion of retained introns arising from incompletely spliced pre-mature (nuclear) mRNA (Zhang et al., 2015), which can lead to transcript assembly artifacts.
Novel transcript models were retained only if they could be robustly annotated as protein-coding. To do so, the longest ORF in each exon of its set of exon models was identified. To include this transcript in the “third pass” index, we required that a) for every exon, the longest ORF is on the same strand; b) the last ORF terminates in a stop codon, rather than simply because the ORF remains open until the end of the exon; c) although the ORF of every internal exon does not have to span the entire exon length (because there may be noise in the placement of the exon/intron boundary), no internal ORF contains a stop codon (i.e., the ORF must end when the exon does); and d) the peptide, concatenated from the set of translated ORFs, is ≥50 amino acids in length. These peptides were then aligned against the NCBI non-redundant (nr) peptide database v77 (Pruitt et al., 2005) using blastp with a scoring threshold of p ≤ 1e-25 (Altschul et al., 1997).
Conservative criteria were applied to parse these alignments. For a novel transcript model to be retained, ≥ 5 alignments were required, at least one of which is to a gene model from a ruminant genus [Bison (bison), Bos (cow, yak), Camelus (camel), Capra (goat), Ovis (sheep, mouflon), Pantholops (antelope), or Vicugna (alpaca) sources are listed in Supplementary Table 6]. Each alignment had to a) have a % identity within the aligned region of ≥90%, b) have an alignment length ≥ 90% of the length of the query protein, c) have an alignment length ≥ 50 amino acids, d) have no gaps, and e) not be a protein labeled “low quality,” “hypothetical,” “unnamed,” “uncharacterized” or “putative,” or otherwise have only a third-party annotation (as these can be by inference, not experiment). The set of novel transcript models derived from the StringTie assembly, after applying these filter criteria, is summarized in Supplementary Table 7. Their expression across the atlas is detailed in Supplementary Table 10, and the number of tissues with detectable expression (TPM > 1) quantified in column H “Expression summary” A GTF file containing the new gene models is available for download through the University of Edinburgh DataShare portal (http://hdl.handle.net/10283/3356).
Using this “third pass” index, on average 60–70% of the known buffalo (UMD_CASPUR_WB_2.0) protein-coding genes were detectably expressed (average TPM, across all replicates, >1) in all tissues (Supplementary Table 8).
Data Downloaded From Public Repositories
To supplement the data generated herein, we integrated additional buffalo transcriptome data from the European Nucleotide Archive (ENA) under accession number PRJEB4351. These data were generated to provide reference RNA-Seq data as part of the International Water Buffalo Genome Project (Williams et al., 2017). The data comprise 30 tissues collected from a male and a female Mediterranean buffalo. Details of the tissue samples included from this project are provided in Supplementary Table 9.
Network Analysis
Expression data were represented as average transcripts per million (TPM) per gene per tissue. To visualize the data, we used the network analysis tool Graphia Professional2 (formerly Miru, derived from BioLayout Express 3D; Freeman et al., 2007; Theocharidis et al., 2009) to create a gene-to-gene pairwise Pearson correlation matrix across all samples. To remove noise, we restricted analysis to those genes with average TPM >10 in at least one tissue. Retaining only correlations of r ≥ 0.80, a gene-to-gene network graph was constructed connecting 15,752 nodes (genes) with 1,851,403 edges (correlations between nodes). The Markov cluster algorithm (MCL) (van Dongen and Abreu-Goodger, 2012) was used with an inflation value (which determines cluster granularity) of 2.2 to identify clusters of co-expressed genes. Clusters are numbered according to their relative size, the largest cluster being cluster 1, and so on. The contents of the largest 50 clusters and gene expression compared to that of other species using BioGPS3 were examined (Wu et al., 2009; Wu et al., 2013; Wu et al., 2016). Clusters were characterized by their tissue-specificity or biological process. In cases where unannotated genes were co-expressed with annotated genes, this information could be used to reinforce suggested annotations based on conservation of synteny and sequence similarity. Gene ontology enrichment analysis of clusters was performed using PANTHER4. PANTHER is a classification system comprised of tools to analyze large-scale genome-wide data for gene function and pathway information (Mi et al., 2013).
Data Availability
Sample metadata for all tissue and cell samples, prepared in accordance with Functional Annotation of Animal Genomes (FAANG) Consortium metadata standards (Harrison et al., 2018), were deposited in the EBI BioSamples database5 under project identifier GSB-5402 (https://www.ebi.ac.uk/biosamples/samples/SAMEG326824). RNA-Sequencing data were deposited in the European Nucleotide Archive (ENA)6 under accession PRJEB25226 (https://www.ebi.ac.uk/ena/data/view/PRJEB25226). All experimental protocols are available on the FAANG consortium website7 at http://ftp.faang.ebi.ac.uk/ftp/protocols.
The complete “third pass” expression atlas, including samples derived from (Williams et al., 2017), is available as (Supplementary Table 10).
Results and Discussion
Generating the Gene Expression Atlas
The core of this dataset was derived from four 6-month old Mediterranean buffalo. From these animals, we collected tissues from all major organ systems and, wherever possible, collected biological replicates from each sex. These tissue samples were supplemented with immune cells from two additional animals of the same breed. Collectively, the Mediterranean buffalo contributed 164 samples to the atlas. We also collected the same set of tissues from our Indian buffalo cohorts which, due to restricted availability, were older (5–7 years old). Biological replicates (2 males, 2 females) were collected where possible. The Indian animals contributed 56 samples to the atlas. A number of immune cell types were sampled, including different subsets of macrophages and their progenitors (alveolar macrophages, MDMs, BMDMs +/− LPS, bone marrow cells, and PBMCs). Previous projects in several species have indicated that macrophages are a rich source of novel mRNAs (Carninci et al., 2005; Clark et al., 2017). A complete list of the tissues sequenced can be found in Supplementary Table 1.
Two types of library were generated to capture the expression of the largest diversity of RNA species possible, ribo-depleted total RNA, and (polyA) mRNA. These two library types were sequenced at different depths: total RNA at >100 million paired-end read depth and mRNA at >25 million paired-end read depth, generating approximately 21 billion raw reads in total.
We selected a wide range of tissues for the atlas to obtain the largest diversity of transcripts possible, in addition to integrating 30 RNA-Seq libraries from a previous study (detailed in Supplementary Table 9). The final expression atlas (Supplementary Table 10) was the product of a three-step approach used to iteratively improve the reference transcriptome; it contains 21,537 genes expressed in at least one tissue in the buffalo atlas (Supplementary Table 3). The proportion of protein-coding genes from this annotation detected in each tissue is summarized in Supplementary Table 8. Over 93% of protein-coding genes were expressed in at least one replicate of each tissue in the atlas alongside approximately 99% of the remaining (primarily RNA) genes (Supplementary Table 3).
Visualizing the Data
Methods such as weighted correlation network analysis (WGCNA) and partial correlation and information theory (PCIT) have been used by others to perform gene co-expression analysis in livestock species (Watson-Haigh et al., 2010; Alexandre et al., 2015; Weber et al., 2016; Salleh et al., 2018). We have chosen to use Graphia Professional, an alternative tool for the visualization and analysis of network graphs from large RNA-Seq and microarray datasets (Freeman et al., 2012; Mabbott et al., 2013; Clark et al., 2017). Graphia filters out genes with low expression and stably expressed genes and thus highlights the most variable, likely tissue-specific genes. A gene-to-gene correlation matrix for the buffalo atlas was calculated, and a weighted network graph constructed using a Pearson correlation of r ≥ 0.8 (see Materials and Methods). As we have done for atlas projects on other species (Clark et al., 2017; Bush et al., 2018; Freeman et al., 2012; Mabbott et al., 2013), the correlation threshold was determined empirically using a functionality within Graphia to maximize the number of nodes (genes) included whilst minimizing the number of edges. The optimal threshold is similar to previous projects and has been validated by the unequivocal GO term enrichment in specific clusters. The resulting graph contained 15,752 nodes (genes) connected by 1,851,403 edges and was clustered using the Markov clustering algorithm (MCL) at an inflation value of 2.2. Clusters with fewer than five nodes were excluded from further analysis, resulting in 276 clusters ranging from 5 to 3,372 nodes. The network graph is shown in Figure 1, along with the expression profiles of selected clusters. The graph consisted of one large component containing 12,993 nodes and 1,807,061 edges, and five smaller components each containing ≤21 nodes.
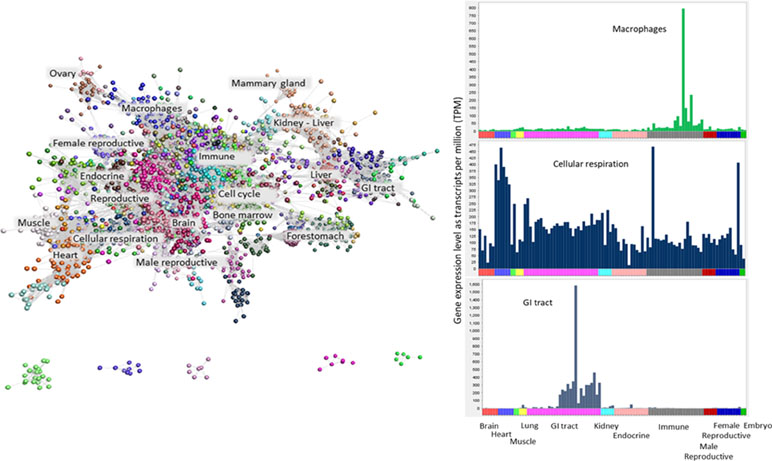
Figure 1 Clustered network graph of the buffalo transcriptome. The buffalo atlas data were visualised by a network graph based on Pearson correlation co-efficients for gene expression patterns. Each node represents a transcript and each edge (line) represents the correlation between individual measurements above a threshold of r = 0.80. The graph comprises 15,752 nodes connected by 1,851,403 edges. Clustering of the graph using the MCL algorithm was used to assign genes to classes or clusters based on their co-expression. The clusters can be annotated depending on the tissue specificity or cellular process by function of their contents. Plots of average expression profile for a few selected clusters are given on the right. The samples used to generate the graph are shown on the X axis ordered by organ system (colour-coded) and the Y axis shows the average TPM for the cluster. The tissue specificity of gene co-expression in three selected clusters are shown. These clusters contain genes that are highly expressed in macrophages, cellular respiration and the gastrointestinal tract.
The content of the top 50 clusters is summarized in Table 1, in which clusters are labeled according to the tissue or cell type showing highest expression in the cluster. The full list of clusters and their contents are available in Supplementary Table 11. As noted in several other atlas projects (Freeman et al., 2012; Mabbott et al., 2013; Clark et al., 2017; Bush et al., 2018), the largest cluster (cluster 1) consisted mainly of housekeeping genes, with expression detected in all tissues in the atlas. This cluster contained many transcripts that lack informative annotation, reflecting the focus within the literature on tissue-specific gene expression and on genes in which genetic variation is associated with a phenotype other than lethality. Another large cluster (cluster 3) contained 636 genes, around 80% of which are annotated. These genes showed peaks of expression in PBMCs, spleen, and endometrium but were otherwise also widely expressed across diverse tissues. Genes expressed in this cluster were enriched for GO terms including “macromolecule metabolic process” (GO ID: 0043170, p = 6.39 × 10⁻²²), “regulation of RNA metabolic processes” (GO ID: 0051252, p = 9.43 × 10⁻¹⁸), and “regulation of gene expression” (GO ID: 0010468, p = 9.95 × 10⁻¹⁸) (Table 1). As the enriched biological processes suggest, several of the genes present in this cluster are involved in gene regulation, including genes encoding transcription factors such as various zinc finger proteins along with argonaute 2 (AGO2), the catalytic component of the RNA-induced silencing complex (RISC), and casein kinase 1 alpha 1 (CSNK1A1), the inhibitory kinase of AGO2. CSNK1A1 initiates the AGO2 phosphorylation cycle, required to enhance the specificity of miRNAs for their target (Golden et al., 2017).
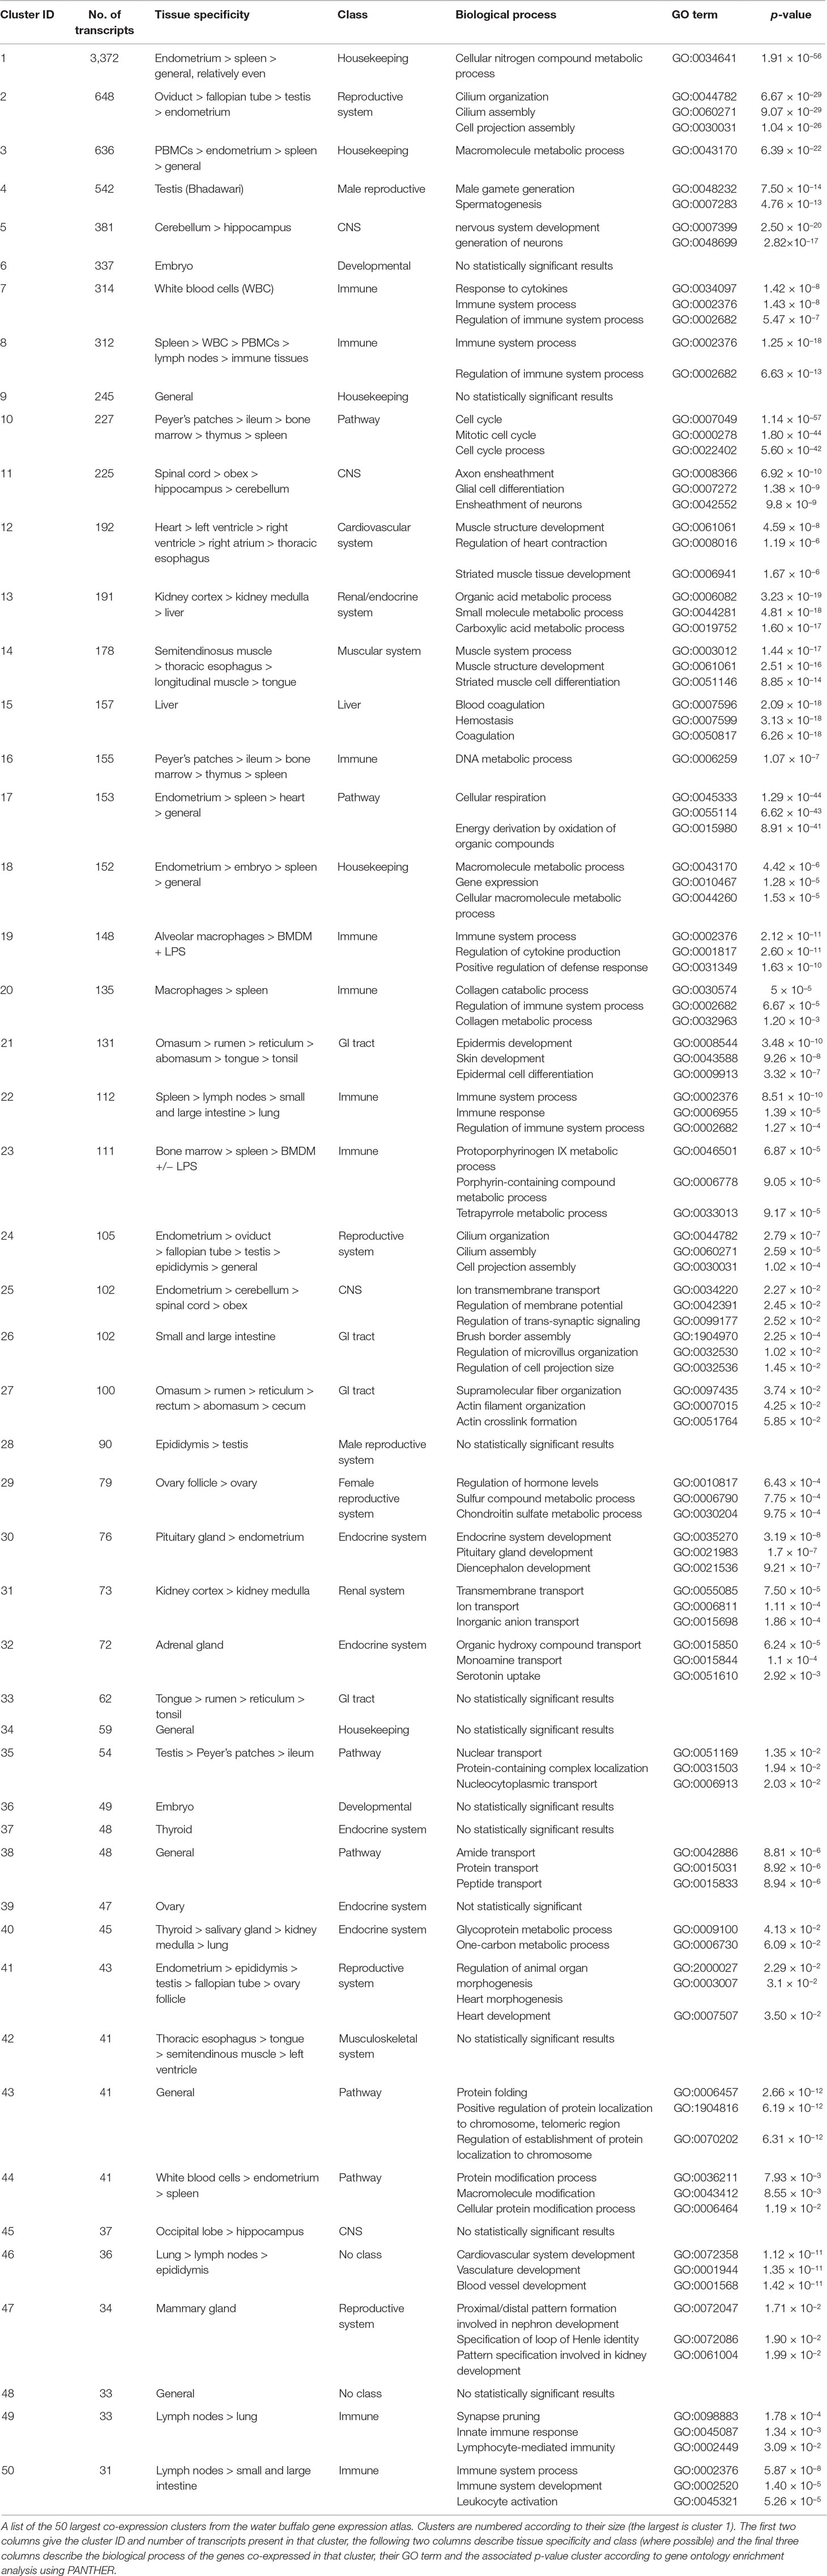
Table 1 Fifty largest clusters from network analysis.
Most of the smaller clusters contained genes whose expression was restricted to an organ system. Some clusters were specific to a single tissue or cell type, while others were clearly associated with a biological or cellular process. In many cases, the likely function of genes within any of the clusters can be inferred from their cell type enrichment or the known function of well-annotated genes within the clusters. These include organ system and tissue-specific clusters for genes expressed predominantly in the brain (clusters 5, 11, 25, and 45), heart (clusters 12 and 66), and reproductive system (clusters 2, 4, 24, 28, 29, 39, and 41). More specifically, certain clusters were enriched for the biological process GO terms of cilium organization (p = 6.67 × 10⁻²⁹) and cilium assembly (p = 9.07 × 10⁻²⁹) (cluster 2), male gamete generation (p = 7.50 × 10⁻¹⁴) and spermatogenesis (p = 7.50 × 10⁻¹⁴) (cluster 4), nervous system development (p = 2.50 × 10⁻²⁰) and generation of neurons (p = 2.82 × 10⁻¹⁷) (cluster 5), and muscle structure development (p = 4.59 × 10⁻⁸) and regulation of heart contraction (p = 1.19 × 10⁻⁶) (cluster 12).
We noted that replicate samples sometimes showed different expression patterns. For example, the expression of some genes in the three testis samples were not consistent. These differences may result from the differing ages of the animals (from 6 months to more than 5 years). Variation in other tissues may result from sex-specific effects, phase of oestrus cycle in the females, different husbandry (for example diet, exercise level, ambient temperature), and other factors. These differences could be explored further with a larger set of replicates. Nevertheless, in this analysis, clear, logical associations of gene expression patterns were found in spite of some differences between replicates, as presented below.
Immune System Clusters
We sampled several immune tissue and cell populations to identify genes that might be associated with disease resistance and resilience traits. We identified two main macrophage clusters (clusters 19 and 20) from the atlas data, each enriched for a particular macrophage subset. Genes in cluster 19 showed the highest expression levels in alveolar macrophages (AM) with many of the genes encoding well characterized macrophage-specific proteins. Genes in this cluster were enriched for GO terms including “immune system process” (p = 2.12 × 10⁻¹¹), “regulation of cytokine production” (p = 2.60 × 10⁻¹¹), and “positive regulation of defense response” (p = 1.63 × 10⁻¹⁰). Genes in this cluster include those encoding pro-inflammatory cytokines IL1A, IL1B, IL6, and IL8 and toll-like receptors TLR2 and TLR4 and the arginine metabolizing enzymes arginase (ARG2) and nitric oxide synthase (NOS2). The expression of ARG2 and NOS2 differs in buffalo macrophages from human, mouse, pig, and sheep and is more similar to cattle gene expression as previously described (Young et al., 2018). A separate macrophage-specific cluster (cluster 20) showed peak expression in MDMs and contained the macrophage-expressed genes CD14, CD63, and CD68; cytokine receptor genes CCR1 and CCR5; and myeloid cell marker gene TREM2. Most of these genes were detected in a macrophage cluster of the pig atlas (Freeman et al., 2012). In sheep as in buffalo, TREM2 is expressed in MDMs and LPS-stimulated macrophages and has very low expression in AMs (Clark et al., 2017). Genes in this cluster were also enriched for the GO terms “collagen catabolic process” (p = 5 × 10⁻⁵), “regulation of immune system process” (p = 6.67 × 10⁻⁵), and “collagen metabolic process” (p = 1.20 × 10⁻³).
Cluster 23 contains genes with expression peaks in bone marrow and spleen and both LPS-stimulated and unstimulated BMDMs. Biological process GO terms enriched in this cluster include “protoporphyrinogen IX metabolic process” (p = 6.87 × 10⁻⁵), “porphyrin-containing compound metabolic process” (p = 9.05 × 10⁻⁵), and “tetrapyrrole metabolic process” (p = 9.17 × 10⁻⁵). Genes in this cluster include those encoding some of the key red blood cell transcription factors, GATA1, GFI1B, and KLF1. Genes for members of the heme biosynthesis pathway were also expressed in this cluster, including ALAS2, FECH, HMBS, UROD, and UROS. In addition, the solute carrier genes SLC4A1 and SLCO4C1 were predominantly expressed in buffalo bone marrow cells. By inference, many of the genes within these clusters that currently lack a functional annotation are likely to have an immune function.
Cellular Processes
As previously observed in both the sheep and pig expression atlases (Freeman et al., 2012; Clark et al., 2017), genes involved in different biological processes may be active in many cells or tissues, and so clusters enriched for these processes can be identified. Genes involved in cellular respiration (glycolysis, the TCA cycle, and oxidative phosphorylation) clustered together in buffalo cluster 17. In the pig atlas (Freeman et al., 2012), components of the oxidative phosphorylation complex and related pathways encoded by the nuclear genome clustered together and showed elevated expression in the heart. The equivalent genes encoded by the mitochondrial genome clustered separately in pigs. In buffalo, several genes involved in the TCA cycle were present in cluster 17 along with components of all five oxidative phosphorylation complexes associated with ATP generation in the mitochondria (summarized in Table 2). This cluster contained 153 genes, most of which are involved in ATP generation. Genes in this cluster were expressed in most tissues in the atlas but clustered together because of shared high expression in the heart, cerebellum, and spleen. There were 26 unannotated genes in cluster 17, which by association are also likely to be involved in cellular respiration.
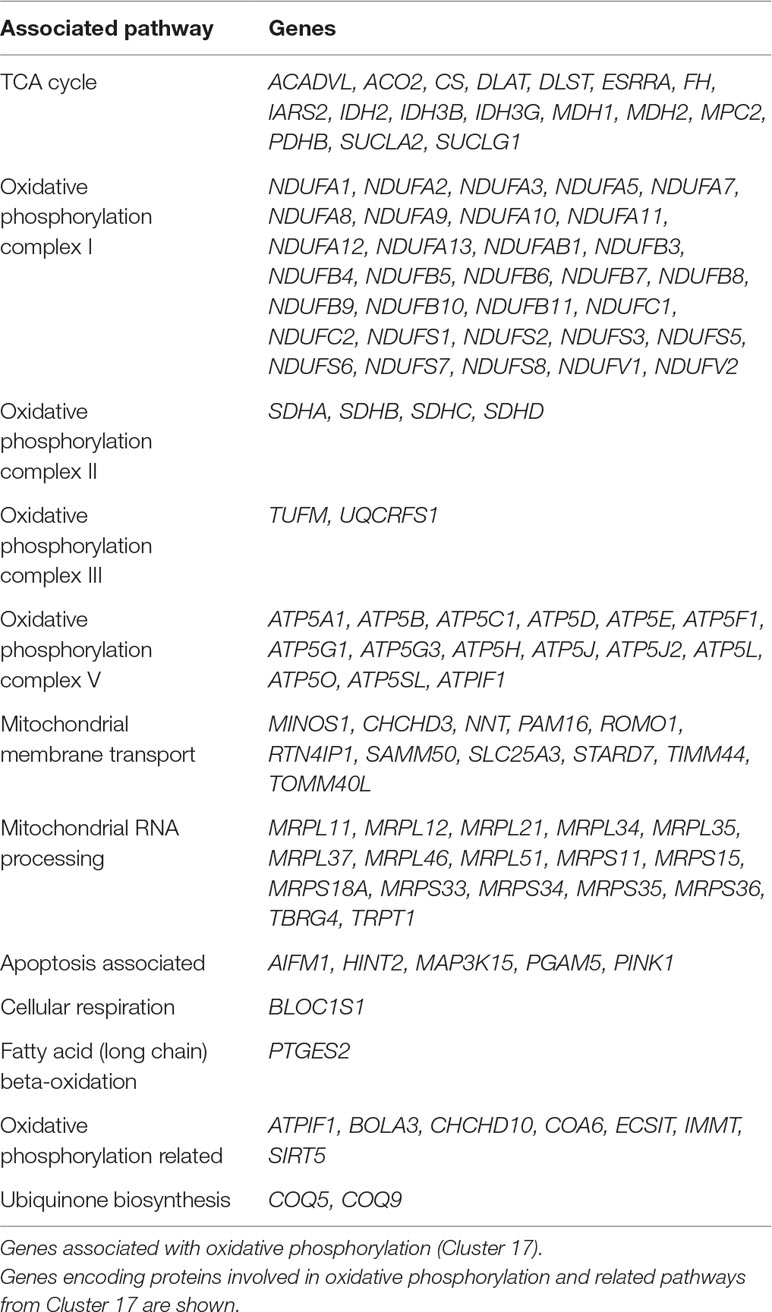
Table 2 Genes associated with oxidative phosphorylation (cluster 17).
Cluster 10 was enriched for genes with GO terms including “cell cycle” (p = 1.14 × 10−57), “mitotic cell cycle” (p = 1.80 × 10−44), and “cell cycle process” (p = 5.60 × 10−42). These genes cluster together because they have higher expression in tissues with a relatively high proliferative index, such as the small intestine, Peyer’s patches, and the bone marrow.
GI Tract Gene Expression
Although ruminant species have anatomically equivalent gastrointestinal tracts, we considered that GI tract gene expression may differ due to differences in diet, metabolism, or habitat. To test this hypothesis, we compared gene expression in the GI tract between buffalo and sheep, using gene expression data from the sheep atlas (Clark et al., 2017), which have also been the focus of a separate analysis (Bush et al., 2018). Equivalent datasets from both species were clustered using Graphia Professional with genes expressed in the forestomach and small and large intestines compared between species. Cluster 21 in buffalo contained 131 genes with enriched expression in the forestomach (reticulum, rumen, omasum, abomasum) and tonsils. Co-expression in these tissues was previously observed in the sheep atlas, (Clark et al., 2017) and in earlier studies in sheep (Xiang et al., 2016), and is thought to be due to their similar stratified squamous epithelial layer. The unannotated genes were removed and the remaining 91 buffalo genes compared to cluster 13 of the sheep atlas, which contained 155 (annotated) genes. Approximately, a third of these genes (n = 44) were common to both buffalo and sheep clusters. Of the remaining genes, 47 were only present in buffalo cluster 21, and 111 genes were only present in sheep cluster 13. Genes shared by both species include the keratin genes KRT5, KRT15, KRT23, KRT78, and KRT80 and the peptidoglycan recognition protein genes PGLYRP3 and PGLYRP4. Expression of these peptidoglycan receptor proteins has previously been described in the GI tract of other mammals such as mice, humans, and pigs (Liu et al., 2001; Mathur et al., 2004; Lu et al., 2006; Ueda et al., 2011). Genes only detected in buffalo include those encoding the tuft cell marker POU2F3, keratinocyte markers KRT6A and IVL, and the antioxidant enzyme gene GSR. Where differences were detected between species, missing genes were present in other clusters of either sheep or buffalo, not detected in the tissues collected for each species, or accounted for by a lack of annotation in one species. A list of these genes along with the relevant sheep or buffalo cluster is found in Supplementary Table 12.
Cluster 26 was enriched for genes expressed in the small and large intestines, although with highest expression in the former. Genes expressed in this cluster are enriched for the GO terms “brush border assembly” (p = 2.25 × 10⁻⁴), “regulation of microvillus organization” (p = 1.02 × 10⁻²), and “regulation of cell projection size” (p = 1.45 × 10⁻²). This cluster includes genes expressed in the crypt-villus axis of the small intestine, such as BMP5, ATOH1, and VIL1, along with the mucin-encoding genes MUC3A and MUC12.
We also compared levels of expression of the SLC gene family between buffalo and sheep. This superfamily comprises 49 gene families across both species, consisting of 342 and 335 genes in buffalo and sheep, respectively. These genes encode membrane-bound transporters, symporters, and antiporters (reviewed in He et al., 2009) and are mainly expressed in the kidney, although there are subsets with tissue-specific expression in the brain, heart, thyroid, and macrophages. The expression of these genes tended to be similar in tissue specificity between buffalo and sheep. There were a few exceptions. SLC16A1, reported to be expressed in the cattle rumen (Muller et al., 2002), and expressed at high levels in the sheep forestomach, was barely detectable in any buffalo tissue (TPM < 2). This could be due to an error in the annotation.
lncRNA Annotation and Expression
The detection of long non-coding RNAs (lncRNAs) from large gene expression atlas projects has added a further layer of complexity to the genome and regulation of gene expression. The ENCODE project has annotated approximately 16,000 lncRNAs in the human genome. More recently, lncRNAs have been annotated in livestock and large animal species such as sheep, goat, cattle, pig, and horse (Zhou et al., 2014; Koufariotis et al., 2015; Scott et al., 2017; Bush et al., 2018). We detected 6,756 putative lncRNAs in the buffalo by de novo assembly from our buffalo RNA-Seq dataset using methods described previously to generate a catalogue of ruminant lncRNAs in sheep, goat, and cattle (Bush et al., 2018). Expression of these lncRNAs was explored using Graphia Professional. A gene-to-gene correlation matrix was generated and a weighted network graph constructed using a Pearson correlation of r ≥ 0.9. The resulting graph contained 1,047 nodes and 58,878 edges. When clustered using MCL, the nodes formed 42 clusters of 6 to 394 nodes. An image of the network graph is shown in Figure 2. Supplementary Table 13 contains a list of the contents of each cluster.
Figure 2 lncRNA network graph. A network graph of annotated lncRNAs was generated applying a correlation threshold of r ≥ 0.9. The graph comprised 1,047 nodes and 58,878 edges. Clustering of the graph resulted in 42 clusters of 6 to 394 nodes. These clusters were annotated based on the tissue specificity of co-expressed lncRNAs. Supplementary Table 13 contains a list of the contents of each cluster.
Most of the lncRNA clusters were tissue- or organ system–specific. The largest lncRNA cluster (cluster 1) showed co-expression of lncRNAs in a single buffalo embryo and embryo pool. lncRNA cluster 6, a relatively small cluster containing only 39 lncRNAs, also showed co-expression in the embryo, along with the occipital lobe and longitudinal dorsal muscle. This expression pattern reflects the involvement of lncRNAs in the regulation of gene expression during development (reviewed in Fatica and Bozzoni, 2014). lncRNA cluster 5 contained lncRNAs co-expressed in white blood cells while those in lncRNA cluster 13 were expressed in PBMCs, white blood cells, spleen, and endometrium. lncRNA cluster 7 contained 37 lncRNAs whose co-expression was specific to the fallopian tube. lncRNA cluster 9 was liver-specific, and lncRNA cluster 17 was bone marrow–specific. Each of these clusters of co-expressed lncRNAs merits further investigation into the genes and processes they regulate.
Conclusion
All of the RNA-Seq data generated in this project have been provided to support annotation of intron-exon boundaries in the new water buffalo genome assembly (Low et al., 2019). The StringTie pipeline was used both to extend the Kallisto index, increasing the number of genes for which abundance can be quantified, and to identify novel lncRNA. However, the data can also provide a framework for the identification of novel splice variants of any gene of interest. For example, we recently analyzed the intron-exon structure of the complex ADGRE1 locus expressed in macrophages (Waddell et al., 2018). This analysis revealed that ruminants have a duplication of the extracellular domain, and the existence of extensive exon-skipping to encode isoforms that differ in the number of EGF-like calcium-binding domains. The animals used in the atlas are outbred, and the primary data also provide a resource for the analysis of allelic imbalance. Analysis of RNA-Seq data in other species, including cattle (Chamberlain et al., 2015) and humans (Nothnagel et al., 2011; Edsgard et al., 2016), has uncovered extensive allelic variation in gene expression. Finally, we are currently analyzing whole-genome DNA sequences of multiple Indian water buffalo breeds. The intersection of genomic DNA with functional annotation will provide insights into the molecular basis of breed-specific traits.
Ethics Statement
Ethics approval was obtained from The Roslin Institute’s and the University of Edinburgh’s Protocols and Ethics Committees. All animal work was carried out under the regulations of the Animals (Scientific Procedures) Act 1986.
Author Contributions
RY, LL, SG, SK, AA and DH contributed conception and design of the study; SB performed data analysis and curation; RY, LL, AJ, SS, SJ, VD, ZL, DI, KS, JW and DH collected the samples. LL, RY, AJ, SS, SJ and VD performed the experiments. RY, LL, SB and DH analysed the results. DH, AA, SK and SG secured funding and supervised the project. RY wrote the first draft of the manuscript; LL, SB and DH wrote sections of the manuscript. All authors contributed to manuscript revision, read and approved the submitted version.
Funding
This work was supported by a joint Biotechnology and Biological Sciences Research Council (BBSRC) (http://www.bbsrc.ac.uk) and Indian Department of Biotechnology Grant BB/L004623/1 (‘Transcriptome Analysis in Indian Buffalo and the Genetics of Innate Immunity’), also BBSRC Institute Strategic Program Grants: BBS/E/D/20211550 (‘Farm Animal Genomics’), BBS/E/D/20211552 (‘Transcriptomes, Networks and Systems’) and BB/P013732/1 (‘Blueprints for Healthy Animals’). Edinburgh Genomics is partly supported through core grants from BBSRC (BB/J004243/1), NERC (http://www.nerc.ac.uk) (R8/H10/56) and the Medical Research Council (MRC) (https://www.mrc.ac.uk) (MR/K001744/1). KMS and DAH receive funding form the Mater Foundation, Brisbane, Australia.
Conflict of Interest Statement
The authors declare that the research was conducted in the absence of any commercial or financial relationships that could be construed as a potential conflict of interest.
Acknowledgments
We would like to thank the large number of people at the Roslin Institute, UK, Parco Tecnologico Padano (PTP) in Lodi, Italy, and BAIF in Pune, India who helped with the many aspects of the water buffalo expression atlas project. At Dryden Farm (Roslin) the post mortem was performed by Tim King, Peter Tennant and Adrian Ritchie. At PTP the post mortem was performed by Nicola Morandi. In Pune the post mortem was performed by Hemant Kadam and Asmita Kulkarni, and the tissue collection assisted by Shilpa Jayebhaye. The tissue collection and sample processing team at Roslin included Emily Clark, Kristin Sauter, Lindsey Waddell, Ailsa Carlisle, Mark Barnett, Anna Raper, Sara Clohisey, Tim Regan, Clare Pridans and Gemma Davis. The tissue collection team in Lodi included Nadia Fiandanese, Sara Botti, Raffaele Mazza and Bouabid Badaoui. Library preparation and sequencing was performed by Edinburgh Genomics, The University of Edinburgh. We would also like to thank Peter Harrison (EBI– FAANG Data Coordination Centre) for assistance with generating the sample and experimental metadata. The Roslin Institute receives core strategic funding from the Biotechnology and Biological Sciences Research Council, UK (grant numbers BB/J004235/1, BBS/E/D/20211550, BBS/E/D/20211552).
Footnotes
- ^ http://www.fao.org/faostat
- ^ www.kajeka.com/graphia-professional
- ^ http://www.biogps.org
- ^ http://www.pantherdb.org
- ^ https://www.ebi.ac.uk/biosamples/samples
- ^ https://www.ebi.ac.uk/ena
- ^ http://ftp.faang.ebi.ac.uk/ftp/protocols
Supplementary Material
The Supplementary Material for this article can be found online at: https://www.frontiersin.org/articles/10.3389/fgene.2019.00668/full#supplementary-material
References
Alexandre, P. A., Kogelman, L. J. A., Santana, M. H. A., Passarelli, D., Pulz, L. H., Fantinato-Neto, P., et al. (2015). Liver transcriptomic networks reveal main biological processes associated with feed efficiency in beef cattle. BMC Genomics 16 (1), 1073. doi: 10.1186/s12864-015-2292-8
Altschul, S. F., Madden, T. L., Schaffer, A. A., Zhang, J., Zhang, Z., Miller, W., et al. (1997). Gapped BLAST and PSI-BLAST: a new generation of protein database search programs. Nucleic Acids Res. 25 (17), 3389–3402. doi: 10.1093/nar/25.17.3389
Ameur, A., Zaghlool, A., Halvardson, J., Wetterbom, A., Gyllensten, U., Cavelier, L., et al. (2011). Total RNA sequencing reveals nascent transcription and widespread co-transcriptional splicing in the human brain. Nat. Struct. Mol. Biol. 18 (12), 1435–1440. doi: 10.1038/nsmb.2143
Bray, N. L., Pimentel, H., Melsted, P., Pachter, L. (2016). Near-optimal probabilistic RNA-seq quantification. Nat. Biotechnol. 34 (5), 525–527. doi: 10.1038/nbt.3519
Bush, S. J., Freem, L., MacCallum, A. J., O'Dell, J., Wu, C., Afrasiabi, C., et al. (2018). Combination of novel and public RNA-seq datasets to generate an mRNA expression atlas for the domestic chicken. BMC Genomics 19 (1), 594. doi: 10.1186/s12864-018-4972-7
Bush, S. J., McCulloch, M. E. B., Muriuki, C., Salavati, M., Davis, G. M., Farquhar, I. L., et al. (2018). Comprehensive transcriptional profiling of the gastrointestinal tract of ruminants from birth to adulthood reveals strong developmental stage specific gene expression. G3 (Bethesda) 9 (2), 359–373. doi: 10.1534/g3.118.200810
Bush, S. J., Muriuki, C., McCulloch, M. E. B., Farquhar, I. L., Clark, E. L., Hume, D. A. (2018). Cross-species inference of long non-coding RNAs greatly expands the ruminant transcriptome. Genet. Sel. Evol. 50 (1), 20. doi: 10.1186/s12711-018-0391-0
Carninci, P., Kasukawa, T., Katayama, S., Gough, J., Frith, M. C., Maeda, N., et al. (2005). The transcriptional landscape of the mammalian genome. Science 309 (5740), 1559–1563. doi: 10.1126/science.1112014
Chamberlain, A. J., Vander Jagt, C. J., Hayes, B. J., Khansefid, M., Marett, L. C., Millen, C. A., et al. (2015). Extensive variation between tissues in allele specific expression in an outbred mammal. BMC Genomics 16, 993. doi: 10.1186/s12864-015-2174-0
Clark, E. L., Bush, S. J., McCulloch, M. E. B., Farquhar, I. L., Young, R., Lefevre, L., et al. (2017). A high resolution atlas of gene expression in the domestic sheep (Ovis aries). PLoS Genet. 13 (9), e1006997. doi: 10.1371/journal.pgen.1006997
Cockrill, W. R. (1981). The water buffalo: a review. Br. Vet. J. 137 (1), 8–16. doi: 10.1016/S0007-1935(17)31782-7
Colli, L., Milanesi, M., Vajana, E., Iamartino, D., Bomba, L., Puglisi, F., (2018). New insights on water buffalo genomic diversity and post-domestication migration routes from medium density SNP chip data. Front. Genet. 9, 53. doi: 10.3389/fgene.2018.00053
Deng, T., Pang, C., Lu, X., Zhu, P., Duan, A., Tan, Z., et al. (2016). De Novo transcriptome assembly of the Chinese swamp buffalo by RNA sequencing and SSR marker discovery. PLoS One 11 (1), e0147132. doi: 10.1371/journal.pone.0147132
Edsgard, D., Iglesias, M. J., Reilly, S. J., Hamsten, A., Tornvall, P., Odeberg, J., et al. (2016). GeneiASE: detection of condition-dependent and static allele-specific expression from RNA-seq data without haplotype information. Sci. Rep. 6, 21134. doi: 10.1038/srep21134
Fatica, A., Bozzoni, I. (2014). Long non-coding RNAs: new players in cell differentiation and development. Nat. Rev. Genet. 15 (1), 7–21. doi: 10.1038/nrg3606
Freeman, T. C., Goldovsky, L., Brosch, M., van Dongen, S., Maziere, P., Grocock, R. J., et al. (2007). Construction, visualisation, and clustering of transcription networks from microarray expression data. PLoS Comput. Biol. 3 (10), 2032–2042. doi: 10.1371/journal.pcbi.0030206
Freeman, T. C., Ivens, A., Baillie, J. K., Beraldi, D., Barnett, M. W., Dorward, D., et al. (2012). A gene expression atlas of the domestic pig. BMC Biol. 10, 90. doi: 10.1186/1741-7007-10-90
Golden, R. J., Chen, B., Li, T., Braun, J., Manjunath, H., Chen, X., et al. (2017). An Argonaute phosphorylation cycle promotes microRNA-mediated silencing. Nature 542 (7640), 197–202. doi: 10.1038/nature21025
Harrison, P. W., Fan, J., Richardson, D., Clarke, L., Zerbino, D., Cochrane, G., et al. (2018). FAANG, establishing metadata standards, validation and best practices for the farmed and companion animal community. Anim. Genet. 49 (6), 520–526. doi: 10.1111/age.12736
He, L., Vasiliou, K., Nebert, D. W. (2009). Analysis and update of the human solute carrier (SLC) gene superfamily. Hum. Genomics 3 (2), 195–206. doi: 10.1186/1479-7364-3-2-195
Kapetanovic, R., Fairbairn, L., Beraldi, D., Sester, D. P., Archibald, A. L., Tuggle, C. K., et al. (2012). Pig bone marrow-derived macrophages resemble human macrophages in their response to bacterial lipopolysaccharide. J. Immunol. 188 (7), 3382–3394. doi: 10.4049/jimmunol.1102649
Kim, D., Langmead, B., Salzberg, S. L. (2015). HISAT: a fast spliced aligner with low memory requirements. Nat. Methods 12 (4), 357–360. doi: 10.1038/nmeth.3317
Koufariotis, L. T., Chen, Y. P., Chamberlain, A., Vander Jagt, C., Hayes, B. J. (2015). A catalogue of novel bovine long noncoding RNA across 18 tissues. PLoS One 10 (10), e0141225. doi: 10.1371/journal.pone.0141225
Kumar, S., Nagarajan, M., Sandhu, J. S., Kumar, N., Behl, V., Nishanth, G. (2007). Mitochondrial DNA analyses of Indian water buffalo support a distinct genetic origin of river and swamp buffalo. Anim. Genet. 38 (3), 227–232. doi: 10.1111/j.1365-2052.2007.01602.x
Lei, C. Z., Zhang, W., Chen, H., Lu, F., Liu, R. Y., Yang, X. Y., et al. (2007). Independent maternal origin of Chinese swamp buffalo (Bubalus bubalis). Anim. Genet. 38 (2), 97–102. doi: 10.1111/j.1365-2052.2007.01567.x
Liu, C., Xu, Z., Gupta, D., Dziarski, R. (2001). Peptidoglycan recognition proteins: a novel family of four human innate immunity pattern recognition molecules. J. Biol. Chem. 276 (37), 34686–34694. doi: 10.1074/jbc.M105566200
Low, W. Y., Tearle, R., Bickhart, D. M., Rosen, B. D., Kingan, S. B., Swale, T., et al. (2019). Chromosome-level assembly of the water buffalo genome surpasses human and goat genomes in sequence contiguity. Nat. Commun. 10 (1), 260. doi: 10.1038/s41467-018-08260-0
Lu, X., Wang, M., Qi, J., Wang, H., Li, X., Gupta, D., et al. (2006). Peptidoglycan recognition proteins are a new class of human bactericidal proteins. J. Biol. Chem. 281 (9), 5895–5907. doi: 10.1074/jbc.M511631200
Mabbott, N. A., Baillie, J. K., Brown, H., Freeman, T. C., Hume, D. A. (2013). An expression atlas of human primary cells: inference of gene function from coexpression networks. BMC Genomics 14, 632. doi: 10.1186/1471-2164-14-632
Mathur, P., Murray, B., Crowell, T., Gardner, H., Allaire, N., Hsu, Y. M., et al. (2004). Murine peptidoglycan recognition proteins PglyrpIalpha and PglyrpIbeta are encoded in the epidermal differentiation complex and are expressed in epidermal and hematopoietic tissues. Genomics 83 (6), 1151–1163. doi: 10.1016/j.ygeno.2004.01.003
Mi, H., Muruganujan, A., Casagrande, J. T., Thomas, P. D. (2013). Large-scale gene function analysis with the PANTHER classification system. Nat. Protoc. 8 (8), 1551–1566. doi: 10.1038/nprot.2013.092
Muller, F., Huber, K., Pfannkuche, H., Aschenbach, J. R., Breves, G., Gabel, G. (2002). Transport of ketone bodies and lactate in the sheep ruminal epithelium by monocarboxylate transporter 1. Am. J. Physiol. Gastrointest. Liver Physiol. 283 (5), G1139–G1146. doi: 10.1152/ajpgi.00268.2001
Nothnagel, M., Wolf, A., Herrmann, A., Szafranski, K., Vater, I., Brosch, M., et al. (2011). Statistical inference of allelic imbalance from transcriptome data. Hum. Mutat. 32 (1), 98–106. doi: 10.1002/humu.21396
Pertea, M., Pertea, G. M., Antonescu, C. M., Chang, T. C., Mendell, J. T., Salzberg, S. L. (2015). StringTie enables improved reconstruction of a transcriptome from RNA-seq reads. Nat. Biotechnol. 33 (3), 290–295. doi: 10.1038/nbt.3122
Pruitt, K. D., Tatusova, T., Maglott, D. R. (2005). NCBI Reference Sequence (RefSeq): a curated non-redundant sequence database of genomes, transcripts and proteins. Nucleic Acids Res. 33 (Database issue), D501–D504. doi: 10.1093/nar/gki025
Salleh, S. M., Mazzoni, G., Lovendahl, P., Kadarmideen, H. N. (2018). Gene co-expression networks from RNA sequencing of dairy cattle identifies genes and pathways affecting feed efficiency. BMC Bioinformatics 19 (1), 513. doi: 10.1186/s12859-018-2553-z
Scott, E. Y., Mansour, T., Bellone, R. R., Brown, C. T., Mienaltowski, M. J., Penedo, M. C., et al. (2017). Identification of long non-coding RNA in the horse transcriptome. BMC Genomics 18 (1), 511. doi: 10.1186/s12864-017-3884-2
Theocharidis, A., van Dongen, S., Enright, A. J., Freeman, T. C. (2009). Network visualization and analysis of gene expression data using BioLayout Express(3D). Nat. Protoc. 4 (10), 1535–1550. doi: 10.1038/nprot.2009.177
Ueda, W., Tohno, M., Shimazu, T., Fujie, H., Aso, H., Kawai, Y., (2011). Molecular cloning, tissue expression, and subcellular localization of porcine peptidoglycan recognition proteins 3 and 4. Vet. Immunol. Immunopathol. 143 (1–2), 148–154. doi: 10.1016/j.vetimm.2011.05.026
van Dongen, S., Abreu-Goodger, C. (2012). Using MCL to extract clusters from networks. Methods Mol. Biol. 804, 281–295. doi: 10.1007/978-1-61779-361-5_15
Waddell, L. A., Lefevre, L., Bush, S. J., Raper, A., Young, R., Lisowski, Z. M., et al. (2018). ADGRE1 (EMR1, F4/80) Is a rapidly-evolving gene expressed in mammalian monocyte-macrophages. Front. Immunol. 9, 2246. doi: 10.3389/fimmu.2018.02246
Wang, Z., Gerstein, M., Snyder, M. (2009). RNA-Seq: a revolutionary tool for transcriptomics. Nat. Rev. Genet. 10 (1), 57–63. doi: 10.1038/nrg2484
Wang, L., Park, H. J., Dasari, S., Wang, S., Kocher, J. P., Li, W. (2013). CPAT: Coding-Potential Assessment Tool using an alignment-free logistic regression model. Nucleic Acids Res. 41 (6), e74. doi: 10.1093/nar/gkt006
Watson-Haigh, N. S., Kadarmideen, H. N., Reverter, A. (2010). PCIT: an R package for weighted gene co-expression networks based on partial correlation and information theory approaches. Bioinformatics 26 (3), 411–413. doi: 10.1093/bioinformatics/btp674
Weber, K. L., Welly, B. T., Van Eenennaam, A. L., Young, A. E., Porto-Neto, L. R., Reverter, A., et al. (2016). Identification of gene networks for residual feed intake in angus cattle using genomic prediction and RNA-seq. PLoS One 11 (3), e0152274. doi: 10.1371/journal.pone.0152274
Williams, J. L., Iamartino, D., Pruitt, K. D., Sonstegard, T., Smith, T. P. L., Low, W. Y., et al. (2017). Genome assembly and transcriptome resource for river buffalo, Bubalus bubalis (2n = 50). Gigascience 6 (10), 1–6. doi: 10.1093/gigascience/gix088
Wu, C., Orozco, C., Boyer, J., Leglise, M., Goodale, J., Batalov, S., et al. (2009). BioGPS: an extensible and customizable portal for querying and organizing gene annotation resources. Genome Biol. 10 (11), R130. doi: 10.1186/gb-2009-10-11-r130
Wu, C., Macleod, I., Su, A. I. (2013). BioGPS and MyGene.info: organizing online, gene-centric information. Nucleic Acids Res. 41 (Database issue), D561–D565. doi: 10.1093/nar/gks1114
Wu, C., Jin, X., Tsueng, G., Afrasiabi, C., Su, A. I. (2016). BioGPS: building your own mash-up of gene annotations and expression profiles. Nucleic Acids Res. 44 (D1), D313–D316. doi: 10.1093/nar/gkv1104
Xiang, R., McNally, J., Rowe, S., Jonker, A., Pinares-Patino, C. S., Oddy, V. H., et al. (2016). Gene network analysis identifies rumen epithelial cell proliferation, differentiation and metabolic pathways perturbed by diet and correlated with methane production. Sci. Rep. 6, 39022. doi: 10.1038/srep39022
Yang, B. Z., L. X., Qin, J., Yang, C. J., Shang, J. H. (2013). Brief introduction to the development of Chinese dairy buffalo industry. The 10th World Buffalo Congress and the 7th Asian Buffalo Congress. Phuket, Thailand. 111–120.
Young, R., Bush, S. J., Lefevre, L., McCulloch, M. E. B., Lisowski, Z. M., Muriuki, C., et al. (2018). Species-specific transcriptional regulation of genes involved in nitric oxide production and arginine metabolism in macrophages. Immunohorizons 2 (1), 27–37. doi: 10.4049/immunohorizons.1700073
Zhang, X., Rosen, B. D., Tang, H., Krishnakumar, V., Town, C. D. (2015). Polyribosomal RNA-Seq reveals the decreased complexity and diversity of the Arabidopsis translatome. PLoS One 10 (2), e0117699. doi: 10.1371/journal.pone.0117699
Keywords: water buffalo, livestock, expression atlas, network analysis, functional annotation, FAANG
Citation: Young R, Lefevre L, Bush SJ, Joshi A, Singh SH, Jadhav SK, Dhanikachalam V, Lisowski ZM, Iamartino D, Summers KM, Williams JL, Archibald AL, Gokhale S, Kumar S and Hume DA (2019) A Gene Expression Atlas of the Domestic Water Buffalo (Bubalus bubalis). Front. Genet. 10:668. doi: 10.3389/fgene.2019.00668
Received: 30 April 2019; Accepted: 26 June 2019;
Published: 24 July 2019.
Edited by:
Haja N. Kadarmideen, Technical University of Denmark, DenmarkReviewed by:
Christophe Klopp, Institut National de la Recherche Agronomique de Toulouse, FranceKieran G. Meade, Teagasc, The Irish Agriculture and Food Development Authority, Ireland
Copyright © 2019 Young, Lefevre, Bush, Joshi, Singh, Jadhav, Dhanikachalam, Lisowski, Iamartino, Summers, Williams, Archibald, Gokhale, Kumar and Hume. This is an open-access article distributed under the terms of the Creative Commons Attribution License (CC BY). The use, distribution or reproduction in other forums is permitted, provided the original author(s) and the copyright owner(s) are credited and that the original publication in this journal is cited, in accordance with accepted academic practice. No use, distribution or reproduction is permitted which does not comply with these terms.
*Correspondence: Rachel Young, cmFjaGVsLnlvdW5nQHJvc2xpbi5lZC5hYy51aw==; David A. Hume, ZGF2aWQuaHVtZUB1cS5lZHUuYXU=