 Duan Zeng1†
 Shen He1†Changlin Ma2Yi Wen2Ying Xie3Nan Zhao4Xirong Sun4Dongxiang Wang1
 Yifeng Shen1Yimin Yu1*
 Huafang Li1,5,6*
- 1Department of Psychiatry, Shanghai Mental Health Center, Shanghai Jiao Tong University School of Medicine, Shanghai, China
- 2Department of Psychiatry,Shanghai Jiading District Mental Health Center, Shanghai, China
- 3Department of Pharmacology and Chemical Biology, Faculty of Basic Medicine, Shanghai Jiao Tong University School of Medicine, Shanghai, China
- 4Department of Psychiatry, Shanghai Pudong New Area Mental Health Center, Tongji University School of Medicine, Shanghai, China
- 5Shanghai Key Laboratory of Psychotic Disorders, Shanghai, China
- 6Clinical Research Center, Shanghai Jiao Tong University School of Medicine, Shanghai, China
Major depressive disorder (MDD) is a leading cause of disability worldwide, although its etiology and mechanism remain unknown. The aim of our study was to identify hub genes associated with MDD and to illustrate the underlying mechanisms. A weighted gene co-expression network analysis (WGCNA) was performed to identify significant gene modules and hub genes associated with MDD in peripheral blood mononuclear cells (PBMCs) (n = 45). In the blue module (R2 = 0.95), five common hub genes in both co-expression network and protein–protein interaction (PPI) network were regarded as “real” hub genes. In another independent dataset, GSE52790, four genes were still significantly down-regulated in PBMCs from MDD patients compared with the controls. Furthermore, these four genes were validated by quantitative real-time polymerase chain reaction (qRT-PCR) in PBMCs from 33 MDD patients and 41 healthy controls. The qRT-PCR analysis showed that ATP synthase membrane subunit c locus 1 (ATP5G1) was significantly down-regulated in samples from MDD patients than in control samples (t = −2.89, p-value = 0.005). Moreover, this gene was significantly differentially expressed between patients and controls in the prefrontal cortex (z = −2.83, p-value = 0.005). Highly significant differentially methylated positions were identified in the Brodmann area 25 (BA25), with probes in the ATP5G1 gene being significantly associated with MDD: cg25495775 (t = 2.82, p-value = 0.008), cg25856120 (t = −2.23, p-value = 0.033), and cg23708347 (t = −2.24, p-value = 0.032). These findings indicate that the ATP5G1 gene is associated with the pathogenesis of MDD and that it could serve as a peripheral biomarker for MDD.
Introduction
Major depressive disorder (MDD), a common mental disorder with a lifetime prevalence of around 15% in the general population (Tsai, 2006), is predicted to become the second leading cause of disability-adjusted life years in 2020 (Murray and Lopez, 1997). Many different studies have proposed hypotheses regarding the pathogenesis of depression, such as the dysfunctional monoamine theory of depression (Farvolden et al., 2003), the hypothesis of disturbed neuroplasticity (Christoffel et al., 2011), and the inflammatory, oxidative, and nitrosative stress (O&NS) theory of depression (Leonard and Maes, 2012). However, there is no definitive evidence to support any of these theories.
Some evidence has demonstrated that transcriptional alterations in peripheral blood mononuclear cells (PBMCs) may reflect the molecular changes in the brain (Fisar and Raboch, 2008; Fan et al., 2015). Rollins et al. also found that PBMCs and the brain may share a common mRNA expression pattern (Rollins et al., 2010). Moreover, the central nervous system may affect the gene expression of peripheral lymphocytes via neurotransmitters, cytokines, or hormones, which may explain the comparable gene expression levels between peripheral blood and some brain tissues (Gladkevich et al., 2004). In addition, several studies have found that the aberrant expression of mRNAs in PBMC samples might be involved in the pathogenesis of MDD (Rocc et al., 2002; Lee and Kim, 2010). Therefore, PBMCs were the focus of our study.
With the development of high-throughput microarray technology, gene expression profiles have been used to identify genes and pathways associated with the pathogenesis of MDD, which have helped to partially illustrate the underlying mechanisms. For example, Tochigi et al. conducted a DNA microarray analysis of major depression using postmortem brains and found 99 differentially expressed genes (DEGs) (Tochigi et al., 2008). A microarray mRNA expression analysis revealed local inflammatory, apoptotic, and oxidative stress in MDD (Shelton et al., 2011). However, most of these studies emphasized only on screening DEGs rather than determining the connection between them, in which genes with similar expression patterns may be functionally related (Tavazoie et al., 1999). Weighted gene co-expression network analysis (WGCNA) is a powerful method for constructing free-scale gene co-expression networks to explore the relationship between different gene sets and clinical features (Langfelder and Horvath, 2008). Thus, to improve the understanding of the biological mechanisms underlying MDD, WGCNA was performed to construct a co-expression network of the relationships between genes and identify significant gene modules and hub genes associated with MDD.
Materials and Methods
Study Design and Data Collection
The study design is illustrated in Figure 1. First, the normalized gene expression data and relevant clinical information were downloaded from the Gene Expression Omnibus (GEO) database (http://www.ncbi.nlm.nih.gov/geo/). The GSE39653 dataset was used as a training set to screen DEGs, construct co-expression networks, and identify significant modules and hub genes from PBMCs in our study. This dataset, based on the microarray platform of the Illumina HumanHT-12 V4.0 expression beadchip (GPL10558), included 24 adult healthy controls and 21 adult MDD patients (Savitz et al., 2013).
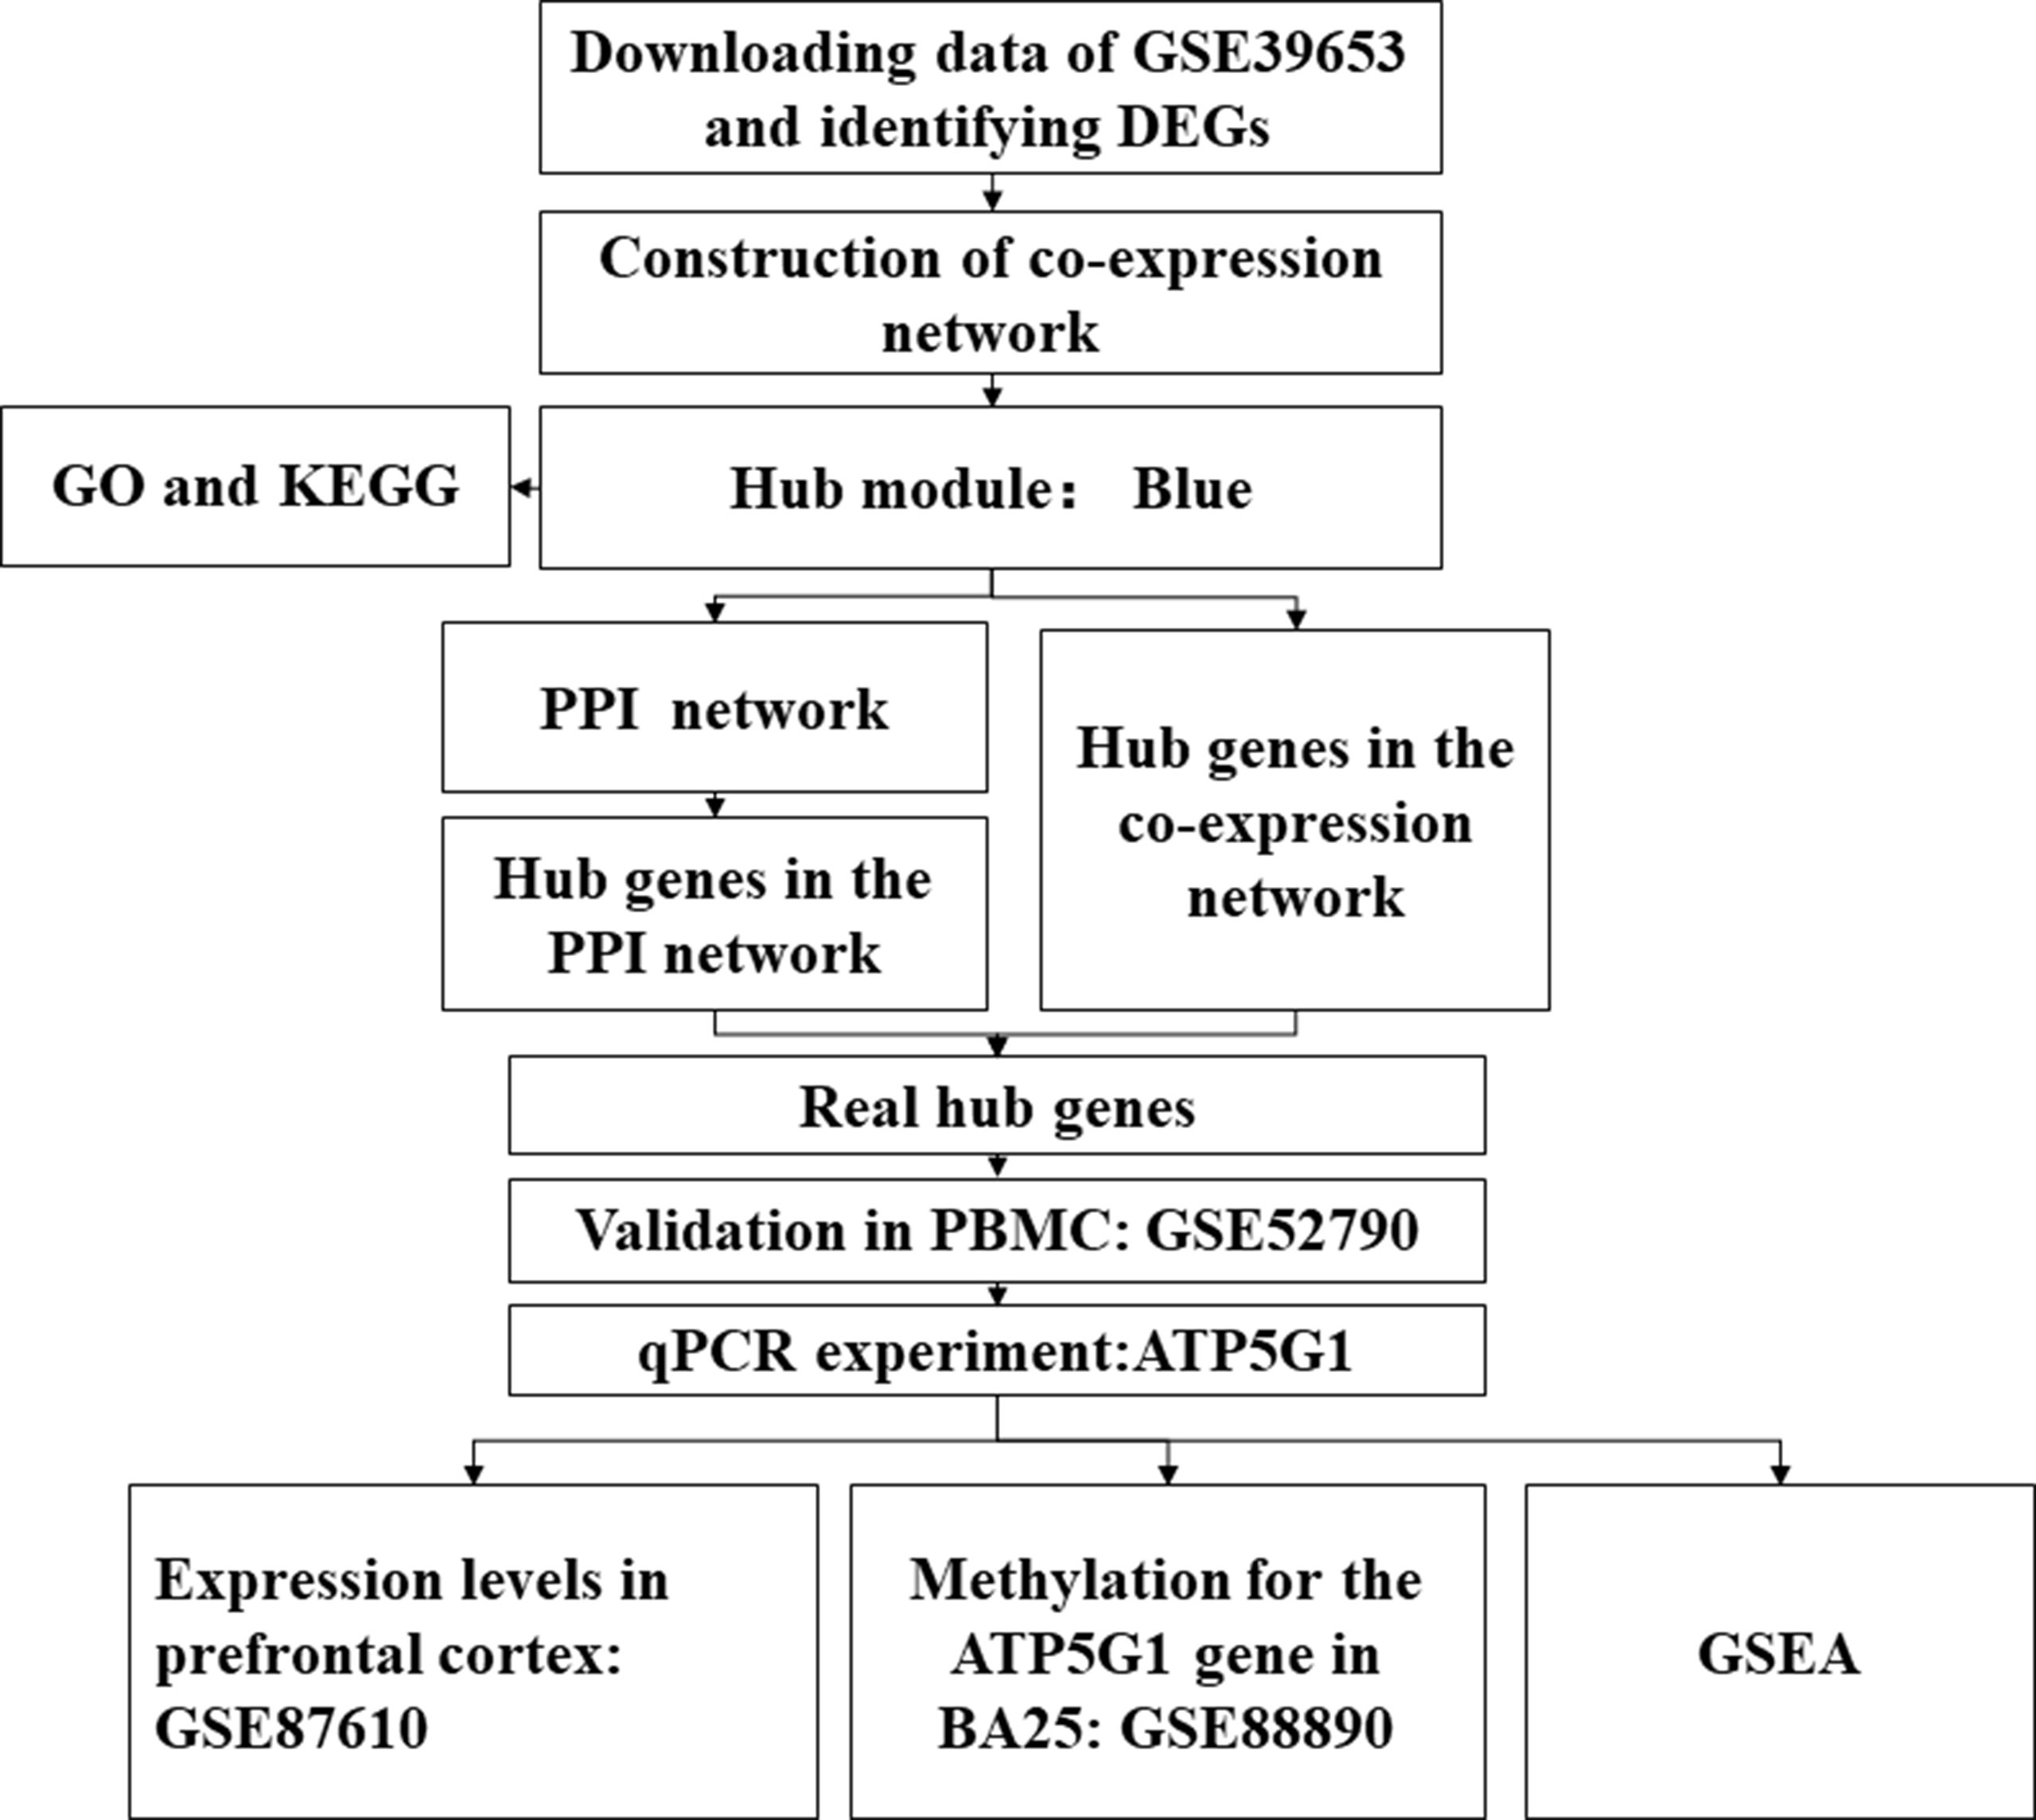
Figure 1 Flow diagram of the data processing, analysis, and validation procedures performed in this study. DEGs, differentially expressed genes; PPI, protein–protein interaction; PBMCs, peripheral blood mononuclear cells; qPCR, quantitative real-time polymerase chain reaction; BA25, Brodmann area 25.
Data Preprocessing and Screening of DEGs
A microarray annotation file was used to match probes with corresponding genes. For multiple probes corresponding to one gene, the average expression value was calculated as the gene expression value. The limma package in R (Ritchie et al., 2015) was utilized to identify the DEGs between MDD and control samples in the expression data of GSE39653. Genes with p < 0.1 were selected for subsequent analyses.
Co-Expression Network Construction and Identification of Clinically Significant Modules
The “WGCNA” package in R was used to construct a gene co-expression network for the DEGs (Horvath and Dong, 2008; Mason et al., 2009). First, Pearson’s correlation coefficients were calculated for all pairs of genes. Then, a weighted adjacency matrix was constructed using a power function: aij = |cor(xi, xj)|β (cor(xi, xj) = Pearson’s correlation between gene i and gene j; aij = adjacency between gene i and gene j). β was a soft-thresholding parameter that could emphasize high correlations and weaken low correlations. Next, the adjacency matrix was transformed into a topological overlap matrix (TOM) to measure the network connectivity of genes for network generation (Yip and Horvath, 2007). Finally, with a minimum size (gene group) of 20 for the resulting dendrogram, average linkage hierarchical clustering was performed according to the TOM-based dissimilarity measure to classify genes with similar expression profiles into gene modules (Ravasz et al., 2002).
Module eigengenes (MEs) were regarded as the major component for each gene module in the principal component analysis, which was used to summarize the expression patterns of all genes into a single characteristic expression profile within a given module. Then, the correlation was calculated between MEs and the disease status (MDD vs. control) to identify the relevant modules.
Functional and Pathway Enrichment Analysis and Protein–Protein Interaction (PPI) Network Construction
Genes in a hub module were uploaded to DAVID Bioinformatics Tool (https://david.ncifcrf.gov/, version 6.7) (Huang et al., 2009a; Huang et al., 2009b) to screen the enriched Gene Ontology (GO) terms and Kyoto Encyclopedia of Genes and Genomes (KEGG) pathways. p-value < 0.05 was considered to be significant enrichment.
The PPI network of the genes in the selected module was constructed according to the STRING database (http://www.string-db.org/) and visualized using Cytoscape 3.6.0 (Shannon et al., 2003; Szklarczyk et al., 2017).
Hub Gene Analysis
Hub genes have high connectivity within a gene module and have been shown to be functionally significant (Goh et al., 2007). In our study, after an interesting module was chosen, hub genes were defined by module connectivity (cor.geneModuleMembership > 0.8) and clinical trait relationship (cor.geneTraitSignificance > 0.2) (Horvath and Dong, 2008; Presson et al., 2008). In the PPI network, genes with a combined score of ≥0.9 and a connectivity degree of ≥10 were also defined as hub genes. The shared hub genes in both the co-expression network and PPI network were regarded as “real” hub genes for further analyses. A Venn diagram (http://bioinformatics.psb.ugent.be/webtools/Venn/) was constructed to identify these “real” hub genes.
To confirm that the real hub genes identified in the GSE39653 dataset were associated with MDD, another independent dataset, GSE52790, based on PBMCs was also downloaded from the GEO database and used as a test set to verify the results of our study. Information about the datasets is provided in Table 1.
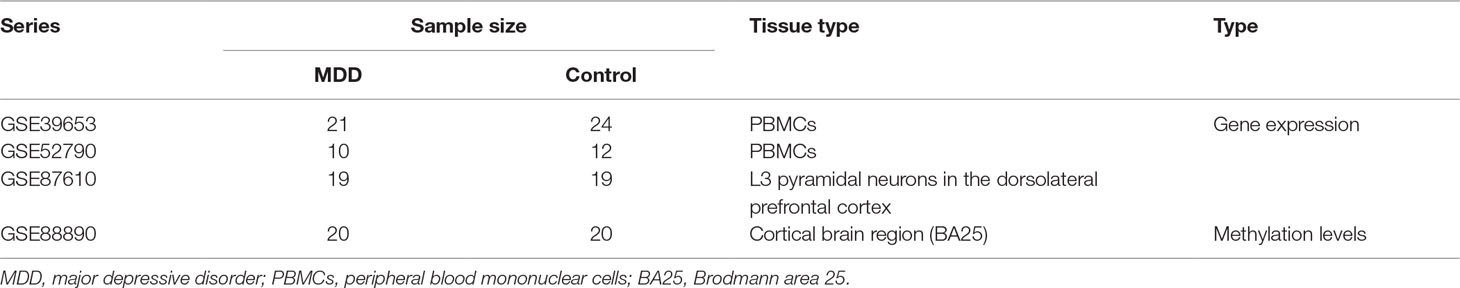
Table 1 Basic information about the datasets used in our study.
Quantitative Real-Time PCR (qPCR) Experiment
TaqMan qPCR was used to validate the expression changes observed in the four hub genes in 33 MDD patients and 41 age- and sex-matched controls. The ethics committee of Shanghai Mental Health Center approved the research protocol, and all participants provided written informed consent.
Total RNA was extracted from PBMCs using TRIzol reagent (Invitrogen, Carlsbad, California, USA). RNA was converted to cDNA using a PrimeScript RT reagent Kit with gDNA Eraser (Perfect Real Time) (Takara, Kyoto, Japan) according to the manufacturer’s instructions. The TaqMan® Gene Expression Assay was then used to detect the gene expression of the following four genes: VHL (Hs03046964_s1), ATP5G1 (Hs00829069_s1), COX4I1 (Hs00971639_m1), and DDOST (Hs00193263_m1). 18S (Hs99999901_s1) and β-actin (Hs99999903_m1) were used as reference genes. The 20 μl of PCR reaction mixture contained 1 μl of cDNA, 1 μl of 20× TaqMan assays, 10 μl of 2× TaqMan Universal Master Mix II, No UNG (Applied Biosystems, Foster City, CA, USA), and 8 μl of RNase-free water. The PCR parameters were 50°C for 2 min and 95°C for 10 min, followed by 45 cycles of 95°C for 15 s and 60°C for 1 min. Each sample was run in triplicate in 384-well plates using a LightCycler 480 (Roche) instrument. The relative mRNA abundance was calculated using the 2−ΔΔCt method.
Expression of the Hub Genes in the Brain and Methylation Analysis
Considering that transcriptional alterations in PBMCs may reflect molecular and cellular changes in the brain (Rollins et al., 2010), the normalized gene expression data in GSE87610 (L3 pyramidal neurons in the dorsolateral prefrontal cortex) (Arion et al., 2017) were downloaded from the GEO database to verify the hub genes that were differentially expressed in the qPCR experiment.
Meanwhile, to detect the methylation levels of the hub genes, the genome-wide patterns of the DNA methylation profiling data (GSE88890) were also downloaded. This dataset includes tissue from the cortical brain region [Brodmann area 25 (BA25)] from 20 depressed MDD suicide completers and 20 non-psychiatric, sudden-death controls (Murphy et al., 2017).
Gene Set Enrichment Analysis (GSEA)
Twenty-one MDD samples without controls in the GSE39653 dataset were divided into two groups (high-expression and low-expression groups) according to the expression levels of the hub genes. To identify the potential function of the hub genes, GSEA (Subramanian et al., 2005) was performed in our study between the two groups to determine whether a series of pre-defined biological processes were enriched in the gene rank. p-value < 0.05 was defined as the cutoff criterion.
Statistical Analysis
Statistical analysis was carried out using SPSS 20.0 (SPSS Inc., Chicago, IL, USA) and R software. The Shapiro–Wilk test was used to examine the normal distribution of the variables. Depending on the distribution of the data, the independent samples t test and the non-parametric Mann–Whitney U test were applied to test for differences between groups. p-value < 0.05 was considered statistically significant.
Results
Differentially Expressed Gene Screening
A total of 3,730 DEGs (1,914 up-regulated and 1,816 down-regulated) below the threshold of p-value < 0.1 were selected for subsequent analyses. A volcano plot of the DEGs is shown in Figure S1.
Construction of a Weighted Co-expression Network and Identification of Key Modules
After the first quality check using the WGCNA R package, no sample was removed from the subsequent analysis in GSE39653 (Figure S2). Here, the power of β = 4 (scale-free R2 = 0.98) was selected as the soft-thresholding to ensure a scale-free network (Figure 2). Then, 3,730 DEGs were divided into different gene modules according to the means of average linkage clustering, and a total of six gene modules (blue, brown, green, grey, turquoise, and yellow) were successfully identified in this study (Figure 3A). Furthermore, the correlations were calculated between the different gene modules and the disease status (MDD vs. control) mentioned above. Our results indicated that the module eigengene of the blue module showed the highest correlation among all six gene modules (R2 = 0.95, p-value = 5e−24) (Figure 3B). Thus, we ultimately identified the blue module as the most significant gene module associated with MDD, and the genes in the blue module were extracted for subsequent analyses.
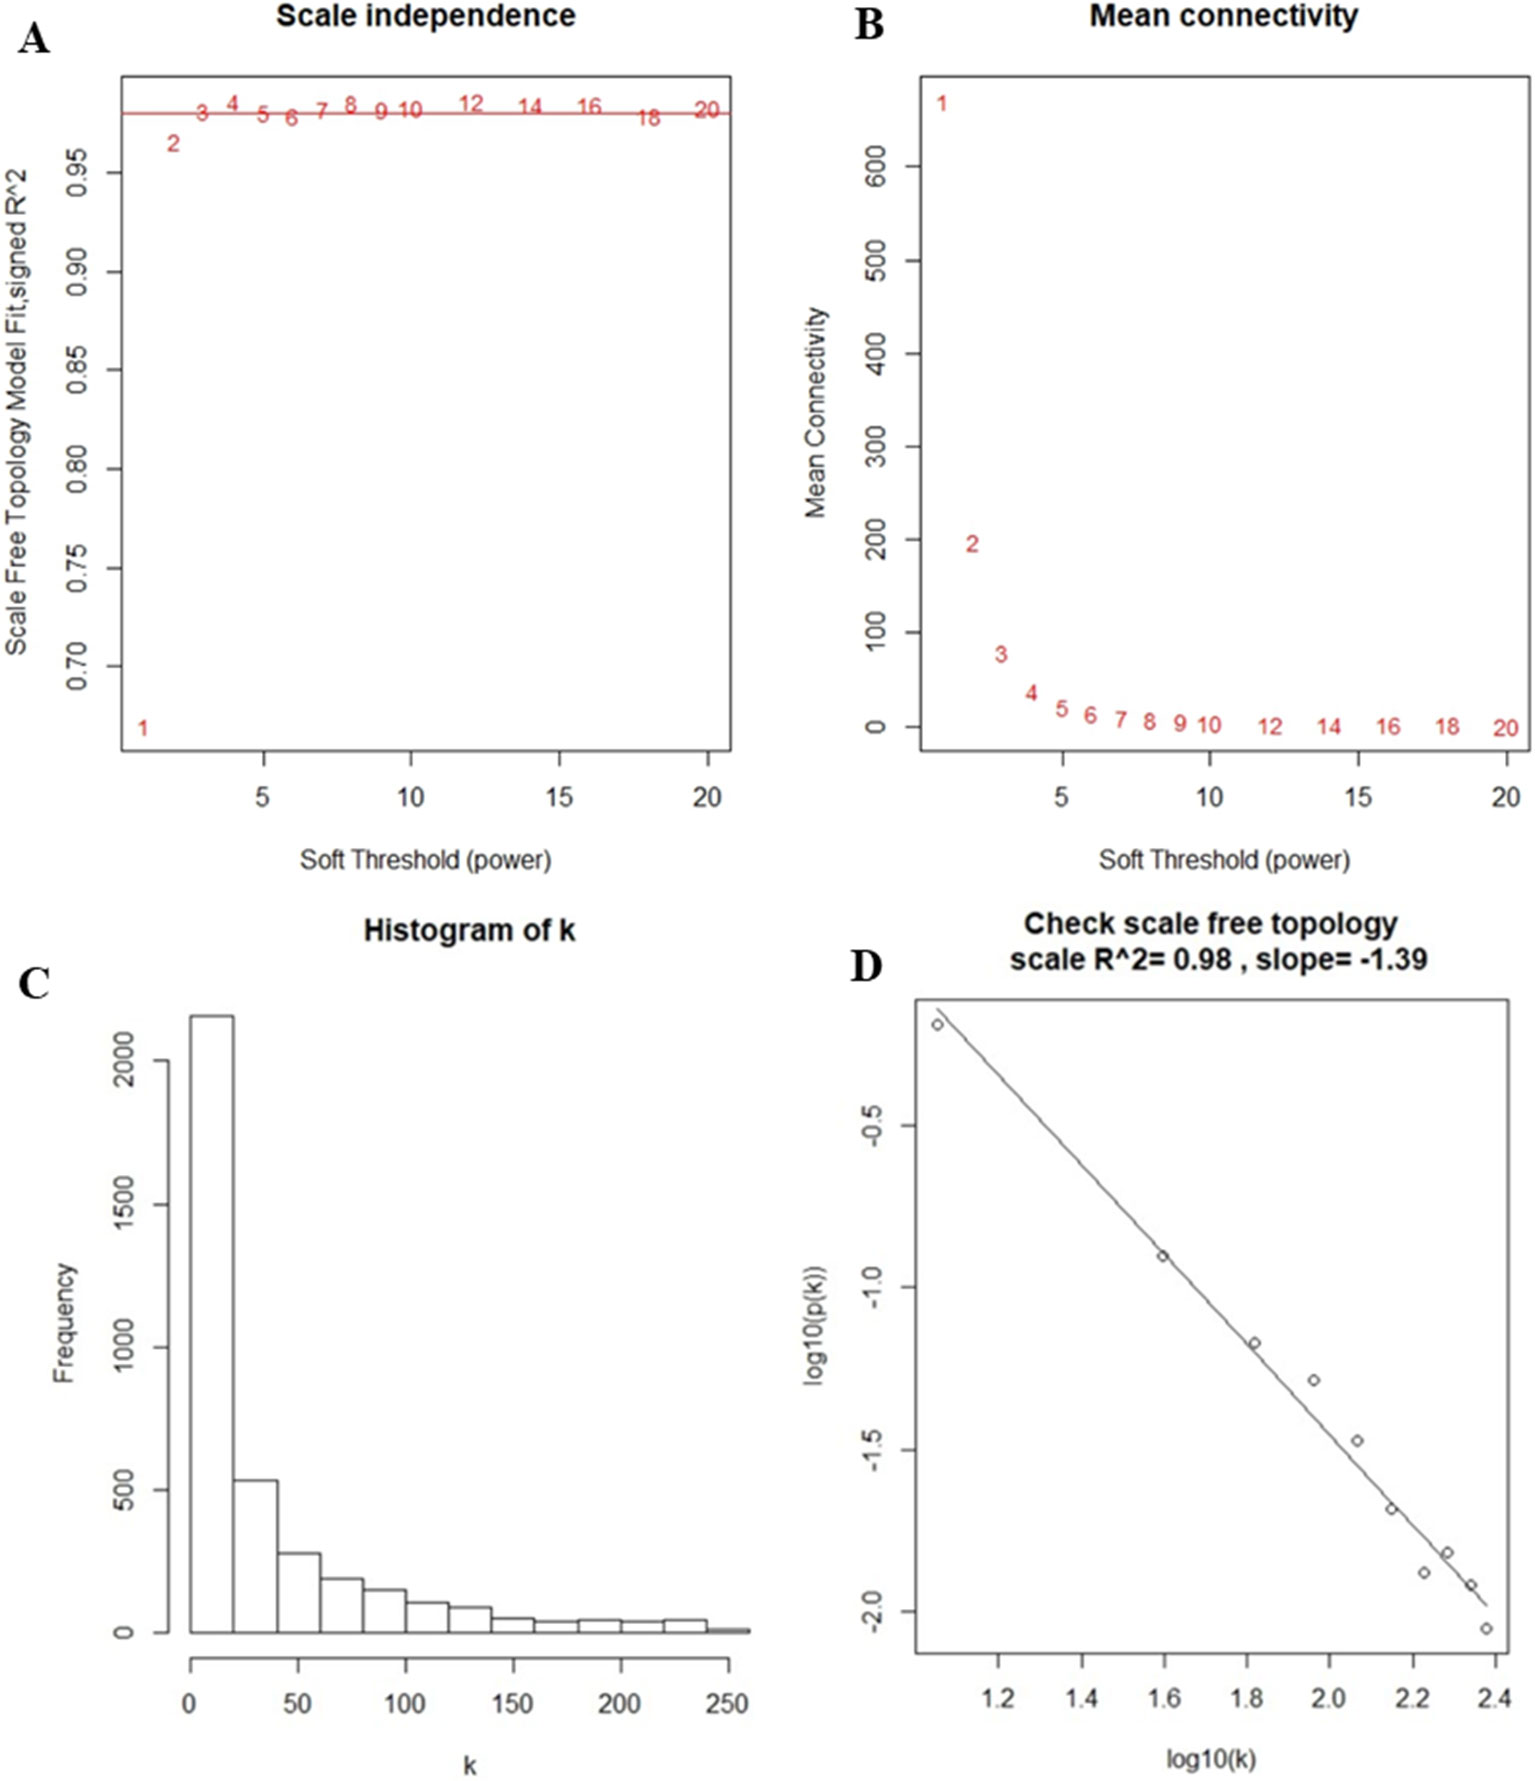
Figure 2 Determination of soft-thresholding power in the weighted gene co-expression network analysis. (A) Analysis of the scale-free fit index for different soft-thresholding powers (β). Numbers in the plots represent the corresponding soft-thresholding powers. The approximate scale-free topology can be obtained at a soft-thresholding power of 4. (B) Analysis of the mean connectivity for different soft-thresholding powers. (C) Histogram of connectivity distribution when β = 4. (D) Checking the scale-free topology when β = 4.
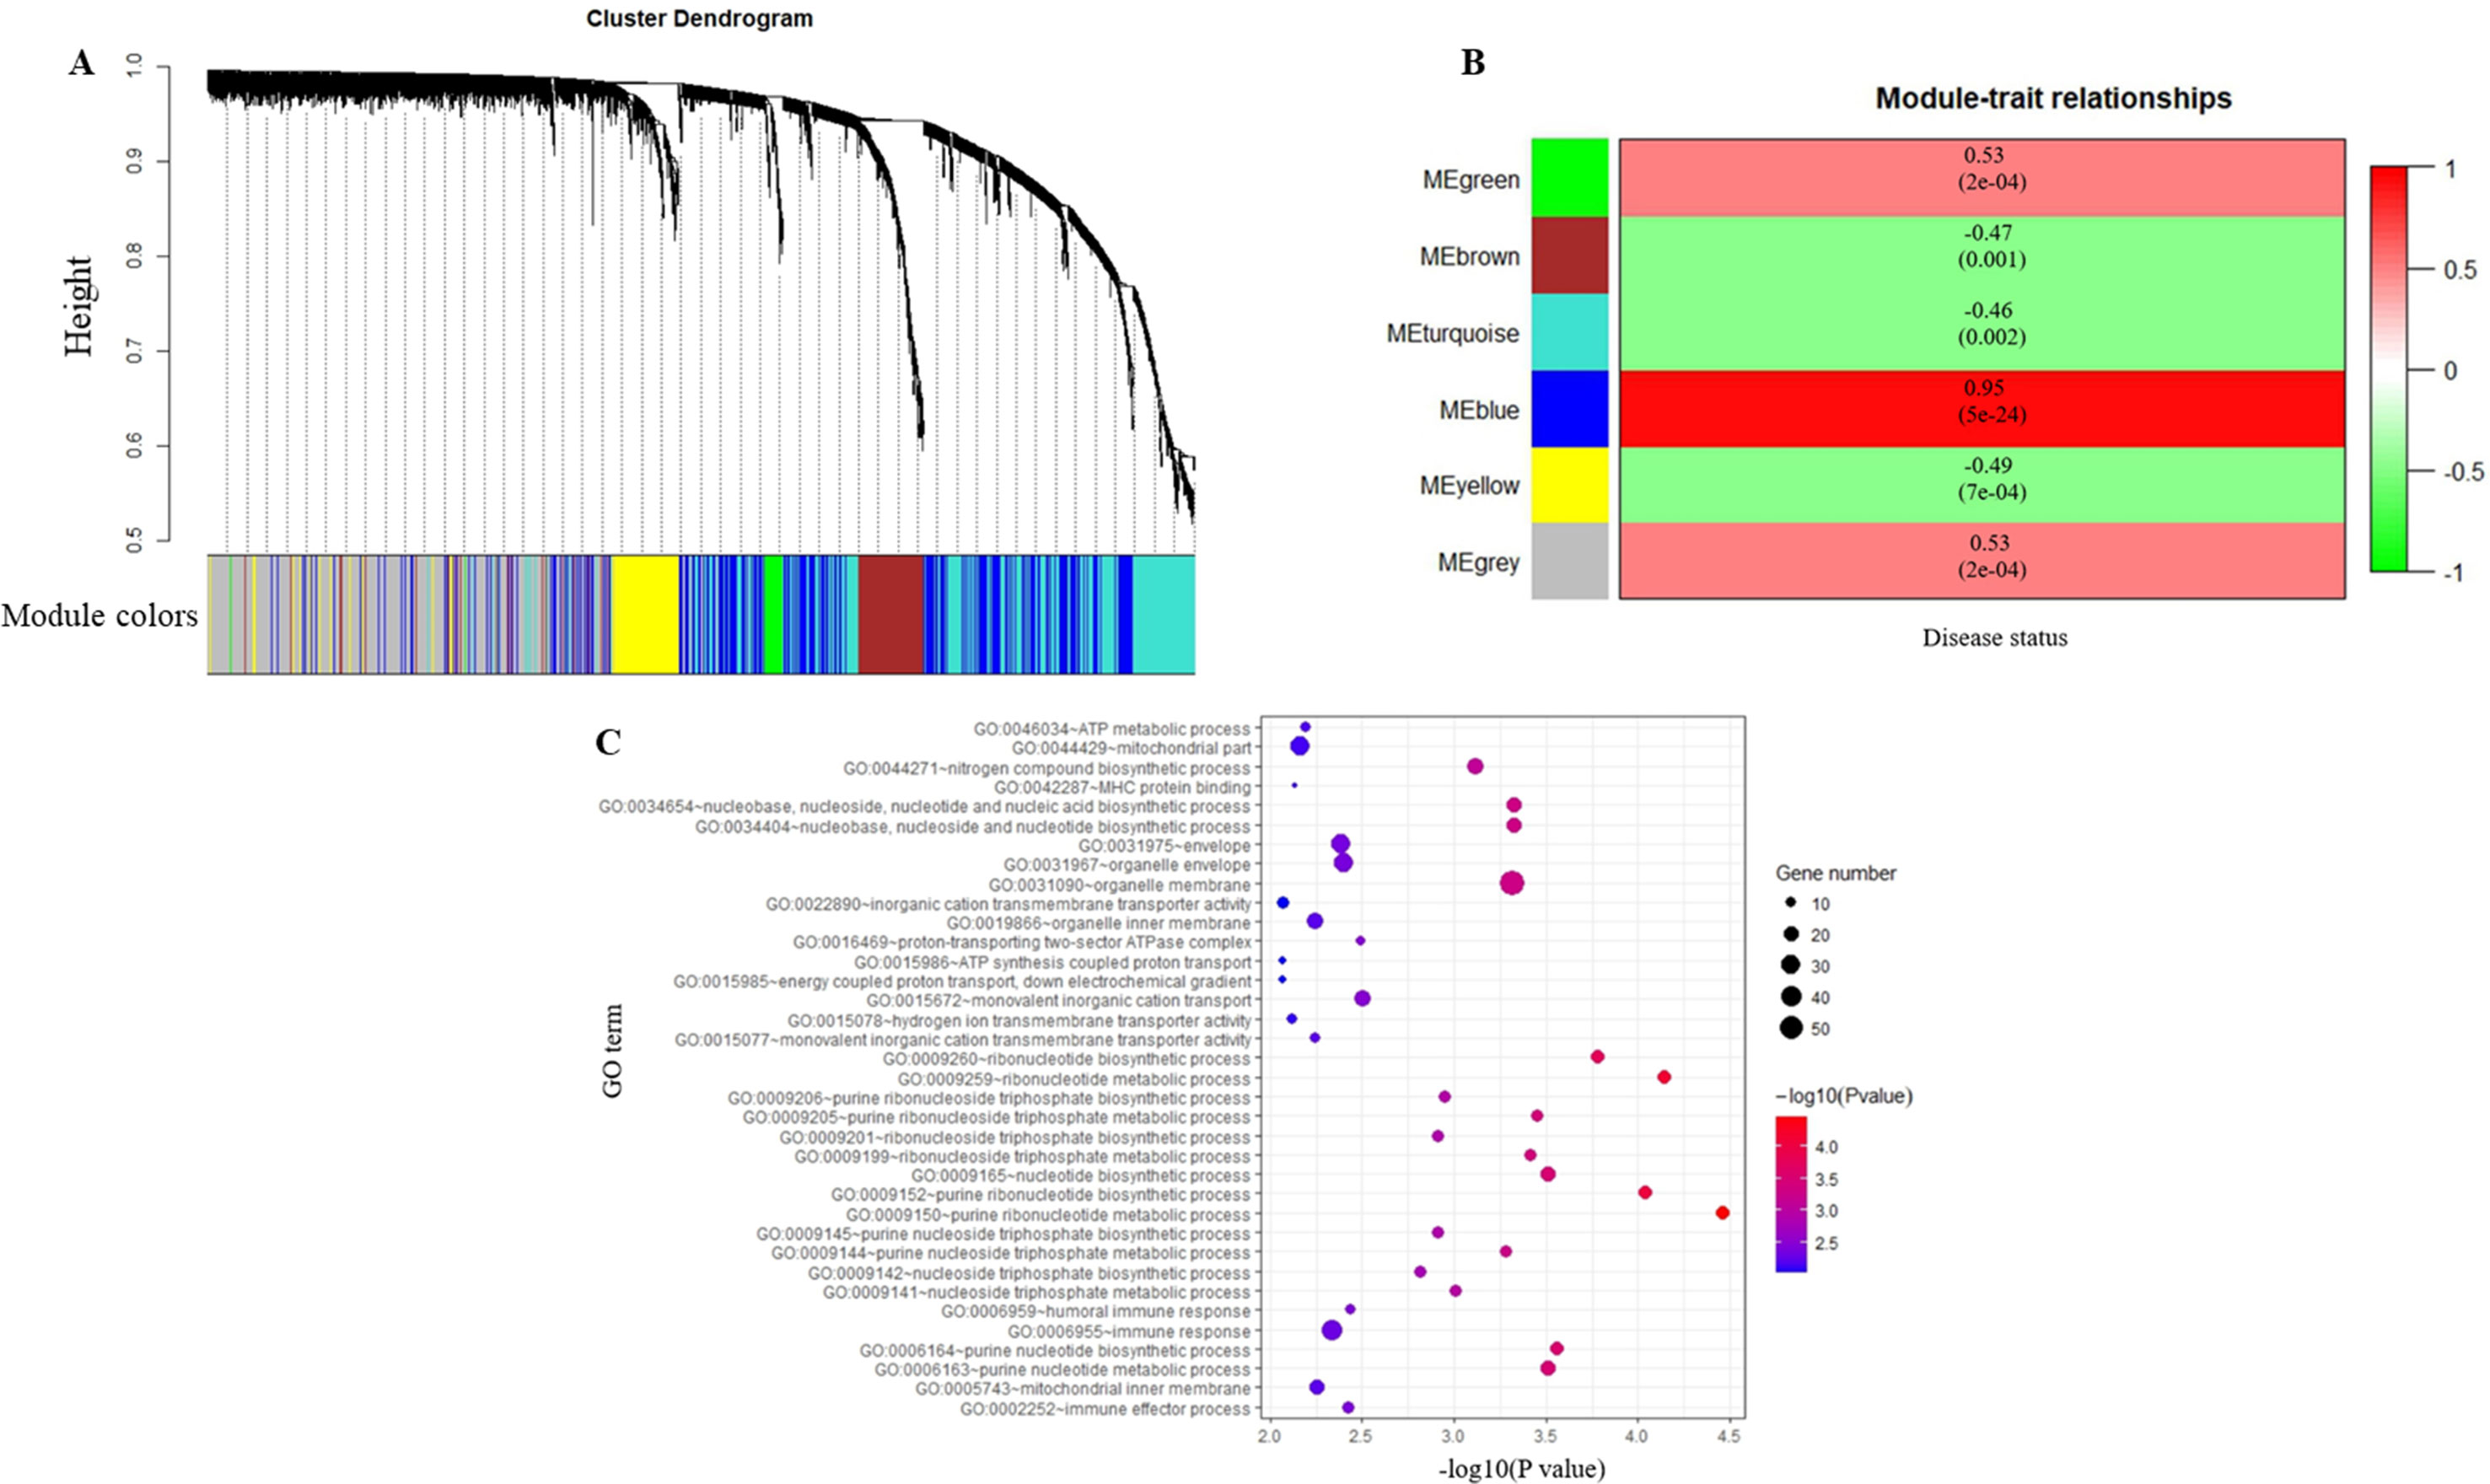
Figure 3 Identification of modules associated with major depressive disorder (MDD) and Gene Ontology analysis. (A) Dendrogram of all differentially expressed genes clustered based on a dissimilarity measure (1-TOM). (B) Heatmap of the correlation between module eigengenes and the disease status (MDD vs. control). Each cell contains the corresponding correlation and p-value. (C) Gene Ontology analysis of genes in the blue module.
Functional and Pathway Enrichment Analysis
To obtain further insight into the functions of the genes in the blue module, GO term and KEGG pathway analyses were performed in DAVID database. Most of the GO terms in the blue module were enriched in purine ribonucleotide metabolic and biosynthetic process, ribonucleotide metabolic and biosynthetic process, immune response, immune effector process, and adenosine triphosphate (ATP) synthesis (Table S1, Figure 3C). KEGG pathway analysis revealed that the genes in the blue module were mainly enriched in oxidative phosphorylation (p-value = 0.004). The data indicated that the genes highly associated with MDD were also the most important elements in this module.
Hub Gene Identification
A total of 64 genes that were highly connected to the blue module (MM > 0.8 and GS > 0.2) were identified as candidate hub genes (Table S2). Moreover, a PPI network was constructed for all genes in the blue module using Cytoscape according to the STRING database, and 49 genes in this PPI network were also taken as hub nodes (Figure 4). The five common hub genes (Von Hippel-Lindau tumor suppressor, VHL; ATP synthase membrane subunit c locus 1, ATP5G1; cytochrome c oxidase subunit 4I1, COX4I1; dolichyl-diphosphooligosaccharide-protein glycosyltransferase non-catalytic subunit, DDOST; and Bruton tyrosine kinase, BTK) between the co-expression network and PPI network were screened as “real” hub genes (Figure 5A, Table S2).
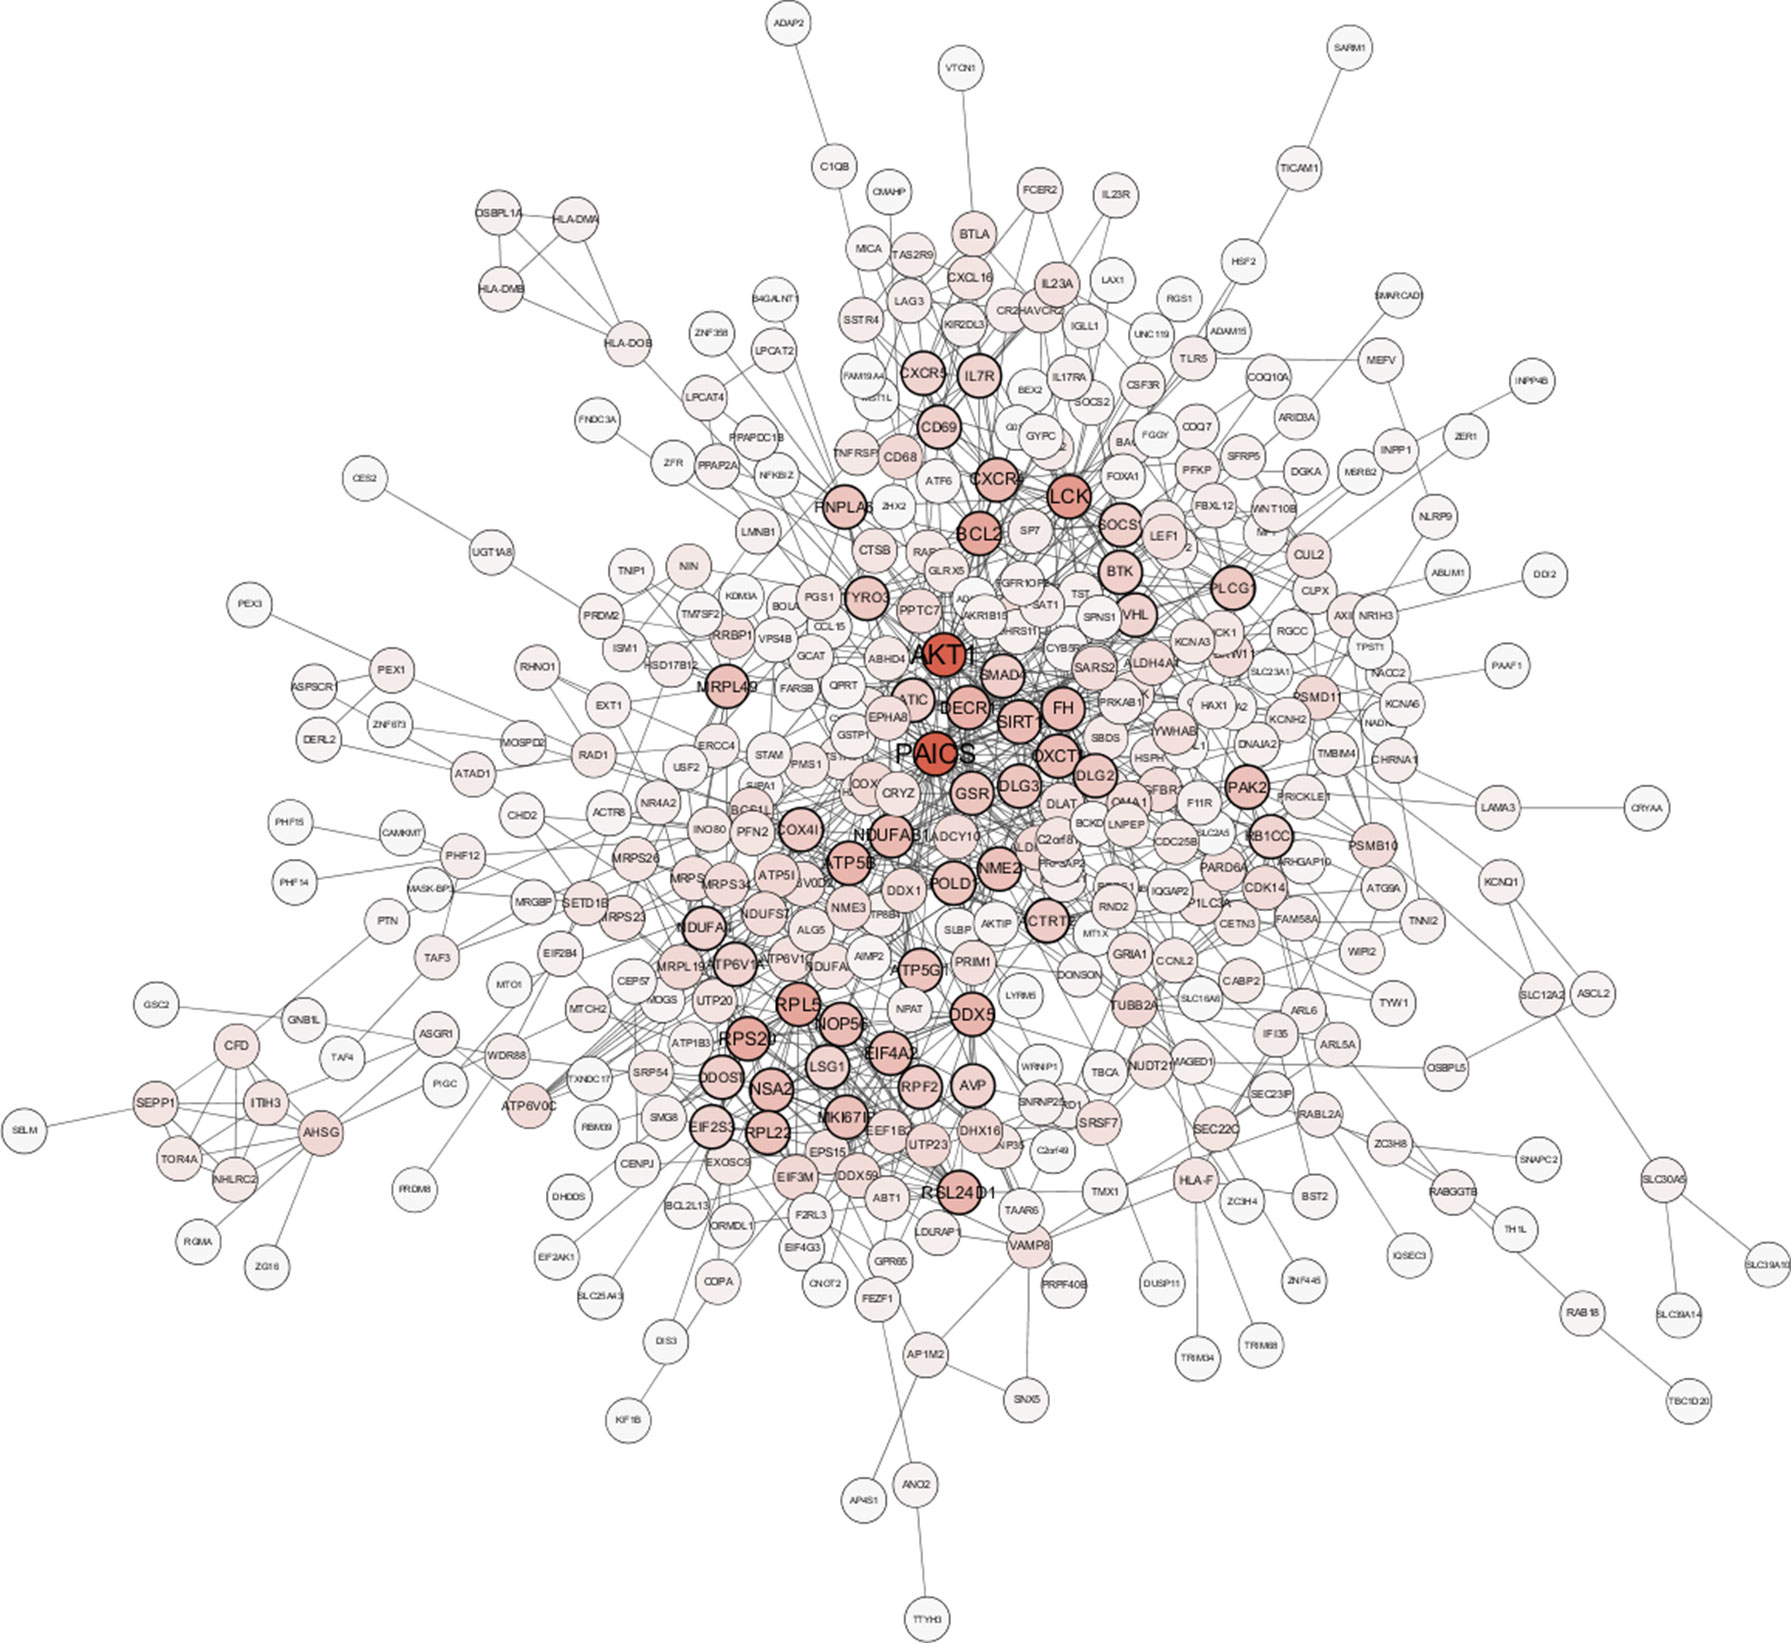
Figure 4 Protein–protein interaction network of genes in the blue module. The color intensity in each node is proportional to the number of edges for the node. The nodes with a bold circle indicate hub genes identified by the PPI network.
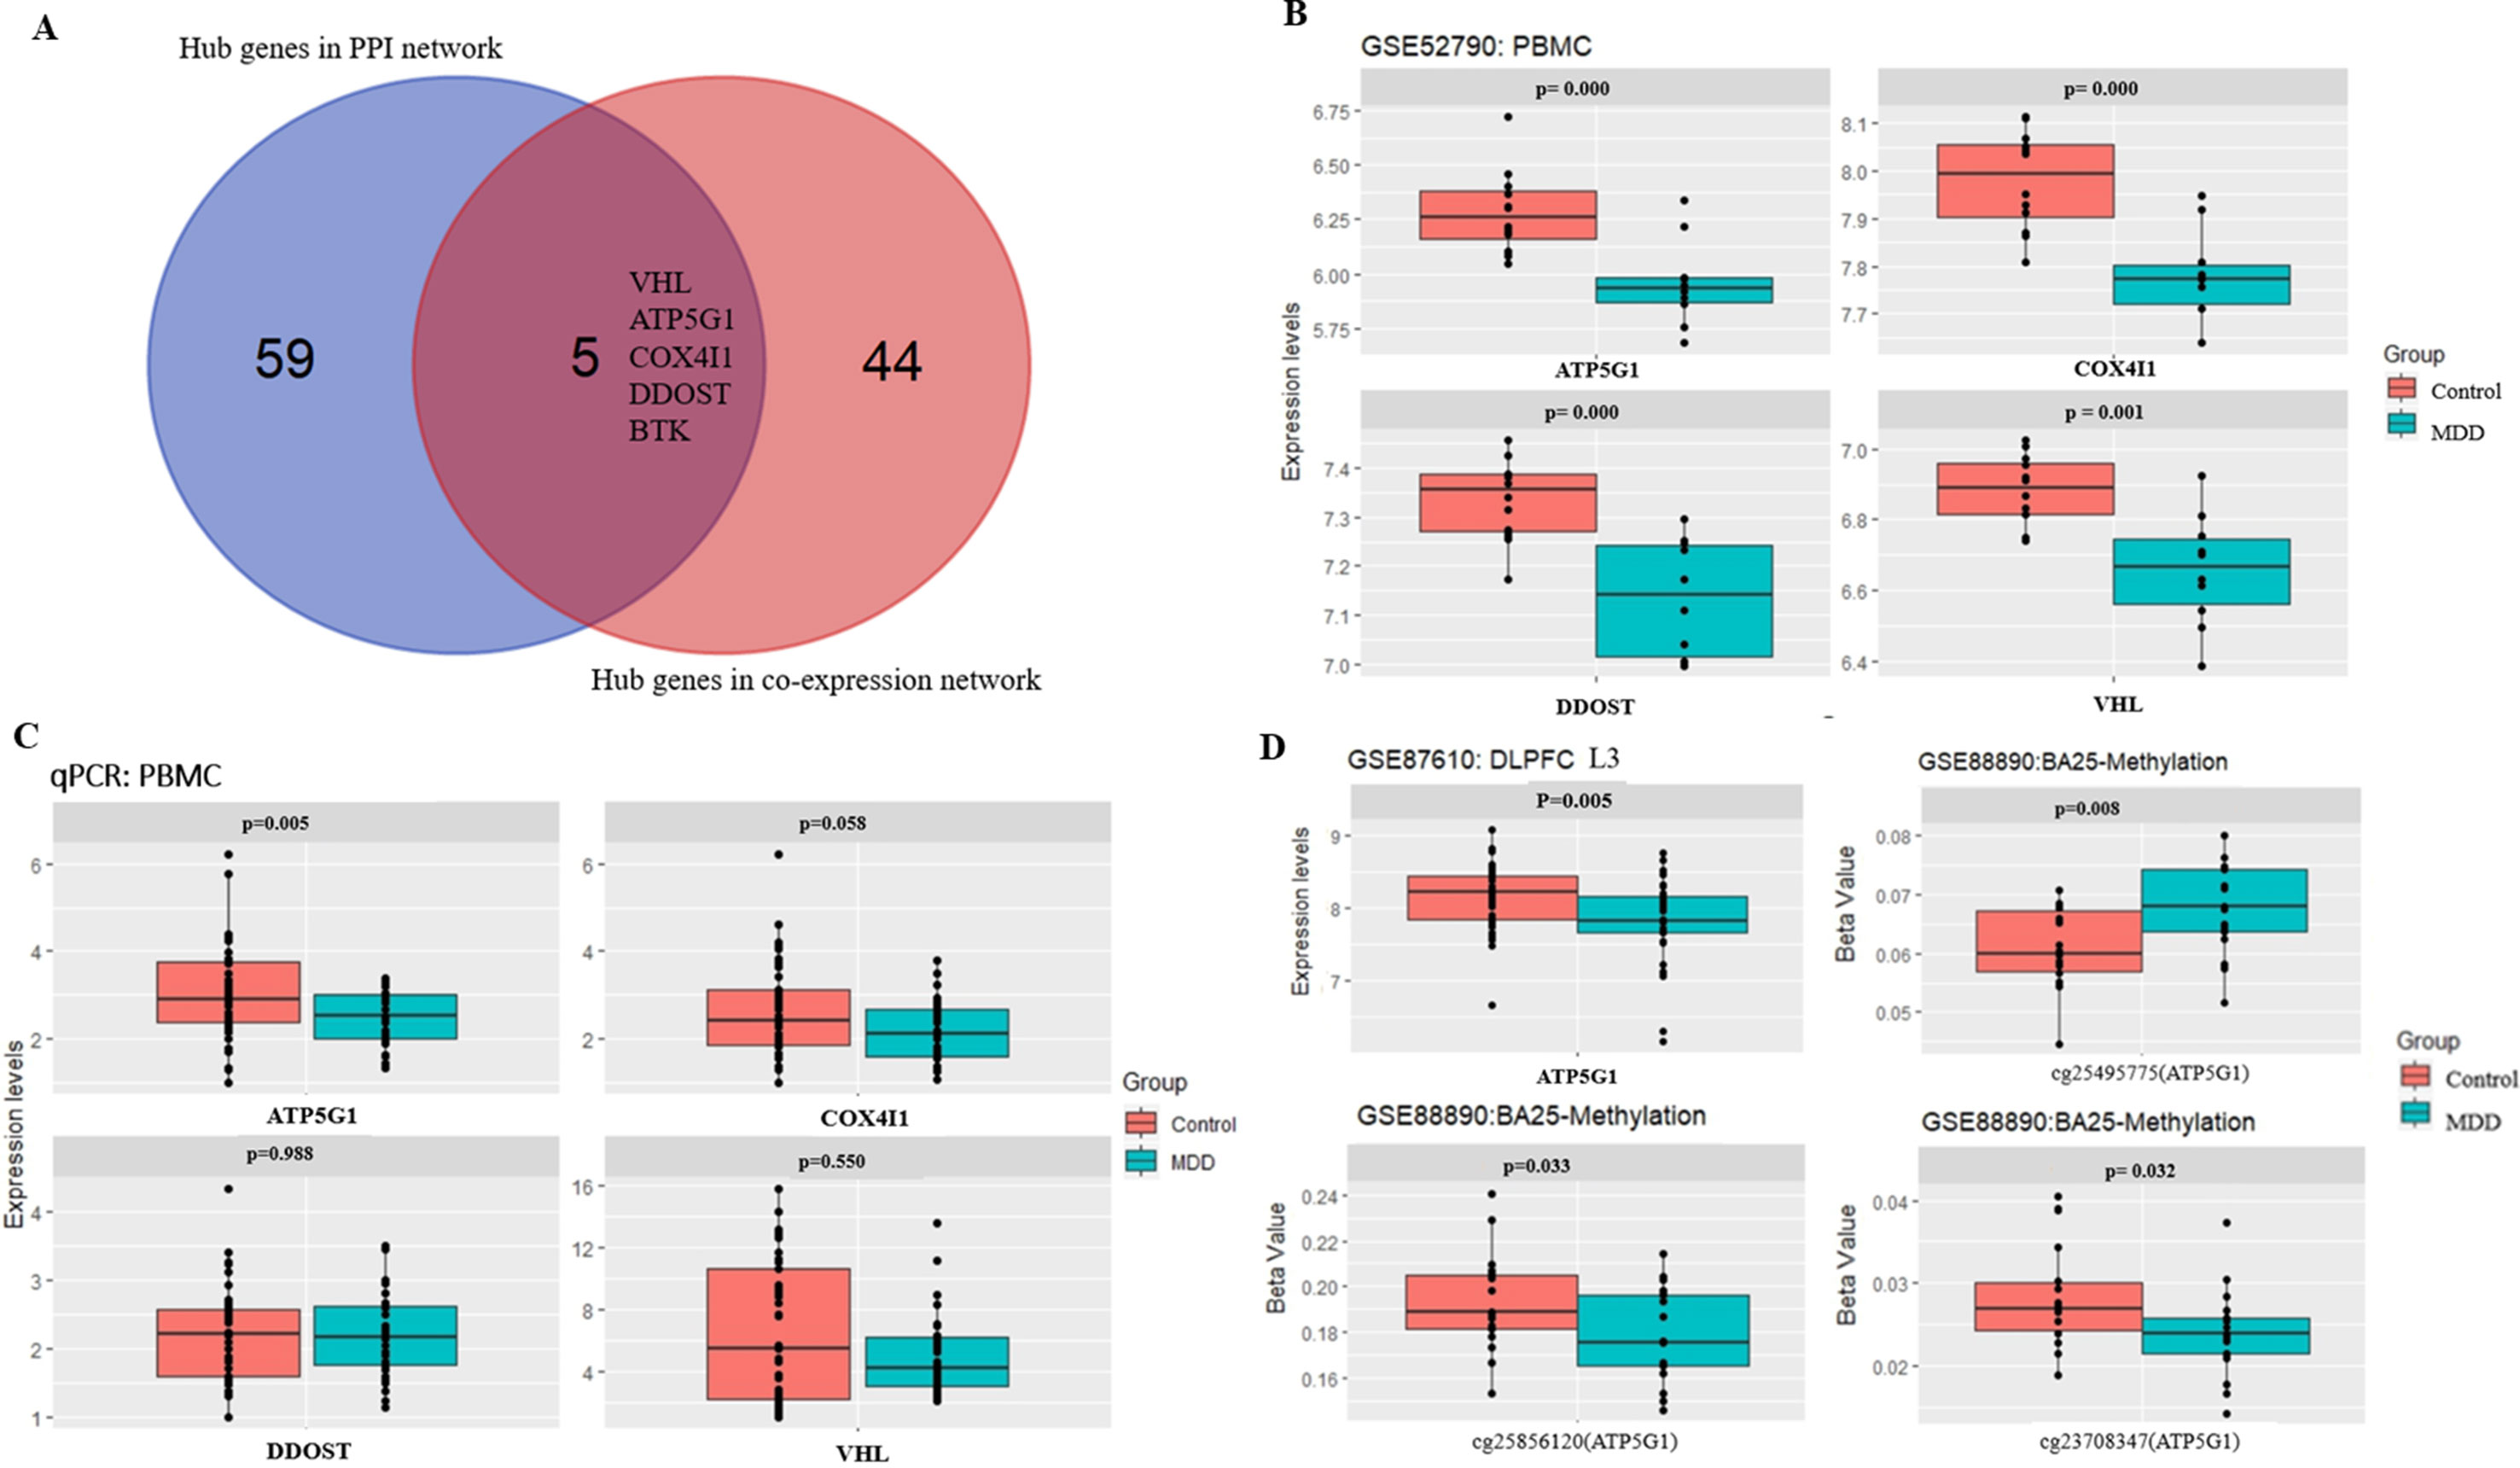
Figure 5 Hub gene detection and validation. (A) Selection of real hub genes in the PPI network and co-expression network. (B) The expression levels of the four genes (VHL, ATP5G1, COX4I1, and DDOST) were correlated with MDD (based on microarray data of GSE52790). (C) Relative expression levels of the four genes (VHL, ATP5G1, COX4I1, and DDOST) determined by real-time PCR. ATP5G1 was significantly down-regulated in samples from MDD patients compared with the control samples (p = 0.005). PCR, polymerase chain reaction. (D) The expression levels of ATP5G1 in L3 pyramidal neurons in the dorsolateral prefrontal cortex (DLPFC) (based on microarray data of GSE87610) and the methylation levels in BA25 (based on microarray data of GSE88890).
The five shared hub genes were chosen as the candidate genes for further validation. In the GSE52790 dataset, four genes were still significantly down-regulated in the MDD group compared with the control group (ATP5G1: t = −3.94, p-value = 0.0009; COX4I1: t = −4.66, p-value = 0.0002; DDOST: t = −4.52, p-value = 0.0004; VHL: t = −3.96, p-value = 0.0014), whereas BTK was not (p-value > 0.05) (Figure 5B).
qPCR Validation of the Four Hub Genes
To verify the main conclusion drawn from the microarray results, the relative expression levels of the four hub genes (VHL, ATP5G1, COX4I1, and DDOST) in PBMCs were determined using real-time PCR. The clinical characteristics of the participants and the expression levels of the four genes determined by qPCR are shown in Table 2. No significant difference in age was detected between MDD patients and healthy controls (38.48 ± 14.92 vs. 33.98 ± 11.60, t = 1.443, p-value = 0.153). In addition, there was no significant difference in gender distribution between MDD patients (15 males and 18 females) and healthy controls (15 males and 26 females) (χ2 = 0.597, p-value = 0.482). The RT-qPCR analysis results indicated that ATP5G1 was significantly down-regulated in samples from MDD patients compared with the control samples (t = −2.89, p-value = 0.005). However, there were no significant differences for the VHL, COX4I1, and DDOST genes between patients and controls (Table 2, Figure 5C).
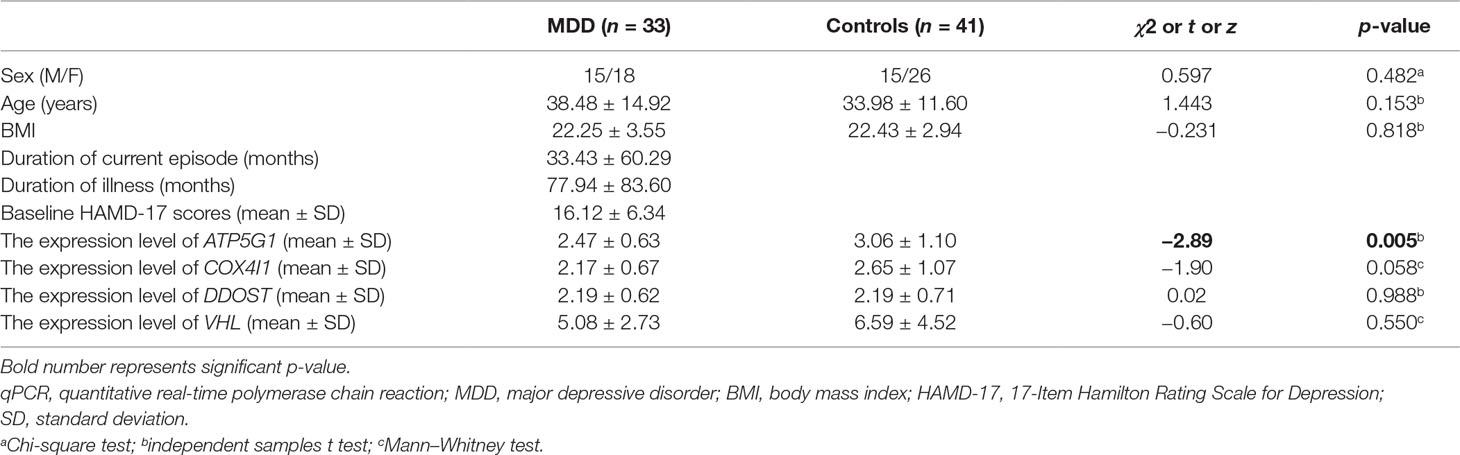
Table 2 Demographic and clinical characteristics of the participants in the qPCR experiment.
Expression of the ATP5G1 Gene in the Brain and Methylation Analysis
Considering that transcripts in PBMCs could reflect a portion of those expressed in brain tissues (Rollins et al., 2010), the ATP5G1 expression levels were also evaluated in the prefrontal cortex. When compared with those of the controls, the expression levels of ATP5G1 were down-regulated in L3 pyramidal neurons in the dorsolateral prefrontal cortex (z = −2.83, p-value = 0.005, Figure 5D). Furthermore, the relationship between the methylation levels of the ATP5G1 gene and MDD susceptibility was also explored using the GSE88890 dataset. In total, data from 35 BA25 (17 MDD and 18 controls) samples passed the quality control metrics and were used for the analysis. Notably, highly significant differentially methylated positions (DMPs) in the ATP5G1 gene were identified in the BA25: cg25495775 (t = 2.82, p-value = 0.008), cg25856120 (t = −2.23, p-value = 0.033), and cg23708347 (t = −2.24, p-value = 0.032) (Figure 5D).
Gene Set Enrichment Analysis (GSEA)
To identify potential the function of the hub gene, GSEA was conducted to identify KEGG pathways enriched in the samples in which ATP5G1 was highly expressed. The gene sets “nitrogen metabolism,” “lysine degradation,” “pyrimidine metabolism,” and “RNA polymerase” were enriched in MDD samples with high ATP5G1 expression (Figure 6).
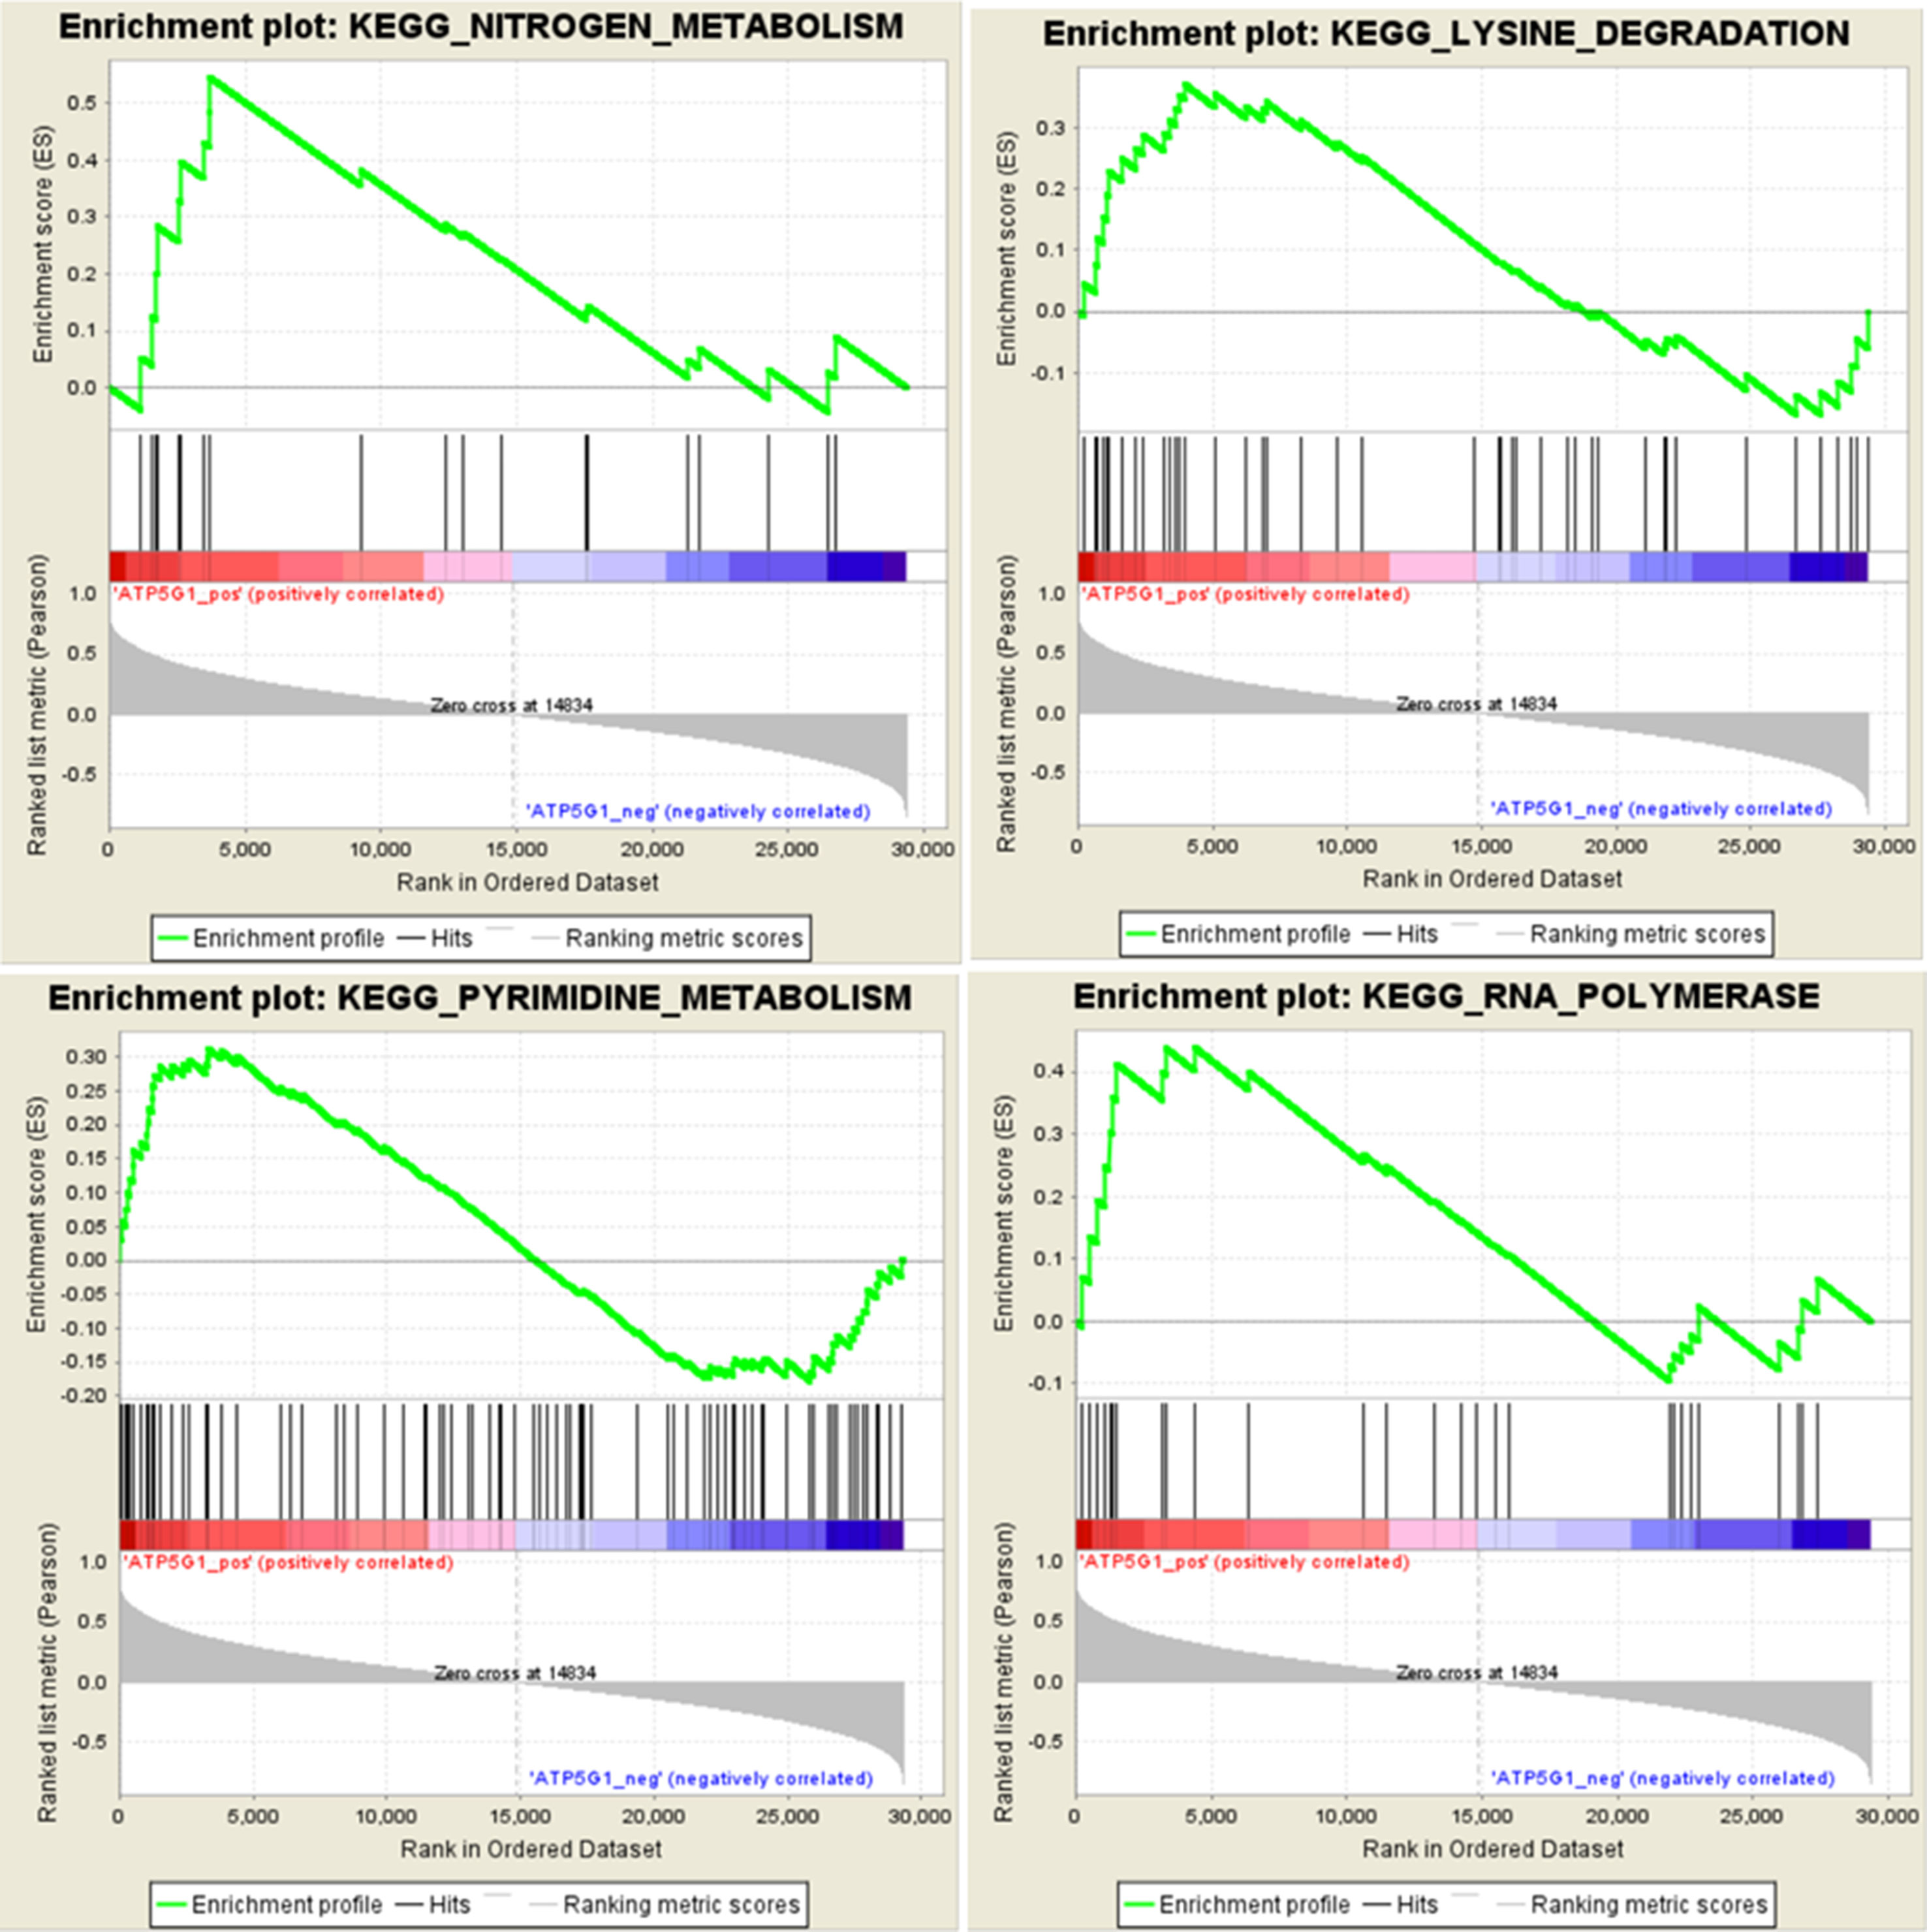
Figure 6 Gene set enrichment analysis (GSEA) for gene sets related to ATP5G1 expression. The gene sets of “NITROGEN_METABOLISM,” “LYSINE_DEGRADATION,” “PYRIMIDINE_METABOLISM,” and “RNA_POLYMERASE” were enriched in MDD samples in which ATP5G1 was highly expressed.
Discussion
In this study, WGCNA was performed to identify gene co-expression modules related to the pathogenesis of MDD. After a series of bioinformatics analyses, five hub genes common in both the co-expression network and PPI network were regarded as “real” hub genes. In another independent dataset, GSE52790, four genes (VHL, ATP5G1, COX4I1, and DDOST) were still significantly down-regulated in the MDD group compared with the control group. Furthermore, these four genes were validated by qRT-PCR in 33 MDD patients and 41 healthy controls. Overall, the qRT-PCR analysis showed that the ATP5G1 gene was significantly down-regulated in samples from MDD patients compared with the control samples. Moreover, this gene was significantly differentially expressed in the prefrontal cortex between patients and controls. In addition, highly significant DMPs were identified in the BA25, with probes in the ATP5G1 gene being significantly associated with MDD. These findings indicate that the ATP5G1 gene is associated with the pathogenesis of MDD and that it may be a peripheral biomarker for MDD.
ATP5G1, a key component of complex V of the oxidative phosphorylation chain, encodes a subunit of mitochondrial ATP synthase and catalyzes ATP synthesis (Vives-Bauza et al., 2010). Natera-Naranjo et al. found that the siRNA-mediated knock-down of axonal ATP5G1 mRNA resulted in a significant decrease in axonal ATP5G1 protein and ATP levels and an increase in the production of local reactive oxygen species (ROS) (Natera-Naranjo et al., 2012). Other lines of evidence also indicate that ATP5G1 is involved in the biological process of oxidative phosphorylation and might be associated with oxidative stress (Hu et al., 2009). Many studies have reported that oxidative stress was associated with MDD. Sarandol et al. found that MDD was associated with oxidative stress and that oxidative–antioxidative systems were not affected by 6 weeks of antidepressant treatment (Sarandol et al., 2007). Yanik et al. found that patients with major depression were exposed to oxidative stress and that the degree of oxidative stress could be used to reflect the severity of depression (Yanik et al., 2004). In addition, activated oxidative and nitrosative stress pathways may cause neurodegeneration through different mechanisms such as neuroinflammation and neurotoxic effects (Maes et al., 2011). Thus, we hypothesize that the ATP5G1 gene is associated with depression by partially influencing oxidative phosphorylation and oxidative stress.
In the present study, we screened the blue module related to MDD using WGCNA. KEGG pathway analysis revealed that the genes in the blue module were enriched mainly in oxidative phosphorylation. Moreover, most GO terms in the blue module were enriched in purine ribonucleotide metabolic and biosynthetic process. Actually, there is evidence that the ATP5G1 gene is involved in purine metabolism (Reyes et al., 2015). Many studies have showed that purine metabolism, the immune response, and oxidative phosphorylation were associated with MDD (Raedler, 2011; Tobe, 2013; Ali-Sisto et al., 2016). Kaddurah-Daouk et al. found that dysregulated metabolic activity of the purine cycle was associated with several MDD-related systemic responses such as increased pro-inflammatory and oxidative processes (Kaddurah-Daouk et al., 2011; Kaddurah-Daouk et al., 2013). Meanwhile, Niklasson et al. found a correlation between purine metabolite and monoamine metabolite levels in cerebrospinal fluid, which suggested the parallel metabolism of purines and monoamines in the brain (Niklasson et al., 1983). These data suggest that the ATP5G1 gene may be involved in the pathogenesis of depression by partially influencing purine metabolism.
Moreover, the gene set enrichment analysis revealed that the functions of the ATP5G1 gene were mainly enriched in terms related to nitrogen metabolism and lysine degradation. Therefore, we hypothesized that this gene was associated with the pathogenesis of MDD by possibly influencing amino acid metabolism. Abnormal amino acid metabolism may induce depression-like behaviors and stress vulnerability (Nagasawa et al., 2012). Ni et al. demonstrated that significant perturbations of metabolites, mainly involving amino acids, played an indispensable role in regulating neural activity in the brain in a rat model of chronic unpredictable mild stress (Ni et al., 2008). Mauri et al. found that plasma and platelet levels of amino acids tended to be higher in depressed patients, especially for lysine, than in healthy controls (Mauri et al., 1998). Ji et al. identified nitrogen metabolism as the most significant pathway associated with SSRI therapy outcome in MDD patients, with several metabolites that were significantly associated (Ji et al., 2011). In addition, the gene set of pyrimidine metabolism was also enriched in MDD samples in which ATP5G1 was highly expressed. Microarray analysis was used to show that pyrimidine metabolism played a key role in the pathophysiology of MDD (Gao et al., 2015). A recent study that integrated metabolomics and proteomics data reported that purine and pyrimidine metabolism pathways were relevant for the antidepressant treatment response (Park et al., 2017). These data indicate that the ATP5G1 gene may be associated with depression by influencing amino acid and pyrimidine metabolism.
In conclusion, the co-expression network analysis and qPCR validation results indicated that the ATP5G1 gene was significantly down-regulated in MDD patients compared with the controls. This study provides preliminary evidence that the ATP5G1 gene is associated with the pathogenesis of MDD and that it may serve as a peripheral biomarker for MDD.
Ethics Statement
The Institutional Review Board of Shanghai Mental Health Center approved the research protocol, and all participants provided written informed consent.
Author Contributions
Authors DZ and SH performed the statistical analyses and wrote the manuscript. Authors CM, YW, YX, and YS managed the literature searches and analyses. Authors NZ and XS were responsible for the diagnosis and clinical assessment of the participants. Author DW provided assistance for the laboratory work. Authors HL and YY offered much constructive advice on this study. All authors read and approved the final manuscript.
Conflict of Interest Statement
The authors declare that the research was conducted in the absence of any commercial or financial relationships that could be construed as a potential conflict of interest.
Acknowledgments
This study was supported by the Youth Scientific Research Project of Shanghai Municipal Commission of Health and Family Planning (20184Y0310), the Doctor Innovation Foundation of Shanghai Jiao Tong University School of Medicine (BXJ201955), the Collaborative Innovation Center for Translational Medicine at Shanghai Jiao Tong University School of Medicine (TM201506 and TM201624), National Major Project for IND (2018ZX09734005), Clinical Research Center, Shanghai Jiao Tong University School of Medicine (DLY201620), and the Programs Foundation of Shanghai Mental Health Center (2017-QH-02).
Supplementary Material
The Supplementary Material for this article can be found online at: https://www.frontiersin.org/articles/10.3389/fgene.2019.00703/full#supplementary-material
References
Ali-Sisto, T., Tolmunen, T., Toffol, E., Viinamaki, H., Mantyselka, P., Valkonen-Korhonen, M., et al. (2016). Purine metabolism is dysregulated in patients with major depressive disorder. Psychoneuroendocrinology 70, 25–32. doi: 10.1016/j.psyneuen.2016.04.017
Arion, D., Huo, Z., Enwright, J. F., Corradi, J. P., Tseng, G., Lewis, D. A. (2017). Transcriptome alterations in prefrontal pyramidal cells distinguish schizophrenia from bipolar and major depressive disorders. Biol. Psychiatry 82 (8), 594–600. doi: 10.1016/j.biopsych.2017.03.018
Christoffel, D. J., Golden, S. A., Russo, S. J. (2011). Structural and synaptic plasticity in stress-related disorders. Rev. Neurosci. 22 (5), 535–549. doi: 10.1515/RNS.2011.044
Fan, H. M., Sun, X. Y., Niu, W., Zhao, L., Zhang, Q. L., Li, W. S., et al. (2015). Altered microRNA expression in peripheral blood mononuclear cells from young patients with schizophrenia. J. Mol. Neurosci. 56 (3), 562–571. doi: 10.1007/s12031-015-0503-z
Farvolden, P., Kennedy, S. H., Lam, R. W. (2003). Recent developments in the psychobiology and pharmacotherapy of depression: optimising existing treatments and novel approaches for the future. Expert Opin. Investig. Drugs 12 (1), 65–86. doi: 10.1517/13543784.12.1.65
Fisar, Z., Raboch, J. (2008). Depression, antidepressants, and peripheral blood components. Neuro Endocrinol. Lett. 29 (1), 17–28.
Gao, L., Gao, Y., Xu, E., Xie, J. (2015). Microarray analysis of the major depressive disorder mRNA profile data. Psychiatry Investig. 12 (3), 388–396. doi: 10.4306/pi.2015.12.3.388
Gladkevich, A., Kauffman, H. F., Korf, J. (2004). Lymphocytes as a neural probe: potential for studying psychiatric disorders. Prog. Neuropsychopharmacol. Biol. Psychiatry 28 (3), 559–576. doi: 10.1016/j.pnpbp.2004.01.009
Goh, K. I., Cusick, M. E., Valle, D., Childs, B., Vidal, M., Barabasi, A. L. (2007). The human disease network. Proc. Natl. Acad. Sci. U. S. A. 104 (21), 8685–8690. doi: 10.1073/pnas.0701361104
Horvath, S., Dong, J. (2008). Geometric interpretation of gene coexpression network analysis. PLoS Comput. Biol. 4 (8), e1000117. doi: 10.1371/journal.pcbi.1000117
Hu, Y., Chen, X., Lin, H., Hu, Y., Mu, X. (2009). Study on the antiendotoxin action of Pulsatillae Decoction using an Affymetrix rat genome array. Cell. Immunol. 257 (1–2), 32–37. doi: 10.1016/j.cellimm.2009.02.003
Huang da, W., Sherman, B. T., Lempicki, R. A. (2009a). Bioinformatics enrichment tools: paths toward the comprehensive functional analysis of large gene lists. Nucleic Acids Res. 37 (1), 1–13. doi: 10.1093/nar/gkn923
Huang da, W., Sherman, B. T., Lempicki, R. A. (2009b). Systematic and integrative analysis of large gene lists using DAVID bioinformatics resources. Nat. Protoc. 4 (1), 44–57. doi: 10.1038/nprot.2008.211
Ji, Y., Hebbring, S., Zhu, H., Jenkins, G. D., Biernacka, J., Snyder, K., et al. (2011). Glycine and a glycine dehydrogenase (GLDC) SNP as citalopram/escitalopram response biomarkers in depression: pharmacometabolomics-informed pharmacogenomics. Clin. Pharmacol. Ther. 89 (1), 97–104. doi: 10.1038/clpt.2010.250
Kaddurah-Daouk, R., Bogdanov, M. B., Wikoff, W. R., Zhu, H., Boyle, S. H., Churchill, E., et al. (2013). Pharmacometabolomic mapping of early biochemical changes induced by sertraline and placebo. Transl. Psychiatry 3, e223. doi: 10.1038/tp.2012.142
Kaddurah-Daouk, R., Boyle, S. H., Matson, W., Sharma, S., Matson, S., Zhu, H., et al. (2011). Pretreatment metabotype as a predictor of response to sertraline or placebo in depressed outpatients: a proof of concept. Transl. Psychiatry 1, 1–7. doi: 10.1038/tp.2011.22
Langfelder, P., Horvath, S. (2008). WGCNA: an R package for weighted correlation network analysis. BMC Bioinformatics 9, 559. doi: 10.1186/1471-2105-9-559
Lee, B. H., Kim, Y. K. (2010). BDNF mRNA expression of peripheral blood mononuclear cells was decreased in depressive patients who had or had not recently attempted suicide. J. Affect. Disord. 125 (1–3), 369–373. doi: 10.1016/j.jad.2010.01.074
Leonard, B., Maes, M. (2012). Mechanistic explanations how cell-mediated immune activation, inflammation and oxidative and nitrosative stress pathways and their sequels and concomitants play a role in the pathophysiology of unipolar depression. Neurosci. Biobehav. Rev. 36 (2), 764–785. doi: 10.1016/j.neubiorev.2011.12.005
Maes, M., Galecki, P., Chang, Y. S., Berk, M. (2011). A review on the oxidative and nitrosative stress (O&NS) pathways in major depression and their possible contribution to the (neuro)degenerative processes in that illness. Prog. Neuropsychopharmacol. Biol. Psychiatry 35 (3), 676–692. doi: 10.1016/j.pnpbp.2010.05.004
Mason, M. J., Fan, G., Plath, K., Zhou, Q., Horvath, S. (2009). Signed weighted gene co-expression network analysis of transcriptional regulation in murine embryonic stem cells. BMC Genomics 10, 327. doi: 10.1186/1471-2164-10-327
Mauri, M. C., Ferrara, A., Boscati, L., Bravin, S., Zamberlan, F., Alecci, M., et al. (1998). Plasma and platelet amino acid concentrations in patients affected by major depression and under fluvoxamine treatment. Neuropsychobiology 37 (3), 124–129. doi: 10.1159/000026491
Murphy, T. M., Crawford, B., Dempster, E. L., Hannon, E., Burrage, J., Turecki, G., et al. (2017). Methylomic profiling of cortex samples from completed suicide cases implicates a role for PSORS1C3 in major depression and suicide. Transl. Psychiatry 7 (1), e989. doi: 10.1038/tp.2016.249
Murray, C. J., Lopez, A. D. (1997). Alternative projections of mortality and disability by cause 1990–2020: global burden of disease study. Lancet 349 (9064), 1498–1504. doi: 10.1016/S0140-6736(96)07492-2
Nagasawa, M., Ogino, Y., Kurata, K., Otsuka, T., Yoshida, J., Tomonaga, S., et al. (2012). Hypothesis with abnormal amino acid metabolism in depression and stress vulnerability in Wistar Kyoto rats. Amino Acids 43 (5), 2101–2111. doi: 10.1007/s00726-012-1294-y
Natera-Naranjo, O., Kar, A. N., Aschrafi, A., Gervasi, N. M., Macgibeny, M. A., Gioio, A. E., et al. (2012). Local translation of ATP synthase subunit 9 mRNA alters ATP levels and the production of ROS in the axon. Mol. Cell. Neurosci. 49 (3), 263–270. doi: 10.1016/j.mcn.2011.12.006
Ni, Y., Su, M., Lin, J., Wang, X., Qiu, Y., Zhao, A., et al. (2008). Metabolic profiling reveals disorder of amino acid metabolism in four brain regions from a rat model of chronic unpredictable mild stress. FEBS Lett. 582 (17), 2627–2636. doi: 10.1016/j.febslet.2008.06.040
Niklasson, F., Agren, H., Hallgren, R. (1983). Purine and monoamine metabolites in cerebrospinal fluid: parallel purinergic and monoaminergic activation in depressive illness? J. Neurol. Neurosurg. Psychiatr. 46 (3), 255–260. doi: 10.1136/jnnp.46.3.255
Park, D. I., Dournes, C., Sillaber, I., Ising, M., Asara, J. M., Webhofer, C., et al. (2017). Delineation of molecular pathway activities of the chronic antidepressant treatment response suggests important roles for glutamatergic and ubiquitin–proteasome systems. Transl. Psychiatry 7 (4), e1078. doi: 10.1038/tp.2017.39
Presson, A. P., Sobel, E. M., Papp, J. C., Suarez, C. J., Whistler, T., Rajeevan, M. S., et al. (2008). Integrated weighted gene co-expression network analysis with an application to chronic fatigue syndrome. BMC Syst. Biol. 2, 95. doi: 10.1186/1752-0509-2-95
Raedler, T. J. (2011). Inflammatory mechanisms in major depressive disorder. Curr. Opin. Psychiatry 24 (6), 519–525. doi: 10.1097/YCO.0b013e32834b9db6
Ravasz, E., Somera, A. L., Mongru, D. A., Oltvai, Z. N., Barabasi, A. L. (2002). Hierarchical organization of modularity in metabolic networks. Science 297 (5586), 1551–1555. doi: 10.1126/science.1073374
Reyes, J. M., Chitwood, J. L., Ross, P. J. (2015). RNA-Seq profiling of single bovine oocyte transcript abundance and its modulation by cytoplasmic polyadenylation. Mol. Reprod. Dev. 82 (2), 103–114. doi: 10.1002/mrd.22445
Ritchie, M. E., Phipson, B., Wu, D., Hu, Y., Law, C. W., Shi, W., et al. (2015). limma powers differential expression analyses for RNA-sequencing and microarray studies. Nucleic Acids Res. 43 (7), e47. doi: 10.1093/nar/gkv007
Rocc, P., De Leo, C., Eva, C., Marchiaro, L., Milani, A. M., Musso, R., et al. (2002). Decrease of the D4 dopamine receptor messenger RNA expression in lymphocytes from patients with major depression. Prog. Neuropsychopharmacol. Biol. Psychiatry 26 (6), 1155–1160. doi: 10.1016/S0278-5846(02)00253-1
Rollins, B., Martin, M. V., Morgan, L., Vawter, M. P. (2010). Analysis of whole genome biomarker expression in blood and brain. Am. J. Med. Genet. B Neuropsychiatr. Genet. 153b (4), 919–936. doi: 10.1002/ajmg.b.31062
Sarandol, A., Sarandol, E., Eker, S. S., Erdinc, S., Vatansever, E., Kirli, S. (2007). Major depressive disorder is accompanied with oxidative stress: short-term antidepressant treatment does not alter oxidative–antioxidative systems. Hum. Psychopharmacol. 22 (2), 67–73. doi: 10.1002/hup.829
Savitz, J., Frank, M. B., Victor, T., Bebak, M., Marino, J. H., Bellgowan, P. S., et al. (2013). Inflammation and neurological disease-related genes are differentially expressed in depressed patients with mood disorders and correlate with morphometric and functional imaging abnormalities. Brain Behav. Immun. 31, 161–171. doi: 10.1016/j.bbi.2012.10.007
Shannon, P., Markiel, A., Ozier, O., Baliga, N. S., Wang, J. T., Ramage, D., et al. (2003). Cytoscape: a software environment for integrated models of biomolecular interaction networks. Genome Res. 13 (11), 2498–2504. doi: 10.1101/gr.1239303
Shelton, R. C., Claiborne, J., Sidoryk-Wegrzynowicz, M., Reddy, R., Aschner, M., Lewis, D. A., et al. (2011). Altered expression of genes involved in inflammation and apoptosis in frontal cortex in major depression. Mol. Psychiatry 16 (7), 751–762. doi: 10.1038/mp.2010.52
Subramanian, A., Tamayo, P., Mootha, V. K., Mukherjee, S., Ebert, B. L., Gillette, M. A., et al. (2005). Gene set enrichment analysis: a knowledge-based approach for interpreting genome-wide expression profiles. Proc. Natl. Acad. Sci. U. S. A. 102 (43), 15545–15550. doi: 10.1073/pnas.0506580102
Szklarczyk, D., Morris, J. H., Cook, H., Kuhn, M., Wyder, S., Simonovic, M., et al., (2017). The STRING database in 2017: quality-controlled protein-protein association networks, made broadly accessible. Nucleic Acids Res. 45 (D1), D362–D368. doi: 10.1093/nar/gkw937
Tavazoie, S., Hughes, J. D., Campbell, M. J., Cho, R. J., Church, G. M. (1999). Systematic determination of genetic network architecture. Nat. Genet. 22 (3), 281–285. doi: 10.1038/10343
Tobe, E. H. (2013). Mitochondrial dysfunction, oxidative stress, and major depressive disorder. Neuropsychiatr. Dis. Treat. 9, 567–573. doi: 10.2147/NDT.S44282
Tochigi, M., Iwamoto, K., Bundo, M., Sasaki, T., Kato, N., Kato, T. (2008). Gene expression profiling of major depression and suicide in the prefrontal cortex of postmortem brains. Neurosci. Res. 60 (2), 184–191. doi: 10.1016/j.neures.2007.10.010
Tsai, S. J. (2006). The possible role of tissue-type plasminogen activator and the plasminogen system in the pathogenesis of major depression. Med. Hypotheses 66 (2), 319–322. doi: 10.1016/j.mehy.2005.10.009
Vives-Bauza, C., Magrane, J., Andreu, A. L., Manfredi, G. (2010). Novel role of ATPase subunit C targeting peptides beyond mitochondrial protein import. Mol. Biol. Cell 21 (1), 131–139. doi: 10.1091/mbc.e09-06-0483
Yanik, M., Erel, O., Kati, M. (2004). The relationship between potency of oxidative stress and severity of depression. Acta Neuropsychiatr. 16 (4), 200–203. doi: 10.1111/j.0924-2708.2004.00090.x
Keywords: weighted gene co-expression network analysis, major depressive disorder, ATP5G1, oxidative stress, biomarker
Citation: Zeng D, He S, Ma C, Wen Y, Xie Y, Zhao N, Sun X, Wang D, Shen Y, Yu Y and Li H (2019) Co-Expression Network Analysis Revealed That the ATP5G1 Gene Is Associated With Major Depressive Disorder. Front. Genet. 10:703. doi: 10.3389/fgene.2019.00703
Received: 10 August 2018; Accepted: 03 July 2019;
Published: 02 August 2019.
Edited by:
Graziano Pesole, University of Bari Aldo Moro, ItalyReviewed by:
Lionel Muller Igaz, University of Buenos Aires, ArgentinaKerang Zhang, First Hospital of Shanxi Medical University, China
Copyright © 2019 Zeng, He, Ma, Wen, Xie, Zhao, Sun, Wang, Shen, Yu and Li. This is an open-access article distributed under the terms of the Creative Commons Attribution License (CC BY). The use, distribution or reproduction in other forums is permitted, provided the original author(s) and the copyright owner(s) are credited and that the original publication in this journal is cited, in accordance with accepted academic practice. No use, distribution or reproduction is permitted which does not comply with these terms.
*Correspondence: Huafang Li, bGhsaF81QDE2My5jb20=; Yimin Yu, MTM5MDE4NTY0OTJAMTYzLmNvbQ==
†These authors have contributed equally to this work.