 Yi-Shao Li
 Kai-Ming Shih1†
 Chung-Te Chang
 Shih-Ying Hwang
- 1School of Life Science, National Taiwan Normal University, Taipei, Taiwan
- 2Department of Life Science, Tunghai University, Taichung, Taiwan
- 3Division of Silviculture, Taiwan Forestry Research Institute, Taipei, Taiwan
Populations can be genetically isolated by differences in their ecology or environment that hampered efficient migration, or they may be isolated solely by geographic distance. Moreover, mountain ranges across a species’ distribution area might have acted as barriers to gene flow. Genetic variation was quantified using amplified fragment length polymorphism (AFLP) and 13 selective amplification primer combinations used generated a total of 482 fragments. Here, we tested the barrier effects of mountains on gene flow and environmentally dependent local adaptation of Cunninghamia konishii occur in Taiwan. A pattern of genetic isolation by distance was not found and variation partitioning revealed that environment explained a relatively larger proportion of genetic variation than geography. The effect of mountains as barriers to genetic exchange, despite low population differentiation indicating a high rate of gene flow, was found within the distribution range of C. konishii. Twelve AFLP loci were identified as potential selective outliers using genome-scan methods (BAYESCAN and DFDIST) and strongly associated with environmental variables using regression approaches (LFMM, Samβada, and rstanarm) demonstrating adaptive divergence underlying local adaptation. Annual mean temperature, annual precipitation, and slope could be the most important environmental factors causally associated with adaptive genetic variation in C. konishii. The study revealed the existence of physical barriers to current gene flow and environmentally dependent adaptive divergence, and a significant proportion of the rate of gene flow may represent a reflection of demographic history.
Introduction
Understanding connectivity among populations and pattern of gene flow has been important for deciphering how species adapt in response to environments and has clear practical implications for conservation of forest genetic resources (Allendorf et al., 2010; Aitken and Bemmels, 2016). Low levels of population genetic differentiation are commonly found in coniferous species due to efficient gene flow based on paternally inherited plastid DNA (ptDNA) variation (Neale et al., 1991; Hipkins et al., 1994; Hwang et al., 2003) and biparentally inherited molecular markers, such as allozyme (Hamrick et al., 1992; Lin et al., 1993; Hamrick and Godt, 1996; Lin et al., 1998). Although gene flow maintains genetic diversity and is critical to population resilience and persistence (Allendorf et al., 2013), high rate of gene flow among closely related sexual populations can preclude local adaptation by eroding divergence driven by natural selection due to the homogenizing effect of dispersing individuals mating among populations (García-Ramos and Kirkpatrick, 1997), resulting in no population adaptive divergence (Li et al., 2018). Nevertheless, selection invoked by environmental heterogeneity can counteract the effect of gene flow (Lenormand, 2002). The failure of detecting variation under selection might have also related to past demographic histories and stochastic mechanisms (Lande, 1988; Wang et al., 2017). It is likely that the balance between migration and selection is species dependent and is related to the realized ecological niche where species can tolerate in response to ecological factors (Pulliam, 2000; Bruno et al., 2003).
The accumulation of genetic variation can provide as raw materials for evolutionary potential under natural selection (Petit and Hampe, 2006; Barrett and Schluter, 2008). The investigation involved orthologous coding sequences in gymnosperms and angiosperms showed that the average synonymous mutation rate was found to be higher in angiosperms in contrast to gymnosperms (Buschiazzo et al., 2012). However, the rate of nonsynonymous substitutions in protein-coding genes was found to be higher in conifers compared with angiosperms suggesting that conifers harbored higher number of fixed adaptive mutations than angiosperms (Buschiazzo et al., 2012), and it is common to observe population local adaptation of conifers in response to environmental heterogeneity (e.g., Mimura and Aitken, 2010; Grivet et al., 2011; Chen et al., 2012; Fang et al., 2013; Shih et al., 2018). However, no adaptive genetic divergence between populations of Taiwania cryptomerioides occurring in Taiwan was detected probably due to random neutral drift because of the high rate of gene flow among populations that eroded the adaptive local mutations (Li et al., 2018).
Natural selection driven by ecological factors will result in the development of ecological adaptation and divergence, and selection can act on genetic variation (e.g., Holderegger et al., 2008; Chen et al., 2012; Fang et al., 2013). Genetic variation in natural populations of a species can be quantified using methods involving next-generation sequencing (NGS), such as restriction site-associated sequencing (Shih et al., 2018). Although less powerful than NGS technologies, amplified fragment length polymorphism (AFLP) is an efficient approach allows generation of hundreds of molecular markers from genome sequences of nonmodel organisms to identify candidate genetic variation involved in adaptive evolution that derived from DNA sequence variation (Holderegger et al., 2008; Chen et al., 2012; Fang et al., 2013).
Cunninghamia konishii Hayata (Cupressaceae) is a coniferous species disjunctly distributed in northern and central Taiwan and along part of the border between Vietnam and Lao People’s Democratic Republic (Nga et al., 2016; http://threatenedconifers.rbge.org.uk/taxa/details/cunninghamia-konishii). C. konishii is closely related to Cunninghamia lanceolata (Lamb). Hook. distributed in mainland China (Lin et al., 1998; Chung et al., 2004) and it may represent a montane form rather than a distinct species (http://threatenedconifers.rbge.org.uk/taxa/details/cunninghamia-konishii). In Taiwan, C. konishii is a dominant species among other conifers associated mainly with Chamaecyparis, Pinus spp., and Pseudotsuga wilsoniana at elevations of 1,300–2,800 m (Liu, 1966). Human interferences have greatly impacted this species, e.g., a pure stand of C. konishii(ca. 60 hectares) in Shiangshanshan, Hsinchu County, northwest Taiwan, was entirely vanished by logging. Low level of population differentiation was revealed for C. konishii based on allozyme (Lin et al., 1998) and ptDNA (Hwang et al., 2003). However, Chung et al. (2004) found high level of genetic differentiation among C. konishii populations based on 357 AFLP markers derived from three AFLP selective amplification primer pairs. Populations of C. konishii are separated not only by major mountain ranges including the Hsuehshan Mountain Range (HMR) and the Central Mountain Range (CMR) trending from north to south, but also by mountains in between of the HMR and the CMR (Figure 1). Mountains were revealed to be the third important factor, after tectonics and climate, as a physical barrier to dispersal in the biogeographic differentiation of a species (Antonelli, 2017). It is likely that mountains may have had an active role in population dispersal of C. konishii. In addition, the relationship between genetic variation in C. konishii and environmental variables implying local adaptation has not been tested. Investigation assesses the association of genetic variation with environment is important for the conservation program because identification of environmentally dependent ecotypes can be crucial in the assisted migration program of C. konishii, particularly in the face of global climate change (Aitken et al., 2008; Aitken and Whitlock, 2013; Aitken and Bemmels, 2016).
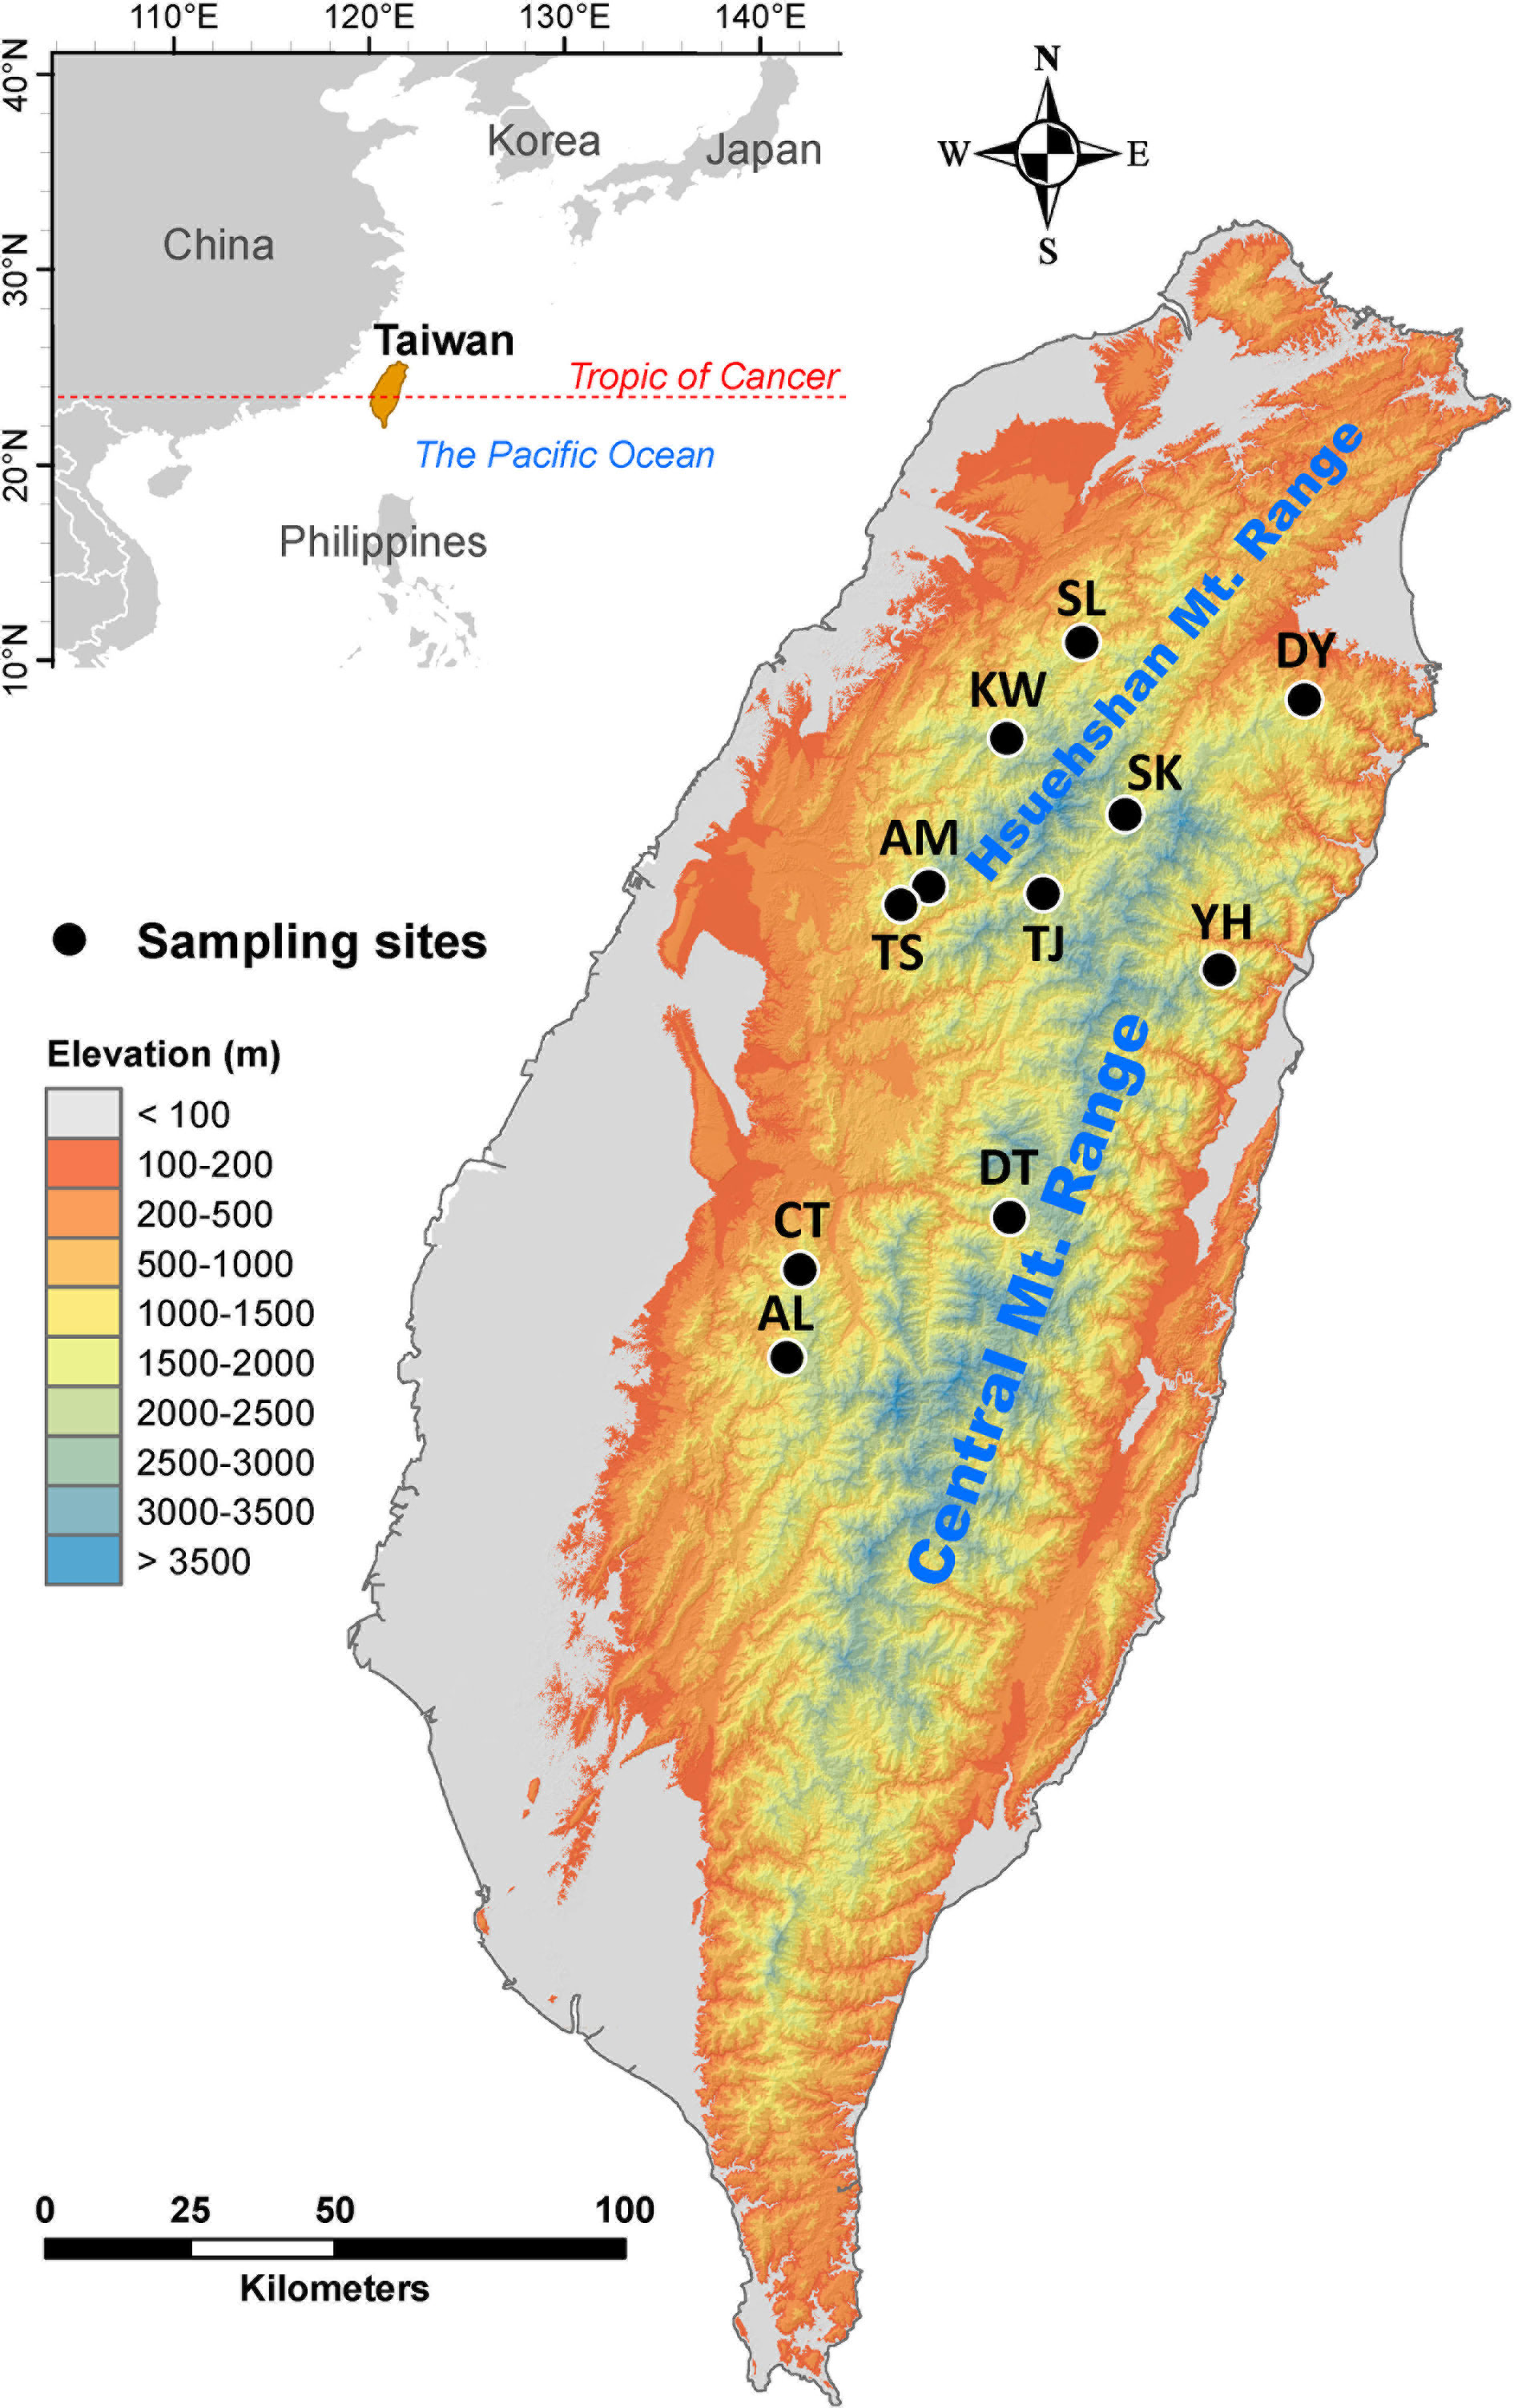
Figure 1 Geographic distribution of the 11 populations of C. konishii occur in Taiwan. See Table 1 for abbreviations of the 11 populations of C. konishii.
Environment may play an important role in driving population divergence (Wang et al., 2013; Sexton et al., 2014). However, population differentiation may simply reflect a correlation between genetic and geographic distance independent of environmental conditions (Hutchison and Templeton, 1999). C. konishii populations occupy a wide elevational band (∼1,500 m), though within a small latitudinal range, with wide variety of habitats because of varied geographical topologies and climates (Su, 1984; Li et al., 2013). It is likely that mountains and environment both have been critically involved in shaping the population structure of C. konishii. Therefore, genetic variation of 115 individuals from 11 populations was surveyed using 13 AFLP selective primer pairs. Genetic variation and sample site coordinates were used in testing the hypothesis of mountain ranges as a physical dispersal barrier to genetic exchange and genetic variation together with information of environmental variables were used to test environmentally dependent adaptive divergence underlying local adaptation. The specific aims of the present study were to 1) test the barrier effects of mountains to current gene flow and 2) assess the relationships of genetic variation with environmental variables underlying local adaptation, in the light of usefulness in the future conservation of C. konishii.
Materials and Methods
Sampling and Genotyping
We collected 115 individuals of C. konishii from 11 populations (Table 1, Figure 1). Leaf samples dried with silica gel were used for DNA extraction (Dehestani and Kazemi Tabar, 2007). We quantified genetic variation using AFLP (Vos et al., 1995). In selective amplification, 13 EcoRI-MseI primer combinations (E00: 5’-GACTGCGTACCAATTC-3’ and M00: 5’-GATGAGTCCTGAGTAA-3’) with additional five and three bases were added, respectively, at the ends, were used (Supplementary Table 1). Fragments amplified by polymerase chain reaction were electrophoresed on an ABI 3730XL DNA analyzer (Applied Biosystem, Foster City, CA, USA) and scored with Peak Scanner v.1.0 (Applied Biosystem). The presence and absence of amplified fragments were scored with the fluorescent threshold set at 150 units. Amplified fragment peaks in the range of 150–500 base pair (bp) separated by less than one nucleotide in a ± 0.8 bp window were scored as the same fragment. Markers scored higher than 99% or less than 1% of individuals were removed. The AFLP dataset was deposited in Supplementary Data Sheet 1.
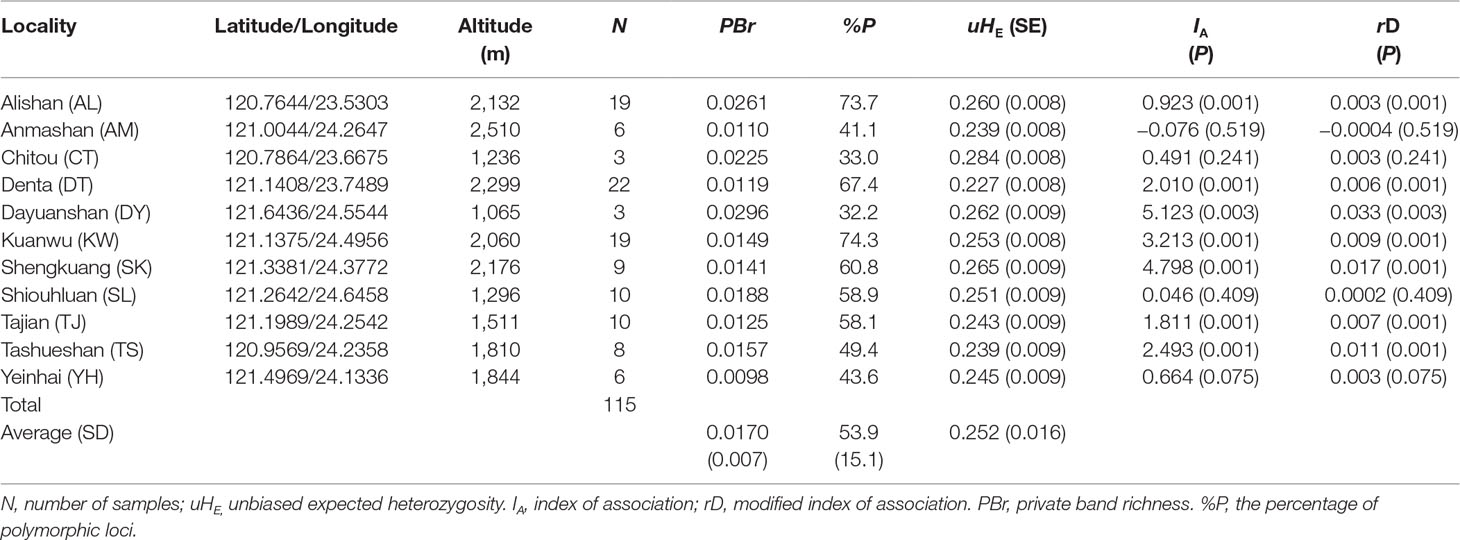
Table 1 Site properties and population genetic parameters based on 482 amplified fragment length polymorphism (AFLP) loci of the sampled C. konishii populations.
Genotyping error rate of each primer combination was estimated based on the ratio of mismatches in three amplification replicates of three samples in each population. Loci with error rates greater than 5% were removed (Bonin et al., 2004) and the mean error rate was 1.91% (Supplementary Table 1).
Genetic Diversity
The percentage of polymorphic loci (%P) at the 95% level with rarefaction to the smallest sample size (n = 3) was calculated using AFLPDIV software v.1.1 (Coart et al., 2005). The private band richness (PBr) was estimated separately for each population using ADZE software v.1.0 (Szpiech et al., 2008) with rarefaction (Kalinowski, 2004). We calculated index of association (IA) (Brown et al., 1980) and modified index of association (rD) (Agapow and Burt, 2001) using the ia function of R poppr package (Kamvar et al., 2014; Kamvar et al., 2015) in the R environment (R Development Core Team, 2018) to assess the level of multilocus linkage disequilibrium (LD), and significant departure from zero was tested with 999 permutations. Unbiased expected heterozygosity (uHE) (Nei, 1987) within a population were computed using AFLP-SURV v.1.0 (Vekemans et al., 2002). In AFLP-SURV, allele frequencies were estimated assuming Hardy–Weinberg equilibrium with nonuniform prior distribution (Zhivotovsky, 1999) for uHE computation. Per locus uHE was calculated using ARLEQUIN v.6.0 (Excoffier and Lischer, 2010). Assessment of significant difference of mean uHE per locus between populations was performed using a linear mixed effect model (LMM) with population and locus treated as fixed and random effect, respectively, based on reduced maximum likelihood estimation using the lmer function of R lme4 package (Bates et al., 2015). Significance was assessed based on type II Wald χ2 test using the Anova function of R car package (Fox and Weisberg, 2011), and P values were adjusted with Tukey’s post hoc method using the lsmeans function of R emmeans package (Lenth, 2018).
Genetic Differentiation
The level of genetic differentiation among populations was analyzed via analysis of molecular variance (AMOVA) using the poppr.amova function of R package poppr, and significance tested using the randtest function of R package ade4 with 9,999 permutations (Dray and Dufour, 2007). Across population FST was computed using AFLP-SURV with 9,999 permutations. ARLEQUIN was used to compute pairwise FST with 10,000 permutations. Moreover, HICKORY v.1.1 (Holsinger and Lewis, 2003) was used to estimate θII (an analog to FST), considering the uncertainty associate with the inbreeding coefficient (f) for dominant markers. To check the convergence of parameters, two HICKORY runs were performed with sampling and chain length parameters include burnin = 5,000, samples = 100,000, and thinning = 20. Genetic data was evaluated fitting to the full model, f = 0 model, θII = 0 model, and f-free model, and the best fitting model in estimating θII was determined by the deviance information criterion (DIC). The f-free model was used to estimate f within populations because other models produced unreliable f estimates. The f-free model selects f values from a uniform prior distribution without generating a posterior distribution of f independent of assumptions.
Genetic Clustering and Testing the Barrier Effects of Mountains on Gene Flow
Genetic homogeneous groups of C. konishii individuals were assessed based on sparse nonnegative factorization (sNMF) algorithm (Frichot and Francois, 2015) and discriminant analysis of principal components (DAPC) (Jombart et al., 2010). Individual assignments based on the least-squares optimization using the snmf function of R LEA package (Frichot and Francois, 2015) was performed for K = 1–11. The regularization parameter, iterations, and repetitions in snmf were set to 100, 200, and 10, respectively, with other arguments set to defaults. The best K in LEA was evaluated with the means of minimal cross-entropy (CE). The find.clusters and dapc functions of R adegenet package (Jombart and Ahmed, 2011) were used in DAPC analysis, in which a principal component analysis (PCA) was first performed and followed by a discriminant analysis that maximize variance between groups. The best K in DAPC was indicated by an elbow in the curve of Bayesian information criterion (BIC), as suggested by the authors of the R adegenet package, estimated using the find.clusters function.
Given the heterogeneous nature of C. konishii populations distributed across mountains, Monmonier’s maximum difference algorithm (Monmonier, 1973; Manni et al., 2004) was used to assess sharp genetic discontinuities in the geographic distribution area of C. konishii, based on the Euclidean distance of AFLP and sample coordinates, using the optimize.monmonier function of R adegenet package. In optimize.monmonier, 10 different starting points were used to find the largest sum of local distances that explains genetic distances among populations.
Environmental Variables and Heterogeneity
Environmental variables used were 19 bioclimate, 2 topological, and 12 ecological variables. Nineteen bioclimate variables for sample sites at 30-s spatial resolution (∼1 km) were downloaded from the WorldClim v.1.4 (Hijmans et al., 2005). Topographic variables including aspect and slope at 30-m resolution were obtained from Aster Global Digital Elevation Map (https://asterweb.jpl.nasa.gov/gdem.asp). We obtained ecological factors including normalized difference vegetation index (NDVI) and enhanced vegetation index (EVI) derived from moderate resolution imaging spectroradiometer (MODIS) dataset MOD13A2 (1-km resolution), and leaf area index (LAI) and fraction of absorbed photosynthetically active radiation (fPAR) derived from MOD15A2 dataset (500-m resolution). The annual total potential evapotranspiration (PET) was calculated based on MOD16A3 dataset (500-m resolution). All the MODIS datasets were acquired from Land Process Distributed Active Archive Center (http://lpdaac.usgs.gov) during 2001‒2013, and monthly mean values of NDVI, EVI, LAI, and fPAR were computed using a maximum-value composite procedure (Huete et al., 2002). Monthly mean values of the other five ecological factors including relative humidity (RH), cloud cover (CLO), time of sunshine (SunH), number of rainfall days per year (RainD), and mean wind speed (WSmean) were also calculated for data obtained from the Data Bank for Atmospheric & Hydrologic Research (https://dbahr.pccu.edu.tw/, recorded in 1990–2013) at spatial resolution of 1 km using a universal spherical model of the Kriging method in ArcGIS (Chang et al., 2014). Additionally, we acquired soil pH values of sample sites based on an island-wide soil investigation (n = 1,150) conducted in 1969‒1986 from the Agriculture and Food Agency of Taiwan (Chang et al., 2009). Annual precipitation and annual PET (derived from annual mean temperature) were used to calculate annual moisture index (Thornthwaite, 1948).
The cor function of R was used to calculate correlation coefficients between environmental variables. Variance inflation factor (VIF) was calculated using the vif function of R package usdm (Naimi et al., 2014). We retained eight environmental variables for further use based on environmental variables with VIF < 10 and which not strongly correlated with other variables (|r| < 0.8). The eight retained environmental variables were aspect, BIO1 (annual mean temperature), BIO7 (annual temperature range), BIO12 (annual precipitation), NDVI, PET, RainD, and slope (Supplementary Table 2). Environmental Euclidean distance matrix was used in a permutational multivariate analysis of variance (PERMANOVA) to assess environmental heterogeneity among sample sites and among population genetic clusters (revealed by LEA and DAPC analyses, see Results) using the adonis function of R package vegan (Oksanen et al., 2017). Pairwise population and cluster comparisons were also performed using the pairwise.perm.manova function of R package RVAideMemoire (Herve, 2018). Significant pairwise comparisons were tested with 999 permutations and a false discovery rate (FDR) of 5%.
Mantel test was used to assess genetic isolation by distance (IBD) by analyzing the correlation of the population Euclidean distance matrix of AFLP with the population Euclidean distance matrix of geography (latitude and longitude) using the mantel function of R vegan package.
Partitioning of Genetic Variation Explained by Environmental Variables
The eight retained environmental variables were used in a redundancy analysis (RDA) to assess the relative contribution of environmental variables explaining the total AFLP variation using the varpart function of R package vegan, and significance tested using the anova.cca function with 999 permutations (Oksanen et al., 2017). The total variation was partitioned into four fractions: pure environmental variables (fraction [a]), geographically structured environmental variables (fraction [b]), pure geographic variables (fraction [c]), and residual effects (fraction [d]) (Borcard et al., 1992; Borcard and Legendre, 2002). Adjusted R2 value was used to represent the amount of variation explained in each fraction (Peres-Neto et al., 2006). Longitude and latitude of sample sites were used as geographic variables in the analysis.
Test for FST Outliers
Two genome scan methods, BAYESCAN and DFDIST, were used to identify FST outliers indicating signature of selection across populations. Hierarchical Bayesian method implemented in BAYESCAN v.2.1 (Foll and Gaggiotti, 2008) uses a reversible-jump Markov chain Monte Carlo algorithm to estimate the ratio of posterior probabilities of selection over neutrality [the posterior odds (PO)]. We used 100 pilot runs of 50,000 iterations followed by a sample size of 50,000 with thinning interval of 20 among 106 iterations in BAYESCAN analysis. A logarithmic scale for model choice of selection over neutrality can be defined as: substantial (log10PO > 0.5); strong (log10PO > 1.0); very strong (log10PO > 1.5); and decisive (log10PO > 2) (Jeffreys, 1961; Foll, 2012). We considered a locus with log10PO > 0.5 as a potential selective outlier under selection.
DFDIST incorporates the Beaumont and Nichols model modified for AFLP (Beaumont and Nichols, 1996). The probability of a locus that may be under selection by observed FST (Weir and Cockerham, 1984) and uHE (Zhivotovsky, 1999) compared to simulated neutral distributions was estimated. Parameters for running DFDIST were: critical frequency = 0.99; Zhivotovsky parameters = 0.25; trimmed mean FST = 0.3 (excluding 30% of highest and 30% of lowest FST values); smoothing proportion = 0.06; 500,000 resamplings; critical P = 0.05; and level of differentiation (target average θ) = 0.063254. Empirical loci considered to be the outliers potentially under directional selection were those with FST values significantly greater (P < 0.01) than the simulated distribution.
Test for Associations of Genetic Variation With Environmental Variables
Associations of genetic variation with environmental variables were assessed using Samβada v.0.8.1 (Stucki et al., 2017) and latent factor mixed model (LFMM) (Frichot et al., 2013). A multiple univariate logistic regression approach was employed in Samβada to test for significant correlations of allele frequencies with the values of environmental variables. Models with and without environmental variables were compared, and significant fit was determined based on both Wald and G scores with an FDR cutoff of 0.05. LFMM is a method uses a hierarchical Bayesian mixed model considering background levels of population structure as random effects due to demographic history and IBD patterns, and is introduced via latent factors, K. In LFMM, genetic data matrix was used as fixed effect in a testing procedure based on Z-scores. The number of latent factors, K, was set to 3 (based on the LEA and DAPC clustering results). We ran LFMM five times for each value of K with 10,000 iterations in Gibbs sampling algorithm and a burn-in period of 5,000 cycles. Z-scores from five independent replicate runs were combined using Fisher–Stouffer method (Brown, 1975), and the resulting P values were adjusted using the genomic inflation factor (λ). P values were further adjusted based on an FDR correction of 1% using the R qvalue package (Storey et al., 2019).
For those potential selective outliers identified by either genome scan method (BAYESCAN or DFDIST), a Bayesian logistic regression approach implemented in the stan_glm function of R rstanarm package (Goodrich et al., 2018) was also used to test for the associations of the potential selective FST outliers with environmental variables. In stan_glm analysis, Student’s t distribution with mean zero and 7 degrees of freedom was used as the weakly informative prior. The scale of the prior distribution was 10 for the intercept and 2.5 for the predictors. All models were run with four chains for 1,000 warm-up and 1,000 sampling steps. Credible intervals (95% and 99%) of estimate were calculated using the posterior_interval function of R rstanarm package.
Results
Diversity and Differentiation
We obtained 482 AFLP loci (mean ± SD: 37.08 ± 7.87) for C. konishii (Supplementary Table 1). The average value of PBr ± SD was 0.017 ± 0.007 (ranged from 0.0098 for the population YH to 0.0296 for the population DY) (Table 1). The average value of %P ± SD was 53.9 ± 15.1 (ranged from 32.2 for the population DY to 74.3 for the population KW). The average level of uHE ± SD was 0.252 ± 0.016 and ranged between 0.227 (population DT) and 0.284 (population CT). Within C. konishii, the level of uHE per locus was significantly different among populations using LMM (χ2 = 41.38, P < 0.0001). However, significant difference in the level of uHE per locus was not found for all pairwise comparisons (Supplementary Table 3). No positive correlation of sample size with population uHE (S = 305.78, ρ = −0.390, P = 0.2358) and PBr (S = 251.29, ρ = −0.142, P = 0.6766), respectively, was found based on Spearman’s rank correlation test. However, significant positive correlation was found between sample size and the percentage of polymorphism (S = 14.12, ρ = 0.936, P < 0.001). Using HICKORY, an estimate of f within population was 0.4969 (95% CI: 0.022–0.976) using the f-free model representing the contemporary reproductive mode of C. konishii (Supplementary Table 4). The measures of multilocus LD, IA and rD, showed significant departure from random association between AFLP loci in 7 (populations AL, DT, DY, KW, SK, TJ, and TS) of the 11 populations examined (Table 1).
The full model was the best model fitting to the genetic data based on DIC in HICKORY analysis (Supplementary Table 4). Low, albeit significant, level of genetic differentiation of C. konishii populations was found based on AMOVA and θII (ΦST = 0.0827, θII = 0.0848; Table 2, Supplementary Table 4). Across population FST estimated using AFLP-SURV was 0.0656 (P < 0.001). Significant population pairwise FST estimated using ARLEQUIN was commonly found (Supplementary Table 5).
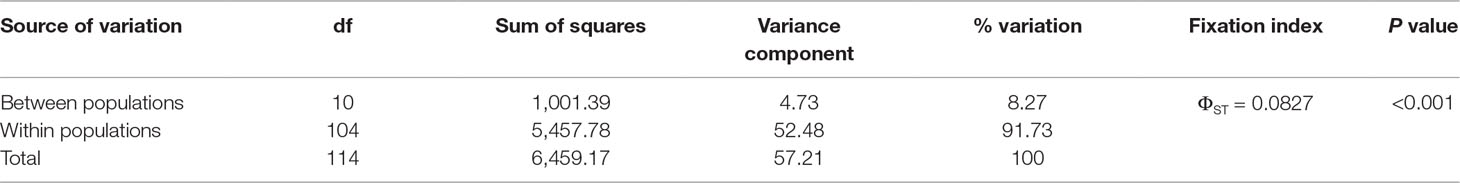
Table 2 Summary of the analysis of molecular variance (AMOVA).
Genetic Clustering and Test for IBD
In the LEA analysis, the means of minimal CE was minimized at K = 3 (Supplementary Figure 1A). LEA clustering results were depicted for K = 2–3 (Figure 2). The lowest BIC was found at K = 5, but elbowed at K = 3, in DAPC analysis (Supplementary Figure 1B). The eigenvalues for the first two retained PCs were 1.04 and 0.64 (Supplementary Figure 1C) and the eigenvalues for the first two DAPC linear discriminants were 28.77 and 14.63 (Supplementary Figure 1D). Three population clusters can be distinguished based on DAPC: cluster 1 contains population AL; cluster 2 contains populations DT, TS, and YH; and cluster 3 contains populations AM, CT, DY, KW, SK, SL, and TJ. However, a few individuals from one population can be grouped with individuals of other populations in a separate cluster (Figure 3). Figure 4 displayed the spatial boundaries of genetic exchange among C. konishii populations using Monmonier’s algorithm. Mantel test revealed no significant genetic isolation by geographic distance (rM = 0.251, P = 0.107).
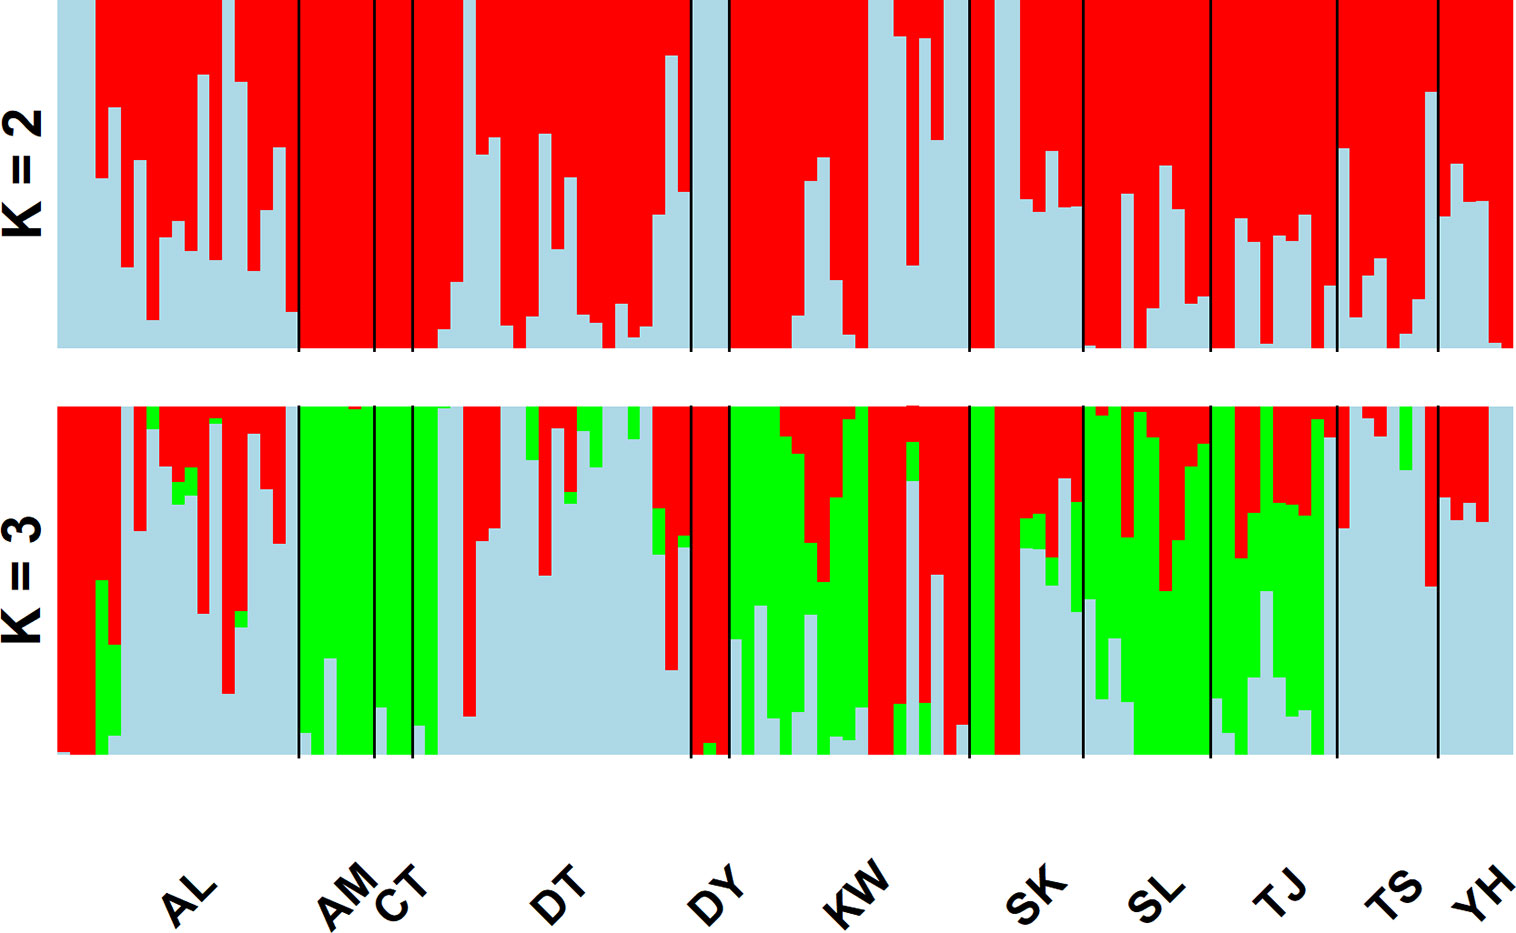
Figure 2 Individual assignments of 115 individuals from 11 populations of C. konishii analyzed using LEA. The clustering scenarios for K = 2–3 were displayed.
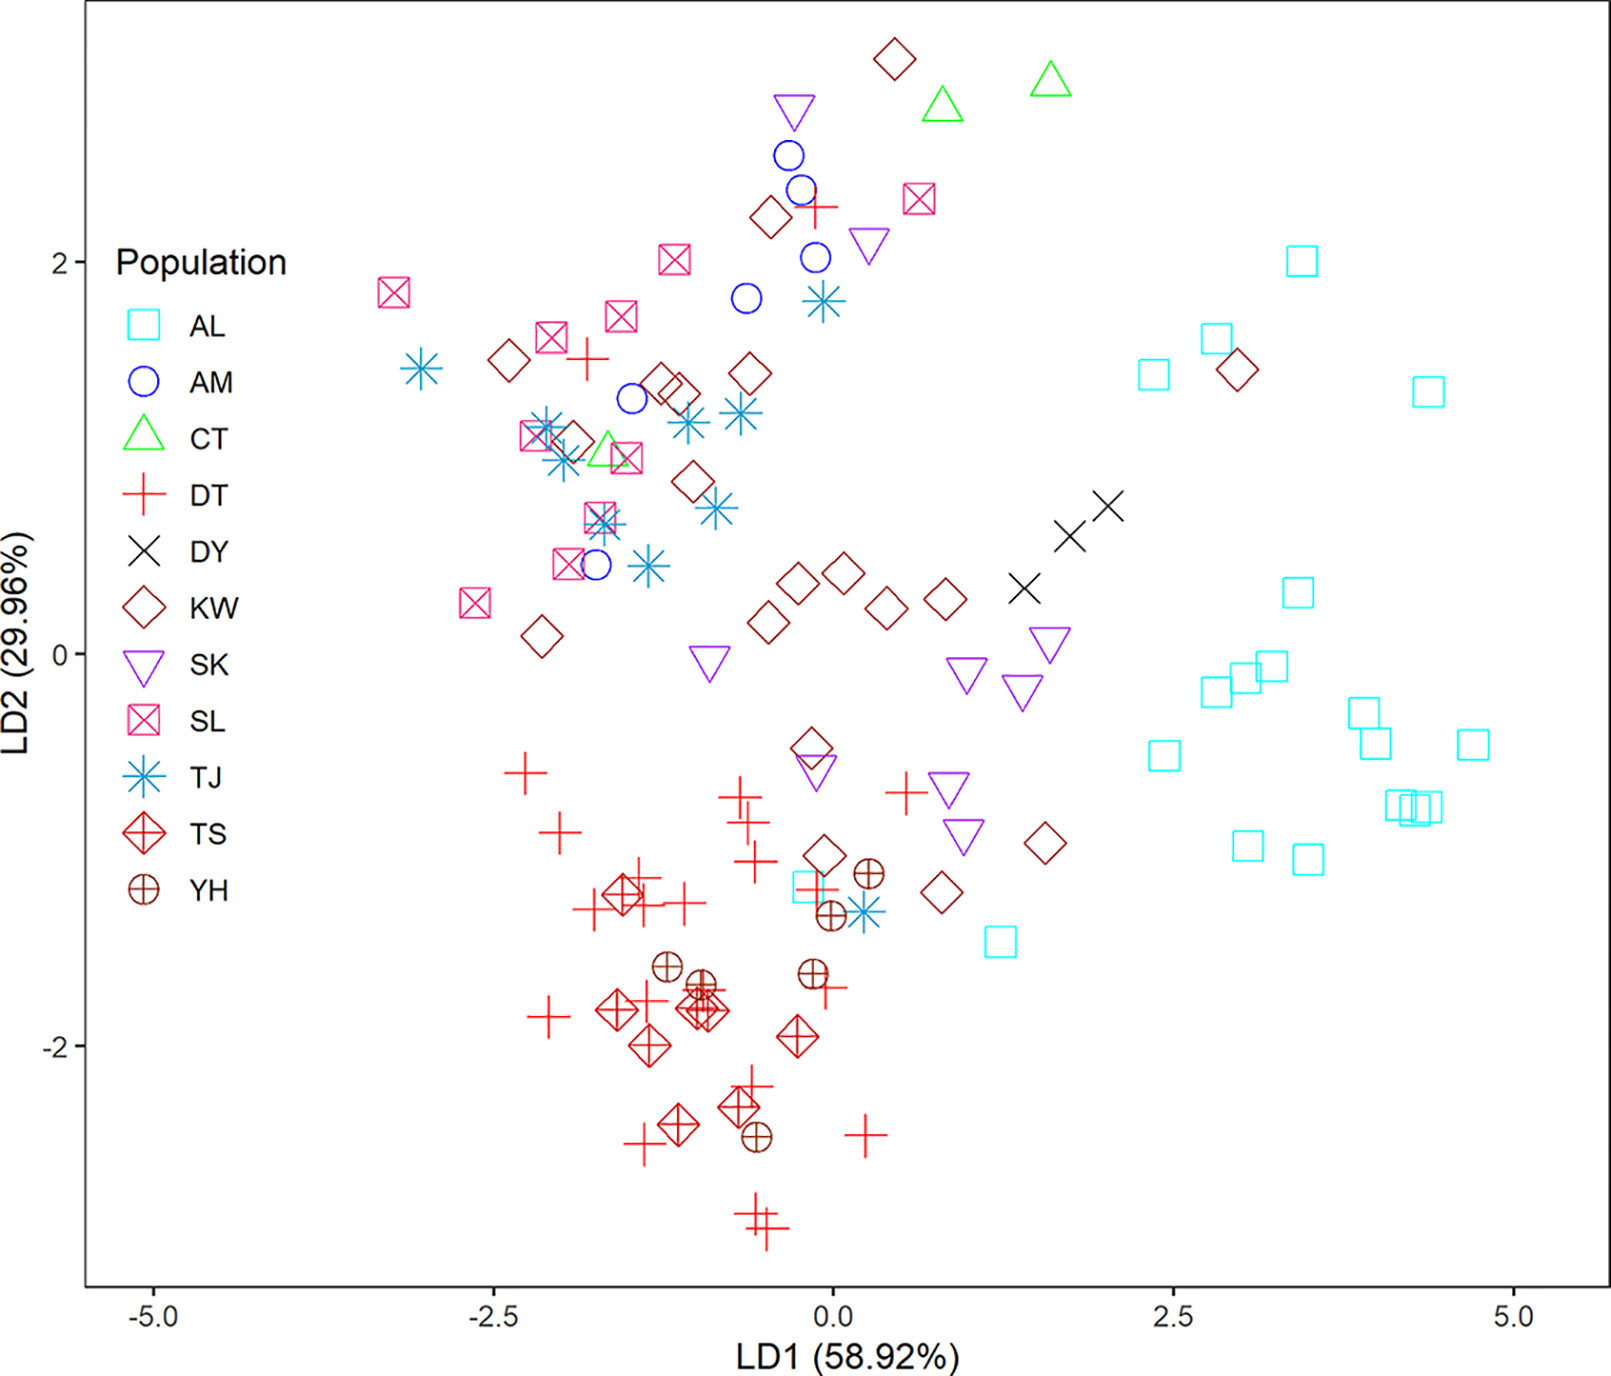
Figure 3 Clustering results analyzed using discriminant analysis of principal components (DAPC).
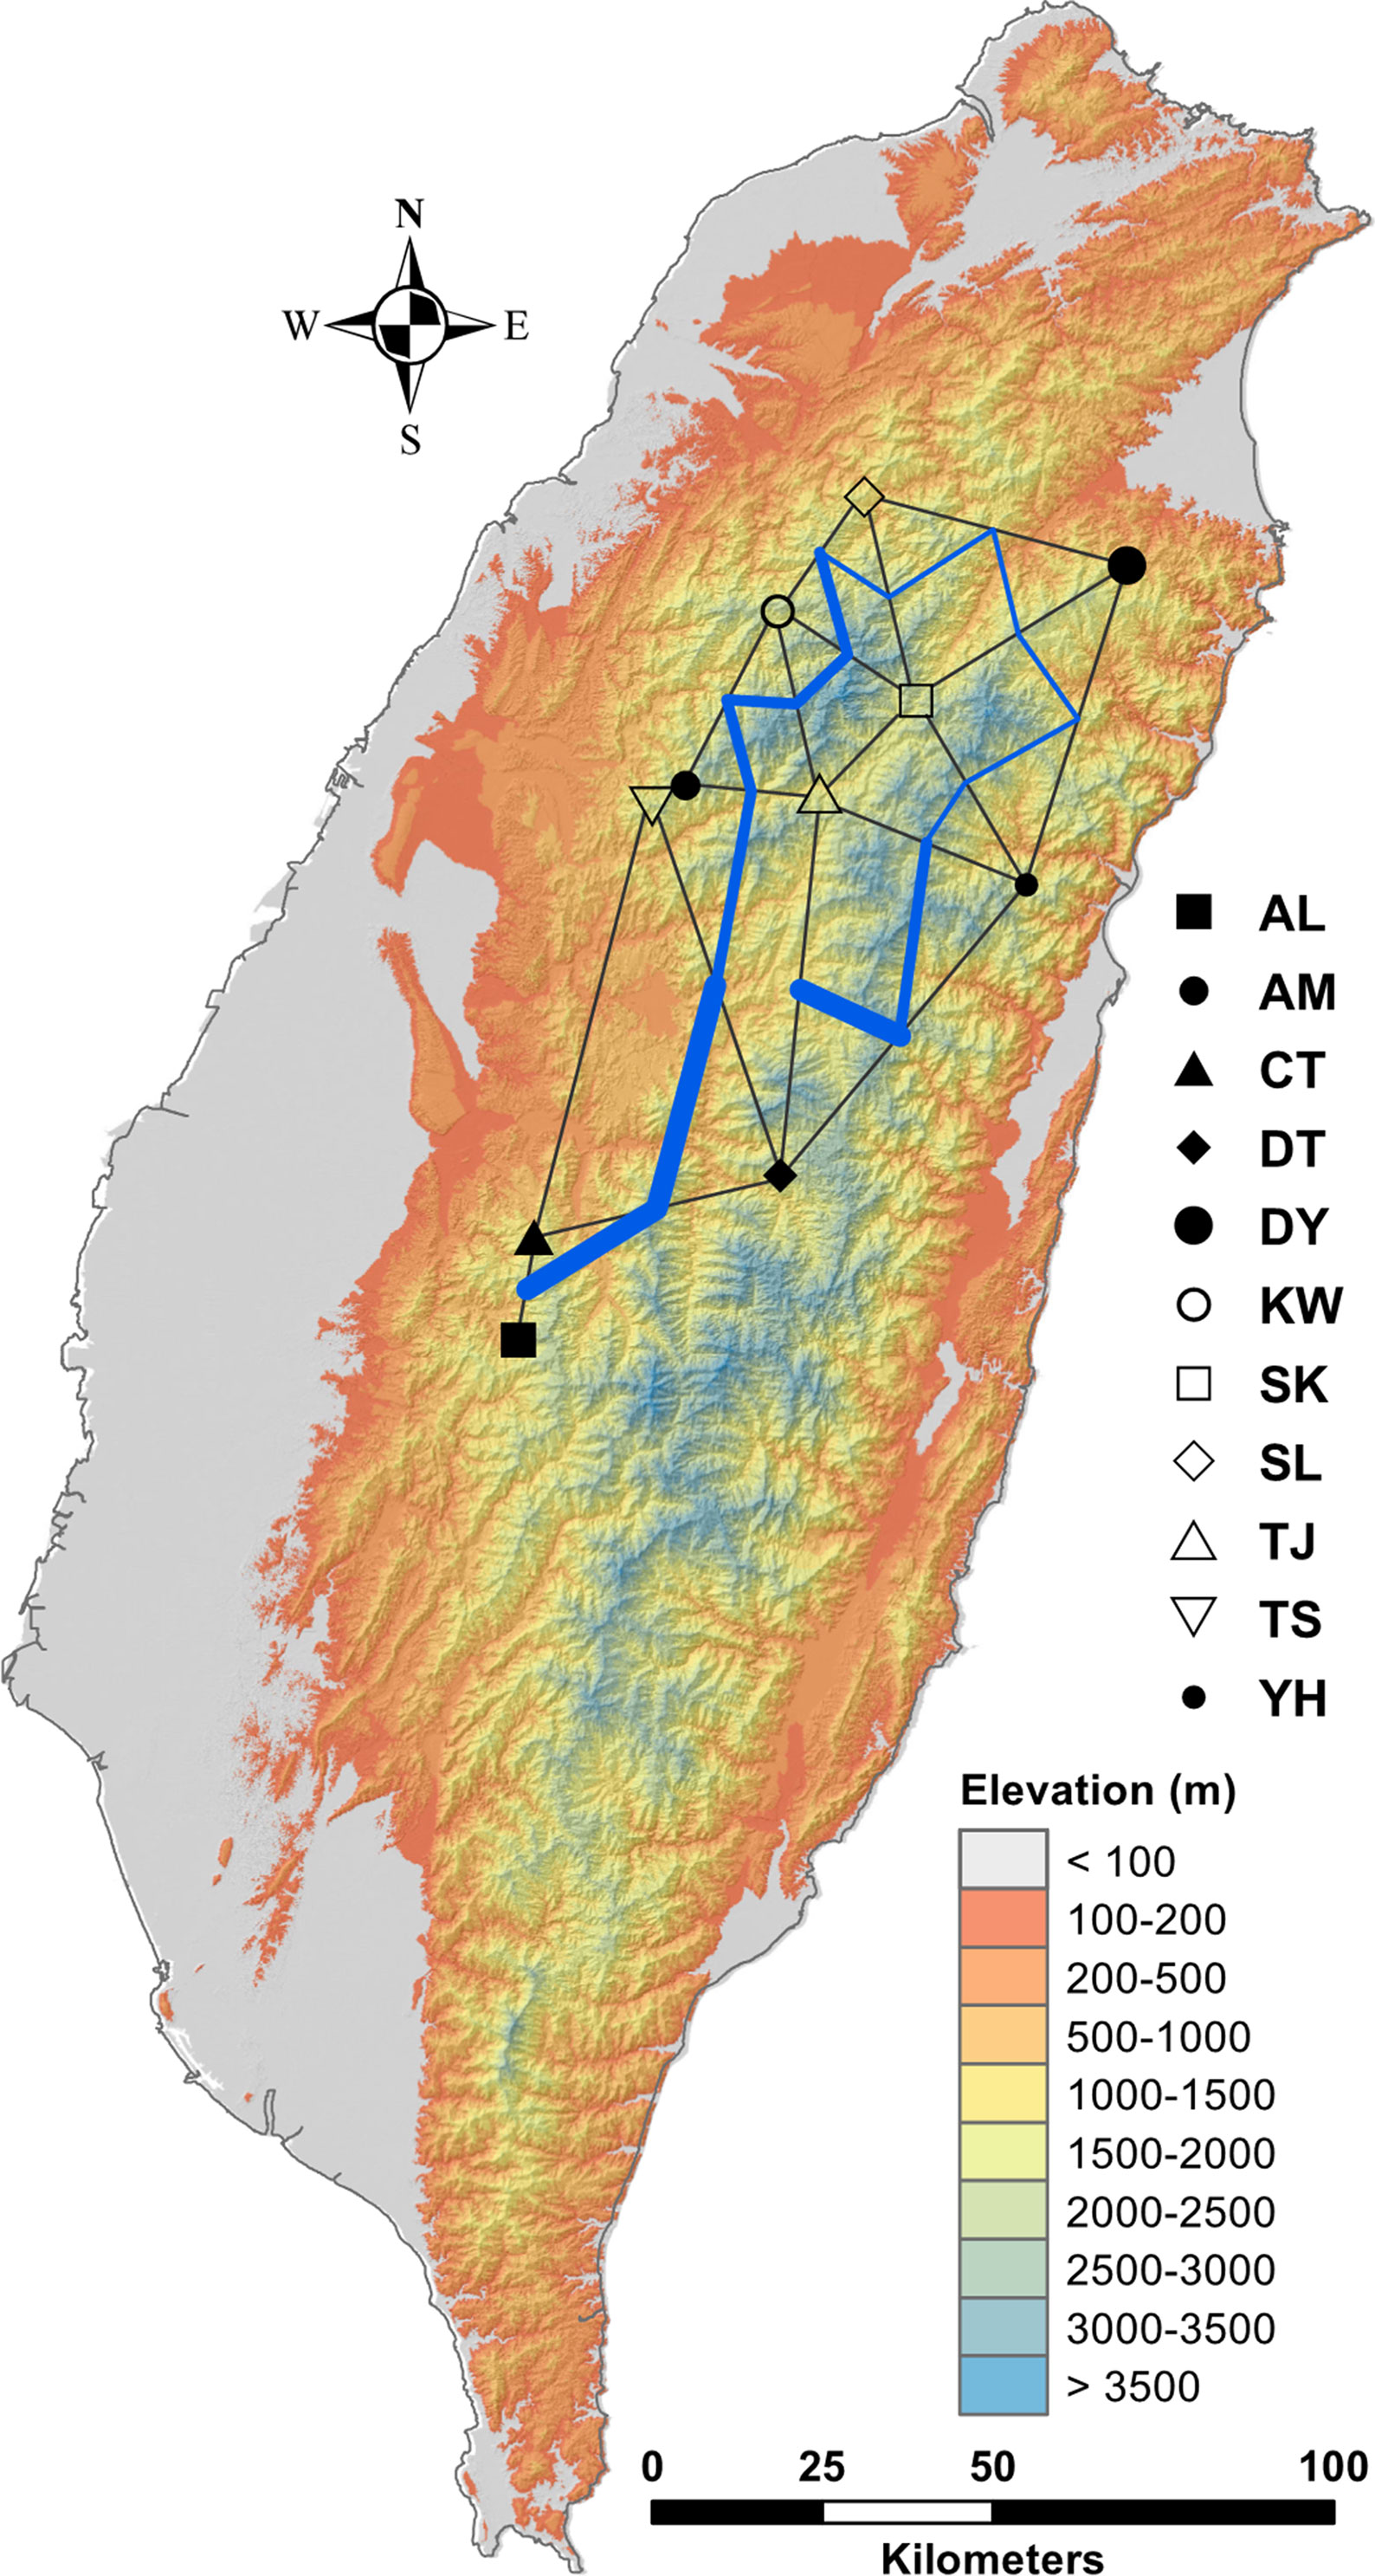
Figure 4 Barriers to genetic exchange identified using Monmnier’s algorithm. The levels of physical barrier effect of gene flow were represented by the thickness of blue lines. See Table 1 for abbreviations of the 11 populations of C. konishii.
Variation Partitioning of Genetic Variation Explained by Environment and Geography
PERMANOVA revealed significant environmental difference among (P = 0.001) and between the three genetic clusters (P = 0.001). Significant pairwise differences between populations were found (Supplementary Table 6), albeit PERMANOVA revealed no environmental difference across populations (P = 1). Total explainable genetic variation was 7.38% (Table 3). This value was relatively small as compared to the amounts of unexplained variation (92.62%). Nevertheless, significant amount of genetic variation was explained by both pure environment (5.18%, fraction [a]) and pure geography (1.84%, fraction [c]), albeit small, based on F tests of RDA model. Moreover, environment explained a relatively larger proportion of genetic variation than geography.
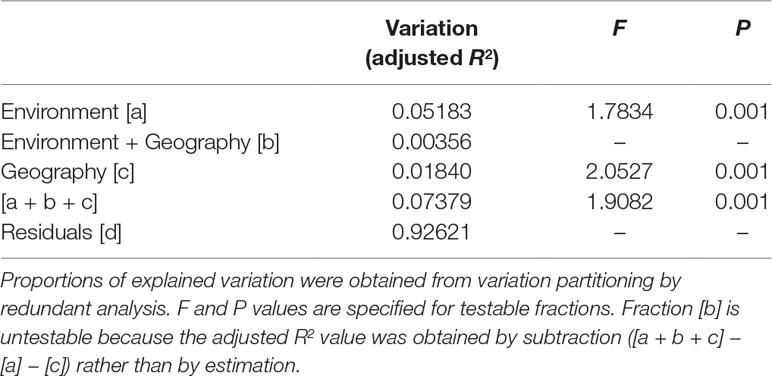
Table 3 The percentage of variation explained in genetic loci accounted for by non-geographically structured environmental variables [a], shared (geographically structured) environmental variables [b], pure geographic factors [c], and undetermined component [d] analyzed based on the eight retained environmental variables.
Potential Outliers Strongly Correlated With Environmental Variables
Six and nine nonoverlapped loci, respectively, were identified as FST outliers by BAYESCAN and DFDIST (Table 4). Allele frequencies of these outlier loci across populations arranged either latitudinally or longitudinally were depicted in Figure 5. Samβada and LFMM found significant associations of 18 and 83 loci, among the 482 loci scored, respectively, with at least one environmental variable. The Wald and G scores in the Samβada analysis were reported in Supplementary Table 7. The corresponding Z-score, −log10(P value), and adjusted P value of candidate outlier loci identified using LFMM were summarized in Supplementary Table 8. For the 15 loci identified either by BAYESCAN or DFDIST, Samβada found five (P1_1715, P5_2456, P9_1014, P11_1715, and P15_1918) and LFMM found seven (P1_1409, P1_1715, P5_2456, P11_1715, P12_2853, P13_1547, and P15_1446) loci, respectively, strongly correlated with environmental variables (Table 4). Of the 15 loci identified either by BAYESCAN or DFDIST, nine (P1_1715, P4_1326, P5_1061, P5_2456, P9_1014, P11_1715, P13_1547, P15_1918, and P18_1421) were found to be strongly associated with environmental variables using Bayesian logistic regression (the stan_glm function of R package rstanarm). In summary, 12 AFLP loci (2.49%) were identified either by BAYESCAN or DFDIST and associated strongly with environmental variables using Samβada, LFMM, and rstanarm. Results showed that annual mean temperature, annual precipitation, and slope were closely associated with a large proportion of the 12 FST outliers identified by BAYESCAN and DFDIST; and aspect, annual temperature range, NDVI, PET, and RainD associated strongly only with a minor proportion of these FST outliers. (Table 4).
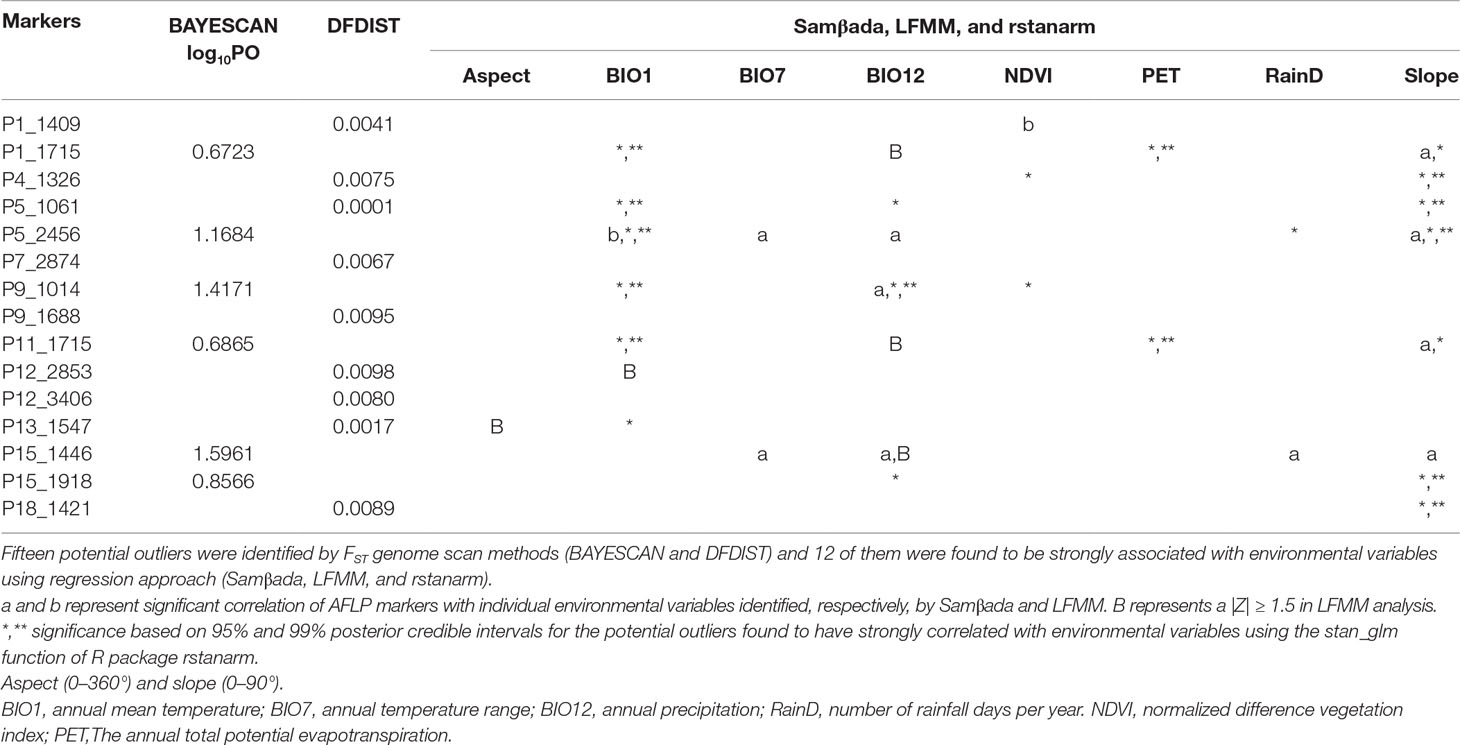
Table 4 Potential outliers associated with environmental variables.
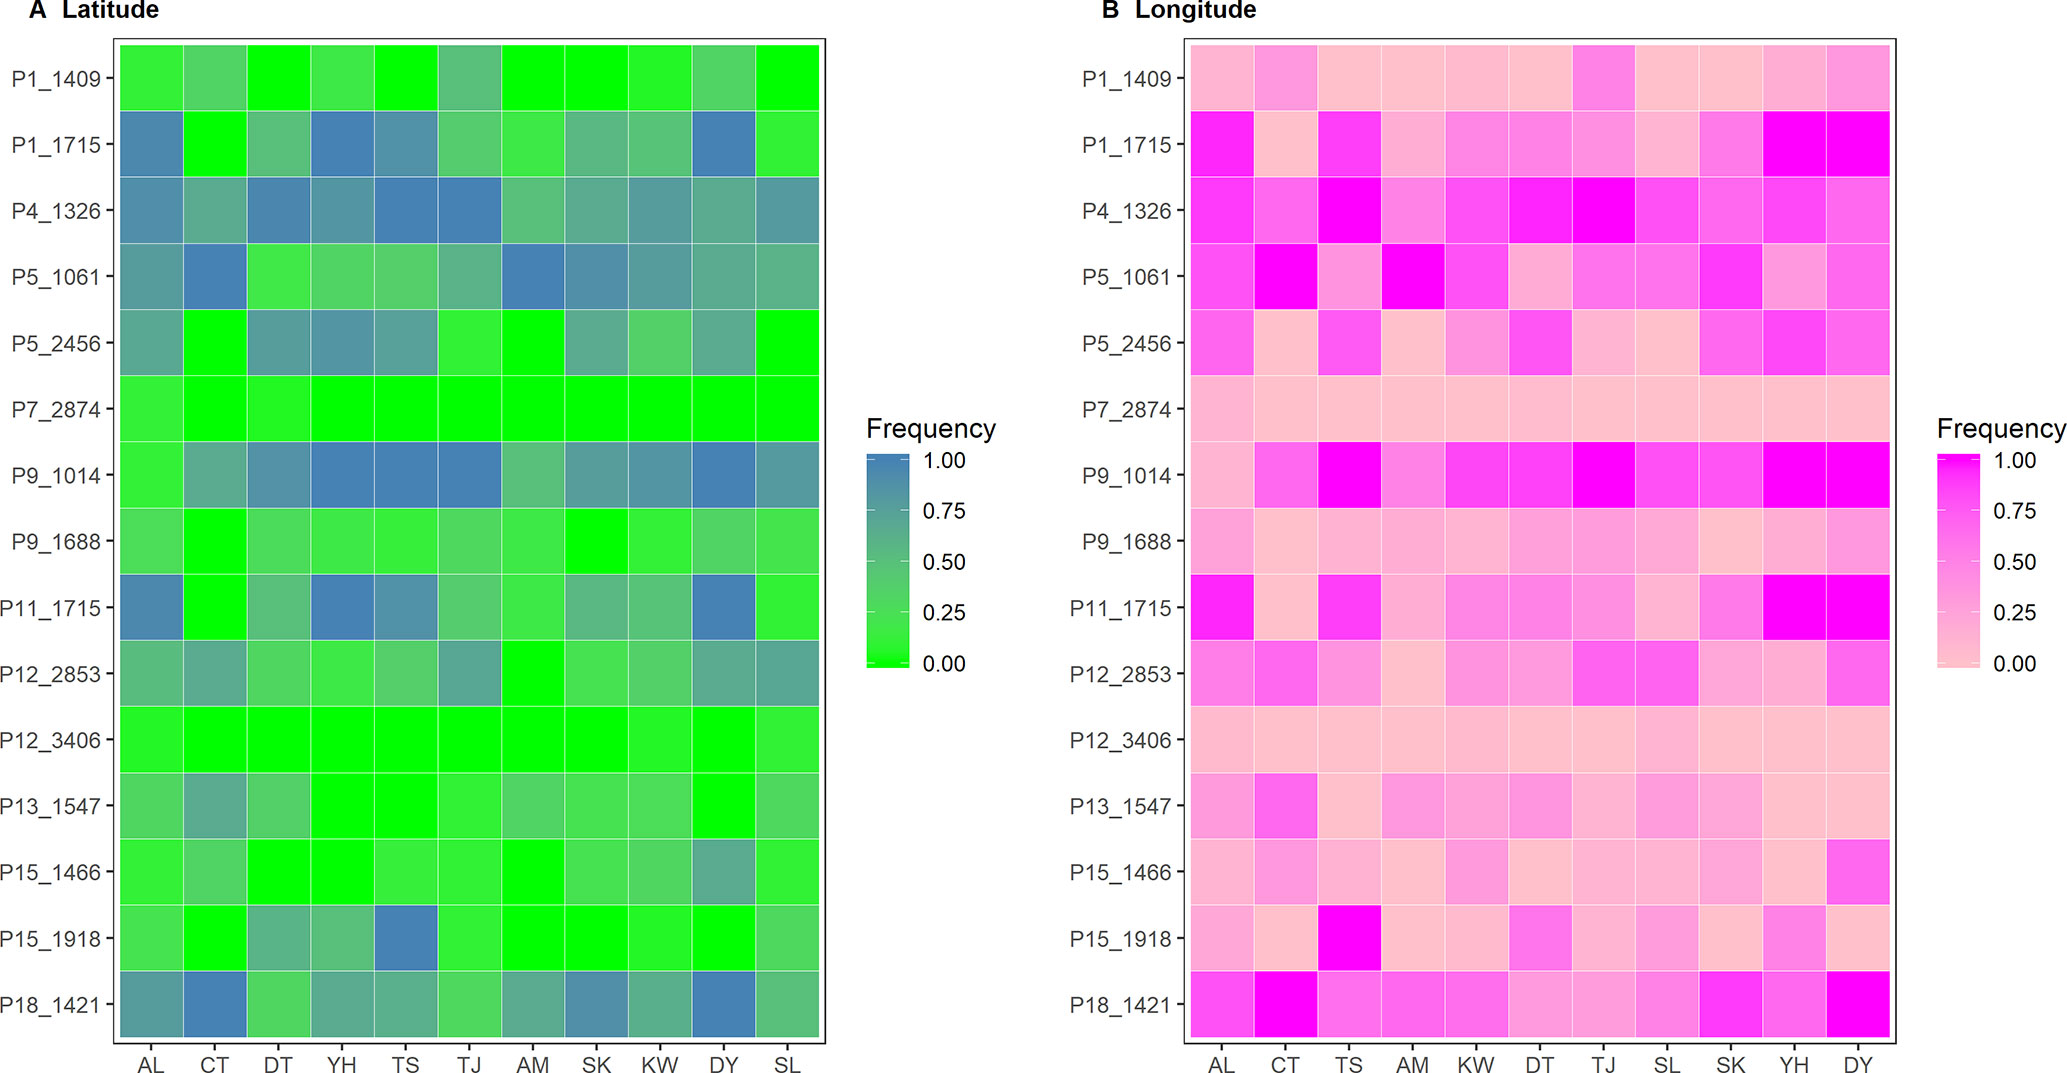
Figure 5 Heatmap of allele frequencies of the 15 outlier loci identified by either BAYESCAN or DFDIST. The sequence of populations was arranged according to (A) latitude or (B) longitude.
Discussion
Genetic Diversity
The average uHE ± SD (= 0.252 ± 0.016) in the present study was found to be higher compared to that of the previous study examined for C. konishii (uHE = 0.184; Chung et al., 2004). The higher number of amplification primer combinations used in the present study could be the cause of the discrepancy compared with the previous AFLP study, which may result in higher interlocus variance (Nei, 1987). Although there is no direct evidence for the relationship between the number of amplification primer pairs and the level of genetic diversity, higher interlocus variance was found to contribute more to the total variance associated with the level of genetic diversity compared to intralocus variance in Pinus pinaster (Ribeiro et al., 2002). Moreover, more amplified AFLP loci, though with higher error rate, could be positively correlated with higher level of genetic diversity (Zhang and Hare, 2012). Additionally, higher number of amplification primer pairs used could have amplified fragments spanning more chromosomal loci and contributed to the higher level of genetic diversity.
Based on the result of the present study, the average level of C. konishii genetic diversity appeared to be comparable to other conifers occurring in Taiwan that have been examined based on AFLP such as Keteleeria davidiana var. formosana (average uHE = 0.233, Fang et al., 2013) and T. cryptomerioides (average uHE = 0.236, Li et al., 2018). The average level of C. konishii genetic diversity was also found to be comparable to the average level of AFLP diversity (= 0.230) for 13 plant species in general summarized in Nybom (2004). Despite C. konishii covers only a small latitudinal range, it distributed across complex topography and habitat heterogeneity in mountain ranges (Su, 1984; Li et al., 2013) and hence could have contributed to the accumulation of genetic diversity (Hewitt, 1996; Petit et al., 2003; Hewitt, 2004).
Mountain Ranges as a Physical Barrier to Genetic Exchange
The spatial distribution of genetic variability within natural plant populations can be shaped by population demographic history and geography through the combined effects of genetic drift, gene flow, and selection (Hoffmann and Sgrò, 2011). The discrepancy of the level of genetic differentiation based on AFLP was also observed as that of the level of genetic diversity between the present (Table 3) and the previous study (Chung et al., 2004). The ΦST, FST, and θII estimates are consistent with the results of clustering analyses using LEA (Figure 2) and DAPC (Figure 3). In the present study, the level of population genetic differentiation was much smaller compared with the previous AFLP study based on AMOVA analysis (ΦST = 0.0827 vs. ΦST = 0.2460, respectively). However, the level of genetic differentiation of the present study is consistent with the levels of genetic differentiation found based on allozyme (FST = 0.029) (Lin et al., 1998) and ptDNA (GST = 0.073) (Hwang et al., 2003). The higher level of genetic differentiation among populations found in the previous study (Chung et al., 2004) could have arisen in part due to the smaller number of genomic regions amplified, compared with the present study, and harvested a relatively smaller fraction of ancestral polymorphisms contributing to the higher level of population differentiation. Nonetheless, the levels of population genetic structure estimated (ΦST, FST, and θII) in the present study were consistent with the results found in other conifers occurring in Taiwan including K. davidiana var. formosana (Fang et al., 2013) and T. cryptomerioides (Li et al., 2018) based on AFLP. In addition, these results are in accordance with the general realization that conifers typically have high rates of effective pollen dispersal resulting in low population differentiation because of long distance wind pollination based on allozyme data (Hamrick et al., 1992; Hamrick and Godt, 1996).
Although low levels of across population and population pairwise FST were found (Table 2, Supplementary Table 5), genetic boundaries have been established by mountain ranges (Figure 4) and current gene flow among populations might have also been restricted by spatial environmental heterogeneity as suggested by PERMANOVA analysis (Supplementary Table 6). Additionally, Mantel test revealed no significant correlation of genetic distance matrix with geographic distance matrix suggesting no IBD pattern. These results suggest that the pattern of gene flow in C. konishii may not follow a stepping stone migration model (Kimura, 1953) due to the presence of physical dispersal barriers and sharp discontinuities in gene frequencies can be observed in populations in close proximity geographically (Figures 1 and 5). Our results suggest that the presence of physical barriers to gene flow and migration–drift equilibrium may not be reached, and a significant proportion of the observed low level of genetic differentiation reflects historical population expansion (Hwang et al., 2003) rather than current level of gene flow (Latta and Mitton, 1999; Turgeon and Bernatchez, 2001; Ringbauer et al., 2018). In the present study, the barrier effects of the HMR and the CMR and mountains in between of the HMR and the CMR could have played roles in shaping population differentiation of C. konishii. Moreover, mountains surrounding the AL population could have played a damping effect on dispersal between the AL and all other C. konishii populations, particularly between the AL and its nearby CT population, genetically (Figure 4). Therefore, natal dispersal within different geographic areas could have played an important role in shaping the genetic structure of C. konishii. However, environment could also be an important factor contributed to C. konishii population divergence because genetic variation is structured more by pure environment than by pure geography as revealed by the analysis of variation partitioning (Table 3). Our results suggest that environmental factors accompanied with physical separations have shaped the divergence between C. konishii populations. Ecotypes are likely to have arisen at local scales and the emergence of clusters of locally beneficial mutations forming genomic islands of divergence (Via, 2009; Wolf et al., 2010; Strasburg et al., 2012).
The Most Important Environmental Variables for Adaptive Genetic Divergence in C. konishii
Current mating of C. konishii individuals among populations could be limited as suggested by significant population-level IA and rD in 7 of the 11 populations examined, indicating nonrandom association of loci within these populations (Table 1). Local reduction in gene flow mediated by divergent selection and/or immigrant inviability that reduced survival and reproduction of immigrants might have also contributed to the detection of multilocus LD (Kawecki and Ebert, 2004; Nosil et al., 2005; Jump and Peñuelas, 2006). However, detection of LD does not ensure a lack of linkage equilibrium (Slatkin, 2008) and LD within populations may be related to the demographic history of species (Wall et al., 2002).
Our results based on analyses using BAYESCAN, DFDIST, Samβada, LFMM, and rstanarm found adaptive divergence of genetic variation (Table 4). Although BAYESCAN and DFDIST found no common outlier loci, regression approaches (Samβada, LFMM, and rstanarm) can be effective in testing their associations with environmental gradients (Stucki et al., 2017). Results showed that outlier AFLP loci were mainly driven by environmental variables including annual temperature range, annual precipitation, and slope (Table 4), and these environmental factors could have played major roles in driving outlier AFLP variation for local adaptation in C. konishii. Environmental variables including aspect, annual temperature range, NDVI, PET, and RainD could have played only minor roles as selective drivers in shaping adaptive divergence in C. konishii.
Strong correlations between environmental variables and population genetic variability can be provided as evidence for local adaptation and selection (Linhart and Grant, 1996). Temperature and precipitation have been found to be the two most important selective drivers for local adaptation in conifers (e.g., González-Martínez et al., 2006; Fang et al., 2013; Shih et al., 2018). Temporal and spatial variation in temperature and precipitation can influence fitness-related traits (Parmesan and Yohe, 2003; Hoffmann and Sgrò, 2011; Franks and Hoffmann, 2012) and consequently influence the survival of conifers (Brodribb et al., 2014). Topographic gradients over short distances in the rugged geographic landscape can play significant roles in shaping species composition of forest communities (Kitagawa et al., 2015). Topographic factors such as slope are important predictors of forest attributed to differences in radiation exposure and have a strong influence on the microclimate (Rosenberg et al., 1983; Bennie et al., 2008; Brousseau et al., 2015). Aspect and slope were found to be closely correlated with genetic variation within and between species (Nakazato et al., 2010; Monahan et al., 2012; Bothwell et al., 2013; Brousseau et al., 2015; Huang et al., 2015a; Huang et al., 2015b; Li et al., 2018). In the present study, slope could be the major topographic factor that played an important role in driving outlier AFLP variation for local adaptation (Table 4).
Environmental variation has been correlated with forest ecosystem properties in various geographic regions, suggesting the sensitivity of species composition responding to environmental conditions (Vandewalle et al., 2010; Roscher et al., 2012; Zhang et al., 2014). NDVI is a proxy to photosynthetic activity representing the level of vegetation greenness and has been shown to be correlated with intraspecific and interspecific adaptive divergence (Nakazato et al., 2010; Huang et al., 2015a; Huang et al., 2015b; Chen et al., 2017; Li et al., 2018). RainD represents the number of rainfall days per year, which was found to be associated with adaptive genetic variation of an angiosperm species, Rhododendron oldhamii, occur in Taiwan (Hsieh et al., 2013). PET was identified to be closely correlated with adaptive genetic variation between genetic lineages of a coniferous species, T. cryptomerioides, occurring in Taiwan, mainland China, and Vietnam (Li et al., 2018).
Our results suggest that ecologically relevant selective drivers involved in population adaptive divergence of C. konishii. Spatial environmental heterogeneity might have invoked genetic divergence among populations and in consequence the formation of local adaptation.
Conclusions
The maintenance of genetic ecotypes adapting to varying environmental conditions can be critical for the conservation of species in the face of global climate change. Environmental variables might have exerted effects in shaping adaptive evolution of genetic variation. In the present study, we found annual mean temperature, annual precipitation, and slope could be the most important environmental factors that played crucial roles in shaping adaptive genetic divergence. Nonetheless, aspect, annual temperature range, NDVI, PET, and RainD, though might have played only minor roles, could still be important selective drivers of local adaptation in C. konishii populations. In addition, geographic barriers to gene flow exerted by mountain ranges could have played an important role in restricting adaptive genetic divergence at local scales. The three genetic clusters revealed by LEA and DAPC can be employed as evolutionarily significant units for the future conservation program of this species.
Author Contributions
S-YH proposed, funded, and designed the research; Y-SL, K-MS, J-DC, and S-YH collected samples; Y-SL, K-MS, and C-TC performed research; S-YH, Y-SL, K-MS, and C-TC analyzed data; S-YH and Y-SL wrote the paper. All authors have read and approved the final manuscript.
Funding
This work was funded by the Taiwan Ministry of Science and Technology under grant number of MOST 106-2313-B-003-001-MY3.
All plant materials collected conformed to the regulations of the Taiwan Ministry of Science and Technology.
Conflict of Interest Statement
The authors declare that the research was conducted in the absence of any commercial or financial relationships that could be constructed as a potential conflict of interest.
Supplementary Materials
The Supplementary Material for this article can be found online at: https://www.frontiersin.org/articles/10.3389/fgene.2019.00742/full#supplementary-material
Data Sheet 1 | Comma-separated value file for scored AFLP markers of the 11 populations (n = 115) of Cunninghamia konishii. The first two columns recorded the information of sample ID and population code. The rest of columns represent presence/absence of markers.
References
Agapow, P. M., Burt, A. (2001). Indices of multilocus linkage disequilibrium. Mol. Ecol. Notes 1, 101–102. doi: 10.1046/j.1471-8278.2000.00014.x
Aitken, S. N., Bemmels, J. B. (2016). Time to get moving: assisted gene flow of forest trees. Evol. Appl. 9, 271–290. doi: 10.1111/eva.12293
Aitken, S. N., Whitlock, M. C. (2013). Assisted gene flow to facilitate local adaptation to climate change. Annu. Rev. Ecol. Evol. Syst. 44, 367–388. doi: 10.1146/annurev-ecolsys-110512-135747
Aitken, S. N., Yeaman, S., Holliday, J. A., Wang, T., Curtis-McLane, S. (2008). Adaptation, migration or extirpation: climate change outcomes for tree populations. Evol. Appl. 1, 95–111. doi: 10.1111/j.1752-4571.2007.00013.x
Allendorf, F. W., Hohenlohe, P. A., Luikart, G. (2010). Genomics and the future of conservation genetics. Nat. Rev. Genet. 11, 697–709. doi: 10.1038/nrg2844
Allendorf, F. W., Luikart, G., Aitken, S., (2013). Conservation and the genetics of populations. 2nd Edn. Chichester: Wiley-Blackwell.
Antonelli, A. (2017). Biogeography: drivers of bioregionalization. Nat. Ecol. Evol. 1, 0114. doi: 10.1038/s41559-017-0114
Barrett, R. D. H., Schluter, D. (2008). Adaptation from standing genetic variation. Trends Ecol. Evol. 23, 38–44. doi: 10.1016/j.tree.2007.09.008
Bates, D., Maechler, M., Bolker, B., Walker, S. (2015). Fitting linear mixed-effects models using lme4. J. Stat. Soft. 67, 1–48. doi: 10.18637/jss.v067.i01
Beaumont, M. A., Nichols, R. A. (1996). Evaluating loci for use in the genetic analysis of population structure. Proc. Roy. Soc. B-Biol. Sci. 263, 1619–1626. doi: 10.1098/rspb.1996.0237
Bennie, J., Huntley, B., Wiltshire, A., Hill, M. O., Baxter, R. (2008). Slope, aspect and climate: spatially explicit and implicit models of topographic microclimate in chalk grassland. Ecol. Model. 216, 47–59. doi: 10.1016/j.ecolmodel.2008.04.010
Bonin, A., Bellemain, E., Bronken, E. P., Pompanon, F., Brochmann, C., Taberlet, P. (2004). How to track and assess genotyping errors in population genetics studies. Mol. Ecol. 13, 3261–3273. doi: 10.1111/j.1365-294X.2004.02346.x
Borcard, D., Legendre, P. (2002). All-scale spatial analysis of ecological data by means of principal coordinates of neighbor matrices. Ecol. Model. 153, 51–68. doi: 10.1016/S0304-3800(01)00501-4
Borcard, D., Legendre, P., Drapeau, P. (1992). Partialling out the spatial component of ecological variation. Ecology 73, 1045–1055. doi: 10.2307/1940179
Bothwell, H., Bisbing, S., Therkildsen, N. O., Crawford, L., Alvarez, N., Holderegger, R., et al. (2013). Identifying genetic signatures of selection in a non-model species, alpine gentian (Gentiana nivalis L.), using a landscape genetic approach. Conser. Genet. 14, 467–481. doi: 10.1007/s10592-012-0411-5
Brodribb, T. J., McAdam, S. A. M., Jordan, G. J., Martins, S. C. V. (2014). Conifer species adapt to low-rainfall climates by following one of two divergent pathways. Proc. Natl. Acad. Sci. U.S.A. 111, 14489–14493. doi: 10.1073/pnas.1407930111
Brousseau, L., Foll, M., Scotti-Saintagne, C., Scotti, I. (2015). Neutral and adaptive drivers of microgeographic genetic divergence within continuous populations: the case of the neotropical tree Eperua falcata (Aubl). PLoS ONE 10, e0121394. doi: 10.1371/journal.pone.0121394
Brown, M. B. (1975). A method for combining non-independent, one-sided tests of significance. Biometrics 31, 987–992. doi: 10.2307/2529826
Brown, A. H., Feldman, M. W., Nevo, E. (1980). Multilocus structure of natural populations of Hordeum spontaneum. Genetics 96, 523–536. doi: 10.2307/2529826
Bruno, J. F., Stachowicz, J. J., Bertness, M. D. (2003). Inclusion of facilitation into ecological theory. Trends Ecol. Evol. 18, 119–125. doi: 10.1016/S0169-5347(02)00045-9
Buschiazzo, E., Ritland, C., Bohlmann, J., Ritland, K. (2012). Slow but not low: genomic comparisons reveal slower evolutionary rate and higher dN/dS in conifers compared to angiosperms. BMC Evol. Biol. 12, 8. doi: 10.1186/1471-2148-12-8
Chang, C.-T., Lin, T.-C., Lin, N.-H. (2009). Estimating the critical load and the environmental and economic impact of acid deposition in Taiwan. J. Geogr. Sci. 56, 39–58.
Chang, C.-T., Wang, S.-F., Vadeboncoeur, M. A., Lin, T.-C. (2014). Relating vegetation dynamics to temperature and precipitation at monthly and annual timescales in Taiwan using MODIS vegetation indices. Int. J. Remote Sens. 35, 598–620. doi: 10.1080/01431161.2013.871593
Chen, J., Källman, T., Ma, X., Gyllenstrand, N., Zaina, G., Morgante, M., et al. (2012). Disentangling the roles of history and local selection in shaping clinal variation of allele frequencies and gene expression in Norway spruce (Picea abies). Genetics 191, 865–881. doi: 10.1534/genetics.112.140749
Chen, J.-H., Huang, C.-L., Lai, Y.-L., Chang, C.-T., Liao, P.-C., Hwang, S.-Y., et al. (2017). Postglacial range expansion and the role of ecological factors in driving adaptive evolution of Musa basjoo var. formosana. Sci. Rep. 7, 5341. doi: 10.1038/s41598-017-05256-6
Chung, J.-D., Lin, T.-P., Tan, Y.-C., Lin, M.-Y., Hwang, S.-Y. (2004). Genetic diversity and biogeography of Cunninghamia konishii (Cupressaceae), an island species in Taiwan: a comparison with Cunninghamia lanceolata, a mainland species in China. Mol. Phylogenet. Evol. 33, 791–801. doi: 10.1016/j.ympev.2004.08.011
Coart, E., Glabeke, S. V., Petit, R. J., Bockstaele, E. V., Roldań-Ruiz, I. (2005). Range wide versus local patterns of genetic diversity in hornbeam (Carpinus betulus L). Conserv. Genet. 20056, 259–273. doi: 10.1007/s10592-004-7833-7
Dehestani, A., Kazemi Tabar, S. K. (2007). A rapid efficient method for DNA isolation from plants with high levels of secondary metabolites. Asian J. Plant Sci. 6, 977–981. doi: 10.3923/ajps.2007.977.981
Dray, S., Dufour, A.-B. (2007). The ade4 package: implementing the duality diagram for ecologists. J. Stat. Soft. 22, 1–20. doi: 10.18637/jss.v022.i04
Excoffier, L., Lischer, H. E. (2010). Arlequin suite ver 3.5: a new series of programs to perform population genetics analyses under Linux and Windows. Mol. Ecol. Resour. 10, 564–567. doi: 10.1111/j.1755-0998.2010.02847.x
Fang, J.-Y., Chung, J.-D., Chiang, Y.-C., Chang, C.-T., Chen, C.-Y., Hwang, S.-Y. (2013). Divergent selection and local adaptation in disjunct populations of an endangered conifer, Keteleeria davidiana var. formosana (Pinaceae). PLoS ONE 8, e70162. doi: 10.1371/journal.pone.0070162
Foll, M. (2012). Bayescan 2.1 user manual. Available online at: http://cmpg.unibe.ch/software/BayeScan/files/BayeScan2.1_manual.pdf.
Foll, M., Gaggiotti, O. (2008). A genome scan method to identify selected loci appropriate for both dominant and codominant markers: a Bayesian perspective. Genetics 180, 977–993. doi: 10.1534/genetics.108.092221
Fox, J., Weisberg, S. (2011). An R companion to applied regression, 2nd Edn. Thousand Oaks, CA: Sage. Available online at: http://socserv.socsci.mcmaster.ca/jfox/Books/Companion.
Franks, S. J., Hoffmann, A. A. (2012). Genetics of climate change adaptation. Annu. Rev. Genet. 46, 185–208. doi: 10.1146/annurev-genet-110711-155511
Frichot, E., Francois, O. (2015). LEA: an R package for landscape and ecological association studies. Methods Ecol. Evol. 6, 925–929. doi: 10.1111/2041-210X.12382
Frichot, E., Schoville, S. D., Bouchard, G., François, O. (2013). Testing for associations between loci and environmental gradients using latent factor mixed models. Mol. Biol. Evol. 30, 1687–1699. doi: 10.1093/molbev/mst063
García-Ramos, G., Kirkpatrick, M. (1997). Genetic models of adaptation and gene flow in peripheral populations. Evolution 51, 21–28. doi: 10.1111/j.1558-5646.1997.tb02384.x
González-Martínez, S. C., Krutovsky, K. V., Neale, D. B. (2006). Forest-tree population genomics and adaptive evolution. New Phytol. 170, 227–238. doi: 10.1111/j.1469-8137.2006.01686.x
Goodrich, B., Gabry, J., Ali, I., Brilleman, S. (2018). rstanarm: Bayesian applied regression modeling via Stan. R package version 2.17.4. Available online at: http://mc-stan.org/.
Grivet, D., Sebastiani, F., Alía, R., Bataillon, T., Torre, S., Zabal-Aguirre, M., et al. (2011). Molecular footprints of local adaptation in two Mediterranean conifers. Mol. Biol. Evol. 28, 101–116. doi: 10.1093/molbev/msq190
Hamrick, J. L., Godt, M. J. W. (1996). Effects of life history traits on genetic diversity in plant species. Philos. Trans. R. Soc. Lond. B Biol. Sci. 351, 1291–1298. doi: 10.1098/rstb.1996.0112
Hamrick, J. L., Godt, M. J. W., Sherman-Broyles, S. L. (1992). Factors influencing levels of genetic diversity in woody plant species. New For. 6, 95–124. doi: 10.1007/BF00120641
Herve, M. (2018). RVAideMemoire: testing and plotting procedures for biostatistics. R Package Version 0.9-69. Available online at: https://CRAN.R-project.org/package=RVAideMemoire.
Hewitt, G. M. (1996). Some genetic consequences of ice ages, and their role in divergence and speciation. Biol. J. Linnean Soc. 58, 247–276. doi: 10.1111/j.1095-8312.1996.tb01434.x
Hewitt, G. M. (2004). Genetic consequences of climatic oscillations in the Quaternary. Phil. Trans. R. Soc. Lond. B 359, 183–195. doi: 10.1098/rstb.2003.1388
Hijmans, R. J., Cameron, S. E., Parra, J. L., Jones, P. G., Jarvis, A. (2005). Very high resolution interpolated climate surfaces for global land areas. Int. J. Climatol. 25, 1965–1978. doi: 10.1002/joc.1276
Hipkins, V. D., Krutovskii, K. V., Strauss, S. H. (1994). Organelle genomes in conifers: structure, evolution, and diversity. For. Genet. 1, 179–189.
Hoffmann, A. A., Sgrò, C. M. (2011). Climate change and evolutionary adaptation. Nature 470, 479–485. doi: 10.1038/nature09670
Holderegger, R., Herrmann, D., Poncet, B., Gugerli, F., Thuiller, W., Taberlet, P., et al. (2008). Land ahead: using genome scans to identify molecular markers of adaptive relevance. Plant Ecol. Div. 1, 273–283. doi: 10.1080/17550870802338420
Holsinger, K. E., Lewis, P. O. (2003). Hickory: a package for analysis of population genetic data v1.1, (Storrs, USA: Department of Ecology and Evolutionary Biology, University of Connecticut), Available online at: http://www.academia.edu/1839794/.
Hsieh, Y.-C., Chung, J.-D., Wang, C.-N., Chang, C.-T., Chen, C.-Y., Hwang, S.-Y. (2013). Historical connectivity, contemporary isolation and local adaptation in a widespread but discontinuously distributed species endemic to Taiwan, Rhododendron oldhamii (Ericaceae). Heredity 111, 147–156. doi: 10.1038/hdy.2013.31
Huang, C.-L., Chang, C.-T., Huang, B.-H., Chung, J.-D., Chen, J.-H., Chiang, Y.-C., et al. (2015a). Genetic relationships and ecological divergence in Salix species and populations in Taiwan. Tree Genet. Genom. 11, 39. doi: 10.1007/s11295-015-0862-1
Huang, C.-L., Chen, J.-H., Tsang, M.-H., Chung, J.-D., Chang, C.-T., Hwang, S.-Y. (2015b). Influences of environmental and spatial factors on genetic and epigenetic variations in Rhododendron oldhamii (Ericaceae). Tree Genet. Genom. 11, 823. doi: 10.1007/s11295-014-0823-0
Huete, A. R., Didan, K., Miura, T., Rodriguez, E. P., Gao, X., Ferreira, L. G. (2002). Overview of the radiometric and biophysical performance of the MODIS vegetation indices. Remote Sens. Environ. 83, 195–213. doi: 10.1016/S0034-4257(02)00096-2
Hutchison, D. W., Templeton, A. R. (1999). Correlation of pairwise genetic and geographic distance measures: inferring the relative influences of gene flow and drift on the distribution of genetic variability. Evolution 53, 1898–1914. doi: 10.1111/j.1558-5646.1999.tb04571.x
Hwang, S.-Y., Lin, T.-P., Ma, C.-S., Lin, C.-L., Chung, J.-D., Yang, J.-C. (2003). Postglacial population growth of Cunninghamia konishii (Cupressaceae) inferred from phylogeographical and mismatch analysis of chloroplast DNA variation. Mol. Ecol. 12, 2689–2695. doi: 10.1046/j.1365-294X.2003.01935.x
Jombart, T., Ahmed, I. (2011). Adegenet 1.3-1: new tools for the analysis of genome-wide SNP data. Bioinformatics 27, 3070–3071. doi: 10.1093/bioinformatics/btr521
Jombart, T., Devillard, S., Balloux, F. (2010). Discriminant analysis of principal components: a new method for the analysis of genetically structured populations. BMC Genet. 11, 94. doi: 10.1186/1471-2156-11-94
Jump, A. S., Peñuelas, J. (2006). Genetic effects of chronic habitat fragmentation in a wind-pollinated tree. Proc. Natl. Acad. Sci. U.S.A. 103, 8096–8100. doi: 10.1073/pnas.0510127103
Kalinowski, S. T. (2004). Counting alleles with rarefaction: private alleles and hierarchical sampling designs. Conserv. Genet. 5, 539–543. doi: 10.1023/B:COGE.0000041021.91777.1a
Kamvar, Z. N., Tabima, J. F., Grünwald, N. J. (2014). Poppr: an R package for genetic analysis of populations with clonal, partially clonal, and/or sexual reproduction. Peer J. 2, e281. doi: 10.7717/peerj.281
Kamvar, Z. N., Brooks, J. C., Grünwald, N. J. (2015). Novel R tools for analysis of genome-wide population genetic data with emphasis on clonality. Front. Genet. 6, 208. doi: 10.3389/fgene.2015.00208
Kawecki, T. J., Ebert, D. (2004). Conceptual issues in local adaptation. Ecol. Lett. 7, 1225–1241. doi: 10.1111/j.1461-0248.2004.00684.x
Kitagawa, R., Mimura, M., Mori, A. S., Sakai, A. (2015). Topographic patterns in the phylogenetic structure of temperate forests on steep mountainous terrain. AoB Plants 7, 1–134. doi: 10.1093/aobpla/plv134
Lande, R. (1988). Genetics and demography in biological conservation. Science 241, 1455–1460. doi: 10.1126/science.3420403
Latta, R. G., Mitton, J. B. (1999). Historical separation and present gene flow through a zone of secondary contact in ponderosa pine. Evolution 53, 769–776. doi: 10.1111/j.1558-5646.1999.tb05371.x
Lenormand, T. (2002). Gene flow and the limits to natural selection. Trends Ecol. Evol. 17, 183–189. doi: 10.1016/S0169-5347(02)02497-7
Lenth, R. (2018). Emmeans: estimated marginal means, aka least-squares means. R package version 1.3.1. Available online at: https://CRAN.R-project.org/package=emmeans.
Li, C.-F., Chytrý, M., Zelený, D., Chen, M.-Y., Chen, T.-Y., Chiou, C.-R., et al. (2013). Classification of Taiwan forest vegetation. Appl. Veg. Sci. 16, 698–719. doi: 10.1111/avsc.12025
Li, Y.-S., Chang, C.-T., Wang, C.-N., Thomas, P., Chung, J.-D., Hwang, S.-Y. (2018). The contribution of neutral and environmentally dependent processes in driving population and lineage divergence in Taiwania (Taiwania cryptomerioides). Front. Plant Sci. 9, 1148. doi: 10.3389/fpls.2018.01148
Lin, T.-P., Lu, C.-S., Chung, Y.-L., Yang, J.-C. (1993). Allozyme variation in four populations of Taiwania cryptomerioides in Taiwan. Silv. Genet. 42, 278–284.
Lin, T.-P., Wang, C.-T., Yang, J.-C. (1998). Comparison of genetic diversity between Cunninghamia konishii and C. lanceolata. J. Hered. 89, 370–374. doi: 10.1093/jhered/89.4.370
Linhart, Y. B., Grant, M. C. (1996). Evolutionary significance of local genetic differentiation in plants. Ann. Rev. Ecol. Syst. 27, 237–277. doi: 10.1146/annurev.ecolsys.27.1.237
Liu, T. (1966). Study on the phytogeography of the conifers and taxads of Taiwan. Bull. Taiwan For. Res. Inst. 122, 1–33.
Manni, F., Guerard, E., Heyer, E. (2004). Geographic patterns of (genetic, morphologic, linguistic) variation: how barriers can be detected by using Monmonier’s algorithm. Human Biol. 76, 173–190. doi: 10.1353/hub.2004.0034
Mimura, M., Aitken, S. N. (2010). Local adaptation at the range peripheries of Sitka spruce. J. Evol. Biol. 23, 249–259. doi: 10.1111/j.1420-9101.2009.01910.x
Monahan, W. B., Pereira, R. J., Wake, D. B. (2012). Ring distributions leading to species formation: a global topographic analysis of geographic barriers associated with ring species. BMC Biol. 10, 20. doi: 10.1186/1741-7007-10-20
Monmonier, M. S. (1973). Maximum-difference barriers: an alternative numerical regionalization method. Geograp. Anal. 3, 245–261. doi: 10.1111/j.1538-4632.1973.tb01011.x
Naimi, B., Hamm, N. A. S., Groen, T. A., Skidmore, A. K., Toxopeus, A. G. (2014). Where is positional uncertainty a problem for species distribution modelling? Ecography 37, 191–203. doi: 10.1111/j.1600-0587.2013.00205.x
Nakazato, T., Warren, D. L., Moyle, L. C. (2010). Ecological and geographic modes of species divergence in wild tomatoes. Am. J. Bot. 97, 680–693. doi: 10.3732/ajb.0900216
Neale, D. B., Marshall, K. A., Harry, D. E. (1991). Inheritance of chloroplast and mitochondrial DNA in incense-cedar (Calocedrus decurrens). Can. J. For. Res. 21, 717–720. doi: 10.1139/x91-100
Nei, M. (1987). Molecular evolutionary genetics. New York, NY: Columbia University Press. doi: 10.7312/nei-92038
Nga, N. T. T., Dung, N. A., Chung, N. T., Thai, T. H., Hung, N. D. (2016). The distribution and some ecological characteristics, and essential oil of Cunninghamia konishii Hayata in Pu Hoat nature reserve, Nghe An province, Vietnam. KKU Eng. J. 43, 121–124. doi: 10.14456/kkuenj.2016.37
Nosil, P., Vines, T. H., Funk, D. J. (2005). Reproductive isolation caused by natural selection against immigrants from divergent habitats. Evolution 59, 705–719. doi: 10.1111/j.0014-3820.2005.tb01747.x
Nybom, H. (2004). Comparison of different nuclear DNA markers for estimating intraspecific genetic diversity in plants. Mol. Ecol. 13, 1143–1155. doi: 10.1111/j.1365-294X.2004.02141.x
Oksanen, J., Blanchet, F. G., Friendly, M., Kindt, R., Legendre, P., McGlinn, D., et al. (2017). vegan: community ecology package. R Package Version 2.4-2. Available online at: https://CRAN.R-project.org/package=vegan.
Parmesan, C., Yohe, G. (2003). A globally coherent fingerprint of climate change impacts across natural systems. Nature 421, 37–42. doi: 10.1038/nature01286
Peres-Neto, P. R., Legendre, P., Dray, S., Borcard, D. (2006). Variation partitioning of species data matrices: estimation and comparison of fractions. Ecology 87, 2614–2625. doi: 10.1890/0012-9658(2006)87[2614:VPOSDM]2.0.CO;2
Petit, R. J., Aguinagalde, I., de Beaulieu, J.-L., Bittkau, C., Brewer, S., Cheddadi, R., et al. (2003). Glacial refugia: hotspots but not melting pots of genetic diversity. Science 300, 1563–1565. doi: 10.1126/science.1083264
Petit, R. J., Hampe, A. (2006). Some evolutionary consequences of being a tree. Annu. Rev. Ecol. Evol. Syst. 37, 187–214. doi: 10.1146/annurev.ecolsys.37.091305.110215
Pulliam, H. R. (2000). On the relationship between niche and distribution. Ecol. Lett. 3, 349–361. doi: 10.1046/j.1461-0248.2000.00143.x
R Development Core Team. (2018). R: a language and environment for statistical computing. Version 3.5.2. Vienna: R Foundation for Statistical Computing. Available online at: https://www.r-project.org/.
Ribeiro, M. M., Mariette, S., Vendramin, G. G., Szmidt, A. E., Plomion, C., Kremer, A. (2002). Comparison of genetic diversity estimates within and among populations of maritime pine using chloroplast simple-sequence repeat and amplified fragment length polymorphism data. Mol. Ecol. 11, 869–877. doi: 10.1046/j.1365-294X.2002.01490.x
Ringbauer, H., Kolesnikov, A., Field, D. L., Barton, N. H. (2018). Estimating barriers to gene flow from distorted isolation by distance patterns. Genetics 208, 1231–1245. doi: 10.1534/genetics.117.300638
Roscher, C., Schumacher, J., Gubsch, M., Lipowsky, A., Weigelt, A., Buchmann, N., et al. (2012). Using plant functional traits to explain diversity–productivity relationships. PLoS ONE 7, e36760. doi: 10.1371/journal.pone.0036760
Rosenberg, N. J., Blat, B. L., Verma, S. B., (1983). Microclimate: the biological environment. New York, NY: Wiley.
Sexton, J. P., Hangartner, S. B., Hoffmann, A. A. (2014). Genetic isolation by environment or distance: which pattern of gene flow is most common? Evolution 68, 1–15. doi: 10.1111/evo.12258
Shih, K.-M., Chang, C.-T., Chung, J.-D., Chiang, Y.-C., Hwang, S.-Y. (2018). Adaptive genetic divergence despite significant isolation-by-distance in populations of Taiwan cow-tail fir (Keteleeria davidiana var. formosana). Front. Plant Sci. 9, 92. doi: 10.3389/fpls.2018.00092
Slatkin, M. (2008). Linkage disequilibrium—understanding the evolutionary past and mapping the medical future. Nat. Rev. Genet. 9, 477–485. doi: 10.1038/nrg2361
Szpiech, Z. A., Jakobsson, M., Rosenberg, N. A. (2008). ADZE: a rarefaction approach for counting alleles private to combinations of populations. Bioinformatics 24, 2498–2504. doi: 10.1093/bioinformatics/btn478
Storey, J. D., Bass, A. J., Dabney, A., Robinson, D. (2019). qvalue: Q-value estimation for false discovery rate control. R package version 2.14.1. Available online at: http://github.com/StoreyLab/qvalue.
Strasburg, J. L., Sherman, N. A., Wright, K. M., Moyle, L. C., Willis, J. H., Rieseberg, L. H. (2012). What can patterns of differentiation across plant genomes tell us about adaptation and speciation? Philos. Trans. Biol. Sci. 367, 364–373. doi: 10.1098/rstb.2011.0199
Stucki, S., Orozco-terWengel, P., Bruford, M. W., Colli, L., Masembe, C., Negrini, R., et al. (2017). High performance computation of landscape genomic models integrating local indices of spatial association. Mol. Ecol. Resour. 17, 1072–1089. doi: 10.1111/1755-0998.12629
Su, H. J. (1984). Studies on the climate and vegetation types of the natural forest in Taiwan. (II). Altitudinal vegetation zones in relation to temperature gradient. Q. J. Chin. For. 17, 57–73.
Thornthwaite, C. W. (1948). An approach toward a rational classification of climate. Geogr. Rev. 38, 55–94. doi: 10.2307/210739
Turgeon, J., Bernatchez, L. (2001). Clinal variation at microsatellite loci reveals historical secondary intergradation between glacial races of Coregonus artedi (Teleostei: Coregoninae). Evolution 55, 2274–2286. doi: 10.1111/j.0014-3820.2001.tb00742.x
Vandewalle, M., de Bello, F., Berg, M. P., Bolger, T., Dolédec, S., Dubs, F., et al. (2010). Functional traits as indicators of biodiversity response to land use changes across ecosystems and organisms. Biodivers. Conserv. 19, 2921–2947. doi: 10.1007/s10531-010-9798-9
Vekemans, X., Beauwens, T., Lemaire, M., Roldán-Ruiz, I. (2002). Data from amplified fragment length polymorphism (AFLP) markers show indication of size homoplasy and of a relationship between degree of homoplasy and fragment size. Mol. Ecol. 11, 139–151. doi: 10.1046/j.0962-1083.2001.01415.x
Via, S. (2009). Natural selection in action during speciation. Proc. Natl. Acad. Sci. U.S.A. 106, 9939–9946. doi: 10.1073/pnas.0901397106
Vos, P., Hogers, R., Bleeker, M., Reijans, M., van der Lee, T., Hornes, M., et al. (1995). AFLP: a new technique for DNA fingerprinting. Nucl. Acids Res. 23, 4407–4414. doi: 10.1093/nar/23.21.4407
Wall, J. D., Andolfatto, P., Przeworski, M. (2002). Testing models of selection and demography in Drosophila simulans. Genetics 162, 203–216.
Wang, I. J., Glor, R. E., Losos, J. B. (2013). Quantifying the roles of ecology and geography in spatial genetic divergence. Ecol. Lett. 16, 175–182. doi: 10.1111/ele.12025
Wang, J., Feng, C., Jiao, T., Von Wettberg, E. B., Kang, M. (2017). Genomic signatures of adaptive divergence despite strong nonadaptive forces on edaphic islands: a case study of Primulina juliae. Genom. Biol. Evol. 9, 3495–3508. doi: 10.1093/gbe/evx263
Weir, B. S., Cockerham, C. C. (1984). Estimating F-statistics for the analysis of population-structure. Evolution 38, 1358–1370. doi: 10.2307/2408641
Wolf, J. B., Lindell, J., Backström, N. (2010). Speciation genetics: current status and evolving approaches. Philos. Trans. Biol. Sci. 365, 1717–1733. doi: 10.1098/rstb.2010.0023
Zhang, J., Cheng, K., Zang, R., Ding, Y. (2014). Environmental filtering of species with different functional traits into plant assemblages across a tropical coniferous-broadleaved forest ecotone. Plant Soil 380, 361–374. doi: 10.1007/s11104-014-2088-7
Zhang, H., Hare, M. P. (2012). Identifying and reducing AFLP genotyping error: an example of tradeoffs when comparing population structure in broadcast spawning versus brooding oysters. Heredity 108, 616– 625. doi: 10.1038/hdy.2011.132
Keywords: AFLP, barriers to gene flow, conservation, Cunninghamia konishii, mountain ranges
Citation: Li Y-S, Shih K-M, Chang C-T, Chung J-D and Hwang S-Y (2019) Testing the Effect of Mountain Ranges as a Physical Barrier to Current Gene Flow and Environmentally Dependent Adaptive Divergence in Cunninghamia konishii (Cupressaceae). Front. Genet. 10:742. doi: 10.3389/fgene.2019.00742
Received: 01 February 2019; Accepted: 15 July 2019;
Published: 09 August 2019.
Edited by:
Melanie April Murphy, University of Wyoming, United StatesReviewed by:
Roser Vilatersana, Spanish National Research Council (CSIC), SpainZhiyong Zhang, Jiangxi Agricultural University, China
Copyright © 2019 Li, Shih, Chang, Chung and Hwang. This is an open-access article distributed under the terms of the Creative Commons Attribution License (CC BY). The use, distribution or reproduction in other forums is permitted, provided the original author(s) and the copyright owner(s) are credited and that the original publication in this journal is cited, in accordance with accepted academic practice. No use, distribution or reproduction is permitted which does not comply with these terms.
*Correspondence: Shih-Ying Hwang, aHN5OTM0N0BudG51LmVkdS50dw==
†These authors have contributed equally to this work.