 Yi Zhang
 Mohith Manjunath
 Jialu Yan
 Brittany A. Baur
 Shilu Zhang
 Sushmita Roy
 Jun S. Song
- 1Department of Bioengineering, University of Illinois at Urbana-Champaign, Urbana, IL, United States
- 2Carl R. Woese Institute for Genomic Biology, University of Illinois at Urbana-Champaign, Urbana, IL, United States
- 3Department of Physics, University of Illinois at Urbana-Champaign, Urbana, IL, United States
- 4Wisconsin Institute for Discovery, University of Wisconsin–Madison, Madison, WI, United States
- 5Department of Biostatistics and Medical Informatics, University of Wisconsin–Madison, Madison, WI, United States
Genome-wide association studies (GWAS) have hitherto identified several germline variants associated with cancer susceptibility, but the molecular functions of these risk modulators remain largely uncharacterized. Recent studies have begun to uncover the regulatory potential of noncoding GWAS SNPs using epigenetic information in corresponding cancer cell types and matched normal tissues. However, this approach does not explore the potential effect of risk germline variants on other important cell types that constitute the microenvironment of tumor or its precursor. This paper presents evidence that the breast-cancer-associated variant rs3903072 may regulate the expression of CTSW in tumor-infiltrating lymphocytes. CTSW is a candidate tumor-suppressor gene, with expression highly specific to immune cells and also positively correlated with breast cancer patient survival. Integrative analyses suggest a putative causative variant in a GWAS-linked enhancer in lymphocytes that loops to the 3’ end of CTSW through three-dimensional chromatin interaction. Our work thus poses the possibility that a cancer-associated genetic variant could regulate a gene not only in the cell of cancer origin but also in immune cells in the microenvironment, thereby modulating the immune surveillance by T lymphocytes and natural killer cells and affecting the clearing of early cancer initiating cells.
Introduction
Genome-wide association studies (GWAS) have been effective in identifying common genetic risk factors for several diseases including cancer. The cancer-associated genetic variants discovered by GWAS, however, are not necessarily causative themselves but may be in linkage disequilibrium (LD) with other functional variants. Since most GWAS variants are located in noncoding regions, previous functional characterization studies have focused on the gene regulatory function of these linked variants in cancer cells themselves and in matched normal counterparts (Cowper-Sal lari et al., 2012; Ghoussaini et al., 2014; Claussnitzer et al., 2015; Zhang et al., 2018b). For example, usage of breast cancer epigenome facilitated the discovery of a GWAS-linked functional variant that disrupts a binding site of FOXA1, which is a critical pioneer factor in estrogen receptor-positive (ER+) breast cancers (Cowper-Sal lari et al., 2012); similarly, another study identified a functional diabetes-associated variant using the epigenomic information in adipose-derived mesenchymal stem cells (Claussnitzer et al., 2015). Although new insights have resulted from these investigations, a provocative question that has not yet been examined is whether select cancer-associated germline variants could also be functional in cell types other than the cell of cancer origin, such as endothelial cells and immune cells, within the heterogeneous tumor microenvironment (Liu and Mardis, 2017). For example, in tumor-infiltrating lymphocytes (TIL), genetic variants regulating cytotoxicity-controlling genes may impact TIL’s ability to eliminate cancerous cells, thereby functioning as cryptic modulators of cancer susceptibility that have escaped our attention to date. Since cancer initiation not only involves the acquisition of mutations in normal cells but also depends on the efficiency of immune surveillance against abnormal cells, it is important to identify cancer-associated germline variants that may contribute to cancer susceptibility through modulating immune cells (Lim et al., 2018; Schmiedel et al., 2018).
We have previously introduced a systematic computational framework for studying regulatory functions of noncoding GWAS variants associated with ER+ breast cancer by employing epigenomic information from breast cancer cell lines and normal mammary epithelial cells (Zhang et al., 2018b). By incorporating additional data in immune cells, we here apply this approach to present evidence for the possibility that a breast cancer GWAS variant may influence immune cells in the microenvironment of tumor or its precursor. We demonstrate that the breast-cancer-associated single nucleotide polymorphisms (SNP), rs3903072, targets the gene CTSW uniquely in TILs. CTSW encodes a cysteine proteinase highly specific to natural killer (NK) cells and T cells and is potentially involved in regulating their cytotoxity; consistently, CTSW expression negatively correlates with both the risk allele at rs3903072 and the survival probability in breast cancer. We propose an intergenic regulatory variant, in high LD with rs3903072, as a predicted functional SNP, which falls in a putative regulatory element (PRE) physically interacting with the 3’ of CTSW. Our work renews the interest of CTSW in tumor surveillance and showcase a situation that shall be considered in functional characterization of GWAS variants.
Materials and Methods
GWAS Variants
A list of ER+ breast-cancer-associated variants were first obtained from Michailidou et al. (2013) and the NHGRI-EBI GWAS catalog (MacArthur et al., 2017). GWAS variants associated with immunoinflammatory traits were identified using the disease category information from the Experimental Factor Ontology (EFO) database (Malone et al., 2010). We ranked the ER+ breast cancer GWAS SNPs based on the number of proximal immunoinflammatory GWAS SNPs and found rs3903072 to be the top SNP (Supplementary Methods). A supplementary table was also obtained from Michailidou et al. (2017), which provides all SNPs associated with breast cancer with p < 10–5.
The Cancer Genome Atlas (TCGA) Cancer Data
The germline genotypes at tag SNPs of breast cancer (Breast Invasive Carcinoma, BRCA) patients in the TCGA dataset were downloaded from the TCGA Data Portal. The tumor copy number segmentation data in hg19 from the NCI Genomic Data Commons (GDC) Legacy Archive (Grossman et al., 2016) were used to compute gene copy number (CN). The processed gene expression data in fragments per kilobase million (FPKM) measured by RNA-seq were downloaded from the TCGA GDC data portal (Grossman et al., 2016). Germline genotypes from normal tissues and CN/RNA-seq data from tumor tissues were matched using TCGA barcodes representing patients. For three other TCGA cancer datasets—uterine corpus endometrial carcinoma (UCEC), head–neck squamous cell carcinoma (HNSC), and low-grade glioma (LGG)—only the germline genotypes and processed gene expression levels were used. Genotype imputation was then performed for BRCA, UCEC, HNSC, and LGG datasets using the Michigan Imputation Server (Das et al., 2016) (Supplementary Methods).
The Genotype-Tissue Expression (GTEx) Project Data
The GTEx gene expression levels in reads per kilobase million (RPKM) and tissue type annotations were obtained from the GTEx portal (GTEx Consortium, 2013; Carithers et al., 2015). We analyzed the GTEx data with two aims: comparing the expression levels of a certain gene across different tissues, and analyzing the correlation between the genotype at a GWAS SNP and candidate target gene expression level. For the first purpose, we used the mean expression level of CTSW measured in the GTEx tissues (Supplementary Methods). For the second aim, we used the fully processed, filtered, and normalized gene expression levels in the breast mammary tissue and the whole blood from GTEx Analysis V7 (dbGaP Accession phs000424.v7.p2); the imputed genotypes were extracted from the controlled-access dbGaP Accession phg000520.v2 (GTEx V2) dataset.
Expression Quantitative Trait Loci (eQTL) Analysis for TCGA-BRCA
In this paper, a pilot eQTL analysis was first performed among ER+ breast cancer patients. For this ER+ breast cancer analysis, we constructed a multivariate linear model for each gene within the 3-Mb region centered at rs3903072, regressing the gene expression levels against the genotypes at the GWAS SNP rs3903072 as well as the gene CN (Zhang et al., 2018b) (Supplementary Methods). Genes with and the genotype p ≤ 0.05 from the linear regression were selected for further investigation. Among them, CTSW was identified as a signal different from other genes (Supplementary Methods). A second stage of eQTL analyses was performed to validate the genotype correlation of CTSW in other cancer types. For these eQTL analyses using BRCA, UCEC, HNSC, LGG, and GTEx data, linear regression models between CTSW expression and the genotype status at rs3903072 were constructed (Supplementary Methods).
TCGA Survival Analysis
Survival analysis in TCGA ER+ breast cancer patients was performed using the clinical data obtained from TCGA-GDC. The differences in survival rate between the two breast cancer patient groups separated by CTSW median expression level were tested using log-rank test (Supplementary Methods). Survival analysis results were also obtained in endometrial cancer (UCEC), head and neck cancer (HNSC), and renal cancer, all from the human protein atlas (THPA) (Uhlen et al., 2017d), choosing the median expression level as the cutoff threshold for grouping patients (Supplementary Methods).
Tissue Specificity of CTSW in Expression and Promoter Accessibility
CTSW gene expression in a variety of tissues and cell lines was obtained from BioGPS GeneAtlas (Wu et al., 2016), cancer cell line encyclopedia (CCLE) (Barretina et al., 2012), and functional annotation of the mammalian genome (FANTOM) (The Fantom Consortium and the Riken PMI and CLST (DGT) et al., 2014) resources. DNase-seq chromatin accessibility measurements in various tissues were obtained from the Encyclopedia of DNA Elements (ENCODE) (The Encode Project Consortium et al., 2012) and the Roadmap Epigenomics project (Bernstein et al., 2010) (Supplementary Methods).
Chromatin Interaction Analysis by Paired-End Tag Sequencing (ChIA-PET) Data Analysis
We searched the ENCODE and Gene Expression Omnibus (GEO) (Barrett et al., 2013) databases for available three-dimension (3D) chromatin interaction data in lymphocyte cell lines expressing CTSW and found two ChIA-PET datasets in the Jurkat cell line for the proteins SMC1 (GSE68978) (Hnisz et al., 2016) and RAD21 (ENCODE Accession ENCSR361AYD). For the SMC1 ChIA-PET data, we used the significant interactions processed and merged by the authors from GEO. For the RAD21 ChIA-PET data, we collected all the raw sequences and generated the chromatin interactions using ChIA-PET 2 (Li et al., 2017) with default parameters.
Prioritization of Functional SNPs Linked to GWAS SNPs
We first selected all common (minor allele frequency, MAF ≥ 0.05) SNPs from 1000 Genomes Project Phase 3 (The Genomes Project Consortium et al., 2015) in high LD (r2 ≥ 0.8, EUR population) with rs3903072. To prioritize SNPs located in PREs, we collected DNase I hypersensitive sites (DHS) from ENCODE and the Roadmap Epigenomics Project in lymphocyte-related cells, such as T cells, NK cells, B cells, T helper cells, and common myeloid progenitor cells. The LD SNPs overlapping any of the DHS peaks were prioritized for further investigation. In addition to DHS, we also used H3K4me1 modification (processed wiggle track in Jurkat cells from GSE119439) (Leong et al., 2017) to prioritize SNPs within putative regulatory elements.
Motif Analysis
TF-position-specific weight matrices (PWM) were collected from HOCOMOCO Human v10 (Kulakovskiy et al., 2016), FACTORBOOK (Wang et al., 2012), TRANSFAC (Matys et al., 2006), JASPAR vertebrates (Mathelier et al., 2016), and Jolma2013 (Jolma et al., 2013). To identify potential binding sites affected by SNPs, we used the program FIMO (version 4.12.0) (Grant et al., 2011) to scan the 51-bp sequences carrying either allele of each prioritized SNP in the center (FIMO threshold 10–3). The statistical significance of motif disruption or creation effect of the SNP alleles was then measured using our previous method of simulating null mutations in motif sequences (Zhang et al., 2018b).
ChIP-seq Analysis
ChIP-seq data for relevant TFs were collected from ENCODE and GEO. Processed wiggle tracks and peaks were downloaded and presented when available in hg19 [Jurkat H3K4me1 ChIP-seq track from GSE119439 (Leong et al., 2017); TBX21 ChIP-seq pooled wiggle track and peaks in GM12878 from ENCODE ENCFF193RDB and ENCFF869HSY]. For TCF3 ChIP-seq data in Kasumi1 and KLF1 ChIP-seq in GM12878, the raw sequences were downloaded from GSE43834 (Sun et al., 2013) and GSE43625 (Su et al., 2013), respectively, mapped to hg19 using BWA (Li and Durbin, 2010) (-n 2) and analyzed for peaks using MACS2 (Zhang et al., 2008) (callpeak: -q 0.1 --SPMR; bdgcmp: -m FC).
Results
The rs3903072 Risk Locus Has Rich Immunoinflammatory Signals in Proximity
We hypothesized that the proximity of a genetic variant associated with cancer to those associated with immunoinflammatory traits might indicate pleiotropy of nearby genes or regulatory variants. In this regard, we examined the NHGRI-EBI GWAS Catalog (MacArthur et al., 2017) and identified rs3903072 as the top breastcancer-associated variant having the highest density of proximal variants within 100 kb associated with immunoinflammatory traits (Supplementary Methods; Supplementary Figure 1; Supplementary Table 1). The SNP rs3903072 has been found to be associated with ER+ breast cancer in multiple GWAS studies (Michailidou et al., 2013; MacArthur et al., 2017; Michailidou et al., 2017), and lies in close physical distance, but with weak genetic linkage (Supplementary Table 2), to multiple variants associated with immunoinflammatory diseases—such as rs118086960 with psoriasis (an autoimmune disease) (Tsoi et al., 2017), rs77779142 with rosacea symptom (an inflammatory skin condition) (Aponte et al., 2018), rs2231884 with inflammatory bowel disease (Jostins et al., 2012), and rs568617 with psoriasis and Crohn’s disease (an inflammatory bowel disease) (Ellinghaus et al., 2016) (Figure 1A; Supplementary Table 1). A direct link between this noncoding SNP rs3903072 and its regulatory function in mammary epithelial cells is currently unknown; similarly, it remains uncharacterized how and why the aforementioned SNPs in the region affect diverse immunoinflammatory traits. Discovering the target genes of rs3903072 thus represents a major step towards identifying a potential regulatory mechanism common to both breast cancer susceptibility and immunoinflammatory traits.
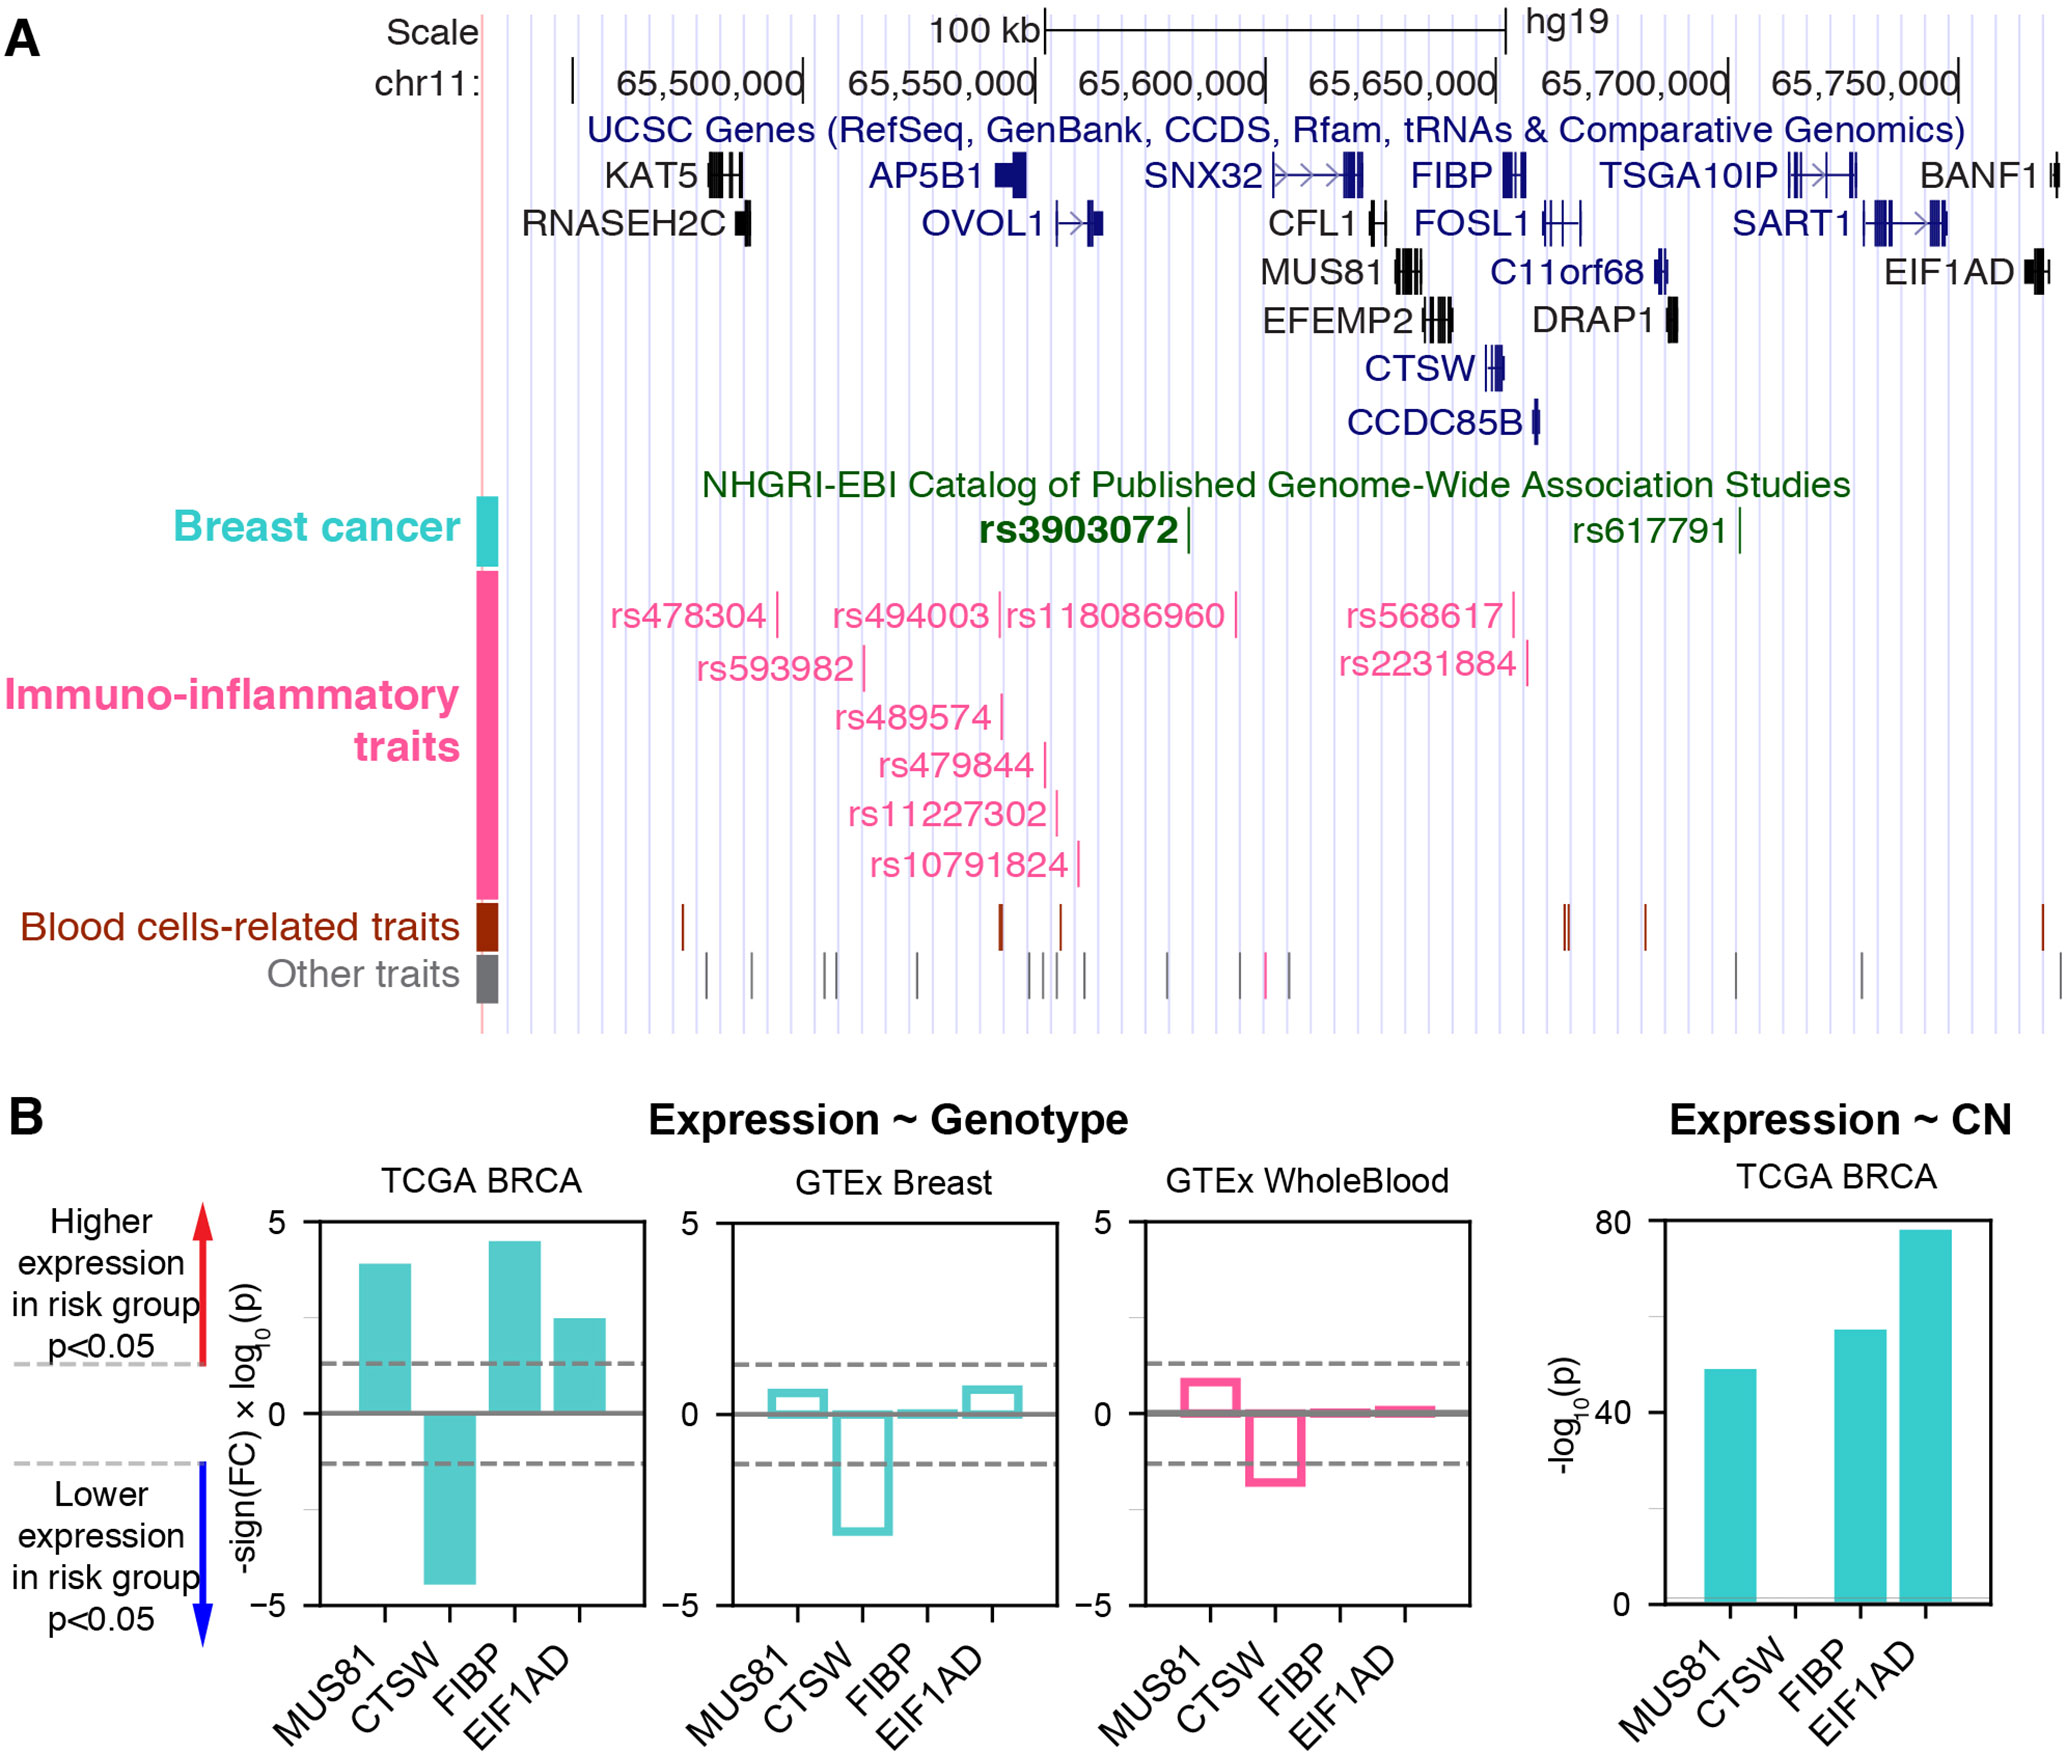
Figure 1 The breast cancer risk variant rs3903072 in the 11q13.1 region. (A) The top track shows UCSC genes, and the lower track shows the GWAS variants grouped by their reported traits into four categories (Supplementary Table 1). The SNP rs3903072 shows a stronger association with breast cancer (p = 2 × 10–12) than the variant rs617791 (p = 7 × 10⁻⁶). (B) The eQTL results for rs3903072. A full list of eQTL genes is in Supplementary Table 3. Left three bar plots show the significance of the contribution from rs3903072 genotype to the expression level of MUS81, CTSW, FIBP and EIF1AD. Positive values represent higher expression as the number of risk allele increases, and negative values represent the opposite trend. CTSW is the only eQTL gene with a significant suppression in the risk genotype group. This negative correlation between CTSW expression level and the genotype status is confirmed in the three independent datasets shown. The right bar plot shows the significance of the contribution from gene copy number to the expression level of each gene. Filled bar plots represent tumor, while transparent plots represent normal tissues; in this paper, we use the cyan color to indicate breast-related cancer or normal cells and the magenta color to indicate blood-related cells. The dotted lines in gray mark the significance threshold of p = 0.05.
eQTL and Survival Analysis Demonstrate the Tumor-Suppressive Role of CTSW
To identify candidate target genes, we applied the approach of eQTL, quantifying the correlation of messenger RNA (mRNA) levels of nearby genes with the genotype status at rs3903072 (Material and Methods). Using ER+ breast tumor RNA sequencing (RNA-seq) and genotyping data from the BRCA dataset of TCGA, we identified several significant eQTL genes in cis for rs3903072, including CTSW, FIBP, MUS81, and EIF1AD (genotype p-values of a linear model adjusting for gene copy number: p= 3.52 × 10⁻⁵, p = 3.22 × 10⁻⁵, p = 1.24 × 10⁻⁴, p = 3.28 × 10⁻³, respectively (Figure 1B); a complete list of eQTL genes in Supplementary Table 3), confirming the results previously reported (Michailidou et al., 2013). Notably, CTSW was among the most significant eQTL genes; the negative correlation between CTSW expression and the number of risk alleles indicated a tumor-suppressive role of this gene (Figure 2A). In line with the eQTL result, survival analysis of BRCA patients showed that higher CTSW expression was associated with significantly better survival probability [log-rank p-value with median expression cutoff; p = 0.026, for ER+ breast cancer patients analyzed in this study (Figure 2B); p = 7.3 × 10⁻⁴ for all BRCA patients in the analysis performed by THPA (Uhlen et al., 2017d), image: (Uhlen et al., 2017a)]. By contrast, according to the TCGA analysis presented in THPA, other eQTL genes were not significantly associated with breast cancer patient survival.
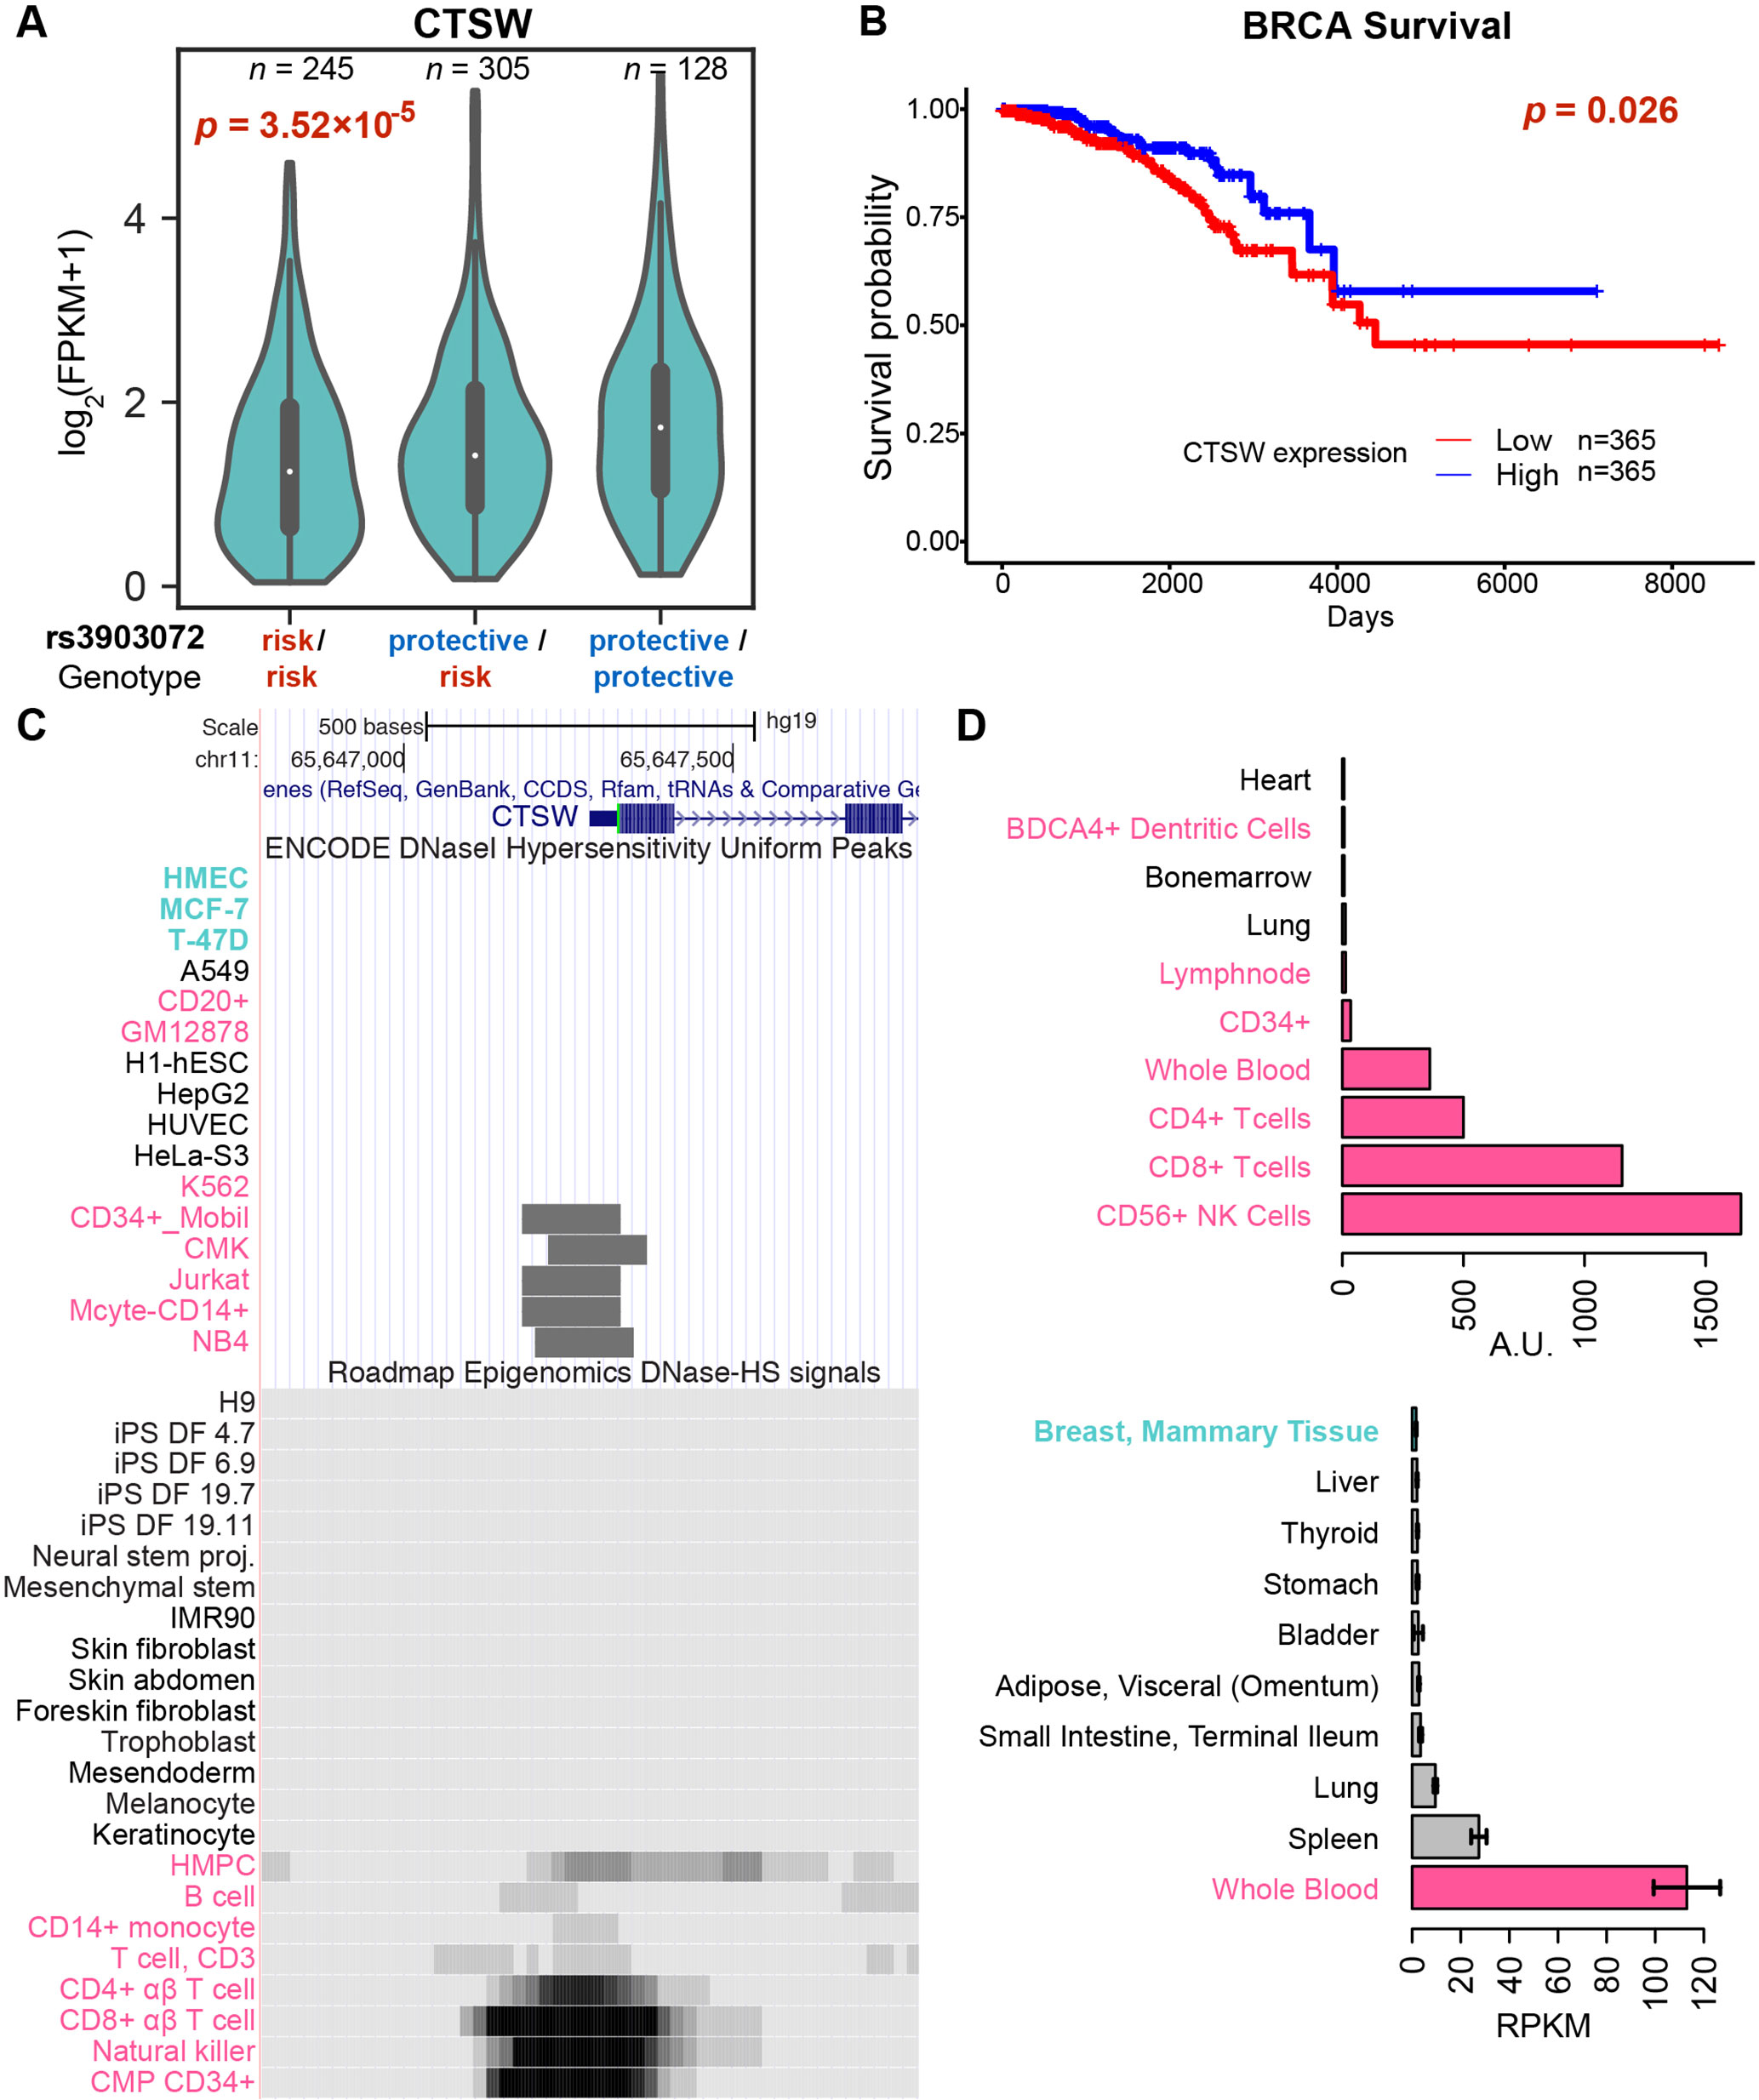
Figure 2 Genotype-dependent suppression and tissue specificity of CTSW expression. (A) The violin plot of CTSW expression levels in three genotype groups at rs3903072, using the TCGA ER+ breast cancer patient data. The p-value is for the coefficient of genotype in multivariate linear regression with adjustment for gene copy number. (B) Survival analysis of breast cancer patients based on CTSW expression levels. The p-value is from the log-rank test using the two groups separated by the median expression of CTSW. (C) The CTSW promoter chromatin accessibility in multiple cell lines from various tissue origins. The top ENCODE plot shows the DNase I hypersensitivity (DHS) uniform peaks in ENCODE tier 1 cell lines, along with the tier 2/3 cells in which CTSW promoter is open. The bottom plot shows the DHS signals for primary cells from Roadmap Epigenomics data. Cells with breast tissue origin are marked as cyan, and blood-related normal or cancer cells are marked as magenta. HMPC, hematopoietic multipotent progenitor cells; CMP CD34+, common myeloid progenitor cells CD34+. (D) Distribution of CTSW expression in cell lines and in tissues. The top figure shows data from BioGPS, displaying only 10 cell types with highest CTSW expression. The bottom figure shows data from GTEx, displaying only nine tissue types with highest CTSW expression and mammary tissue (ranked 13th).
Consistent with our finding, a similar drop in survival probability with lower CTSW expression was also observed in other cancer types including endometrial cancer (UCEC) and head and neck cancer (HNSC), according to THPA (Uhlen et al., 2017d) [log-rank p-values with median expression cutoff; UCEC: p = 4.1 × 10⁻⁴, image: (Uhlen et al., 2017c); HNSC: p = 1.9 × 10⁻² image: (Uhlen et al., 2017b); Supplementary Methods]. In THPA, although the renal cancer group showed an opposite survival trend when kidney renal clear cell carcinoma (KIRC), kidney renal papillary cell carcinoma (KIRP), and kidney chromophobe (KICH) were combined (THPA p = 1.4 × 10⁻⁴; log-rank p-value with median expression cutoff), the trend was significant only in KIRP when each group was checked separately (THPA; Supplementary Methods). Further eQTL analysis confirmed a similar negative correlation between CTSW expression level and the rs3903072 risk genotype in UCEC and HNSC, as well as in LGG, a cancer type not shown in the THPA survival analysis webpage (linear model between expression and rs3903072 genotype; UCEC: p = 1.52 × 10⁻³; HNSC: p = 5.45 × 10⁻³; LGG: p = 7.09 × 10⁻³; Supplementary Figure 2). Together, these results demonstrate that CTSW likely has an important biological function in cancer and that the breast cancer risk allele rs3903072-G is significantly associated with decreased expression of CTSW.
The GWAS-CTSW Association Arises From Tumor-Infiltrating Lymphocytes
Interestingly, the following pieces of evidence show that unlike other eQTL genes, CTSW is specifically expressed and functions in blood cells, particularly in NK cells and T cells. First, CTSW encodes the protein cathepsin W, also named lymphopain, which is a cysteine protease reported to be involved in the cytolytic activity of NK cells and cytotoxic T cells (Wex et al., 2001; O’Leary et al., 2016). Second, the CTSW promoter region is not accessible in normal mammary cells or breast cancer cells (HMEC, MCF-7, T-47D) but is open in CD8+ T cells, CD56+ NK cells, CD34+ common myeloid progenitor cells, and the acute T cell leukemia cell line Jurkat (Figure 2C), according to the DNase I hypersensitive sites sequencing (DNase-seq) data from ENCODE and the Roadmap Epigenomics Project. Third, CTSW is predominantly expressed in blood cell lines but not detectable in human mammary cell lines, according to the gene expression measurements in BioGPS (microarray; Figure 2D) and CCLE (RNA-seq; Supplementary Figure 3). Fourth, the CTSW promoter is actively transcribed in several lymphocytes but not in breast cells, according to the cap analysis of gene expression (CAGE) sequencing data from FANTOM5 (Supplementary Figure 4). Fifth, among different normal tissue types, CTSW expression level measured by GTEx (GTEx Consortium, 2013; Carithers et al., 2015) is highest in whole blood, moderate in lung and spleen, and low or undetectable in other tissues, whereas other eQTL genes such as FIBP, MUS81, and EIF1AD are relatively ubiquitously expressed across different tissue types including the mammary gland (Supplementary Figure 5). Finally, it has been recently shown that an elevated level of CTSW expression is observed in CD8+ T cells with enhanced immunity against bacterial infection and cancer (Oghumu et al., 2015), as well as in renal cancer with high lymphocyte infiltration (Ghatalia et al., 2018). Together, these findings demonstrate the high specificity of CTSW expression to immune cells, indicating that the CTSW mRNA in the TCGA breast tumor bulk RNA-seq has likely arisen from TILs in the heterogeneous tumor microenvironment (Liu and Mardis, 2017). In fact, the expression patterns of immune signature genes in TCGA RNA-seq data have been used to infer the abundance of different immune cells in tumor and quantify immune infiltration levels (Li et al., 2016).
We thus hypothesized that the breast-cancer-associated GWAS variant rs3903072 may regulate CTSW in immune cells within the tumor microenvironment, independent of the other eQTL genes that could potentially be regulated separately in breast cancer cells. Several observations supported this idea. First, CTSW was the only TCGA-BRCA eQTL gene that remained correlated with the GWAS genotype status in the GTEx normal mammary tissue (p = 8.64 × 10⁻⁴) and whole blood (p = 0.016; Figure 1B; Supplementary Figure 2B). Second, CTSW was the only eQTL gene that showed no correlation with DNA copy number in TCGA breast cancer data (p = 0.72; Figure 1B; Supplementary Table 3), suggesting regulation unaffected by the genomic amplification or deletion events abundant in cancer cells. Third, CTSW was the only eQTL gene showing negative correlation with the number of risk alleles at the GWAS SNP, whereas other eQTL genes had the opposite trend, indicating that CTSW may play a tumor-suppressive role in TILs, while others may be involved in promoting cancer progression (linear regression coefficient in BRCA ER + eQTL: CTSW, r = –0.22; FIBP, r = 0.09; MUS81, r = 0.08; EIF1AD, r = 0.05; Figure 1B). Lastly, CTSW was the only gene of known function related to immune cells across the region shown in Figure 1A (Supplementary Table 4), where multiple GWAS associations point to immunoinflammatory traits. Even though we do not exclude the possibility that other eQTL genes may also have important functions in TILs or breast cancer cells, the tissue specificity and the correlation structure of CTSW expression strongly suggest its significant modulation in tumor-infiltrating immune cells by the GWAS SNP rs3903072 itself or a linked genetic variant.
A Putative Regulatory SNP in CTSW Promoter Does Not Solely Explain the Breast Cancer Association
As the GWAS SNP rs3903072 itself did not reside in an open chromatin region in immune cells (Figure 3A), we next searched for putative regulatory variants that could directly control CTSW expression. We first found the SNP rs658524 to be located at the center of a DHS peak in CTSW promoter among several lymphocyte cell lines (Supplementary Figure 6). On the one hand, the SNP rs658524 was simultaneously linked to two of the immunoinflammatory GWAS variants. Namely, the GWAS SNP rs77779142, associated with Rosacea symptoms, was in tight LD with the CTSW promoter SNP rs658524 (r2 = 0.78 with rs658524; r2 = 0.17 with rs3903072; 1000 Genomes Phase 3 EUR population), despite being closer to the breast cancer GWAS SNP rs3903072 than to rs658524 in genomic distance (16.6 kb to rs3903072 vs. 47.6 kb to rs658524). Another GWAS SNP rs568617, associated with Psoriasis and Crohn’s disease, resided in intron of the gene FIBP next to CTSW and was in high LD with the CTSW promoter SNP rs658524 (r2 = 0.99 to rs658524; r2 = 0.19 to rs3903072; Figure 1A). On the other hand, the promoter SNP rs658524 was strongly correlated with CTSW expression, according to our eQTL analysis in TCGA (linear model between expression and rs658524 genotype; BRCA: p = 1.02 × 10⁻¹⁷; UCEC: p = 1.50 × 10⁻¹¹; HNSC: p = 1.32 × 10⁻¹²; LGG: p = 1.43 × 10⁻⁶; Supplementary Figure 7A) and GTEx (mammary tissue: p = 2.19 × 10⁻¹¹; whole blood: p = 8.48 × 10⁻⁵; Supplementary Figure 7B), consistent with eQTL results from other immune cell studies (Raj et al., 2014).
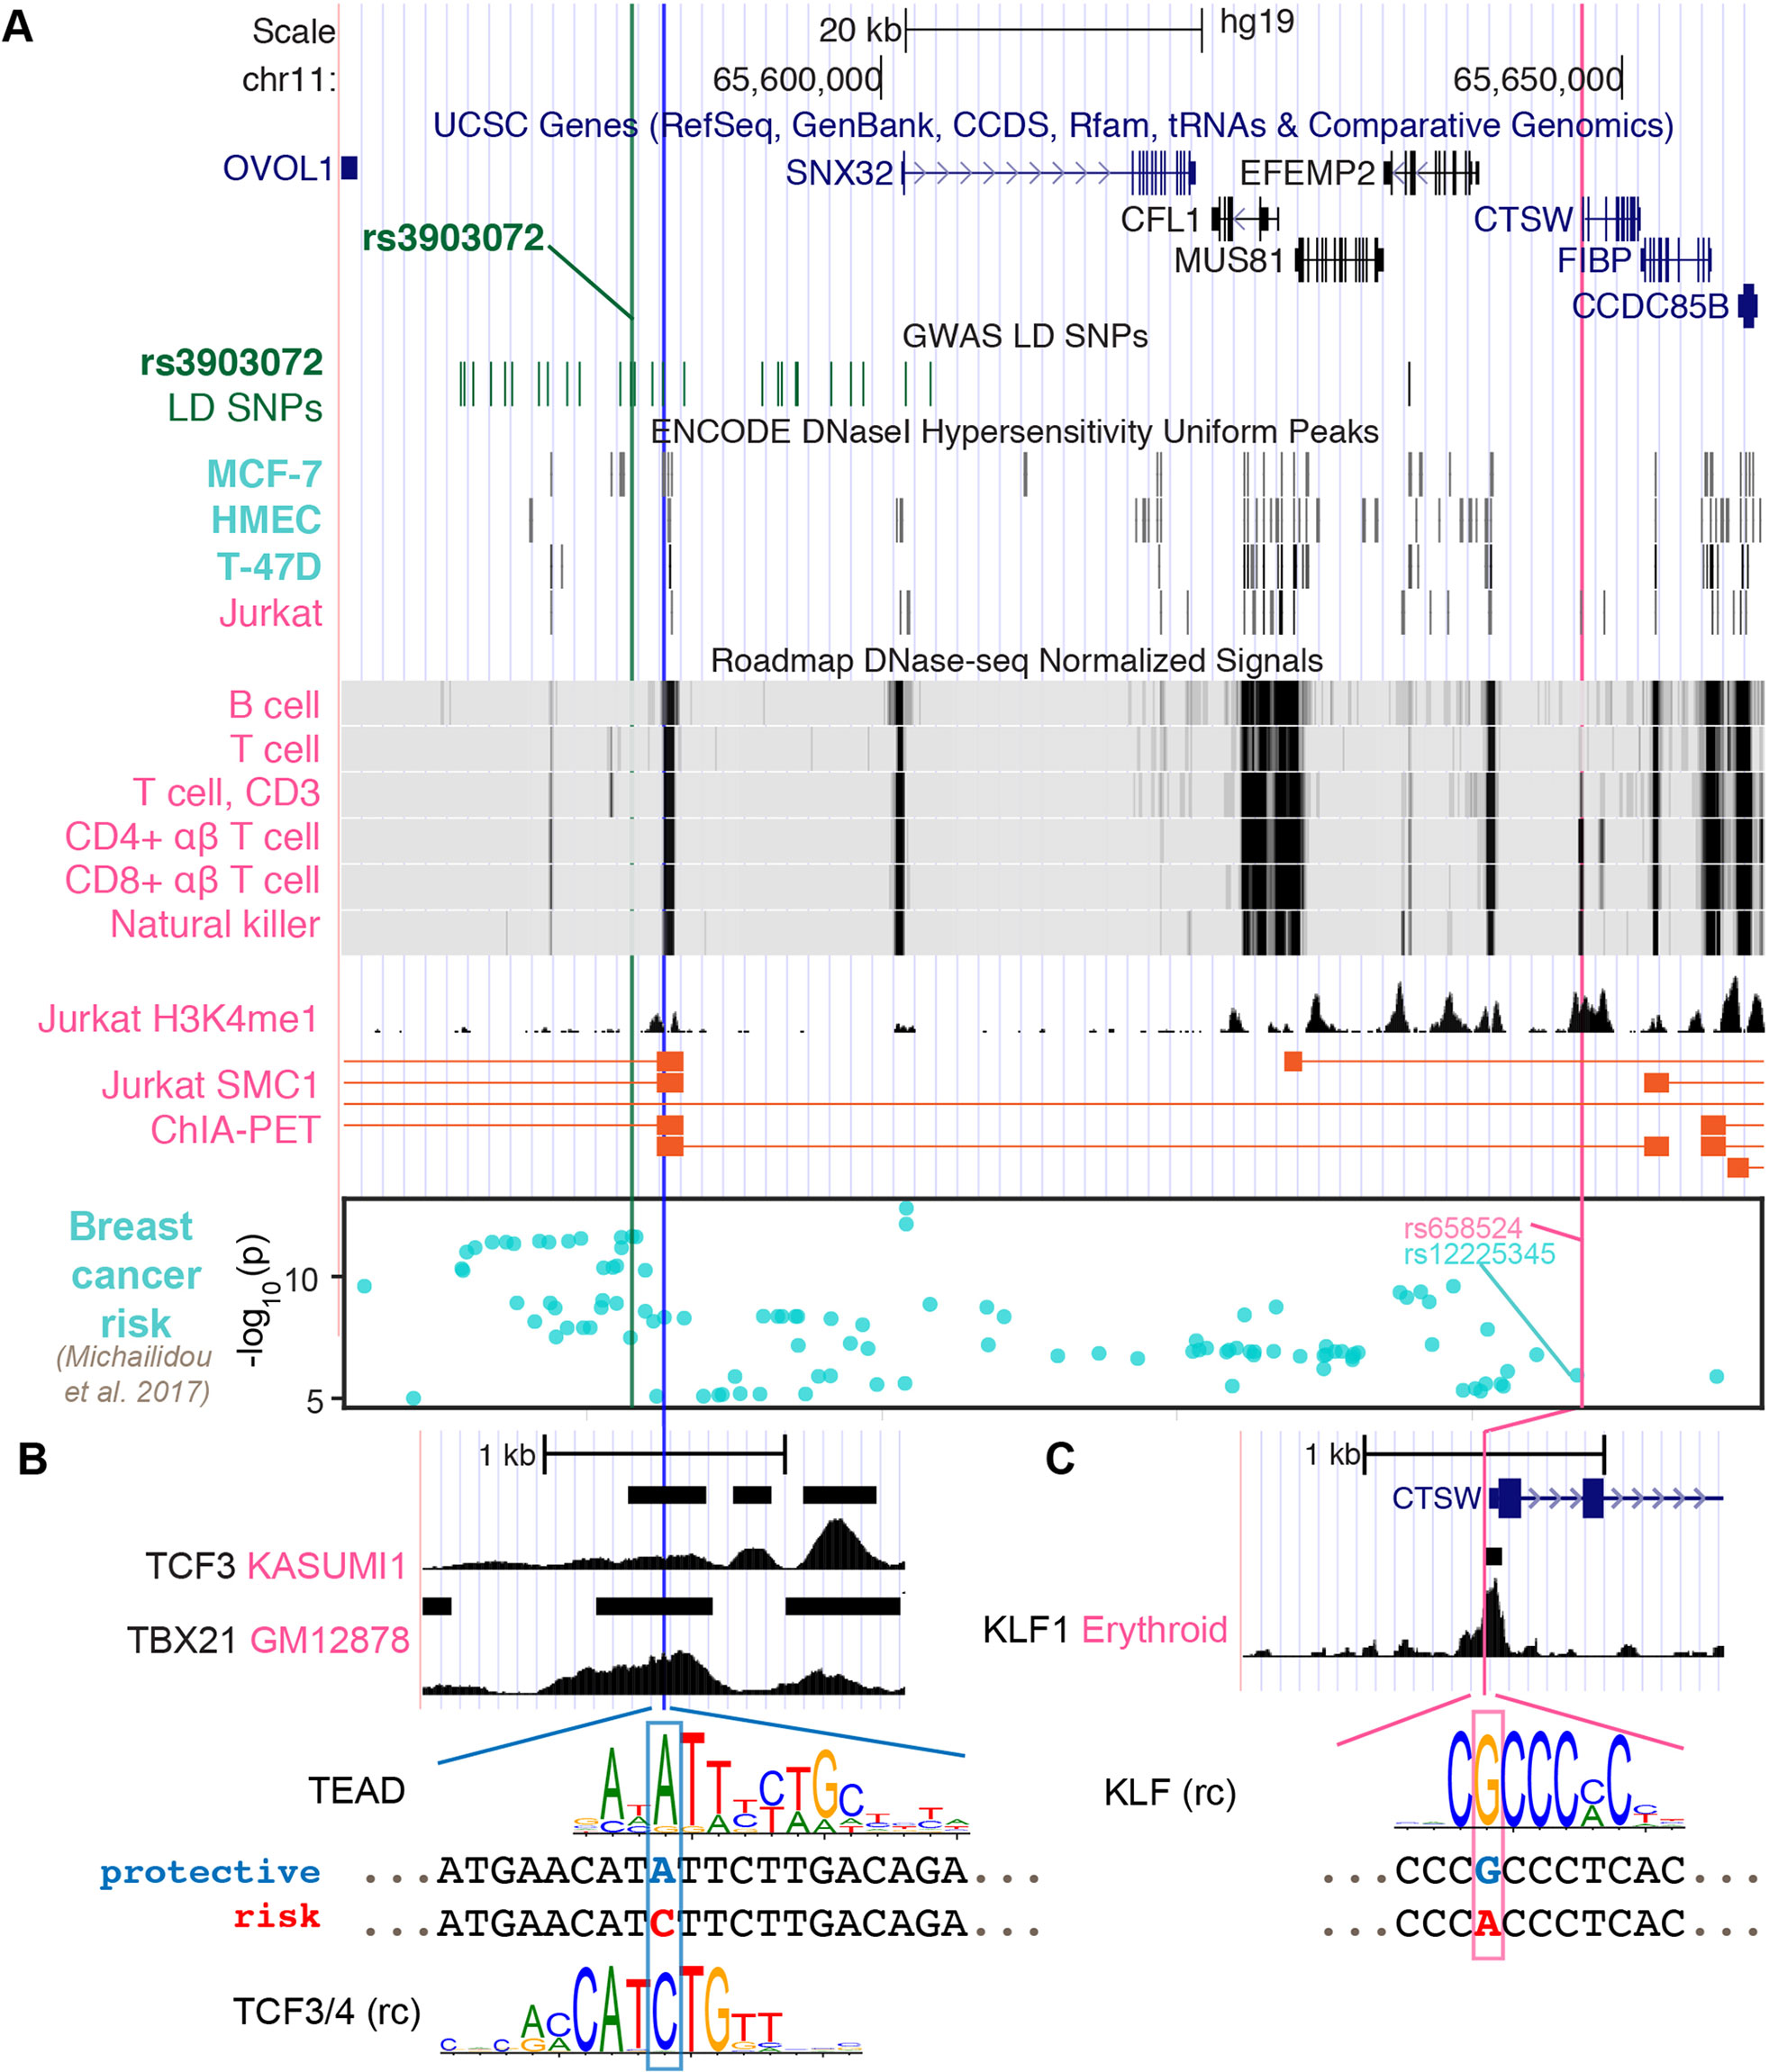
Figure 3 Potential regulatory mechanisms for CTSW. (A) The genomic region ranging from the GWAS SNP rs3903072 to CTSW is shown, including the gene track, the GWAS LD SNPs, epigenetics information, and 3D chromatin interaction. The chromatin accessibility data are shown for breast-related cells and blood cells from ENCODE and Roadmap Epigenomics Project. The H3K4me1 modification track and the SMC1 ChIA-PET significant interactions in the Jurkat cell line are from GSE119439 and GSE68978. The bottom Manhattan plot shows the SNPs associated with breast cancer with p < 10–5. Three SNPs are marked: the GWAS SNP rs3903072 and the GWAS-linked putative enhancer SNP in blue and the CTSW promoter SNP in magenta. (B, C) Zoomed-in views of the two potential regulatory SNPs. For the GWAS-linked putative enhancer SNP, TCF3 ChIP-seq data in Kasumi1 and TBX21 ChIP-seq data in GM12878 are shown. Two candidate TF motifs predicted to be affected by the SNP are also shown, where the protective allele is marked blue and the risk allele red. For the CTSW promoter SNP, KLF1 ChIP-seq profile in erythroid cells is plotted, along with a KLF family motif (rc, reverse complement).
We here note that rs658524-A also showed partial association with breast cancer risk, since the haplotypes carrying the rs658524-A allele were found to be largely biased towards the GWAS risk allele rs3903072-G compared to the alternative allele rs3903072-T, despite the balanced MAF of rs3903072 (rs3903072 MAF = 0.46; 188 haplotypes with rs658524-A-rs3903072-G and 3 haplotypes with rs658524-A-rs3903072-T among the 1,006 haplotypes from the 1000 Genomes Project Phase 3 EUR population; Supplementary Figure 6B). In fact, rs658524 was in weak LD with rs3903072 (low r2 = 0.186, but high D' = 0.966), with the GWAS risk SNP having a much higher allele frequency than the risk promoter SNP (rs3903072-G frequency: 0.54; rs658524-A frequency: 0.19; 1000 Genomes Project Phase 3, EUR). However, the CTSW promoter SNP rs658524 itself did not entirely explain either the GWAS association or the CTSW regulation in this region. A recent study reporting GWAS SNPs with a p < 10–5 for breast cancer (Michailidou et al., 2017) included the CTSW locus (Manhattan plot in Figure 3A). The top SNP linked to rs658524 was rs12225345 (r2 = 0.84), which was only moderately associated with breast cancer (p = 1.13 × 10⁻⁶), separated from the top GWAS signal cluster represented by rs3903072 (p = 2.25 × 10⁻¹²) (Michailidou et al., 2017). Furthermore, a conditional eQTL analysis showed that, within the group of TCGA patients carrying the homozygous genotype rs658524-G/G, the rs3903072 risk allele still displayed a residual negative effect on CTSW expression (Welch t-test, two-sided, p = 6.0 × 10⁻⁴; GTEx whole blood data; Supplementary Figure 8). Thus, although the CTSW promoter SNP was in high D′ with the breast cancer GWAS SNP rs3903072, it did not solely explain the breast cancer risk in 11q13.1, and other functional SNPs likely influenced the expression of CTSW.
An Active Distal Enhancer of CTSW Harbors a Candidate Functional Variant Linked to rs3903072
Given that the GWAS SNP rs3903072 was located 64 kb away from CTSW promoter, we tested whether some putative functional SNPs tightly linked to rs3903072 could affect distal enhancer activities modulating CTSW expression. We thus examined all common (MAF ≥ 0.05) SNPs from 1000 Genomes Project Phase 3 EUR population in high LD (r2 ≥ 0.8) with the GWAS SNP rs3903072 and prioritized the potential functional ones using epigenetic information. In detail, by overlapping the 30 high LD SNPs with DHS of lymphocyte cell lines (Supplementary Table 5), we identified three SNP-containing PREs): PRE1 located 3 kb away from rs3903072, PRE2 at SNX32 promoter, and PRE3 at EFEMP2 promoter (Supplementary Figure 9). Further investigation of the available 3D chromatin interaction data in immune-related cells highlighted PRE1 as the top regulatory element physically interacting with the 3’ end of CTSW, as assessed by the structural maintenance of chromosomes protein 1 [SMC1; GSE68978 (Hnisz et al., 2016)] ChIA-PET data (Figure 3A). Another Jurkat ChIA-PET data for RAD21, a cohesin complex component, showed an indirect interaction linking PRE1 and CTSW mediated through an anchoring element near EIF1AD, suggesting multiway interactions between the several anchoring elements or enhancers (Materials and Methods; Supplementary Figure 9). To contrast the chromatin interaction of PRE1 with CTSW between NK/T cells and mammary cells, we predicted high-resolution (5 kb) Hi-C interactions in NK cells, CD8+ αβ T cells, and benign variant human mammary epithelial cells (vHMEC). Using random forest-based regression models trained separately on high-resolution Hi-C data in five different cell lines (Rao et al., 2014) (Supplementary Methods), we predicted the contact counts in the three cell types of interest within 1 Mb from rs3903072. Consistent with the ChIA-PET data, NK cells were found to have the highest predicted contact count for the pair of rs3903072-PRE1 and CTSW in all five models (Supplementary Figure 10), in contrast to vHMEC, which had the lowest predicted contact counts. These findings together suggested that PRE1 linked to the GWAS SNP could function as a distal regulatory element controlling CTSW expression selectively in NK and T cells.
Among the prioritized SNPs residing in the three PREs, we identified rs11227311 in PRE1 as a putative functional SNP (r2 = 0.89 with rs3903072, 1000 Genomes Phase 3, EUR). More precisely, it not only overlapped a DHS in NK cells, B cells, and type 2 T helper cells (ENCODE accession number: ENCFF933OXV, ENCFF772OPR, ENCFF001WTS, and ENCFF001WTQ) but also H3K4me1 modification and the ChIA-PET region interacting with CTSW 3’ end in Jurkat (Figure 3A; Supplementary Figure 9). Furthermore, the Roadmap Epigenomics Project annotates the PRE1 region as TSS and weak enhancer in multiple types of primary blood cells (Supplementary Figure 11). To identify candidate TFs in PRE1 potentially affected by rs11227311, we scanned the short sequences around the SNP for TF motifs, using the program FIMO (version 4.12.0) and position weight matrices (PWM) collected from multiple motif databases (Materials and Methods). Using our previously described method for measuring the significance of motif disruption by a SNP, based on simulating null mutations on the PWMs (Zhang et al., 2018b), we identified a list of candidate TF motifs disrupted by rs11227311, including the TEAD family, TCF family, NR3C1, POU2F1, and ETV5 (Figure 3B; Supplementary Figure 9; p-values from neutral mutation simulation: p = 0.0074, p = 0.0086, p = 0.002, p = 0.013, p = 0.045, respectively; Methods). GREAT (McLean et al., 2010) analysis of available ChIP-seq data suggested that some of our candidate TFs might regulate genes closely related to the immune system. For example, gene ontology terms related to interferon-gamma, an important immunoregulatory molecule, and pathways related to T-cell signaling were enriched for TEAD2 (K562 cell line; Supplementary Methods; Supplementary Table 6). It is also known that TCF1, one of the four TCF family members, plays an important role in normal development of natural killer cells (Jeevan-Raj et al., 2017). Although it was difficult to validate which TF can directly bind the PRE1 SNP due to insufficient ChIP-seq data in T/NK cells, we found the PRE1 candidate SNP rs11227311 to be located within a weak TCF3 ChIP-seq peak in Kasumi1 acute myeloid leukemia cell line [GEO GSE43834 (Sun et al., 2013)] (Figure 3B; Materials and Methods). Examination of other ChIP-seq data in ENCODE for TFs in lymphocytes also showed that the SNP rs11227311 is at the center of a strong TBX21 ChIP-seq peak in GM12878 (ENCSR739IHN; Figure 3B). TBX21 is a T-box transcription factor controlling important genes in NK cells and type 1 T helper cells (O’Leary et al., 2016), and its binding supports the potential involvement of PRE1 in gene regulation in lymphocytes. In addition, we performed a motif analysis for the CTSW promoter SNP and found that it might disrupt the binding site of the KLF family TFs (p = 0.0086; Materials and Methods), the actual binding of which in this region was supported by a KLF1 ChIP-seq dataset in erythroid cells [GSE43625 (Su et al., 2013); Figure 3C].
Discussion
In this paper, we performed functional characterization of breast cancer-associated GWAS variants and proposed the idea that a noncoding cancer GWAS SNP may regulate gene expression in immune cells within the tumor microenvironment. Figure 4 summarizes our hypothesis that the GWAS-linked SNP rs11227311 may directly affect TF binding affinity at the distal enhancer and regulate CTSW expression in cytotoxic lymphocytes, thereby affecting their ability to eliminate abnormal cells. As a member in the cathepsin family, CTSW is specifically expressed in NK and T cells with a potential role in their cytotoxicity; it can also be strongly induced in NK cells by interleukin-2 (IL-2) (Wex et al., 2001), which is a cytokine controlling T cell growth and NK cell cytotoxicity. Although the function of cathepsin W and its precise relation to lymphocyte cytotoxicity remain under debate (Dalton et al., 2013), the described association between CTSW and breast cancer susceptibility renews the interest in this gene as a component of immune surveillance against cancer. Recent studies have demonstrated that tumor impurity is an important factor to consider in eQTL analysis (Geeleher et al., 2018; Lim et al., 2018). Along this line, our work further highlights the need to examine the effect of GWAS SNPs on gene regulation not only in the cell type of disease but also in surrounding cells that may modulate the progression of pathology.
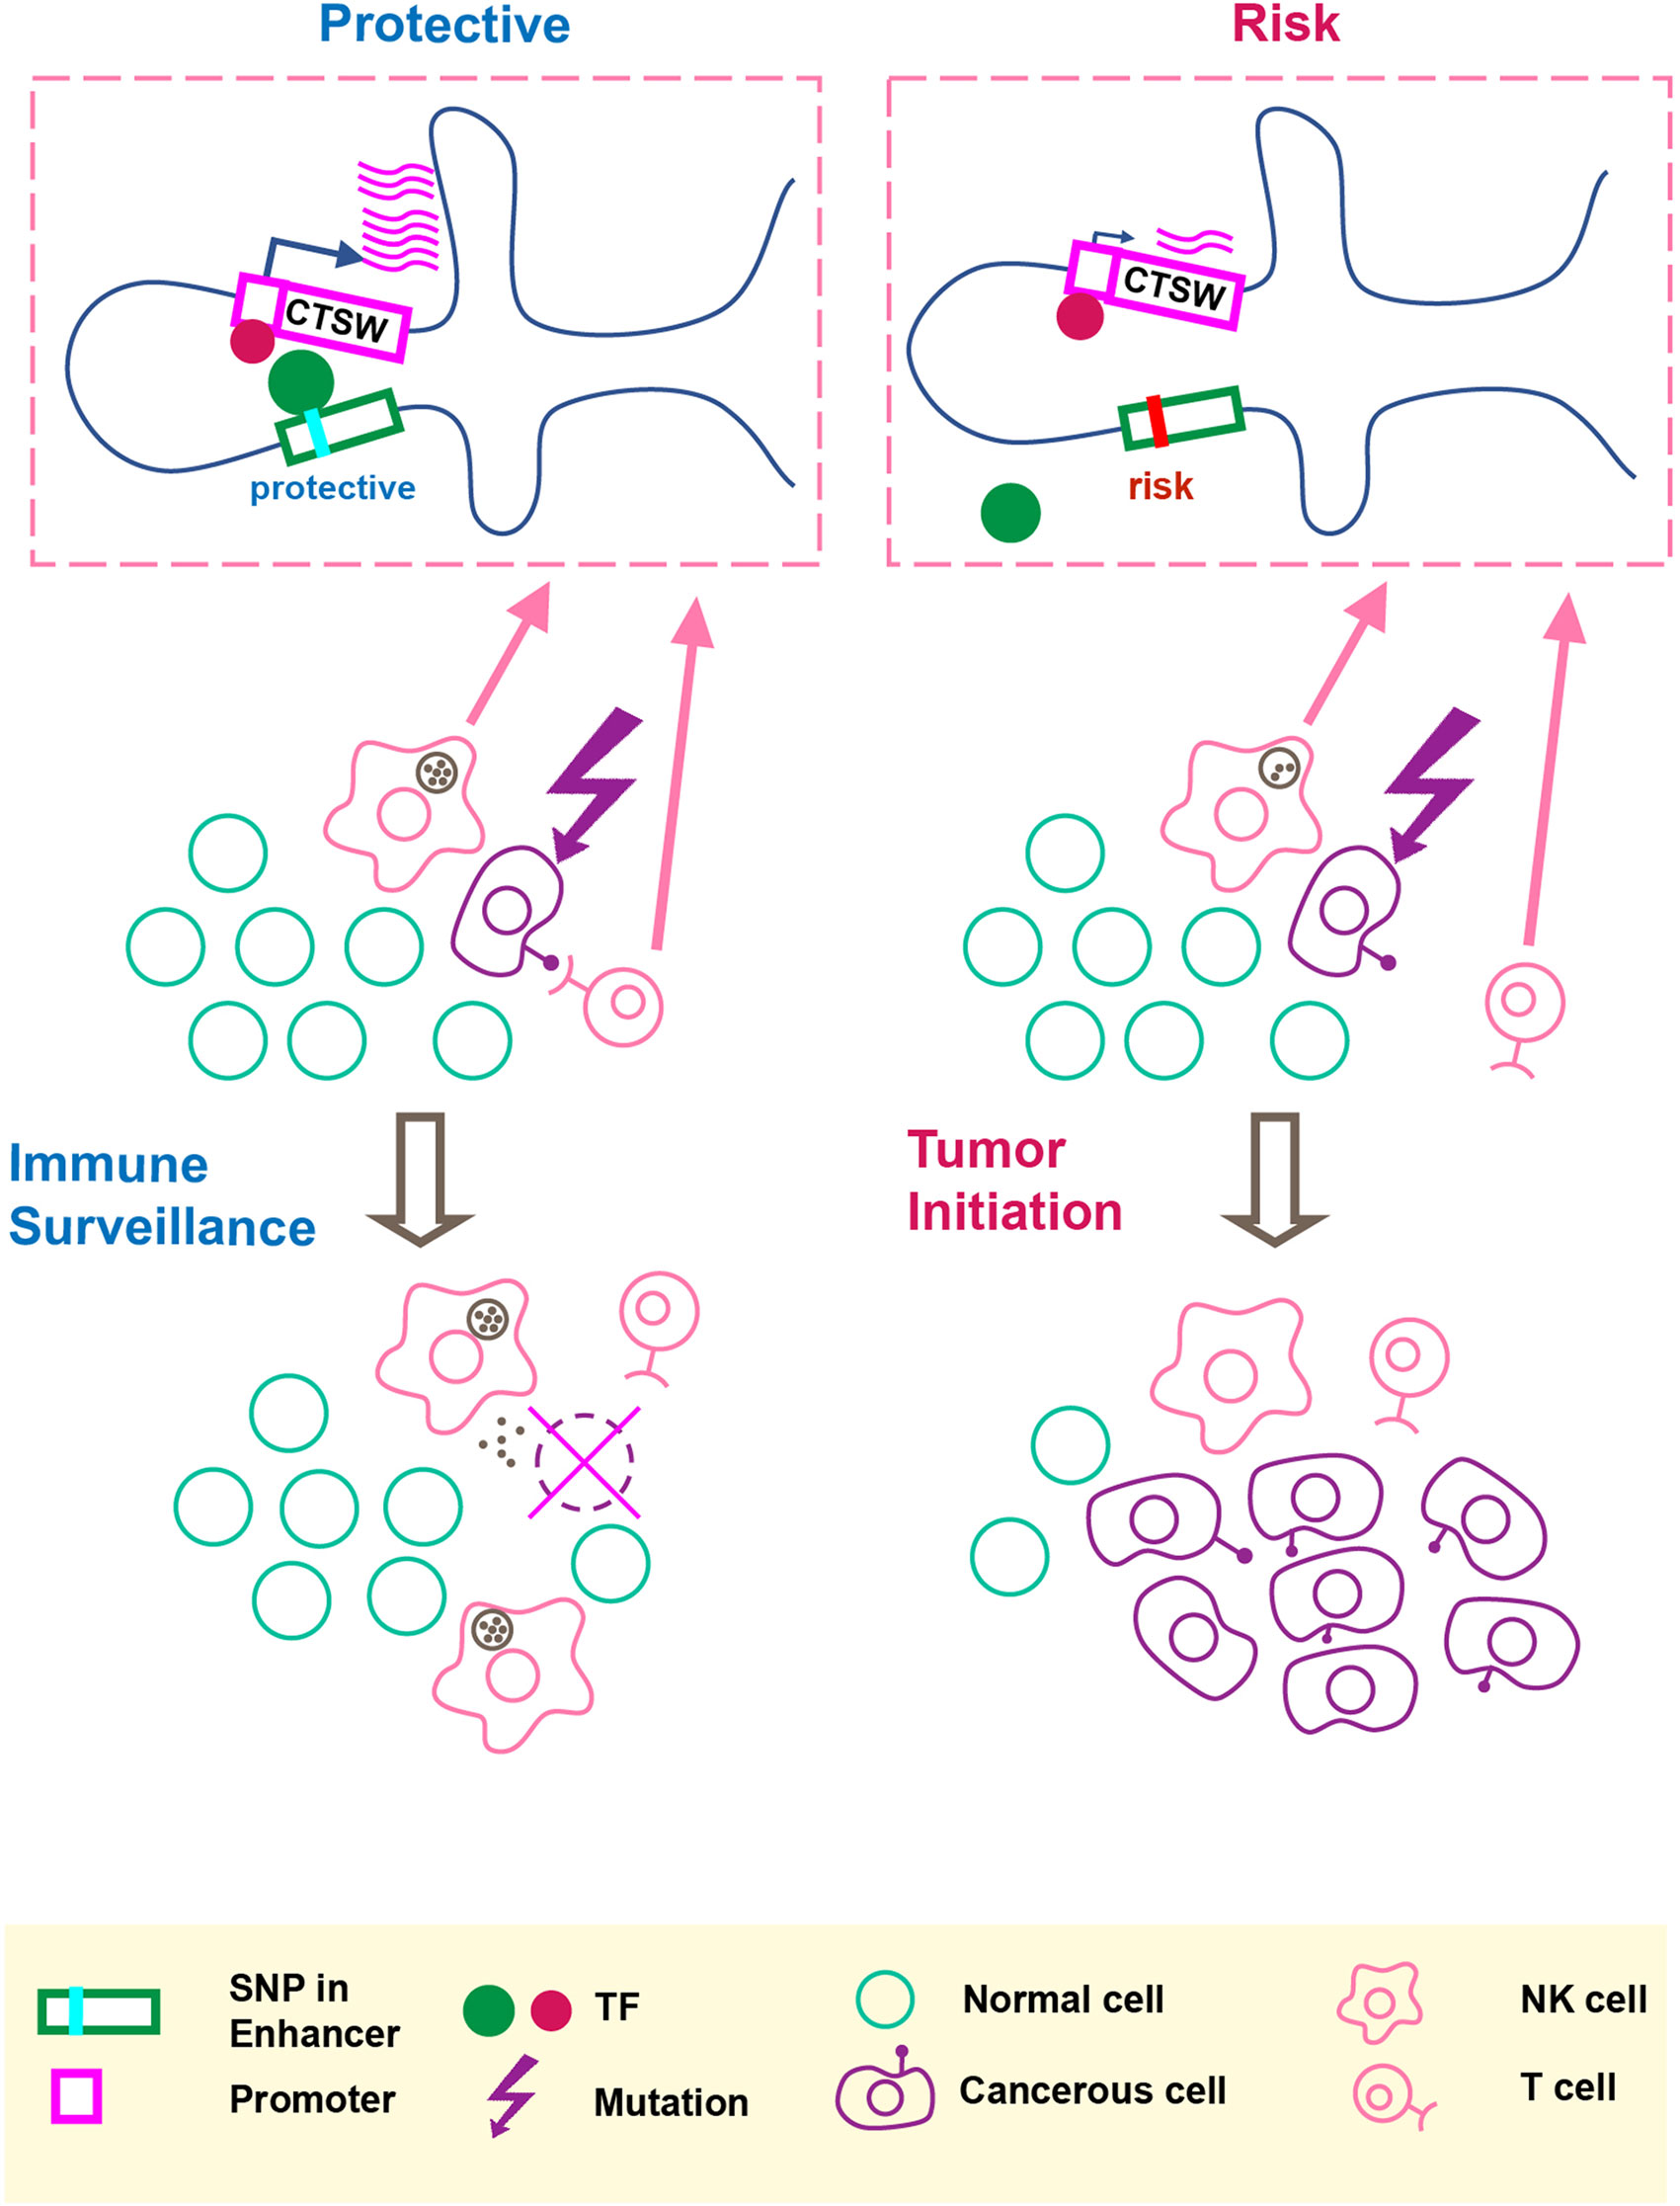
Figure 4 An illustration of our hypothesis. The putative molecular gene-regulation process is shown in the top boxed panels, and the tumor initiation process is illustrated in the two rows below. The left panel shows the process of cancer immune surveillance in people carrying the protective alleles at the GWAS SNP and the predicted functional enhancer SNP. In the top left box, the chromosome carrying the protective alleles produces an abundant CTSW mRNA level; as shown here, CTSW transcription could be elevated through a transcription activator binding the PRE1 SNP. Note that another scenario, not shown in the illustration, is also possible, where the protective allele could disrupt the binding motif of a transcription repressor. Going back to the cell view, the high level of CTSW expression in NK cells or T cells may enhance their cytotoxicity and facilitate their ability to detect and eliminate abnormal cells, such as cancerous mammary epithelial cells that just acquired some oncogenic mutations. This high efficiency of immune surveillance would thus reduce the risk of developing breast cancer. By contrast, the right panel shows the NK/T cells with suppressed CTSW expression associated with the risk alleles, resulting in reduced cytotoxic activities and suppressed immune surveillance efficiency, thereby increasing the risk of developing breast cancer.
Conclusion
In summary, we have examined effects of cancer-associated risk alleles on tumor-infiltrating lymphocytes in the tumor microenvironment, which is usually neglected in recent functional interpretation studies. We presented evidence that a breast-cancer-associated variant may regulate the expression level of an NK/T cell-specific gene, not in breast cancer cells but in immune cells infiltrating the tumor microenvironment. Our study emphasizes the need to consider effects of cancer-associated germline variants in context of the tumor immune microenvironment, as well as the need to further study the role of CTSW in the interaction between tumor and the immune system.
Data Availability
The datasets analyzed in the current study are available in the TCGA repository (http://cancergenome.nih.gov/) through GDC (https://portal.gdc.cancer.gov/projects), GTEx project (https://gtexportal.org/home/) through dbGaP (https://www.ncbi.nlm.nih.gov/gap), The Human Protein Atlas (https://www.proteinatlas.org/), the ENCODE project (https://www.encodeproject.org/), the FANTOM5 project (http://fantom.gsc.riken.jp/5/), the CCLE project (https://portals.broadinstitute.org/ccle), and GEO (https://www.ncbi.nlm.nih.gov/geo/).
Ethics Statement
The usage of NIH controlled-access datasets was approved by the NCBI dbGaP.
Author Contributions
JS designed and supervised the study and was a major contributor in editing the manuscript. YZ analyzed and interpreted the data and was a major contributor in writing the manuscript. MM and JY performed analysis and contributed to writing the manuscript. BB, SZ, and SR performed the chromatin structure analysis and contributed to writing the manuscript. All authors read and approved the final manuscript.
Funding
YZ, MM, JY and JS were supported by the NIH 1U54GM114838 grant, awarded by National Institute of General Medical Sciences (NIGMS) through funds provided by the trans-NIH (National Institutes of Health) Big Data to Knowledge (BD2K) initiative, the National Brain Tumor Society and NIH R01CA163336. BB, SZ, and SR were supported by the NIH BD2K grant U54 AI117924 and Vilas Fellowship; BB was also supported by the Genomic Sciences Training Program (NHGRI 5T32HG002760). The content is solely the responsibility of the authors and does not necessarily represent the official views of the National Institutes of Health.
Conflict of Interest Statement
The authors declare that the research was conducted in the absence of any commercial or financial relationships that could be construed as a potential conflict of interest.
Abbreviations
GWAS, genome-wide association studies; LD, linkage disequilibrium; ER+, estrogen receptor-positive; TIL, tumor-infiltrating lymphocytes; SNP, single nucleotide polymorphisms; NK, natural killer; PRE, putative regulatory element; EFO, Experimental Factor Ontology; TCGA, The Cancer Genome Atlas; BRCA, breast invasive carcinoma; GDC, Genomic Data Commons; CN, copy number; FPKM, fragments per kilobase million; UCEC, uterine corpus endometrial carcinoma; HNSC, head–neck squamous cell carcinoma; LGG, low-grade glioma; GTEx, genotype-tissue expression; RPKM, reads per kilobase million; eQTL, expression quantitative trait loci; THPA, the human protein atlas; CCLE, cancer cell line encyclopedia; FANTOM, functional annotation of the mammalian genome; ENCODE, Encyclopedia of DNA Elements; GEO, Gene Expression Omnibus; ChIA-PET, chromatin interaction analysis by paired-end tag sequencing; GEO, Gene Expression Omnibus; 3D, three-dimension; DHS, DNase I hypersensitive sites; PWM, position-specific weight matrices; mRNA, messenger RNA; RNA-seq, RNA sequencing; MAF, minor allele frequency; KIRC, kidney renal clear cell carcinoma; KIRP, kidney renal papillary cell carcinoma; KICH, kidney chromophobe; DNase-seq, DNase I hypersensitive sites sequencing; CAGE, cap analysis of gene expression; SMC1, structural maintenance of chromosomes protein 1; IL-2, interleukin-2.
Acknowledgments
This manuscript has been released as a preprint at https://www.biorxiv.org/content/10.1101/493171v1 (Zhang et al., 2018a). The results appearing here are in part based upon the data generated by the TCGA Research Network (http://cancergenome.nih.gov/, dbGaP accession number phs000424.v6.p1 on 05/06/2016) and the GTEx Project, supported by the Common Fund of the Office of the Director of the National Institutes of Health and by NCI, NHGRI, NHLBI, NIDA, NIMH, and NINDS. We acknowledge the ENCODE consortium that generated the datasets used in the manuscript.
Supplementary Material
The Supplementary Material for this article can be found online at: https://www.frontiersin.org/articles/10.3389/fgene.2019.00754/full#supplementary-material
References
Aponte, J. L., Chiano, M. N., Yerges-Armstrong, L. M., Hinds, D. A., Tian, C., Gupta, A., et al. (2018). Assessment of rosacea symptom severity by genome-wide association study and expression analysis highlights immuno-inflammatory and skin pigmentation genes. Hum. Mol. Genet. 27 (15), 2762–2772. doi: 10.1093/hmg/ddy184
Barretina, J., Caponigro, G., Stransky, N., Venkatesan, K., Margolin, A. A., Kim, S., et al. (2012). The Cancer Cell Line Encyclopedia enables predictive modelling of anticancer drug sensitivity. Nature 483, 603. doi: 10.1038/nature11003
Barrett, T., Wilhite, S. E., Ledoux, P., Evangelista, C., Kim, I. F., Tomashevsky, M., et al. (2013). NCBI GEO: archive for functional genomics data sets—update. Nucleic Acids Res. 41, D991–D995. doi: 10.1093/nar/gks1193
Bernstein, B. E., Stamatoyannopoulos, J. A., Costello, J. F., Ren, B., Milosavljevic, A., Meissner, A., et al. (2010). The NIH Roadmap Epigenomics Mapping Consortium. Nat. Biotechnol. 28 (10), 1045–1048. doi: 10.1038/nbt1010-1045
Carithers, L. J., Ardlie, K., Barcus, M., Branton, P. A., Britton, A., Buia, S. A., et al. (2015). A novel approach to high-quality postmortem tissue procurement: the GTEx Project. Biopreserv. Biobanking 13 (5), 311–319. doi: 10.1089/bio.2015.0032
Claussnitzer, M., Dankel, S. N., Kim, K.-H., Quon, G., Meuleman, W., Haugen, C., et al. (2015). FTO obesity variant circuitry and adipocyte browning in humans. N. Engl. J. Med. 373 (10), 895–907. doi: 10.1056/NEJMoa1502214
Cowper-Sal lari, R., Zhang, X., Wright, J. B., Bailey, S. D., Cole, M. D., Eeckhoute, J., et al. (2012). Breast cancer risk-associated SNPs modulate the affinity of chromatin for FOXA1 and alter gene expression. Nat. Genet. 44 (11), 1191–1198. doi: 10.1038/ng.2416
Dalton, J. P., Robinson, M. W., Brindley, P. J. (2013). “Chapter 415—cathepsin W,” in Handbook of proteolytic enzymes (third edition), p. 1834–1838. Eds. Rawlings, N. D., Salvesen, G. (Academic Press, Elsevier Ltd., Waltham, MA). doi: 10.1016/B978-0-12-382219-2.00414-2
Das, S., Forer, L., Schönherr, S., Sidore, C., Locke, A. E., Kwong, A., et al. (2016). Next-generation genotype imputation service and methods. Nat. Genet. 48 (10), 1284–1287. doi: 10.1038/ng.3656
Ellinghaus, D., Jostins, L., Spain, S. L., Cortes, A., Bethune, J., Han, B., et al. (2016). Analysis of five chronic inflammatory diseases identifies 27 new associations and highlights disease-specific patterns at shared loci. Nat. Genet. 48 (5), 510–518. doi: 10.1038/ng.3528
Geeleher, P., Nath, A., Wang, F., Zhang, Z., Barbeira, A. N., Fessler, J., et al. (2018). Cancer expression quantitative trait loci (eQTLs) can be determined from heterogeneous tumor gene expression data by modeling variation in tumor purity. Genome Biol. 19 (1), 130. doi: 10.1186/s13059-018-1507-0
Ghatalia, P., Devarajan, K., Gordetsky, J., Dulaimi, E., Bae, S., Naik, G., et al. (2018). Abstract 3141: immune gene expression and prognosis in localized clear cell (cc) renal cell carcinoma (RCC). Cancer Res. 78 (13 Supplement), 3141. doi: 10.1158/1538-7445.AM2018-3141
Ghoussaini, M., Edwards, S. L., Michailidou, K., Nord, S., Cowper-Sal·lari, R., Desai, K., et al. (2014). Evidence that breast cancer risk at the 2q35 locus is mediated through IGFBP5 regulation. Nat. Commun. 5, 4999. doi: 10.1038/ncomms5999
Grant, C. E., Bailey, T. L., Noble, W. S. (2011). FIMO: scanning for occurrences of a given motif. Bioinformatics 27 (7), 1017–1018. doi: 10.1093/bioinformatics/btr064
Grossman, R. L., Heath, A. P., Ferretti, V., Varmus, H. E., Lowy, D. R., Kibbe, W. A., et al. (2016). Toward a shared vision for cancer genomic data. N. Engl. J. Med. 375 (12), 1109–1112. doi: 10.1056/NEJMp1607591
GTEx Consortium (2013). The Genotype-Tissue Expression (GTEx) project. Nat. Genet. 45 (6), 580–585. doi: 10.1038/ng.2653
Hnisz, D., Weintraub, A. S., Day, D. S., Valton, A.-L., Bak, R. O., Li, C. H., et al. (2016). Activation of proto-oncogenes by disruption of chromosome neighborhoods. Science 351 (6280), 1454–1458. doi: 10.1126/science.aad9024
Jeevan-Raj, B., Gehrig, J., Charmoy, M., Chennupati, V., Grandclement, C., Angelino, P., et al. (2017). The transcription factor Tcf1 contributes to normal NK cell development and function by limiting the expression of granzymes. Cell Rep. 20 (3), 613–626. doi: 10.1016/j.celrep.2017.06.071
Jolma, A., Yan, J., Whitington, T., Toivonen, J., Nitta, K. R., Rastas, P., et al. (2013). DNA-binding specificities of human transcription factors. Cell 152 (1), 327–339. doi: 10.1016/j.cell.2012.12.009
Jostins, L., Ripke, S., Weersma, R. K., Duerr, R. H., McGovern, D. P., Hui, K. Y., et al. (2012). Host–microbe interactions have shaped the genetic architecture of inflammatory bowel disease. Nature 491, 119. doi: 10.1038/nature11582
Kulakovskiy, I. V., Vorontsov, I. E., Yevshin, I. S., Soboleva, A. V., Kasianov, A. S., Ashoor, H., et al. (2016). HOCOMOCO: expansion and enhancement of the collection of transcription factor binding sites models. Nucleic Acids Res. 44 (D1), D116–D125. doi: 10.1093/nar/gkv1249
Leong, W. Z., Tan, S. H., Ngoc, P. C. T., Amanda, S., Yam, A. W. Y., Liau, W.-S., et al. (2017). ARID5B as a critical downstream target of the TAL1 complex that activates the oncogenic transcriptional program and promotes T-cell leukemogenesis. Genes Dev. 31 (23–24), 2343–2360. doi: 10.1101/gad.302646.117
Li, B., Severson, E., Pignon, J.-C., Zhao, H., Li, T., Novak, J., et al. (2016). Comprehensive analyses of tumor immunity: implications for cancer immunotherapy. Genome Biol. 17 (1), 174. doi: 10.1186/s13059-016-1028-7
Li, G., Chen, Y., Snyder, M. P., Zhang, M. Q. (2017). ChIA-PET2: a versatile and flexible pipeline for ChIA-PET data analysis. Nucleic Acids Res. 45 (1), e4–e4. doi: 10.1093/nar/gkw809
Li, H., Durbin, R. (2010). Fast and accurate long-read alignment with Burrows–Wheeler transform. Bioinformatics 26 (5), 589–595. doi: 10.1093/bioinformatics/btp698
Lim, Y. W., Chen-Harris, H., Mayba, O., Lianoglou, S., Wuster, A., Bhangale, T., et al. (2018). Germline genetic polymorphisms influence tumor gene expression and immune cell infiltration. Proc. Nat. Acad. Sci. 115 (50), E11701. doi: 10.1073/pnas.1804506115
Liu, X. S., Mardis, E. R. (2017). Applications of immunogenomics to cancer. Cell 168 (4), 600–612. doi: 10.1016/j.cell.2017.01.014
MacArthur, J., Bowler, E., Cerezo, M., Gil, L., Hall, P., Hastings, E., et al. (2017). The new NHGRI-EBI Catalog of published genome-wide association studies (GWAS Catalog). Nucleic Acids Res. 45 (D1), D896–D901. doi: 10.1093/nar/gkw1133
Malone, J., Holloway, E., Adamusiak, T., Kapushesky, M., Zheng, J., Kolesnikov, N., et al. (2010). Modeling sample variables with an Experimental Factor Ontology. Bioinformatics 26 (8), 1112–1118. doi: 10.1093/bioinformatics/btq099
Mathelier, A., Fornes, O., Arenillas, D. J., Chen, C.-Y., Denay, G., Lee, J., et al. (2016). JASPAR 2016: a major expansion and update of the open-access database of transcription factor binding profiles. Nucleic Acids Res. 44 (D1), D110–D115. doi: 10.1093/nar/gkv1176
Matys, V., Kel-Margoulis, O. V., Fricke, E., Liebich, I., Land, S., Barre-Dirrie, A., et al. (2006). TRANSFAC and its module TRANSCompel: transcriptional gene regulation in eukaryotes. Nucleic Acids Res. 34, D108–D110. doi: 10.1093/nar/gkj143
McLean, C. Y., Bristor, D., Hiller, M., Clarke, S. L., Schaar, B. T., Lowe, C. B., et al. (2010). GREAT improves functional interpretation of cis-regulatory regions. Nat. Biotechnol. 28 (5), 495–U155. doi: 10.1038/nbt.1630
Michailidou, K., Hall, P., Gonzalez-Neira, A., Ghoussaini, M., Dennis, J., Milne, R. L., et al. (2013). Large-scale genotyping identifies 41 new loci associated with breast cancer risk. Nat. Genet. 45, 353. doi: 10.1038/ng.2563
Michailidou, K., Lindström, S., Dennis, J., Beesley, J., Hui, S., Kar, S., et al. (2017). Association analysis identifies 65 new breast cancer risk loci. Nature 551, 92. doi: 10.1038/nature24284
O’Leary, N. A., Wright, M. W., Brister, J. R., Ciufo, S., Haddad, D., McVeigh, R., et al. (2016). Reference sequence (RefSeq) database at NCBI: current status, taxonomic expansion, and functional annotation. Nucleic Acids Res. 44 (D1), D733–745. doi: 10.1093/nar/gkv1189
Oghumu, S., Terrazas, C. A., Varikuti, S., Kimble, J., Vadia, S., Yu, L., et al. (2015). CXCR3 expression defines a novel subset of innate CD8+ T cells that enhance immunity against bacterial infection and cancer upon stimulation with IL-15. FASEB J. 29 (3), 1019–1028. doi: 10.1096/fj.14-264507
Raj, T., Rothamel, K., Mostafavi, S., Ye, C., Lee, M. N., Replogle, J. M., et al. (2014). Polarization of the effects of autoimmune and neurodegenerative risk alleles in leukocytes. Science 344 (6183), 519. doi: 10.1126/science.1249547
Rao, S. S. P., Huntley, M. H., Durand, N. C., Stamenova, E. K., Bochkov, I. D., Robinson, J. T., et al. (2014). A 3D map of the human genome at kilobase resolution reveals principles of chromatin looping. Cell 159 (7), 1665–1680. doi: 10.1016/j.cell.2014.11.021
Schmiedel, B. J., Singh, D., Madrigal, A., Valdovino-Gonzalez, A. G., White, B. M., Zapardiel-Gonzalo, J., et al. (2018). Impact of genetic polymorphisms on human immune cell gene expression. Cell 1751701-1715 (6), e1716. doi: 10.1016/j.cell.2018.10.022
Su, M. Y., Steiner, L. A., Bogardus, H., Mishra, T., Schulz, V. P., Hardison, R. C., et al. (2013). Identification of biologically relevant enhancers in human erythroid cells. J. Biol. Chem. 288 (12), 8433–8444. doi: 10.1074/jbc.M112.413260
Sun, X.-J., Wang, Z., Wang, L., Jiang, Y., Kost, N., Soong, T. D., et al. (2013). A stable transcription factor complex nucleated by oligomeric AML1–ETO controls leukaemogenesis. Nature 500, 93. doi: 10.1038/nature12287
The Encode Project Consortium,, Dunham, I., Kundaje, A., Aldred, S. F., Collins, P. J., Davis, C. A., et al. (2012). An integrated encyclopedia of DNA elements in the human genome. Nature 489, 57. doi: 10.1038/nature11247
The Fantom Consortium and the Riken PMI and CLST (DGT), Forrest, A. R. R., Kawaji, H., Rehli, M., Kenneth Baillie, J., de Hoon, M. J. L., et al. (2014). A promoter-level mammalian expression atlas. Nature 507, 462. doi: 10.1038/nature13182
The Genomes Project Consortium, Auton, A., Abecasis, G. R., Altshuler, D. M., Durbin, R. M., Abecasis, G. R., et al. (2015). A global reference for human genetic variation. Nature 526, 68. doi: 10.1038/nature15393
Tsoi, L. C., Stuart, P. E., Tian, C., Gudjonsson, J. E., Das, S., Zawistowski, M., et al. (2017). Large scale meta-analysis characterizes genetic architecture for common psoriasis associated variants. Nat. Commun. 8, 15382. doi: 10.1038/ncomms15382
Uhlen, M., Zhang, C., Lee, S., Sjöstedt, E., Fagerberg, L., Bidkhori, G., et al. (2017a) Image from The Human Protein Atlas: CTSW in TCGA-BRCA. [Online]. Science. Available: https://www.proteinatlas.org/ENSG00000172543-CTSW/pathology/tissue/breast+cancer [Accessed Dec 18 2018].
Uhlen, M., Zhang, C., Lee, S., Sjöstedt, E., Fagerberg, L., Bidkhori, G. et al. (2017b) Image from The Human Protein Atlas: CTSW in TCGA-HNSC. [Online]. Science. Available: https://www.proteinatlas.org/ENSG00000172543-CTSW/pathology/tissue/head+and+neck+cancer [Accessed Dec18 2018].
Uhlen, M., Zhang, C., Lee, S., Sjöstedt, E., Fagerberg, L., Bidkhori, G. et al. (2017c) Image from The Human Protein Atlas: CTSW in TCGA-UCEC. [Online]. Science. Available: https://www.proteinatlas.org/ENSG00000172543-CTSW/pathology/tissue/endometrial+cancer [Accessed Dec 18 2018].
Uhlen, M., Zhang, C., Lee, S., Sjöstedt, E., Fagerberg, L., Bidkhori, G., et al. (2017d). A pathology atlas of the human cancer transcriptome. Science 357 (6352), eaan2507. doi: 10.1126/science.aan2507
Wang, J., Zhuang, J., Iyer, S., Lin, X., Whitfield, T. W., Greven, M. C., et al. (2012). Sequence features and chromatin structure around the genomic regions bound by 119 human transcription factors. Genome Res. 22 (9), 1798–1812. doi: 10.1101/gr.139105.112
Wex, T., Buhling, F., Wex, H., Gunther, D., Malfertheiner, P., Weber, E., et al. (2001). Human cathepsin W, a cysteine protease predominantly expressed in NK cells, is mainly localized in the endoplasmic reticulum. J. Immunol. 167 (4), 2172–2178. doi: 10.4049/jimmunol.167.4.2172
Wu, C., Jin, X., Tsueng, G., Afrasiabi, C., Su, A. I. (2016). BioGPS: building your own mash-up of gene annotations and expression profiles. Nucleic Acids Res. 44 (D1), D313–D316. doi: 10.1093/nar/gkv1104
Zhang, Y., Liu, T., Meyer, C. A., Eeckhoute, J., Johnson, D. S., Bernstein, B. E., et al. (2008). Model-based analysis of ChIP-Seq (MACS). Genome Biol. 9 (9), R137–R137. doi: 10.1186/gb-2008-9-9-r137
Zhang, Y., Manjunath, M., Yan, J., Baur, B. A., Zhang, S., Roy, S., et al. (2018a). Can cancer GWAS variants modulate immune cells in the tumor microenvironment? bioRxiv 493171. doi: 10.1101/493171
Keywords: noncoding variant, GWAS, breast cancer, functional characterization, immune cells, tumor microenvironment
Citation: Zhang Y, Manjunath M, Yan J, Baur BA, Zhang S, Roy S and Song JS (2019) The Cancer-Associated Genetic Variant Rs3903072 Modulates Immune Cells in the Tumor Microenvironment. Front. Genet. 10:754. doi: 10.3389/fgene.2019.00754
Received: 07 May 2019; Accepted: 17 July 2019;
Published: 23 August 2019.
Edited by:
Xianwen Ren, Peking University, ChinaReviewed by:
Michael Poidinger, Murdoch Childrens Research Institute, AustraliaZhiyun Guo, Southwest Jiaotong University, China
Copyright © 2019 Zhang, Manjunath, Yan, Baur, Zhang, Roy and Song. This is an open-access article distributed under the terms of the Creative Commons Attribution License (CC BY). The use, distribution or reproduction in other forums is permitted, provided the original author(s) and the copyright owner(s) are credited and that the original publication in this journal is cited, in accordance with accepted academic practice. No use, distribution or reproduction is permitted which does not comply with these terms.
*Correspondence: Jun S. Song, c29uZ2pAaWxsaW5vaXMuZWR1