 Li Wang1†
 Meng Guo
 Lei Zhang
- 1Department of Neurosurgery, Xijing Hospital, Fourth Military Medical University, Xi’an, China
- 2Xijing Hospital of Digestive Diseases, Fourth Military Medical University, Xi’an, China
Purpose: Metabolic alterations are crucial for tumor progression and response to therapy. The comprehensive model of combined central carbon metabolism–associated genes that contribute to the outcomes of glioma and astrocytoma is not well understood.
Method: We studied the profiles of 63 genes involved in central carbon metabolism in 514 relatively low-grade glioma patients. The different distributions of gene expression in gliomas and astrocytoma were identified. The differential gene expression between each cohort and the correlations with prognosis were detected. Finally, we built a tentative model to detect the prognostic roles of carbon metabolism–associated genes in astrocytoma.
Result: Two primary clusters and four subclusters with significantly different overall survival were identified in low-grade glioma. The differences of histological diagnoses, grade, tumor site, and age were detected between each cluster. Comparing with other histological types, patients with astrocytoma exhibited the worst prognosis. Between astrocytoma patients with poor and favorable prognoses, expression profiles of 11 genes were significantly discrepant. We detected that 18 genes were respectively correlated with overall survival in astrocytoma; moreover, four genes (RAF1, AKT3, IDH1, and FGFR1) were detected as dependent variables for the prediction of the survival status of astrocytoma patients and were capable to predict the survival.
Conclusion: Central carbon metabolism–associated genes are differentially expressed in all patients with glioma and histological subtype astrocytoma. The gene expression profile is significantly associated with clinical manifestations. These results suggested that both the multigene expression patterns and individual central carbon metabolism–associated genes were potentially capable to predict the prognosis of patients with low-grade glioma.
Introduction
Diffuse low-grade gliomas are the most common primary malignancies in adults and include astrocytomas, oligodendrogliomas, and oligoastrocytomas (Brat et al., 2015). Different histological subtypes of glioma were undistinguishable; however, large differences in clinical behavior and response to therapy suggest that difference among the histological types is crucial (Smith et al., 2000). Even within each subtype, there are large differences in clinical performance among individual patients. Surgery resection is the primary therapeutic method for low-grade gliomas, but the outcomes are less than satisfactory because of the highly infiltrative nature of glioma, and the presence of residual tumor tissue results in recurrence and malignant progression (Dixit and Raizer, 2017). The prognosis of patients with relatively low-grade glioma varies widely, with some patients living for more than 5 years, while others survive less than 1 year (Bush and Chang, 2016). A more precise method of predicting the outcomes of relatively low-grade glioma is urgently needed to be developed.
Metabolic reprogramming is a central hallmark of cancer. Dysregulation of metabolism-related genes leads to cellular transformation and tumor progression. Warburg (1956) revealed differences in the central metabolic pathways in solid tumors and noted that cancer cells require a large amount of glucose to maintain a high rate of glycolysis even in the presence of adequate oxygen and that they convert a majority of that glucose into lactic acid (the Warburg effect). More recently, it has been recognized that the “Warburg effect” contains a similarly increased utilization of glutamine (Reitzer et al., 1979). Previous studies have detected some variations in the genes, such as IDH1/2, GLUT1, and GLUT3, involved in tumor metabolism in gliomas (Yan et al., 2009; Verhaak et al., 2010; Labak et al., 2016). High-throughput sequencing has substantially advanced the understanding of the metabolic changes in low-grade gliomas by detecting changes in metabolism-associated genes (Brennan et al., 2013). Profiling holistic gene expression not only facilitates the investigation of subgroups with low-grade glioma but also enables the identification of the predictors of overall survival (OS) (Chen et al., 2016). Which pattern of expression of metabolism-associated genes in tumor tissue contributes to glioma is not well understood. The Cancer Genome Atlas (TCGA) provided a standardized gene expression dataset for the study of the expression pattern of metabolism-related genes, which enables the investigation of correlations between clinical manifestations and carbon metabolism–associated genes in glioma (The Cancer Genome Atlas Research Network et al., 2008; Sanborn et al., 2013).
In this study, we investigated the expression patterns of central carbon metabolism–associated genes in adult patients with diffuse low-grade glioma, including astrocytoma, oligodendroglioma, and oligoastrocytoma. Moreover, we respectively detected the prognostic roles of individual gene and the multiple-gene combination. These results will facilitate an integral understanding of the metabolic alterations in glioma and provide a novel perspective to manage and treat this lethal cancer.
Methods
Samples and Database
We obtained transcriptome data and the corresponding clinical data of 514 relatively low-grade glioma patients from TCGA from the cBioPortal for Cancer Genomics (http://cbioportal.org) (Gao et al., 2013). We filtered the data based on whether the mRNA z-score data, histological diagnosis, and OS data were comprehensive. Collectively, the studied dataset included 194 astrocytoma samples, 130 oligoastrocytoma samples, and 190 oligodendroglioma samples.
Central carbon metabolism–related genes in the cancer-associated gene panel (hsa05230) were derived from the KEGG pathway database (http://www.kegg.jp/kegg/), as previously described (Kanehisa et al., 2017). In total, 65 central carbon metabolism–associated genes were listed; however, transcriptome information was missing for MYC and HKDC1, and the remaining 63 candidate genes were included after filtration. The gene expression levels were calculated from the mRNA z scores and compared to the expression distribution of each gene from tumors that were diploid for the genes in 514 patients with glioma (RNA-Seq V2 RSEM), based on TCGA data.
Bioinformatics
A cluster analysis of the 63 genes expressed in each histological type was used to distinguish samples based on gene expression patterns. Samples with different gene expression patterns were identified from the whole dataset. The transcriptional levels were shown as mRNA z scores and clustered using the hierarchical clustering algorithm in the Gene Cluster 3.0 program (De Hoon et al., 2004). The cluster heat map and pattern according to tumor stage were generated with the Java Treeview program (Saldanha, 2004).
Prognostic Implication Analyses
To investigate the prognostic role of the cancer metabolism–associated genes, we used GraphPad Prism 6 for Windows (GraphPad Software, Inc., CA, US; version 6.01, 2012) to perform comparisons of the overall survivals in different clusters. Additionally, an analysis of the difference in OS between the cohorts with low and high expression levels of differentially expressed genes was conducted with GraphPad Prism 6.
Statistical Analysis
Survival curves were plotted according to the Kaplan–Meier method and compared using the log-rank test in GraphPad Prism 6. Associations between clinical characteristics and the variables used to determine the clusters of patients were analyzed by Fisher exact test and the Pearson/Spearman correlation. Differences in gene expression levels between clusters were analyzed by analysis of variance. Correlations between variable were determined by regression analyses. All tests were performed with SPSS 19.0 (IBM, Inc., NY, US). P < 0.05 was considered statistically significant.
Results
Expression Profile of Central Carbon Metabolism–Associated Genes in Diffuse Gliomas
To investigate central carbon metabolism programming in diffuse gliomas, we first examined the transcriptional distributions of carbon metabolism–associated genes. In total, 63 genes that have been widely reported to be key players in metabolic reprogramming were included (Soga, 2013). The patients with diffuse glioma were sorted by differences in the gene expression according to the RNA-Seq data. Following filtration, 514 patients with survival data were included in the cluster analysis (Figure 1A). The preliminary analysis showed that there were two clusters, and strikingly, the 101 patients in cluster 1 had much worse prognoses than the patients in cluster 2 (OS of 48.65 vs 105.12 months, P < 0.0001) (Figure 1B, Table 1). Between the two clusters, there was a significant difference in the expression levels (P < 0.05) of 49 genes (Figure 1C). A comparison of the clinical characteristics of clusters 1 and 2 showed that the parameters of histological diagnoses, tumor grade, tumor site, and age were vastly different between the two clusters (P < 0.001), as shown in Table 2.
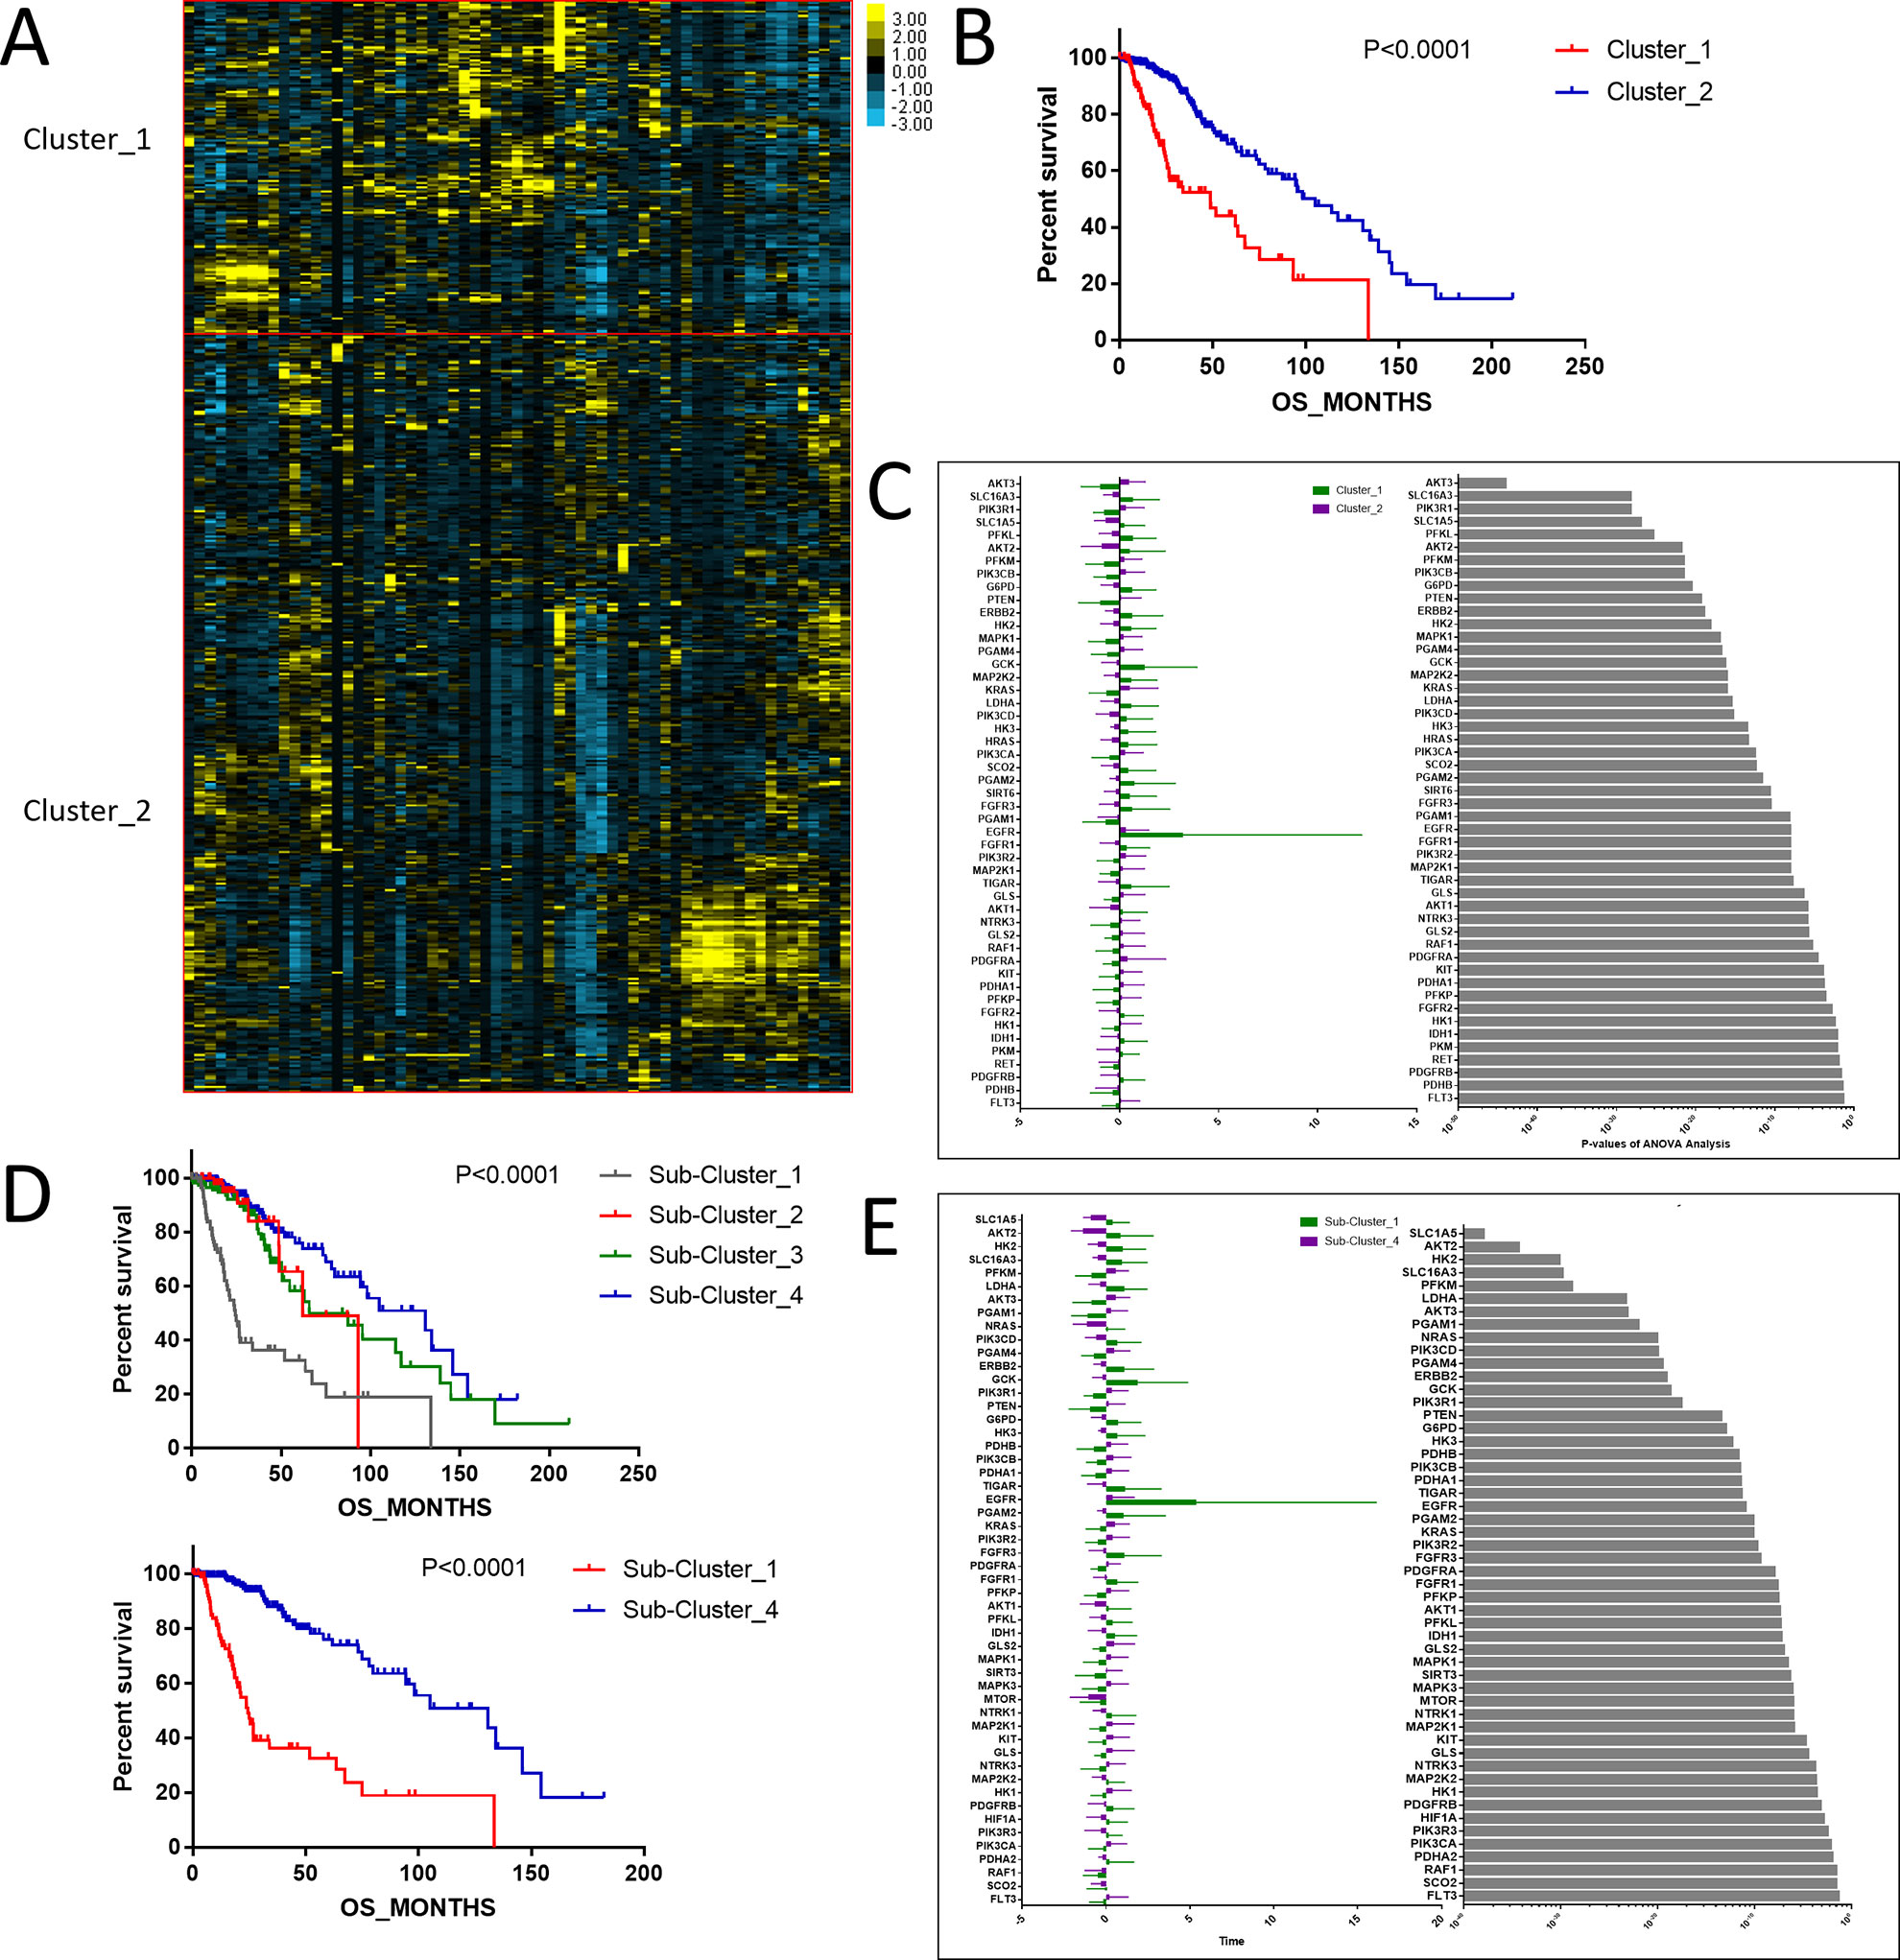
Figure 1 The expression profile of central carbon metabolism–associated genes in glioma patients. (A) In total, 514 patients were primarily divided into two clusters. The expression values of 63 genes corresponding to the individual patient were arrayed in the columns according to the expression affinity. Patients with similar gene expression patterns were clustered and grouped using the hierarchical clustering algorithm and arrayed in the rows. (B) The patients in cluster 1 had much worse prognoses than the patients in cluster 2, of which overall survival (OS) was 48.65 months compared to 105.12 months. (C) There were 49 genes that showed a significant difference in the expression levels between the two clusters P < 0.05. (D) The studied cohort was further subdivided into four subclusters, among which the subcluster 1 was with the worst OS and subcluster 4 showed the most favorable outcome. (E) The differential expression analysis revealed that 52 metabolism-associated genes were significantly different between subcluster 1 and subcluster 4.
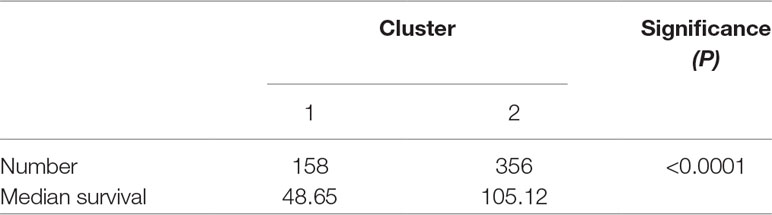
Table 1 Overall survival differences of each cluster.
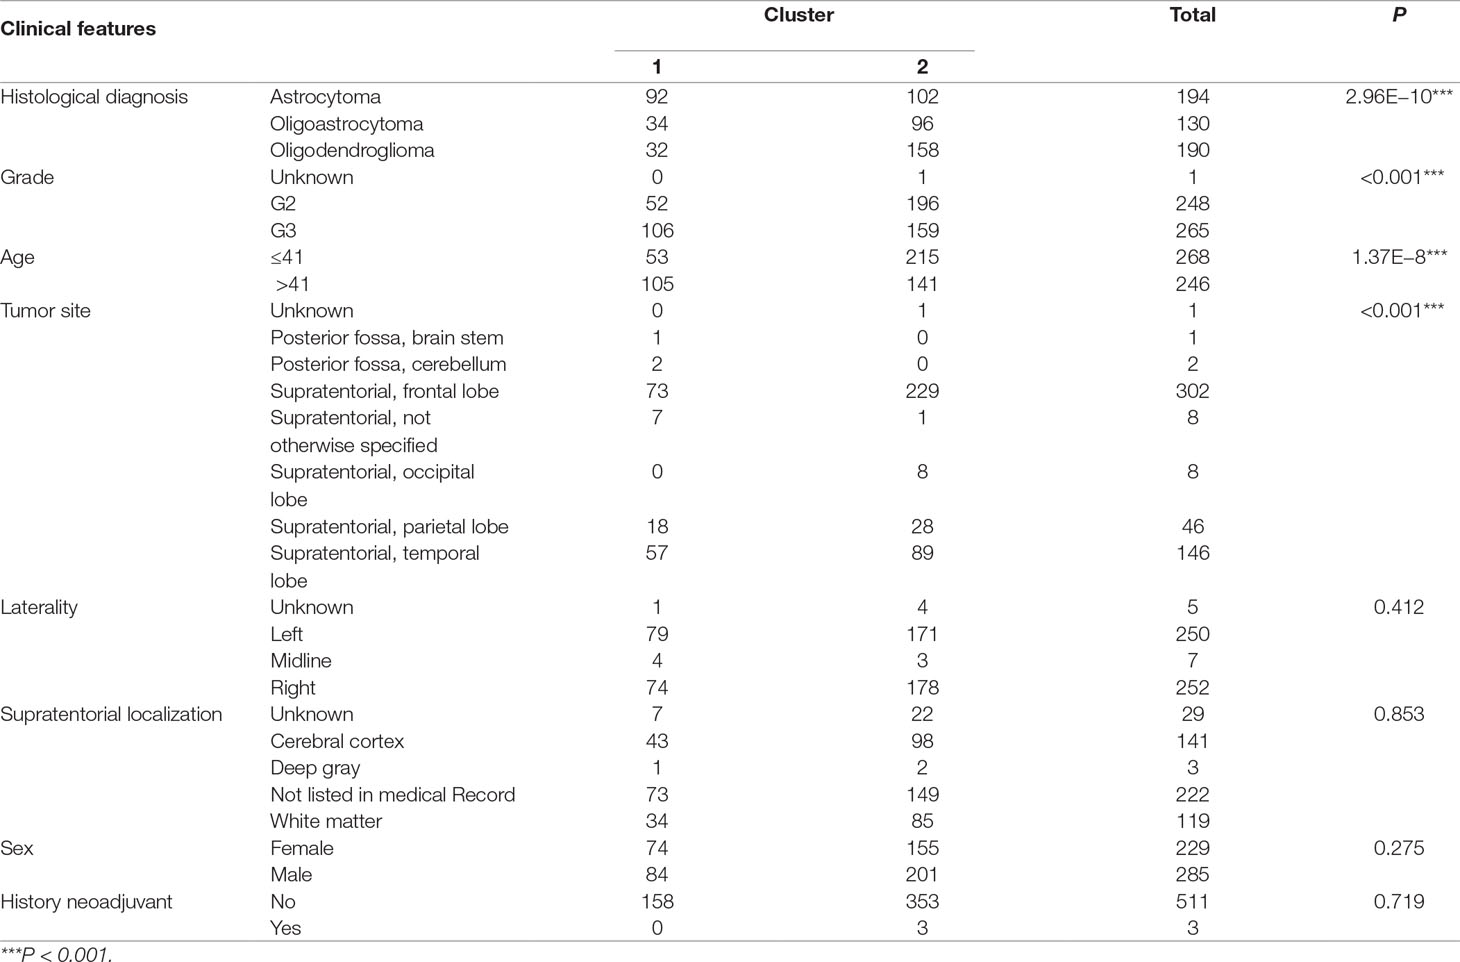
Table 2 Characteristics of glioma patients in clustered groups 1 and 2.
To detect the subtler differences among further stratified cohorts, we subdivided the 514 patients into four subclusters based on the expression of the 63 genes. We detected that extreme differences in prognosis were shown among those subclusters (P < 0.0001) (Figure 1D, Table 3). Subcluster 1 was associated with the worst OS, while subcluster 4 showed a much favorable outcome than other subclusters (Figure 1D). Comparison of the gene expression variations revealed that the expression levels of 52 metabolism-associated genes were significantly different between the two prognostic-discrepant cohorts (Figure 1E). Additionally, we compared the clinical characteristics of the subclusters. Similar with the previous result, clear significant differences were found with regard to the parameters of histological diagnoses, tumor grade, tumor site, and age (P < 0.001) (Table 4).
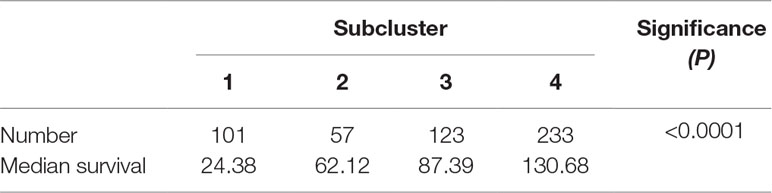
Table 3 Overall survival differences of each subcluster
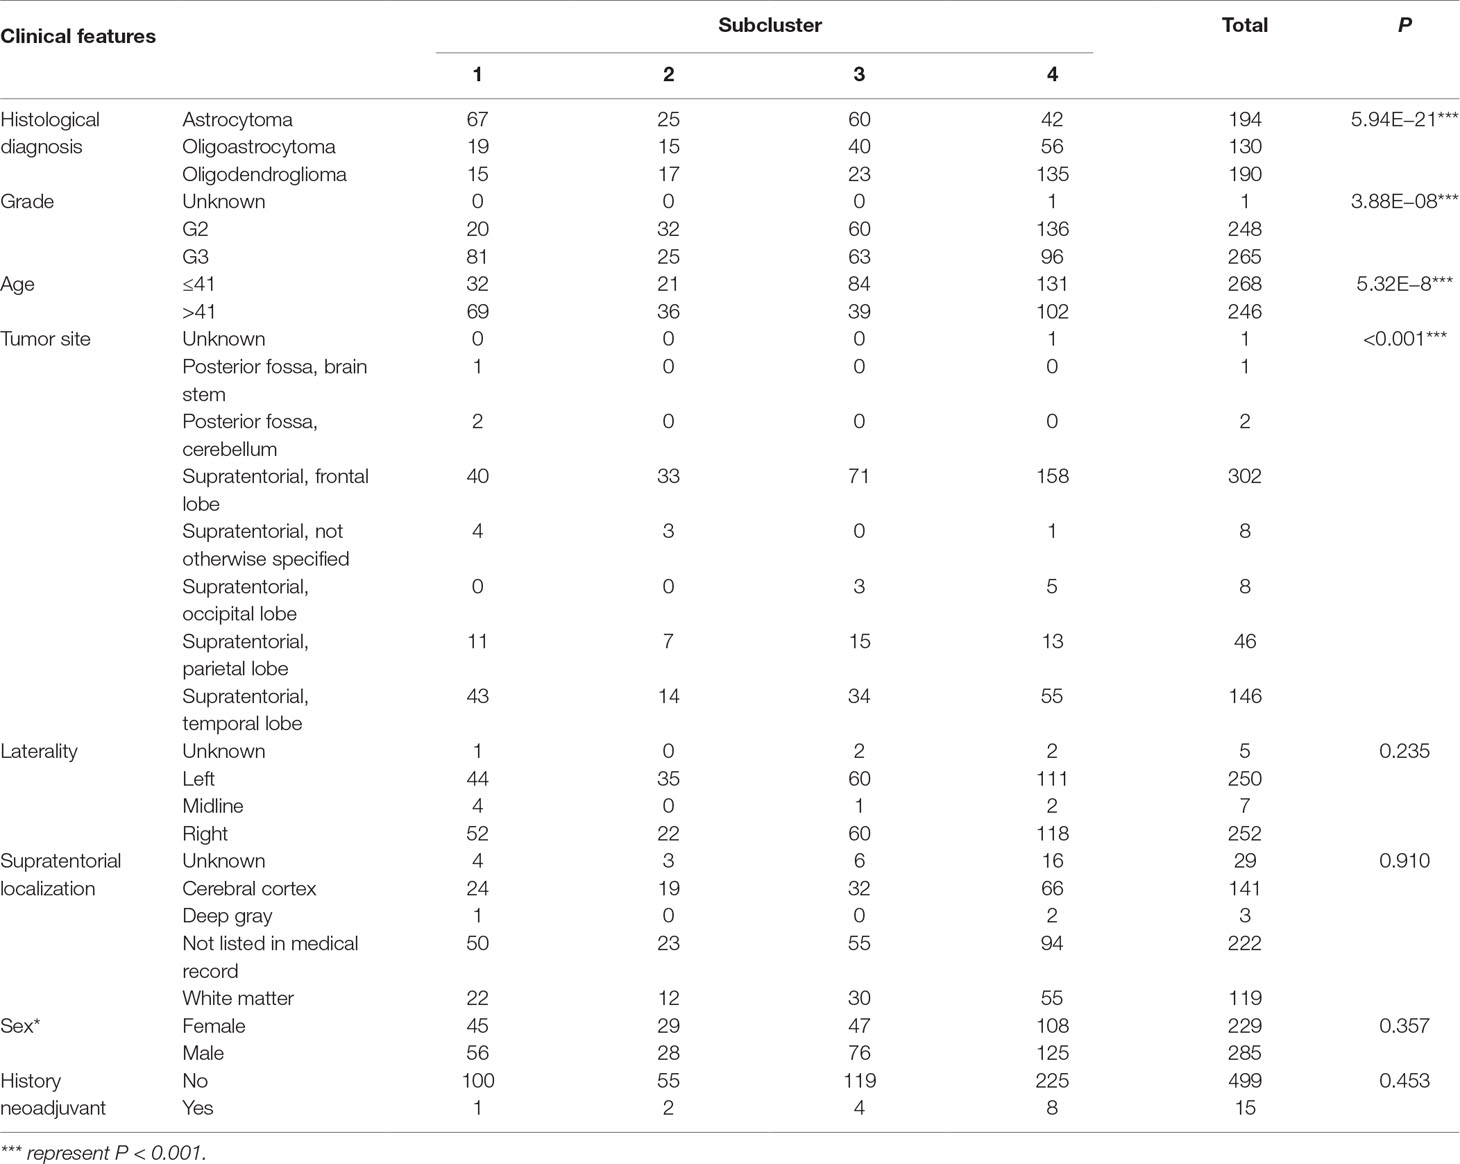
Table 4 Characteristics of glioma patients in subdivided clusters.
Variations in Metabolism-Associated Gene Expression Levels in Different Histological Types
According to the binary comparisons among different gene expression cohorts, histological type was revealed as the variable associated with the largest differences in gene expression. We compared the OS of patients with astrocytoma, oligoastrocytoma, and oligodendroglioma, and significant differences were detected (Figure 2A). The median survival times of patients with astrocytoma (66.12 months), oligoastrocytoma 5.12 months), and oligodendroglioma (95.5 months) were markedly distinguishing (P = 0.0084). Further analysis of differences in gene expression demonstrated that 45 metabolism-associated genes were differentially expressed among the histological types (Figure 2B, Supplementary Table 1).
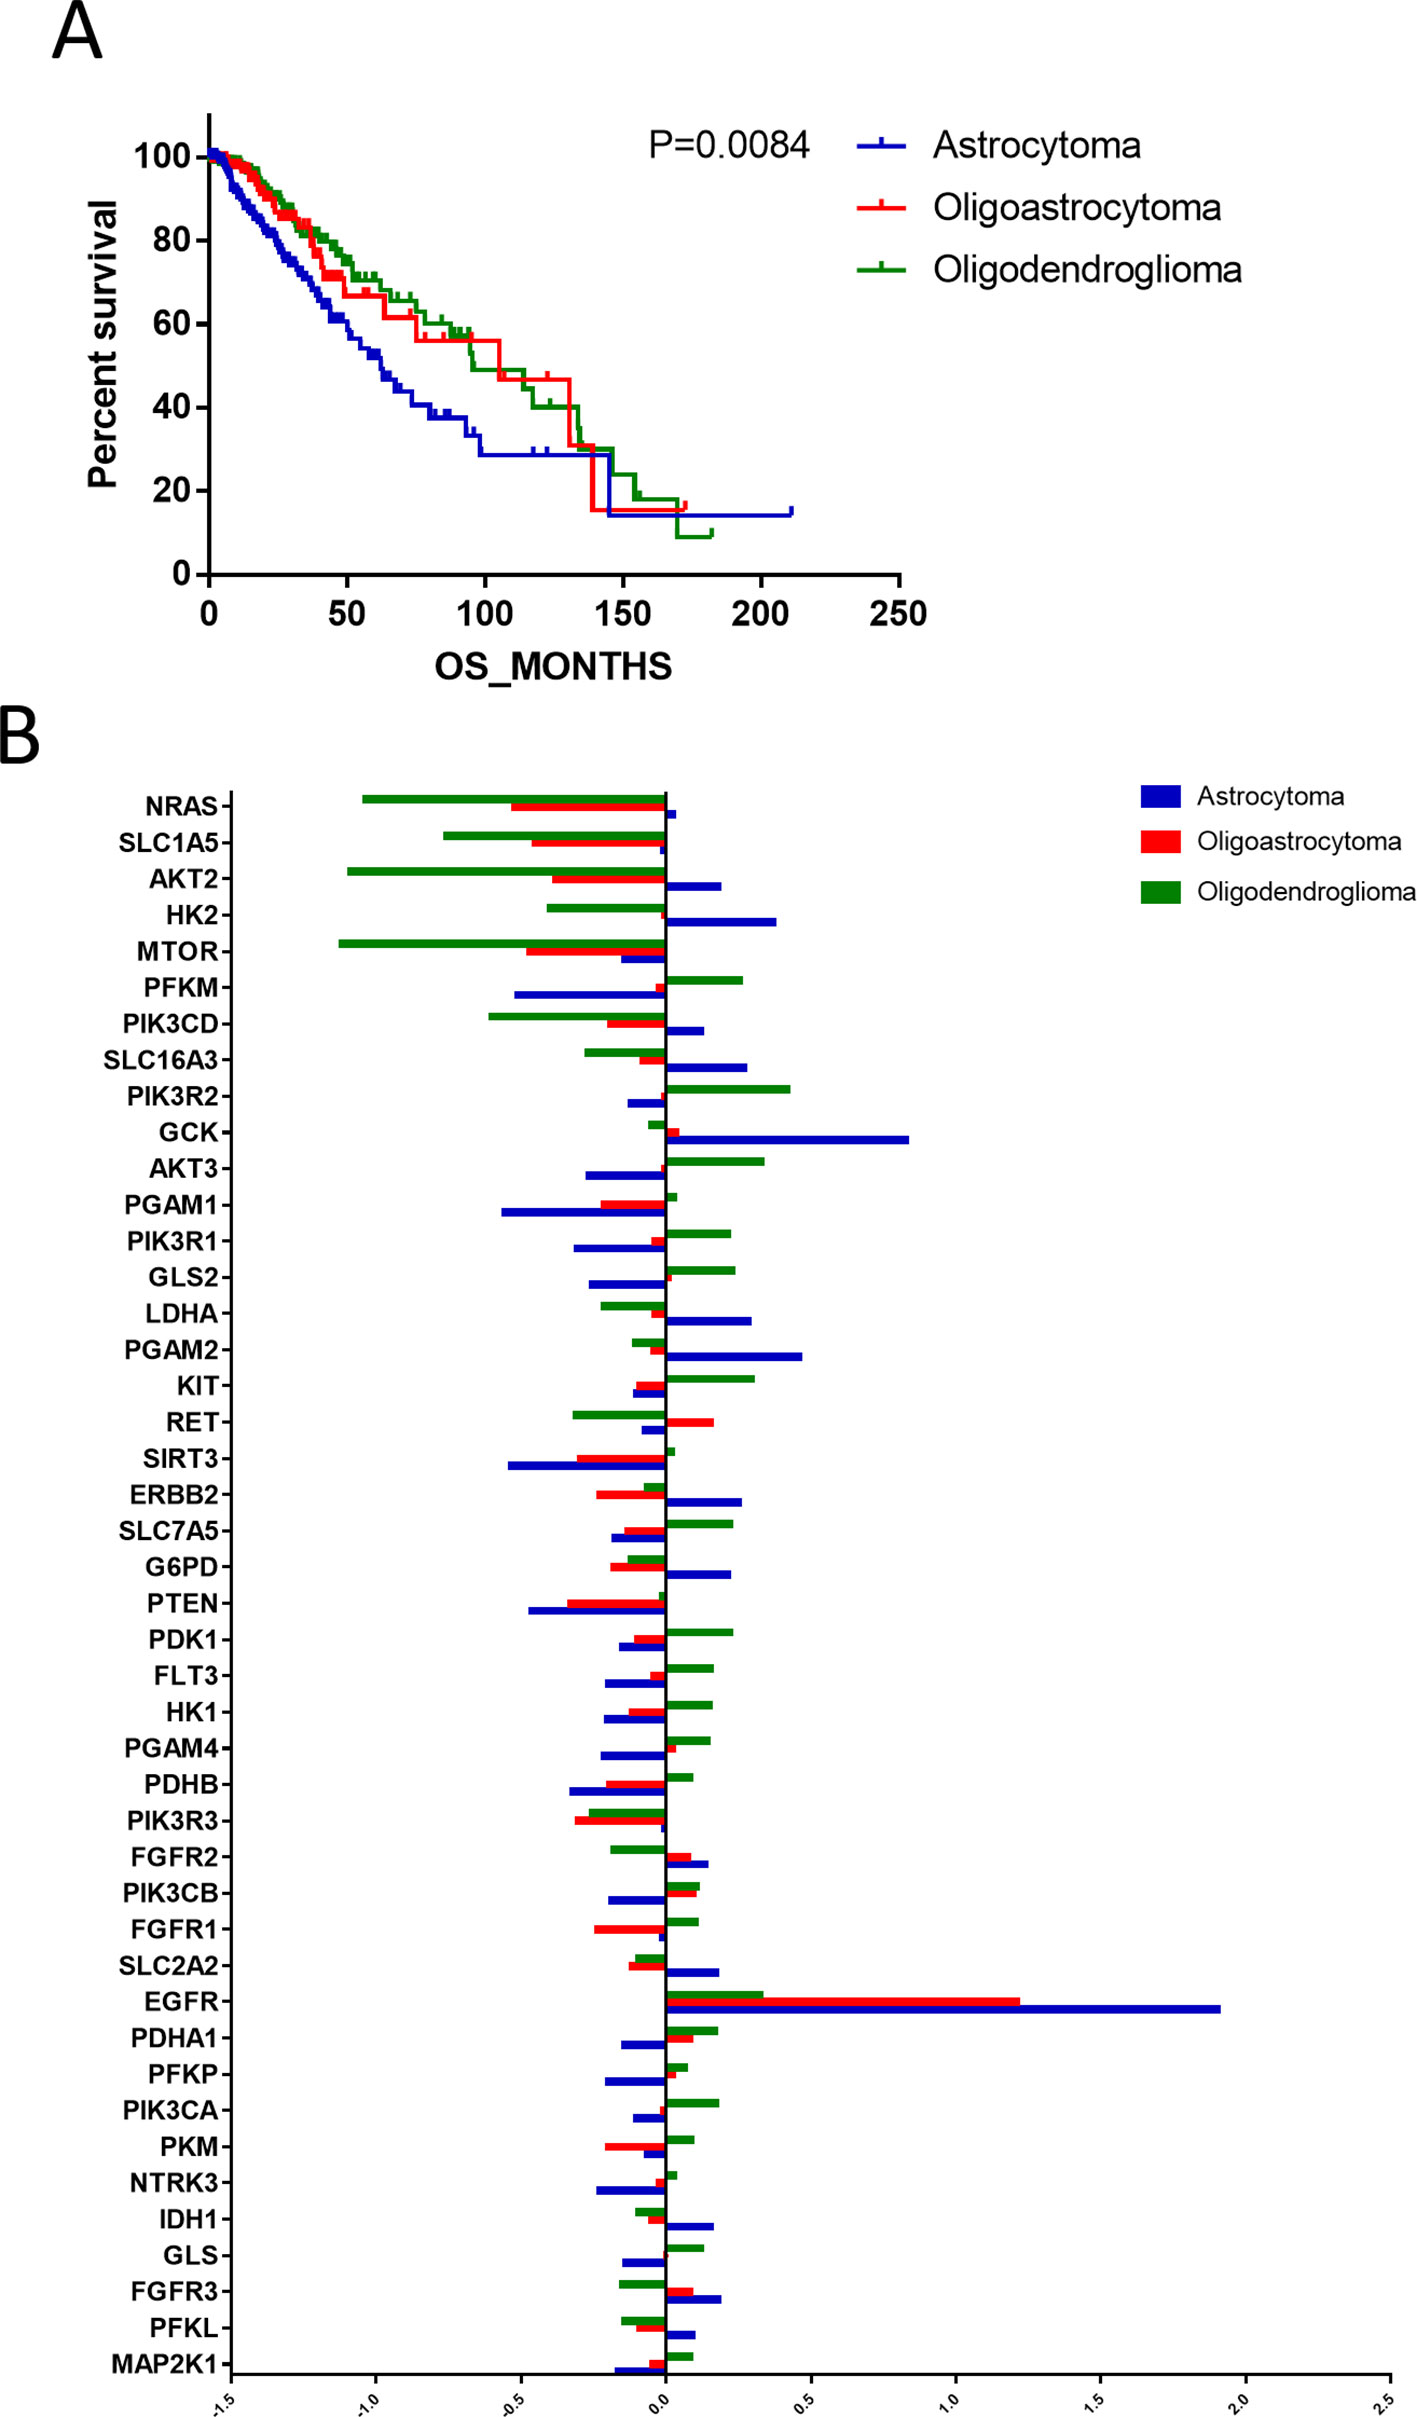
Figure 2 The differences in prognoses of patients with astrocytoma, oligoastrocytoma, and oligodendroglioma were significant. (A) The prognoses of patients with astrocytoma, oligoastrocytoma, and oligodendroglioma were significant. (B) Differential expression analysis demonstrated that 45 metabolism-associated genes were discrepantly expressed among the three histological types.
Differences in the Expression Levels of Metabolism-Associated Genes in Astrocytoma
The above results showed that among the histological types of glioma, astrocytoma showed the worst prognosis. To study the expression profiles of metabolism-associated genes in the poor-prognosis histological types, we grouped the patients with astrocytoma according to the metabolism-associated genes transcriptional data. Among the patients, two primary clusters that showed distinguishing median survival times of 43.99 and 73.42 months were identified (P = 0.0064) (Figures 3A, B). Further, four subclusters were divided according to fine grouping. The comparison of the OS showed that the difference in prognosis was even more marked (P < 0.0001) (Figure 3C). Subcluster 2 had the worse prognosis (median of 24.9 months) than other subclusters (median of 67.41 months), P < 0.0001 (Figure 3D). We respectively detected the gene expression differences between cluster 1 versus cluster 2; among different subclusters and subcluster 2 versus the other subclusters, the results revealed that the expressions of 33 metabolism-associated genes were significantly varied (Figure 3E).
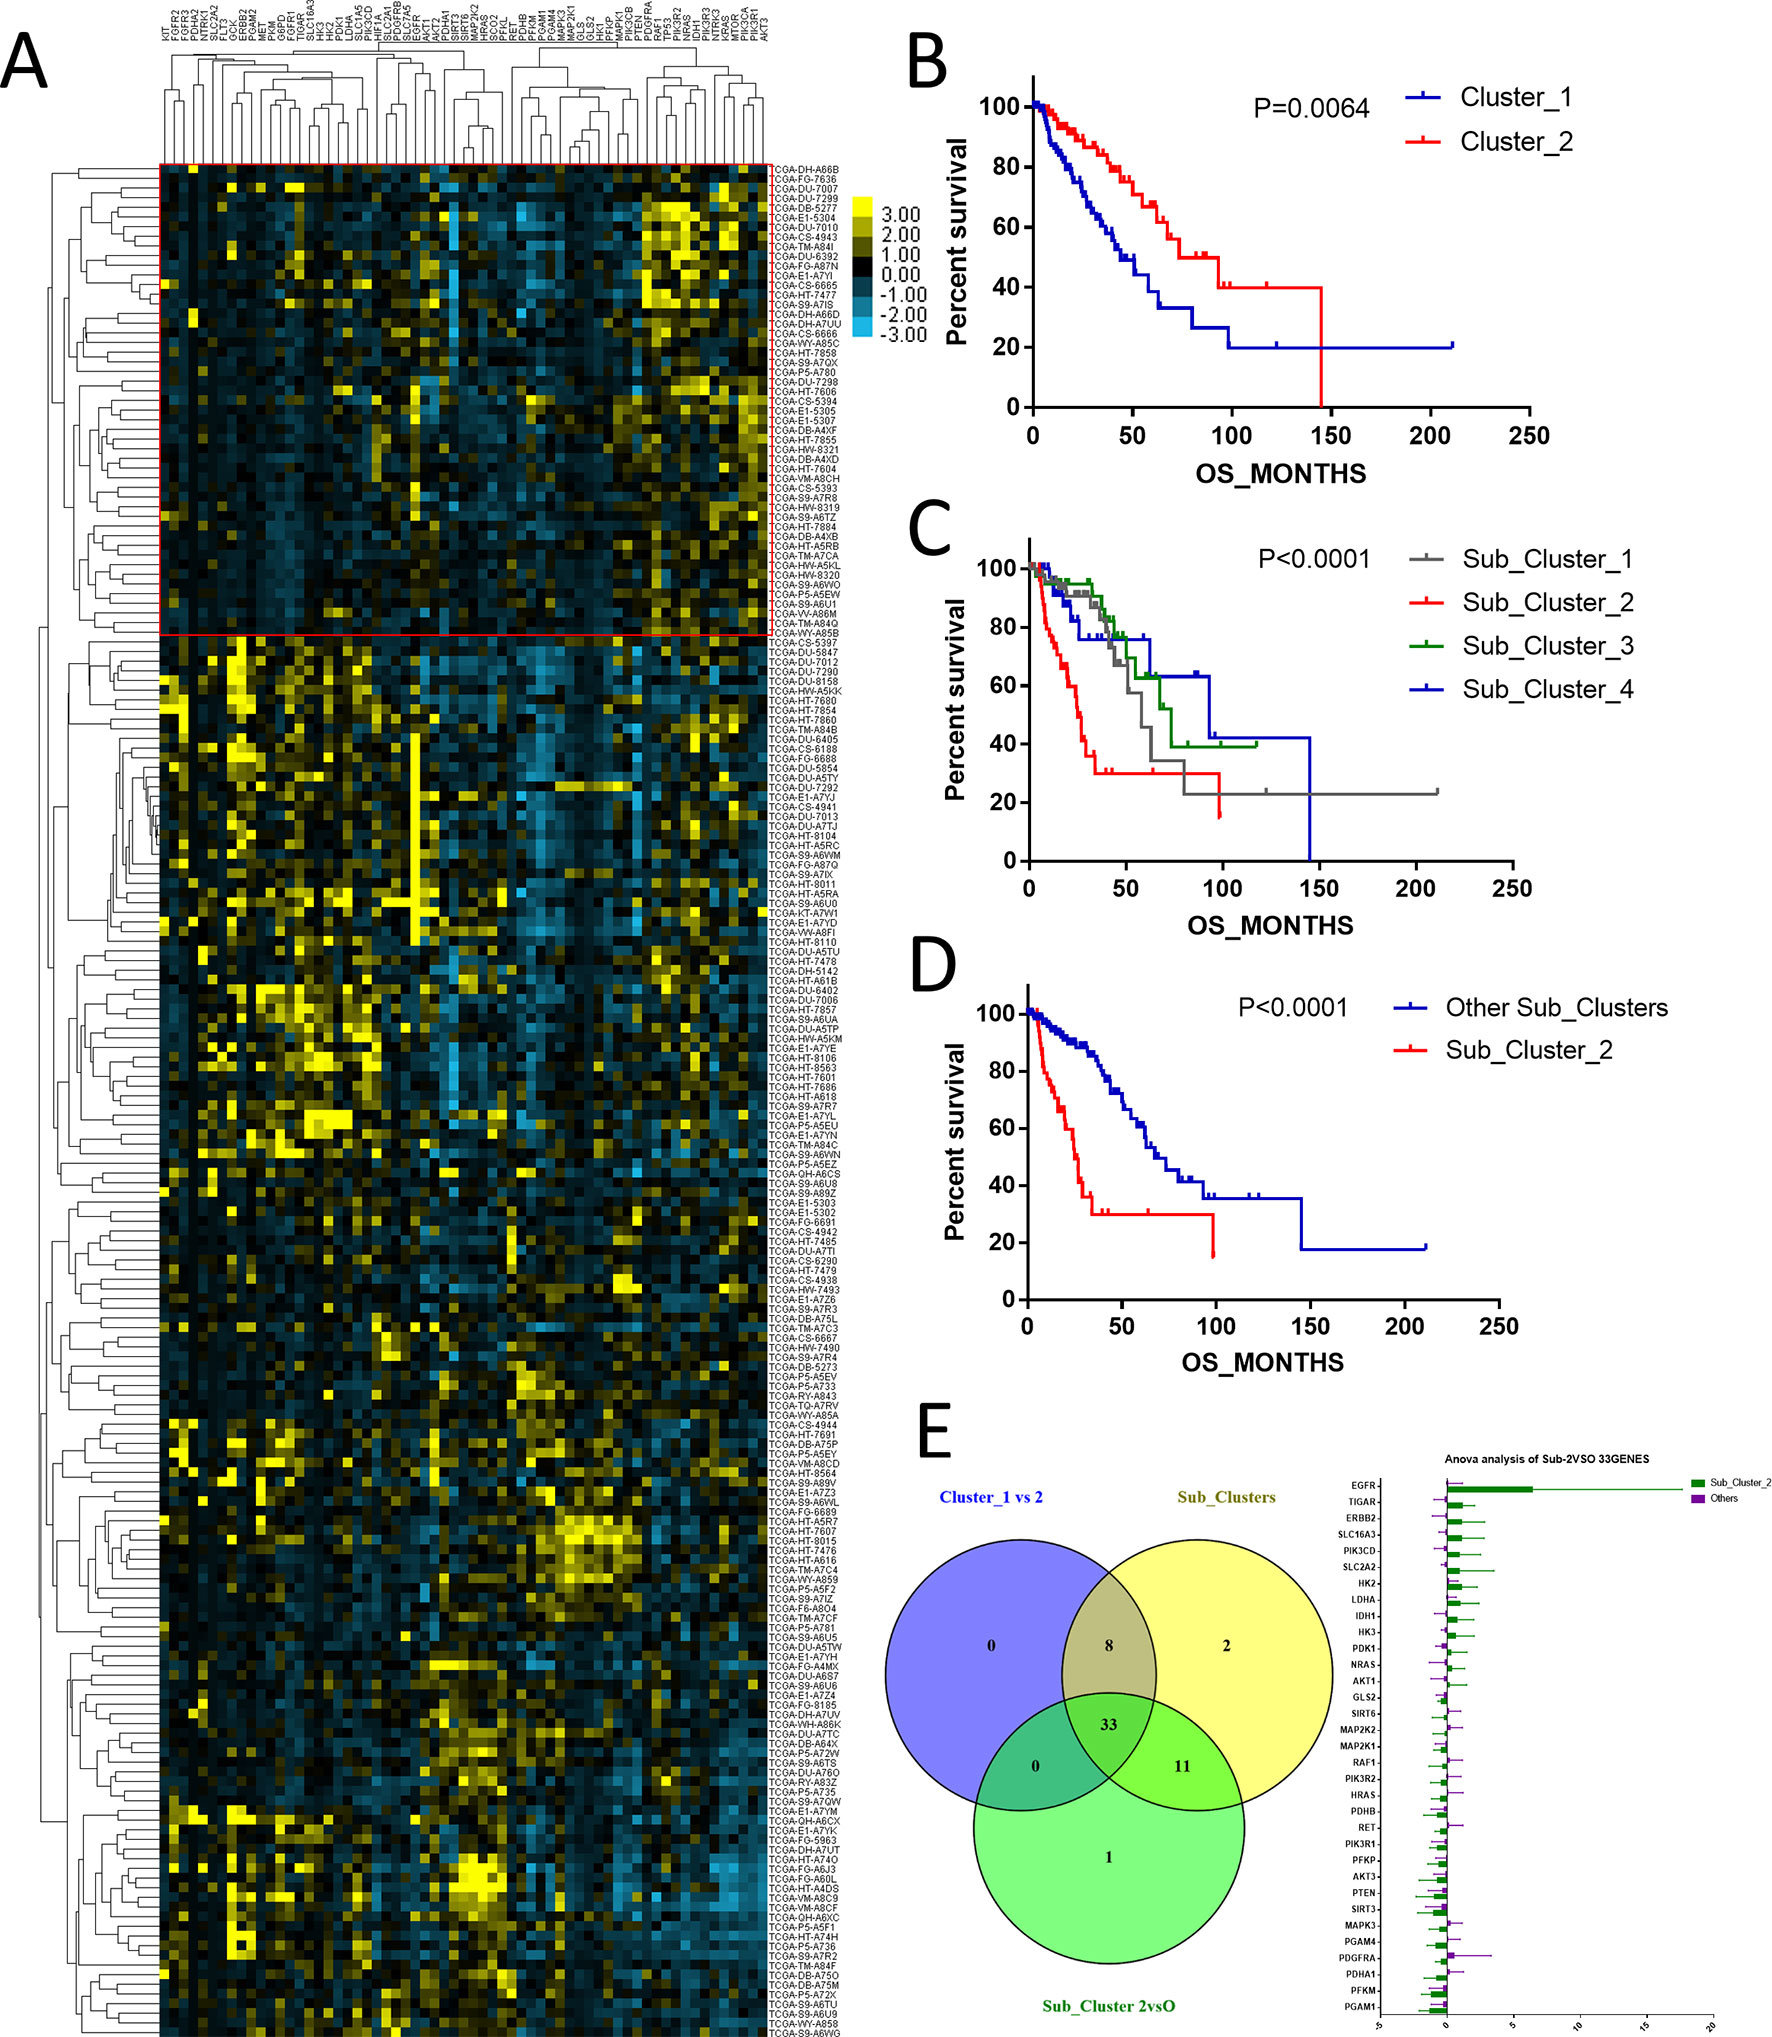
Figure 3 The expression profile of central carbon metabolism–associated genes in patients with astrocytoma. (A) According to expression profiling, two primary clusters and additionally four subdivided clusters were identified. The comparison of median survival between two primary clusters (B) and five subdivided clusters (C) showed significant difference. In addition, patients in subcluster 2 showed the worst prognosis comparing to other patients, P < 0.0001 (D). (E) Differential expression analysis demonstrated that 33 metabolism-associated genes were significantly variated in all contrast of clusters 1 and 2, subcluster 2 and the other subclusters, and five subclusters.
The Prognostic Role of Metabolism-Associated Genes in Astrocytoma
We uncovered that the expression pattern of metabolism-associated genes was closely related to the prognosis of patients with astrocytoma. To investigate the effect of individual metabolism-associated gene on the prognosis of astrocytoma patients, we divided the subjects into two cohorts according to the OS: poor prognosis group and good prognosis group. We further investigated the differences in the expression levels of the metabolism-associated genes. It was detected that 11 genes, namely, FGFR1, ERBB2, PGAM4, PGAM1, G6PD, RET, AKT3, PTEN, RAF1, PKM, and LDHA, had significantly different expression levels between patients with poor and favorable OS times (Figure 4A, Supplementary Table 2).
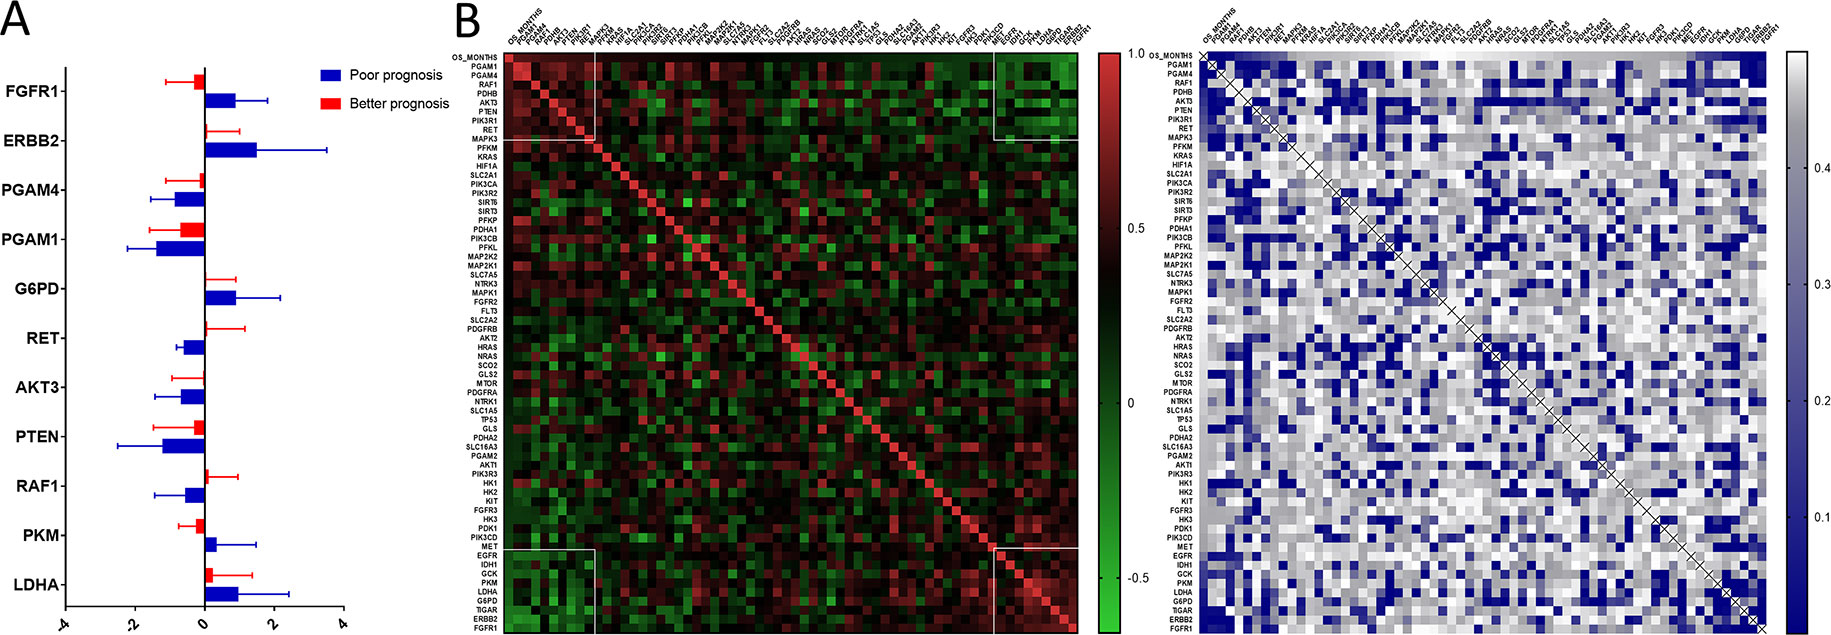
Figure 4 The prognostic role of metabolism-associated genes in astrocytoma. (A) There are 11 differentially expressed genes, containing FGFR1, ERBB2, PGAM4, PGAM1, G6PD, RET, AKT3, PTEN, RAF1, PKM, and LDHA, which were detected to be significantly discrepant between patients with poor and favorable overall survival (OS) times. (B) According to study correlation of individual gene expression and survival, the expression levels of nine genes positively correlated with OS (r > .2, P < 0.05), and the expression levels of the other nine genes were negatively correlated with OS (r < –0.2, P < 0.05).
Additionally, we detected the pertinences between the trend of metabolism-associated gene expression differential and survival variation. According to study correlation of individual gene expression and survival, positive correlations were detected between the respective expression levels of nine genes containing PGAM1, PGAM4, RAF1, PDHB, AKT3, PTEN, PIK3R1, RET, and MAPK3 with OS (r > 0.2, P < 0.05); on the other hand, the expression levels of nine genes containing EGFR, IDH1, GCK, PKM, LDHA, G6PD, TIGAR, ERBB2, and FGFR1 were detected negatively correlated to survival (r < −0.2, P < 0.05) (Table 5). In addition to their associations with survival, the expression levels of the genes are closely correlated between the two sets (Figure 4B).
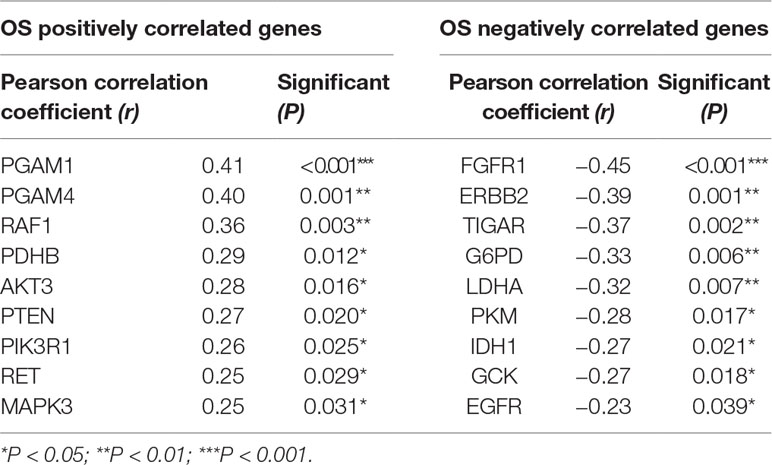
Table 5 The correlation of overall survival (OS) of astrocytoma and expressing variation of individual gene.
To address the prognostic roles of those survival-related genes, we separately split the astrocytoma patients into two groups according to the single gene expression and additionally compared the prognosis between the two groups (Figure 5). Except to AKT3 and PIK3R1, 16 genes showed a significant association with prognosis. Patients with low expression levels of RET and PGAM1 were associated with a greater hazard ratio (HR) for death than that of patients with high expression levels of RET and PGAM1 (P < 0.0001). In contrast, patients with high expression levels of TIGAR, ERBB2, EGFR, and FGFR1 had a higher HR for death than that of patients with low expression levels of those genes (P < 0.0001) (Table 6).
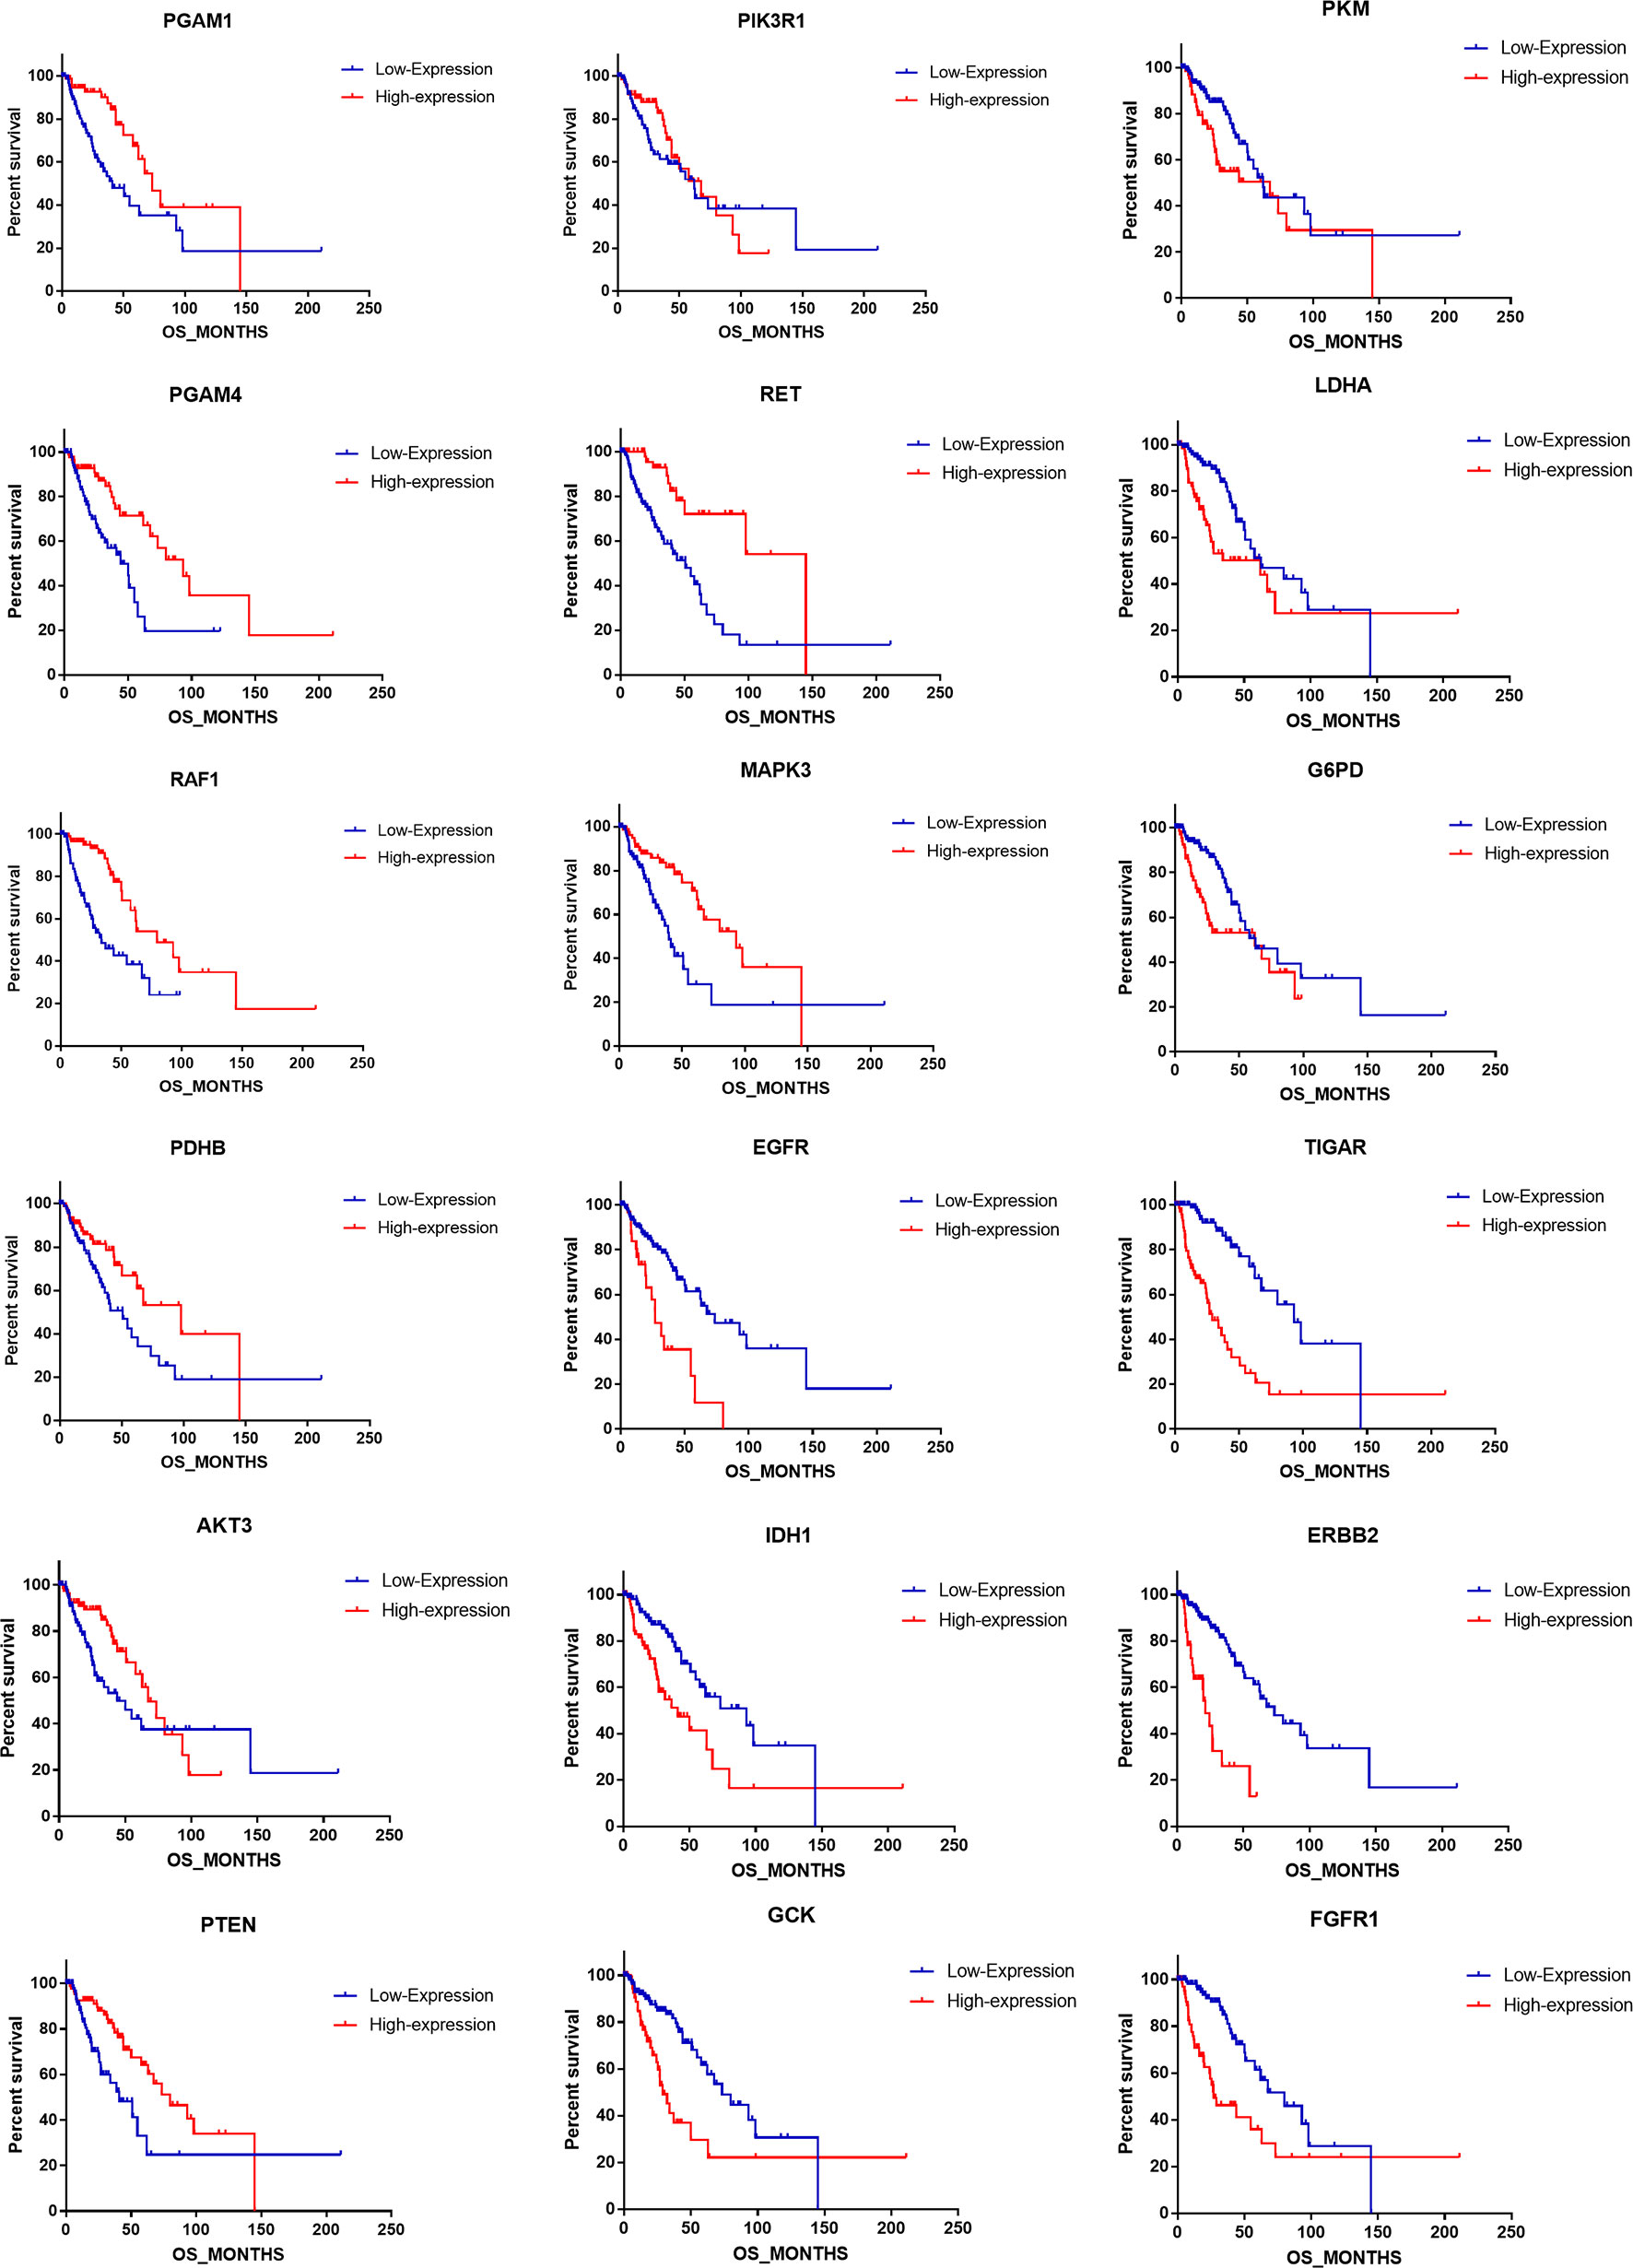
Figure 5 The correlation of singular gene expression difference with the astrocytoma prognosis.
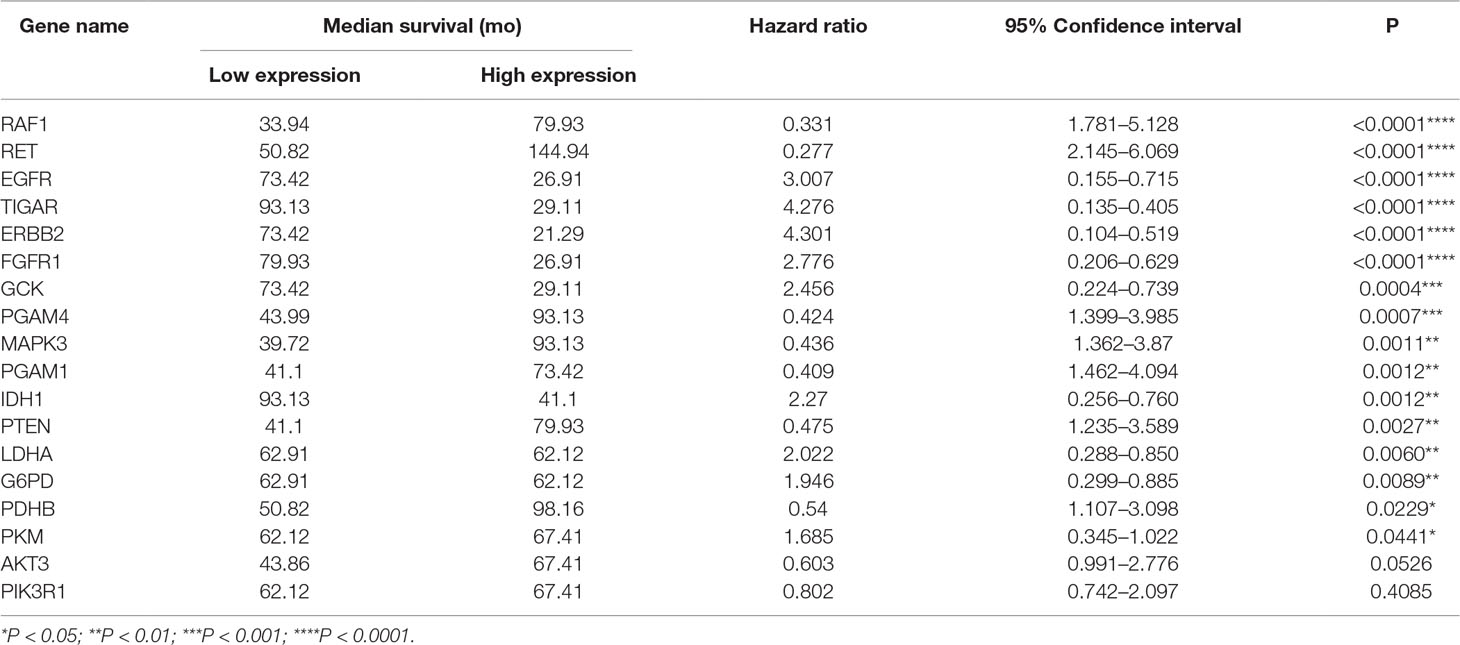
Table 6 The prognostic roles of single metabolism associated gene in astrocytoma.
To evaluate the effects of differences in gene expression on the prediction of the outcome of astrocytoma, we ranked the expression data of 18 genes to construct a regression model. Based on the ranking results, four genes (RAF1, AKT3, IDH1, and FGFR1) were independent predictors of the survival status of astrocytoma patients (Supplementary Table S3). To integrate these four genes into a single panel, multivariate Cox regression analysis was employed to obtain the coefficient. The risk score was calculated as follows: the risk score was equal to the expression of RAF1∗1.801 plus the expression of AKT3∗1.545 plus the expression of IDH1∗1.569 plus the expression of FGFR1∗1.035 (Figure 6A). As shown in Figure 6B, the area under the receiver operating characteristic curve of the four-gene panel for the prediction of the long- or short-term outcomes of astrocytoma was 0.9407, with a 95% confidence interval of 0.8864 to 0.9949 and a P < 0.0001.
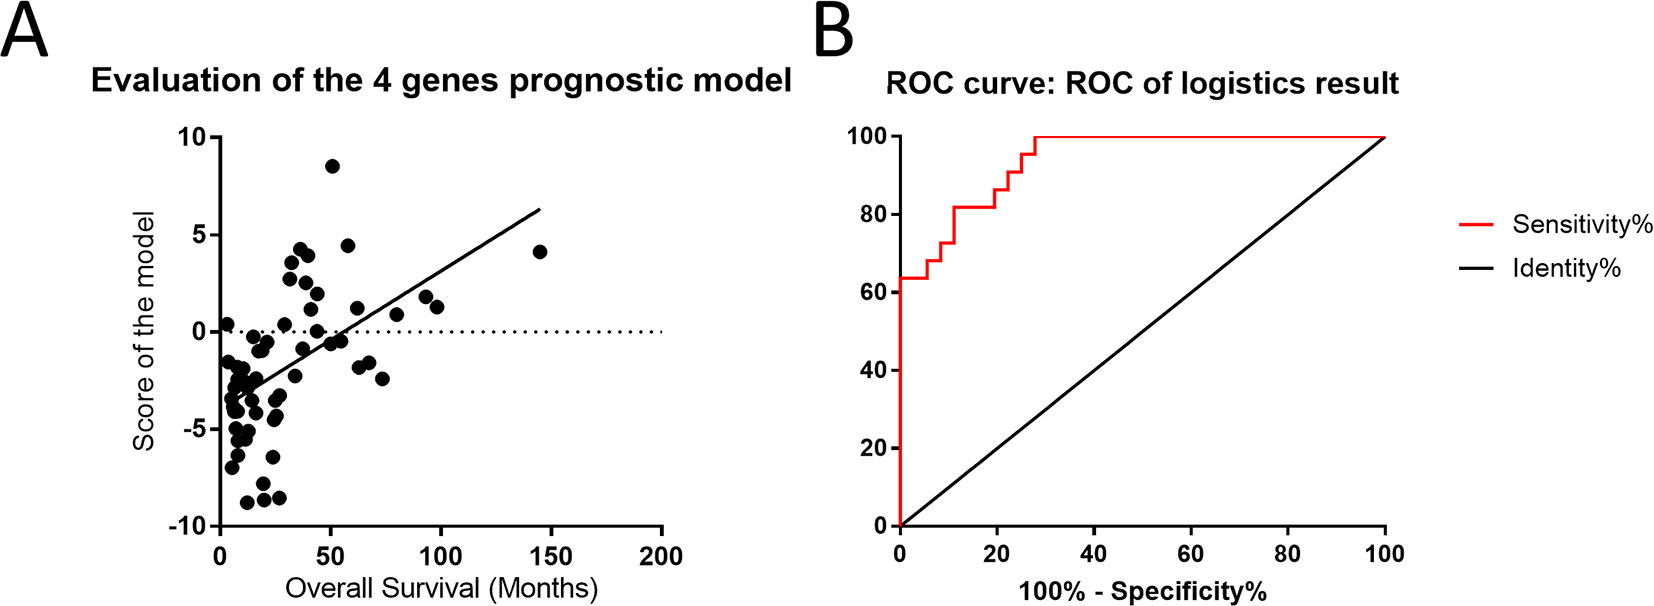
Figure 6 Four-gene panel was utilized to potentially predict the outcomes of patients with astrocytoma. (A) The score of the four-gene model including RAF1, AKT3, IDH1, and FGFR1 was positively correlated with overall survival and showed a linearity. (B) The area under the receiver operating characteristic curve of the four-gene panel for the prediction of the long- or short-term outcomes of astrocytoma was 0.9407, with a 95% confidence interval of 0.8864 to 0.9949 and P < 0.0001.
Discussion
Low-grade glioma has complicated characteristics and diverse histologic types. Although the histopathological classification of low-grade gliomas is reliable, it varies between observers and is insufficient to predict clinical outcomes (Louis et al., 2016). Recently, the molecular analysis of tumors has become a critical part of tumor classification and prognostication, and increasing evidence has suggested that defining tumor subtypes based on differences in gene expression in low-grade glioma is meaningful (Verhaak et al., 2010; Eckel-Passow et al., 2015; Louis et al., 2016). In this study, we found that metabolism-associated gene profiling was able to define two primary clusters and four subclusters of patients with low-grade glioma regardless of histologic type. Overall survival differed between the primary clusters and subclusters. We identified 44 genes with significant differences in expression levels between the groups of patients with the worst and best prognoses (Figure S1). Some of those genes participate in the regulation of intracellular signal transduction, and others are involved in the metabolism of glucose and other carbohydrates. In addition to the differences in gene expression, we found that the groups had significant differences in histological types, tumor grades, tumor sites, and age. The results showed the specific expression profiles of metabolism-associated genes in patients with low-grade glioma.
Astrocytomas, oligoastrocytomas, and oligodendrogliomas are the three histologic subtypes of low-grade glioma; the subtypes have always been difficult to define according to clinical features (Louis et al., 2014). In the current dataset, patients with astrocytoma had worse prognoses than those of patients with the other two subtypes. We detected the differentially expressed genes in patients with different histological types of glioma, and 45 genes were significantly differentially expressed among the three subtypes. Moreover, 80% of those genes (35 genes) overlapped with the gene set (44 genes) that was associated with different subgroups. Specifically, we determined the expression profiles of metabolism-associated genes in astrocytomas. The results showed that 33 genes had significantly different expression levels, and those differences in expression were closely correlated with OS in patients with astrocytomas. These differences in the expression of metabolism-associated genes not only reveal metabolic differences among the histological subtypes but also suggest that there is metabolic heterogeneity within a single subtype.
In patients with astrocytomas, we identified 11 genes that varied significantly in expression between patients with poor and favorable OS. Additionally, we detected genes with expression levels that were positively and negatively associated with OS, and a correlation existed between the expression levels of these two sets of genes. According to the survival analysis, 16 genes were significantly associated with prognosis. Patients with low expression levels of RET and PGAM1 and high expression levels of TIGAR, ERBB2, EGFR, and FGFR1 had elevated HRs with regard to survival. The RET gene encodes a transmembrane receptor that is a member of the tyrosine protein kinase family of proteins. It has been reported that the mRNA levels of RET are elevated in astrocytoma patients with IDH mutations, who are known to have prolonged survival (Zhang et al., 2018). PGAM1 is involved in tumor cell glycolysis and biosynthesis, and this protein had elevated expression levels in high-grade astrocytomas (Liu et al., 2018). Increased expression of these two genes in astrocytomas might inhibit metabolic pathways crucial to the development and progression of tumors.
Low-grade glioma is one of the most malignant human diseases, with a very poor prognosis and scant available information about its biological properties. This study provided new information about the metabolism events affected by the identified genes with differential expression levels. We divided the patients into different subgroups according to their metabolism-associated gene expression patterns. The expression levels of those genes were strongly correlated with the prognosis of patients with astrocytoma, possibly because of their effect on the regulation of the biological behavior of the tumor. This study increases our understanding of the prognostic roles of central carbon metabolism–associated genes in patients with low-grade glioma.
Data Availability
The datasets analyzed for this study can be found in the cBioPortal for Cancer Genomics (http://cbioportal.org).
Ethics Statement
Data obtained from the TCGA open-access database was collected from tumors of patients who provided informed consent based on the guidelines from the TCGA Ethics, Law and Policy Group.
Author Contributions
LZ designed the current study. MG collected the data and performed the statistical test. KW sorted the clinical information and interpreted the result. LW wrote the manuscript. All authors read and approved the final manuscript.
Funding
This work was funded by the National Natural Science Foundation of China (no. 81702355).
Conflict of Interest Statement
The authors declare that the research was conducted in the absence of any commercial or financial relationships that could be construed as a potential conflict of interest.
Acknowledgments
We also thank the Nature Research Editing Service for English language editing (certificate verification key: 32CA-EFCA-2E6F-4A78-682P).
Supplementary Material
The Supplementary Material for this article can be found online at: https://www.frontiersin.org/articles/10.3389/fgene.2019.00831/full#supplementary-material.
References
Brat, D. J., Verhaak, R. G., Aldape, K. D., Yung, W. K., Salama, S. R., Cooper, L. A., et al. (2015). Comprehensive, integrative genomic analysis of diffuse lower-grade gliomas. N. Engl. J. Med. 372, 2481–2498. doi: 10.1056/NEJMoa1402121
Brennan, C. W., Verhaak, R. G., Mckenna, A., Campos, B., Noushmehr, H., Salama, S. R., et al. (2013). The somatic genomic landscape of glioblastoma. Cell 155, 462–477. doi: 10.1016/j.cell.2013.09.034
Bush, N.A.O., Chang, S. (2016). Treatment strategies for low-grade glioma in adults. J. Oncol. Pract. 12, 1235–1241. doi: 10.1200/JOP.2016.018622
Chen, B., Liang, T., Yang, P., Wang, H., Liu, Y., Yang, F., et al. (2016). Classifying lower grade glioma cases according to whole genome gene expression. Oncotarget 7, 74031–74042. doi: 10.18632/oncotarget.12188
De Hoon, M. J., Imoto, S., Nolan, J., Miyano, S. (2004). Open source clustering software. Bioinformatics 20, 1453–1454. doi: 10.1093/bioinformatics/bth078
Dixit, K., Raizer, J. (2017). Newer strategies for the management of low-grade gliomas. Oncology (Williston Park, N. Y.) 31, 680–682, 684–685.
Eckel-Passow, J. E., Lachance, D. H., Molinaro, A. M., Walsh, K. M., Decker, P. A., Sicotte, H., et al. (2015). Glioma groups based on 1p/19q, IDH, and TERT promoter mutations in tumors. N. Engl. J. Med. 372, 2499–2508. doi: 10.1056/NEJMoa1407279
Gao, J., Aksoy, B. A., Dogrusoz, U., Dresdner, G., Gross, B., Sumer, S. O., et al. (2013). Integrative analysis of complex cancer genomics and clinical profiles using the cBioPortal. Sci. Signal. 6, pl1. doi: 10.1126/scisignal.2004088
Kanehisa, M., Furumichi, M., Tanabe, M., Sato, Y., Morishima, K. (2017). KEGG: new perspectives on genomes, pathways, diseases and drugs. Nucleic Acids Res. 45, D353–D361. doi: 10.1093/nar/gkw1092
Labak, C. M., Wang, P. Y., Arora, R., Guda, M. R., Asuthkar, S., Tsung, A. J., et al. (2016). Glucose transport: meeting the metabolic demands of cancer, and applications in glioblastoma treatment. Am. J. Cancer Res. 6, 1599–1608.
Liu, Z. G., Ding, J., Du, C., Xu, N., Wang, E. L., Li, J. Y., et al. (2018). Phosphoglycerate mutase 1 is highly expressed in C6 glioma cells and human astrocytoma. Oncol. Lett. 15, 8935–8940. doi: 10.3892/ol.2018.8477
Louis, D. N., Perry, A., Burger, P., Ellison, D. W., Reifenberger, G., Von Deimling, A., et al. (2014). International Society of Neuropathology—Haarlem consensus guidelines for nervous system tumor classification and grading. Brain Pathol. 24, 429–435. doi: 10.1111/bpa.12171
Louis, D. N., Perry, A., Reifenberger, G., Von Deimling, A., Figarella-Branger, D., Cavenee, W. K., et al. (2016). The 2016 World Health Organization Classification of Tumors of the Central Nervous System: a summary. Acta Neuropathol. 131, 803–820. doi: 10.1007/s00401-016-1545-1
Reitzer, L. J., Wice, B. M., Kennell, D. (1979). Evidence that glutamine, not sugar, is the major energy source for cultured HeLa cells. J. Biol. Chem. 254, 2669–2676.
Saldanha, A. J. (2004). Java Treeview—extensible visualization of microarray data. Bioinformatics 20, 3246–3248. doi: 10.1093/bioinformatics/bth349
Sanborn, J. Z., Salama, S. R., Grifford, M., Brennan, C. W., Mikkelsen, T., Jhanwar, S., et al. (2013). Double minute chromosomes in glioblastoma multiforme are revealed by precise reconstruction of oncogenic amplicons. Cancer Res. 73, 6036–6045. doi: 10.1158/0008-5472.CAN-13-0186
Smith, J. S., Perry, A., Borell, T. J., Lee, H. K., O’fallon, J., Hosek, S. M., et al. (2000). Alterations of chromosome arms 1p and 19q as predictors of survival in oligodendrogliomas, astrocytomas, and mixed oligoastrocytomas. J. Clin. Oncol. 18, 636–645. doi: 10.1200/JCO.2000.18.3.636
Soga, T. (2013). Cancer metabolism: key players in metabolic reprogramming. Cancer Sci. 104, 275–281. doi: 10.1111/cas.12085
The Cancer Genome Atlas Research Network, Mclendon, R., Friedman, A., Bigner, D., Van Meir, E. G., Brat, D. J., et al. (2008). Comprehensive genomic characterization defines human glioblastoma genes and core pathways. Nature 455, 1061. doi: 10.1038/nature07385
Verhaak, R. G., Hoadley, K. A., Purdom, E., Wang, V., Qi, Y., Wilkerson, M. D., et al. (2010). Integrated genomic analysis identifies clinically relevant subtypes of glioblastoma characterized by abnormalities in PDGFRA, IDH1, EGFR, and NF1. Cancer Cell 17, 98–110. doi: 10.1016/j.ccr.2009.12.020
Warburg, O. (1956). On the Origin of Cancer Cells. Science 123, 309–314. doi: 10.1126/science.123.3191.309
Yan, H., Parsons, D. W., Jin, G., Mclendon, R., Rasheed, B. A., Yuan, W., et al. (2009). IDH1 and IDH2 mutations in gliomas. N. Engl. J. Med. 360, 765–773. doi: 10.1056/NEJMoa0808710
Keywords: low-grade glioma, astrocytoma, prognosis, metabolism, gene expression
Citation: Wang L, Guo M, Wang K and Zhang L (2019) Prognostic Roles of Central Carbon Metabolism–Associated Genes in Patients With Low-Grade Glioma. Front. Genet. 10:831. doi: 10.3389/fgene.2019.00831
Received: 08 May 2019; Accepted: 12 August 2019;
Published: 18 September 2019.
Edited by:
Xiangqian Guo, Henan University, ChinaReviewed by:
Yang An, Henan University, ChinaHaiwei Mou, Cold Spring Harbor Laboratory, United States
Copyright © 2019 Wang, Guo, Wang and Zhang. This is an open-access article distributed under the terms of the Creative Commons Attribution License (CC BY). The use, distribution or reproduction in other forums is permitted, provided the original author(s) and the copyright owner(s) are credited and that the original publication in this journal is cited, in accordance with accepted academic practice. No use, distribution or reproduction is permitted which does not comply with these terms.
*Correspondence: Kai Wang, d2tzbGFzaGtpbmdAMTYzLmNvbQ==; Lei Zhang, emhhbmdsZWlhZm1tdUAxNjMuY29t
†These authors have contributed equally to this work