 Jianjian Lv
 Dongfang Sun1
- 1Key Laboratory of Sustainable Development of Marine Fisheries, Ministry of Agriculture, Yellow Sea Fisheries Research Institute, Chinese Academy of Fishery Sciences, Qingdao, China
- 2Function Laboratory for Marine Fisheries Science and Food Production Processes, Qingdao National Laboratory for Marine Science and Technology, Qingdao, China
Low salinity is one of the most important abiotic factors that directly affect the abundance of the swimming crab, Portunus trituberculatus. Quantitative trait loci (QTL) mapping could be helpful in identifying the markers and genes involved in low salinity tolerance. In this study, two QTLs of low salt tolerance were mapped on linkage group 17 (LG17, 2.6–5.2 cM) based on a high-density linkage map. Ninety-five markers related to low salinity tolerance were identified via association analysis, and seventy-nine low salt-related candidate genes (including ammonium transport, aldehyde dehydrogenase, and glucosyltransferase) were screened from draft genome of the species via these markers. This represents the first report of QTL mapping for low salinity tolerance in the swimming crab, which may be useful to elucidate salinity adaptation mechanisms.
Introduction
The swimming crab, Portunus trituberculatus (Crustacea: Decapoda: Brachyura), is an important marine species for fisheries and aquaculture. Its natural distribution is along the coastal waters of China, Korea, Japan, and other East Asian countries (Lv et al., 2013). Due to its fast growth, P. trituberculatus has become one of the most important economic species for marine aquaculture (Ren and Pan, 2014). In 2017, the total aquaculture yield of the crab reached 119,777 tons in China.
Salinity is one of the most important abiotic factors that directly affect the distribution and abundance of the swimming crab (Lv et al., 2013; Lv et al., 2015). During the breeding period, crabs are often exposed to low salinity stress due to rainstorms and water exchange, causing death and huge economic losses. Thus, in order to produce healthy crabs, it is necessary to breed varieties that are tolerant to low salinity. However, compared to growth, the heritability of salt tolerance traits is lower (Baoquan et al., 2010; Zheng et al., 2015). Compared with higher heritability traits, the genetic improvement of low heritability traits through routine selection is less efficient, but could be accelerated with the help of molecular marker assisted breeding (MAS) or molecular breeding technology (Poompuang and Hallerman, 1997; Martinez et al., 2007). To elucidate the potential genetic mechanisms underlying salt tolerance traits, some scholars tried to explore related genes by comparative transcriptome (Xu and Liu, 2011; Lv et al., 2013), and hundreds of potential salt tolerance related genes have been identified involved in crucial processes, such as ion transport processes, amino acid metabolism and synthesis processes, proteolysis process and chitin metabolic process. Among which, ion transport in gill was the research focus of elucidating the molecular mechanism of salinity adaptation (Freire et al., 2008; Romano and Zeng, 2012), and many ion transport related genes including Na+,K+-ATPase, V-type H+-ATPase and Na+,K+, 2Cl− cotransporter were cloned and studied (Tsai and Lin, 2007; Garcon et al., 2011; Lv et al., 2016). However, the complex molecular mechanisms involved in salinity tolerance are still poorly understood, and there is a lack of valuable molecular markers for MAS.
An accurate high-resolution genetic linkage map is an essential tool for addressing genetics and genomics questions (Jiao et al., 2014; Yu et al., 2015). The development of such maps is also an important foundation for the genetic breeding of a species, and is indispensable for MAS (Andriantahina et al., 2013; Shao et al., 2015). With advances in sequencing technologies over the past 5 years, high-resolution linkage maps of several aquacultured crustaceans (e.g., Penaeus monodon, Litopenaeus vannamei and E. sinensis) have been constructed with thousands of markers identified (average marker distances < 1 cM) (Baranski et al., 2014; Cui et al., 2015; Yu et al., 2015). Recently, a high-density P. trituberculatus linkage map with 10,963 markers was mapped to 53 sex-averaged linkage groups, and had an average marker distance of 0.51 cM (Lv et al., 2017). Many important economic traits, including growth, disease resistance, and sex determination were mapped based on high-resolution linkage maps. However, there are no reports on quantitative trait loci (QTL) analyses for low salinity tolerance in crustaceans.
The aim of the present study was to identify QTL and markers for low salinity tolerance in the swimming crab. QTL mapping was performed based on a high-density linkage map constructed previously (Lv et al., 2017). Association analysis and verification among different populations were carried out to identify low salinity tolerance-related markers (salinity tolerant markers). As a result, QTLs for low salinity tolerance were mapped on LG17, and one salt-tolerance marker at the population level was identified. These results will be helpful to elucidate the mechanisms of low salinity tolerance in P. trituberculatus.
Materials and Methods
Data Collection
The materials and the data used in this study were the same as previously reported (Lv et al., 2017). Briefly, the QTL mapping population was an F1 full sib family containing 116 progenies derived from a female parent from the wild population of the Bohai Sea and a male parent from a F9 full sibling. Muscle tissues were sampled and immediately preserved in liquid nitrogen. Genomic DNAs were extracted using TIANamp Marine animal DNA extraction kit (TIANGEN, Beijing, China). The DNA concentration and integrity were evaluated via a NanoDrop 1,000 Spectrophotometer (NanoDrop, Wilmington, DE, USA) and electrophoresis in 1% agarose gel, respectively. Sequencing was performed on the Illumina HiSeq 2500 sequencing platform and markers were found via SLAF-seq (specific-locus amplified fragment sequencing). The SLAF library construction and sequencing follows what was previously described elsewhere (Lv et al., 2017). Finally, a high density linkage map with 10,963 markers and 0.51 cM marker interval was constructed.
Quantitative Trait Loci Mapping
The salinity tolerance trait was collected for the full-sib family during low salt challenge process. In brief, the salinity content in the tank was gradually reduced to 5 ppt of salinity content by adding fresh water. This challenge experiment lasted for ∼72 h. Mortality was recorded every 3 h based on the appearance of dead crab (Supplementary Table S1). The method of QTL mapping was the same as in our previous work (Lv et al., 2017). Briefly, the multiple-QTL model mapping (MQM) method was using QTL analysis via MapQTL 4.0 software as described (Ooijen et al., 2000; Wei et al., 2014). 1 cM walking step was adopted in composite interval mapping (CIM). Approximately 95% confidence intervals were constructed using the two-LOD support rule (Ooijen, 1992). A minimum score of 3.0 likelihood-ratio statistic (LOD) was used to identify significant QTL in a particular genomic region, which was determined using 1,000 permutations. The phenotypic variance explained (PVE) was also calculated based on the mapping population variance via MapQTL4.0.
Association Analysis
As a complementary approach to QTL mapping, the relationship between markers and salinity tolerance trait was further tested by association analysis using the same F1 family material as previously reported (Cui et al., 2015; Lv et al., 2018). ‘GWAF’ R package was used for association analysis in this work, which was designed mainly to analyze a batch of genotyped markers. The package is suitable for dichotomous or continuous phenotype, measured on subjects of families for genetic association (Chen and Yang, 2010). Logistic regressions via a generalized linear mixed effects model (GLMM) were used to test the genetic association between markers and phenotypes with the additive effect model. The functions ‘ lme.batch ‘ and ‘ gee.lgst.batch ‘ were implemented to perform a global test (i.e., Wald χ 2 test) for genotype effects. Benjamini and Hochberg correction was applied to correct for Type I errors in multiple comparisons.
Candidate Genes Identified
The markers located in the QTL interval or that showed significant association with the low salinity tolerance trait (p < 0.01) by association analysis (abbreviated as salinity marker), were aligned to the crab draft genome recently released (https://figshare.com/projects/De_novo_draft_genome_of_Portunus_trituberculatus_and_its_Hox_gene_cluster/61295). Then we retained the annotated scaffolds, which contained at least one known gene. These genes located in the scaffolds anchored by the salinity marker were considered candidate genes of low salinity tolerance trait. TBtools toolkit was used to carry out blast analysis between markers and genomic scaffolds (Chen et al., 2018), of which the E-value parameter was set to less than 1e-20.
Validation of Salinity Markers
Firstly, the salinity markers were validated at the family level (36 individuals with the shortest survival time and 11 surviving individuals were selected from the QTL mapping family). Subsequently, to further confirm the association at the population level, an additional challenge experiment was performed. Two hundred healthy crabs were selected from our research team’s core breeding population, which consisted of individuals derived from four wild geographical populations in 2005 (Li et al., 2013). The selected crabs were challenged in 5 ppt of salinity content as mentioned above. Based on the survival time, 20 individuals with the shortest and the longest survival time were selected, called sensitive group and tolerant group, respectively. Muscle tissues were sampled and immediately preserved in liquid nitrogen. Genomic DNAs were extracted using TIANamp Marine animal DNA extraction kit (TIANGEN, Beijing, China). The DNA concentration and integrity were evaluated via a NanoDrop 1000 Spectrophotometer (NanoDrop, Wilmington, DE, USA) and electrophoresis in 1% agarose gel, respectively. A total of ten markers with sufficient flanking regions (including four markers within the QTL interval and six salinity markers with p value of association analysis < 0.001), were selected to validate by PCR product sequencing (generally speaking, the smaller the p value, the greater the correlation with low salinity tolerance trait). All successfully amplified PCR target products of salinity markers were purified and sequenced with the automated sequencer ABI 3730 (Applied Bio-system). SNPs (single nucleotide polymorphism) were genotyped by sequencing chromatograms via Vector NTI 11.0 (Invitrogen). SNP site allele frequencies were calculated by SPSS 17.0 and compared by the Pearson chi-square test for the significance tests to confirm their association with the susceptibility/tolerance to salinity challenge. Results were considered statistically significant when P < 0.05.
Results
QTL Mapping of Low Salinity Tolerance Trait
On the basis of the high density linkage map (a total of 10,963 markers, with a mean marker interval of 0.51 cM), Two QTLs related to low salinity tolerance trait were detected by MapQTL 4.0 software, which were located on LG17 (2.6–5.2 cM) (Table 1 and Figure 1). Each QTL interval contained two markers (a total of four markers were located in the two QTL intervals), and each marker contributed to PVE of 14.8% with LOD value of 3.06 (Table 1).
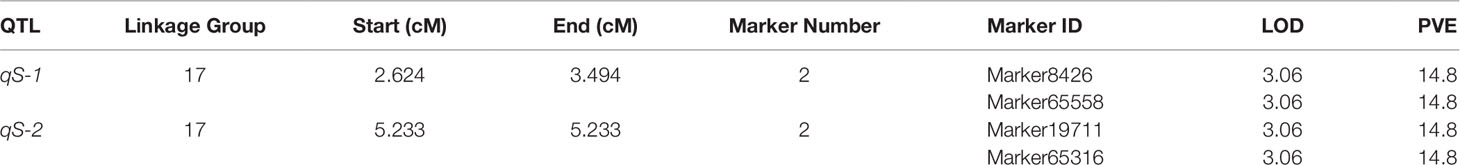
Table 1 Characteristics of low salinity tolerance trait related quantitative trait loci.
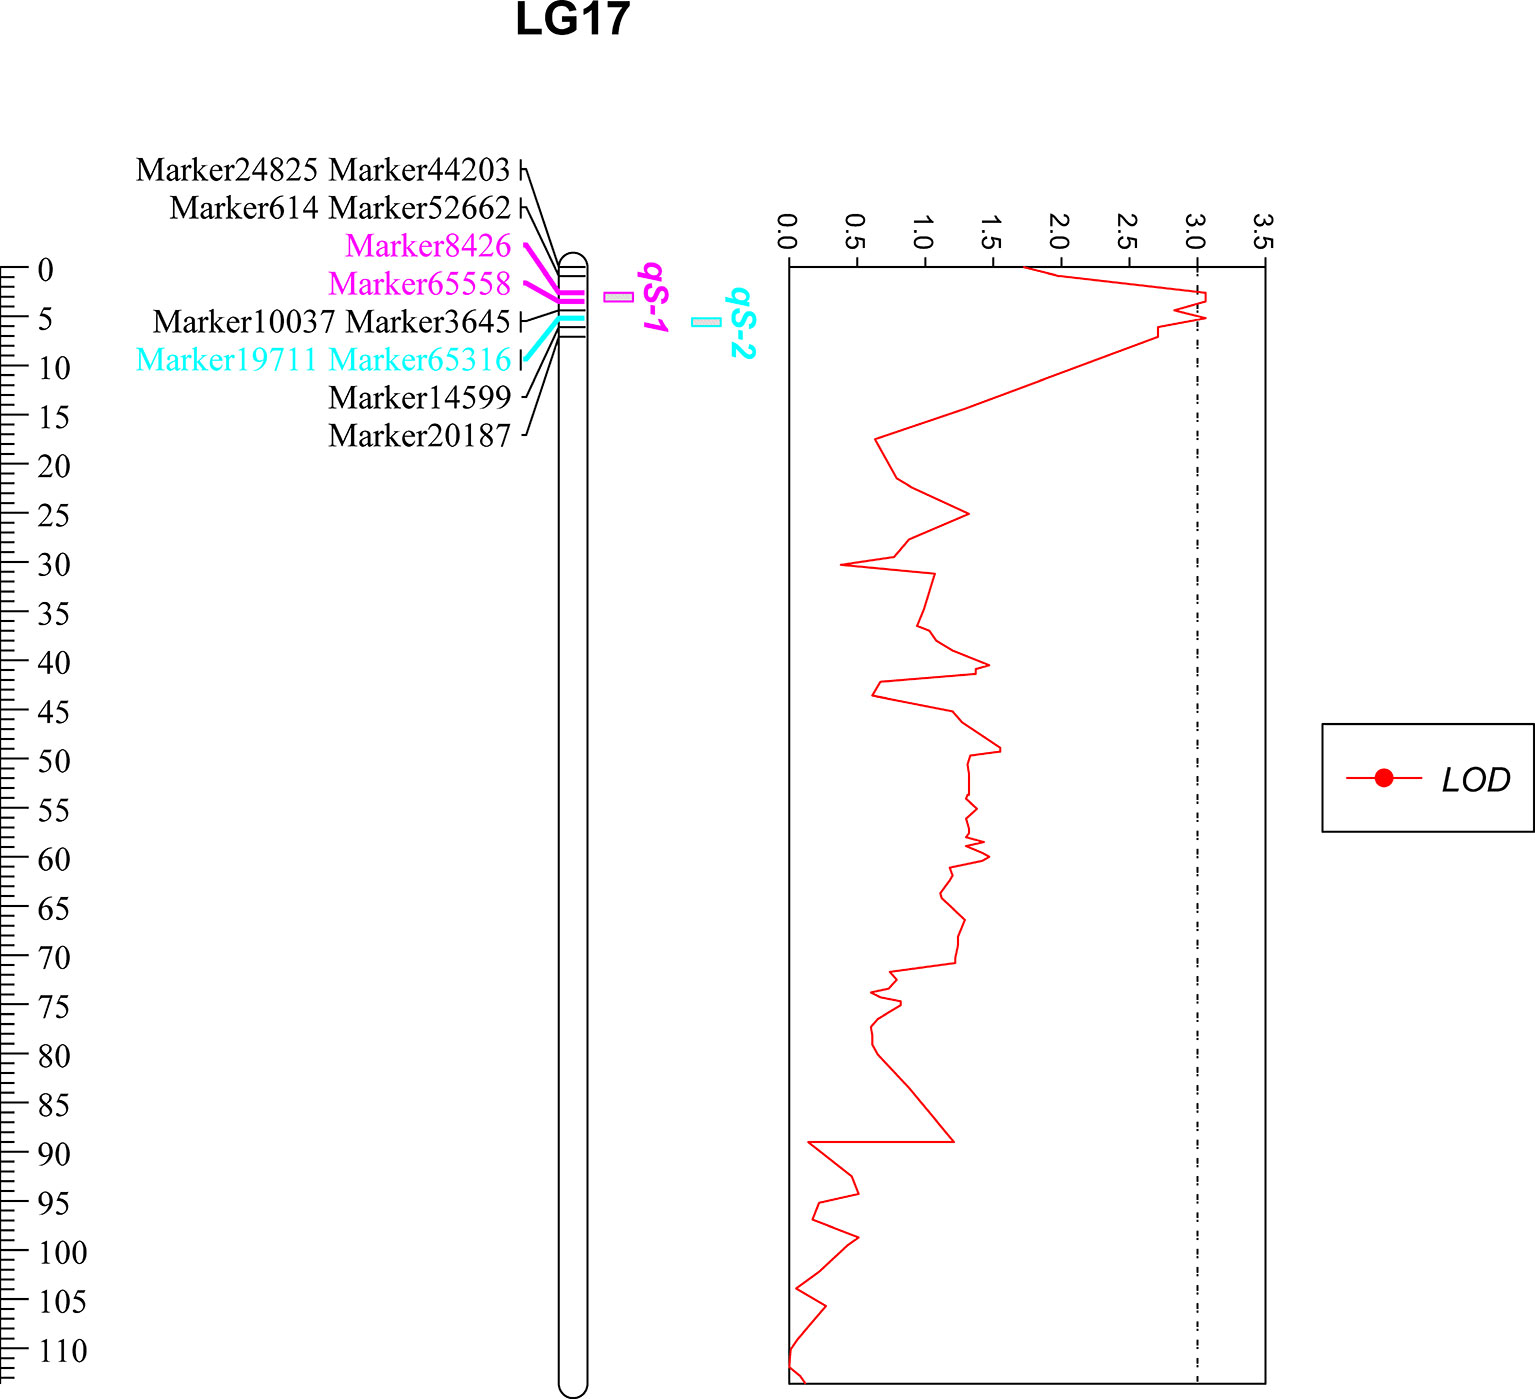
Figure 1 Quantitative trait loci mapping of low salinity tolerance trait in P. trituberculatus. The ruler shows the length of LG17, of which the unit is centimorgans (cM). Only markers near the QTL are displayed, among them, pink markers are located in the qS-1 interval, blue markers are located in the qS-2 interval. The four markers were overlapped with the salinity marker screening by association analysis. The red curve represents the LOD value of the markers on LG17.
Association Analysis
The association analysis investigated a total of 36,976 markers in the mapping family, and 95 markers showed significant associations with low salinity tolerance trait (p < 0.01), among which, 21 markers with p value lower than 0.001 (Supplementary Table S2). Further analysis found that 50 of these markers were located on the linkage map, distributed on thirteen linkage groups (Supplementary Table S3) (Figure 2).

Figure 2 Association analysis of low salinity tolerance trait in P. trituberculatus.
Validation of Salinity Markers
To validate salinity markers, ten salinity markers (p < 0.001) with sufficient flanking regions sequenced were selected to sequence the PCR products of the parents of the QTL mapping populations (including four markers within the QTL interval). Finally, five of them could be sequenced with good quality (Supplementary Table S4), which were further genotyped in the QTL mapping population via PCR product sequencing. Chi-square test results showed that all five markers were significantly associated with low salinity tolerance traits (Supplementary Table S5). Subsequently, the five markers were validated in differentiated populations of low salinity tolerance traits, and found that one of the markers (marker8,426, p = 0.015) was significantly associated with low salinity tolerance trait at the population level (Table 2).
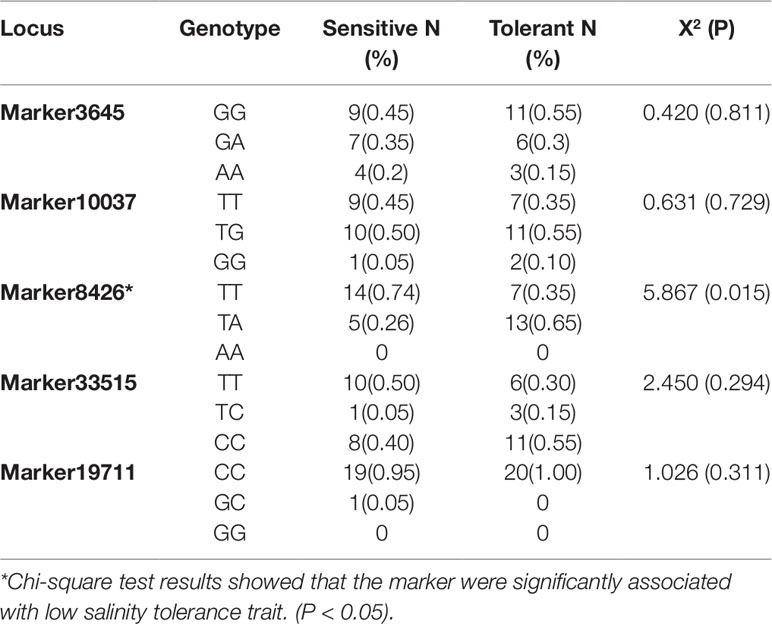
Table 2 Validation of salinity markers in population.
Candidate Genes of Low Salinity Tolerance Trait
To detect the low salt tolerance-related genes, we compared 95 salinity markers sequences with all available genomic scaffolds via BLAT tool. The result showed that all markers could be aligned to genomic scaffolds, of which 25 markers were located in 23 annotated scaffolds. Further analysis found that there were 79 known genes in these scaffolds, including ammonium transport, aldehyde dehydrogenase (ALDH), glucosyltransferase (GT), etc. (Supplementary Table S6). The four markers located in the QTL interval anchored three scaffolds (scaffold1186, scaffold1442665 and scaffold1984813). A total of nine genes were identified from the scaffold1186 based on the annotation information, which contained two known genes, ammonium transporter and DNA mismatch repair protein (Supplementary Table S7).
Discussion
Selection of low salinity tolerant P. trituberculatus is particularly important for aquaculture production. Thus, mapping QTLs and identifying markers linked to salinity tolerance are the first steps for improving stress tolerance in P. trituberculatus through MAS techniques. QTL mapping in P. trituberculatus has been performed for many traits that are economically important, including growth and sex, however, QTL mapping had not been reported for salinity tolerance yet.
Based on a high-density genetic linkage map (Lv et al., 2017), two QTLs of low salinity tolerance were mapped on LG17 (2.6–5.2 cM). Two markers within this QTL interval (Marker8,426 and Marker19,711) were screened again via association analysis and verified by further sequencing and genotyping in the QTL mapping population, which was helpful to confirm the accuracy of the QTL mapping in this work. We noticed that the two QTLs were close together, and the markers between the two QTLs (Marker10,037 and Marker3,645) were also verified to be associated with salt tolerance traits in the QTL mapping population. However, since the LOD value between the two QTLs is less than the threshold value, we still believe that the two QTLs cannot be merged into a single QTL in this study, which should be further validated using multiple families. To our knowledge, this is the first time that QTL analysis for low salinity tolerance has been performed on a high-density linkage map in crustaceans.
Compared with our previous work of growth QTL mapping (Lv et al., 2017), low salinity tolerance had fewer QTLs (12 vs. 2) and a lower PVE value (35.9 vs. 14.8%), which may be related to its lower heritability (0.53 vs. 0.18) (Baoquan et al., 2010; Zheng et al., 2015). In addition, salt tolerance are complex quantitative traits regulated by many genes (Jiang et al., 2019), its regulation mechanism may consist of multiple complex pathways when compared to growth traits. Previous research showed that 615 genes showed significant differential expression (DEG) during salinity stress, which were involved in many crucial processes including ion transport, amino acid metabolism and synthesis, proteolysis and chitin metabolic (Lv et al., 2013). The number of DEGs after low salinity stress (615) was significantly higher than what was found for the comparative transcriptome of different growth traits (117) (Lv et al., 2014). The results of association analysis in this work also support this hypothesis. A total of 95 salt-related markers were found on thirteen linkage groups, which suggests that salinity tolerance is a complex trait regulated by many genes distributed on different chromosomes. Because of the complex regulation mechanism of low salt tolerance, it is more difficult to accurately estimate the individual trait of salt tolerance, which may be another reason why there are fewer QTLs. This result also reminds us it would be more difficult to use MAS for genetic improvement for low salinity tolerance traits, and genome-wide selective breeding based on fine genome information may be a solution to the problem. However, the results of this study was based on the data from only one full sib family, and more families or populations should be investigated to facilitate a more complete mapping of salt tolerant QTLs in the future.
The combination of QTL mapping and association analysis can increase the range and accuracy of discovering association markers. In this work, the salinity markers found by QTL mapping and association analysis were partially overlapping, and mutual verification indicated the accuracy of the results. To further confirm the association between salinity markers and resistance to low salinity, ten salinity markers (p < 0.001, including four overlapping markers), with sufficient flanking regions, were selected to validate across populations. Markers that could be successfully sequenced were all significantly associated with salt tolerance traits at the family level, among them marker 8,426 was significantly associated with low salinity tolerance trait at the population level (p = 0.015). In addition, we found that individuals with heterozygous genotype of marker 8,426 had better salinity tolerance than those with homozygous genotypes, and we will try to apply it in MAS for crabs.
We tried to blast these markers to the released genome data (Kim, 2019), and 79 genes were identified as candidate genes of low salinity tolerance. Previous studies on salinity tolerance of crustaceans mainly focused on osmoregulation in gill epithelial cells (McNamara and Faria, 2012; Romano and Zeng, 2012). A few genes related to ion transport in crustacean gills have been cloned (e.g., Na+/K+-ATPase, V-type H+-ATPase and Na+/K+/2Cl(−) cotransporter, etc.); however, our study found that such ion transport genes were not associated with low salinity tolerance. One possible reason is that these genes are not variable in this population. Another possibility is that ion transport-related genes play an important role in osmoregulation or salinity adaptation, but may not be key genes for salt tolerance traits.
Our previous results show amino acid content and concentration variation in muscle and hemolymph of Portunus trituberculatus at different salinities (Ping et al., 2017). Ammonium transport is a key process in amino acid metabolism (Song et al., 2011). Amino acid catabolism leads to the production of ammonium (NH4), which needs to be detoxified by ammonium transport (Cruz-Bustos et al., 2018). In this work, the ammonium transport gene was identified in the QTL interval via alignment of the salinity markers to the released genome database (https://figshare.com/projects/De_novo_draft_genome_of_Portunus_trituberculatus_and_its_Hox_gene_cluster/61295), which suggested the detoxify process regulated by ammonium transport was related to the salt tolerance trait.
Two genes, aldehyde dehydrogenase (ALDH) and glucosyltransferase (GT) were found on salinity markers, both of which involved in the process of ascorbate and aldarate metabolism of KEGG (Kyoto Encyclopedia of Genes and Genomes) pathway. ALDH belongs to a gene superfamily of NAD(P)+-dependent enzymes that catalyzes the irreversible oxidation of a wide range of endogenous and exogenous aromatic and aliphatic aldehydes (Chen et al., 2014). ALDH has been systematically investigated in several plant species, including Arabidopsis and tobacco (Li et al., 2003; Sunkar et al., 2003). Recent studies suggest that ALDH can provide protection from salinity stress by generating osmoprotectants, such as glycine betaine (Zarei et al., 2018). GT is important in the endoplasmic reticulum for protein quality control, which plays an important role in plant vegetative development, and impairs the response to several forms of abiotic and biotic stress (Ritter and Helenius, 2000). GT mutant plants are more sensitive than wild type plants when grown under salinity stress, exhibiting a significant decrease in fresh weight (Blanco-Herrera et al., 2015). However, few studies have focused on these genes in studies of animal salinity tolerance, and will be the focus of our future research.
Conclusions
The swimming crab is an important marine species for fisheries and aquaculture. To elucidate the potential genetic mechanisms underlying economic traits, related genes were explored by comparative transcriptome and QTLs of important economic traits (including growth and sex determination) were mapped. However, there are no reports on QTL analyses for low salinity tolerance of this crab. In this work, based on a high-density linkage map, QTLs of low salinity tolerance in P. trituberculatus were mapped on LG17 for the first time. Five low salinity-related markers were found at the family level, including one marker which was closely related to low salinity tolerance at the population level. Low salinity-related genes, including ammonium transport, aldehyde dehydrogenase, and glucosyltransferase were identified. Our results are helpful in elucidating the mechanism of low salinity tolerance, and may help accelerate MAS in crabs.
Data Availability Statement
The raw data supporting the conclusions of this manuscript will be made available by the authors, without undue reservation, to any qualified researcher.
Ethics Statement
This study was carried out in accordance with the recommendations of ‘the Yellow Sea Fisheries Research Institute’. The protocol was approved by ‘the Yellow Sea Fisheries Research Institute’. The crabs used in the present study were marine-cultured animals, and all of the experiments were conducted according to the regulations of the local and central government. Prior to the sampling, all crabs will be treated with cold shock method to minimize suffering.
Author Contributions
JLi and PL conceived and supervised the project. JLv and DS supplied the experimental animals. JLv contributed to the QTL mapping and association analysis. DY and XT contributed to the validation of salinity markers. JLv wrote the manuscript. All authors read and approved the final manuscript.
Funding
This research was supported by the National Key R&D Program of China (2018YFD0900303-03), National Natural Science Foundation of China (41776160 and 41576147), Shandong Province Key Development Program for Research (2018GSF121030), Qingdao Applied Basic Research Project (17-1-1-95-jch), Efficient Eco Agriculture Innovation Project of Taishan Leading Talent Project (No. LJNY2015002), and Special Scientific Research Funds for Central Non-profit Institutes, Yellow Sea Fisheries Research Institute (Project 20603022018027).
Conflict of Interest
The authors declare that the research was conducted in the absence of any commercial or financial relationships that could be construed as a potential conflict of interest.
Supplementary Material
The Supplementary Material for this article can be found online at: https://www.frontiersin.org/articles/10.3389/fgene.2019.01193/full#supplementary-material
References
Andriantahina, F., Liu, X., Huang, H. (2013). Genetic map construction and quantitative trait locus (QTL) detection of growth-related traits in Litopenaeus vannamei for selective breeding applications. PLoS One 8, 1–11. doi: 10.1371/journal.pone.0075206
Baoquan, G., Ping, L., Jian, L. I., Lei, L., Fangyu, D., Xuezhong, W. (2010). Heritability of body weight in Portunus trituberculatus. Oceanol. Limnol. 41, 322–326. doi: 10.3724/SP.J.1238.2010.00512
Baranski, M., Gopikrishna, G., Robinson, N. A., Katneni, V. K., Shekhar, M. S., Shanmugakarthik, J., et al. (2014). The Development of a High Density Linkage Map for Black Tiger Shrimp (Penaeus monodon) Based on cSNPs. PLoS One 9, 1–13. doi: 10.1371/journal.pone.0085413
Blanco-Herrera, F., Moreno, A. A., Tapia, R., Reyes, F., Araya, M., D’alessio, C., et al. (2015). The UDP-glucose: Glycoprotein Glucosyltransferase (UGGT), a key enzyme in ER quality control, plays a significant role in plant growth as well as biotic and abiotic stress in Arabidopsis thaliana. BMC Plant Biol. 15, 1–12. doi: 10.1186/s12870-015-0525-2
Chen, M. H., Yang, Q. (2010). GWAF: an R package for genome-wide association analyses with family data. Bioinformatics 26, 580. doi: 10.1093/bioinformatics/btp710
Chen, Z., Chen, M., Xu, Z.-S., Li, L.-C., Chen, X.-P., Ma, Y.-Z. (2014). Characteristics and expression patterns of the Aldehyde Dehydrogenase (ALDH) gene superfamily of foxtail millet (Setaria italica L.). PLoS One 9, 1–13. doi: 10.1371/journal.pone.0101136
Chen, C., Xia, R., Chen, H., He, Y. (2018). TBtools, a Toolkit for Biologists integrating various HTS-data handling tools with a user-friendly interface. bioRxiv, 289660. doi: 10.1101/289660
Cruz-Bustos, T., Potapenko, E., Storey, M., Docampo, R. (2018). An intracellular ammonium transporter is necessary for replication, differentiation, and resistance to starvation and osmotic stress in trypanosoma cruzi. Msphere 3, e00377–e00317. doi: 10.1128/mSphere.00377-17
Cui, Z., Hui, M., Liu, Y., Song, C., Li, X., Li, Y., et al. (2015). High-density linkage mapping aided by transcriptomics documents ZW sex determination system in the Chinese mitten crab Eriocheir sinensis. Heredity 115 , 1–10. doi: 10.1038/hdy.2015.26
Freire, C. A., Onken, H., McNamara, J. C. (2008). A structure-function analysis of ion transport in crustacean gills and excretory organs. Comp. Biochem. Physiol. Mol. Integr. Physiol. 151, 272–304. doi: 10.1016/j.cbpa.2007.05.008
Garcon, D. P., Lucena, M. N., Franca, J. L., McNamara, J. C., Fontes, C. F. L., Leone, F. A. (2011). Na+,K+-ATPase activity in the posterior gills of the blue crab, Callinectes ornatus (Decapoda, Brachyura): modulation of ATP hydrolysis by the biogenic amines spermidine and spermine. J. Membr. Biol. 244, 9–20. doi: 10.1007/s00232-011-9391-5
Jiang, D. L., Gu, X. H., Li, B. J., Zhu, Z. X., Qin, H., Meng, Z. N., et al. (2019). Identifying a Long QTL Cluster Across chrLG18 Associated with Salt Tolerance in Tilapia Using GWAS and QTL-seq. Mar. Biotechnol. 21, 250–261. doi: 10.1007/s10126-019-09877-y
Jiao, W., Fu, X., Dou, J., Li, H., Su, H., Mao, J., et al. (2014). High-resolution linkage and quantitative trait locus mapping aided by genome survey sequencing: building up an integrative genomic framework for a bivalve mollusc. DNA Res. 21, 85–101. doi: 10.1093/dnares/dst043
Li, Q. L., Gao, X. R., Yu, X. H., Wang, X. Z., Jiaan, L. J. (2003). Molecular cloning and characterization of betaine aldehyde dehydrogenase gene from Suaeda liaotungensis and its use in improved tolerance to salinity in transgenic tobacco. Biotechnol. Lett. 25, 1431–1436. doi: 10.1023/a:1025003628446
Li, J., Liu, P., Gao, B., Chen, P. (2013). The new variety of Portunus trituberculatus “Huangxuan No. 1”. Prog. Fish. Sci. 34, 51–57. doi: 1000-7075(2013)05-0051-07
Lv, J., Liu, P., Wang, Y., Gao, B., Chen, P., Li, J. (2013). Transcriptome analysis of Portunus trituberculatus in response to salinity stress provides insights into the molecular basis of osmoregulation. PLoS One 8, e82155. doi: 10.1371/journal.pone.0082155
Lv, J., Liu, P., Gao, B., Wang, Y., Wang, Z., Chen, P., et al. (2014). Transcriptome analysis of the Portunus trituberculatus: de novo assembly, growth-related gene identification and marker discovery. PLoS One 9, e94055. doi: 10.1371/journal.pone.0094055
Lv, J., Liu, P., Gao, B., Li, J. (2015). The identification and characteristics of salinity-related microRNAs in gills of Portunus trituberculatus. Cell Stress Chaperones 21, 63–74. doi: 10.1007/s12192-015-0641-9
Lv, J., Zhang, D., Liu, P., Li, J. (2016). Effects of salinity acclimation and eyestalk ablation on Na +, K +, 2Cl – cotransporter gene expression in the gill of Portunus trituberculatus: a molecular correlate for salt-tolerant trait. Cell Stress Chaperones 21, 829–836. doi: 10.1007/s12192-016-0707-3
Lv, J., Gao, B., Liu, P., Li, J., Meng, X. (2017). Linkage mapping aided by de novo genome and transcriptome assembly in Portunus trituberculatus: applications in growth-related QTL and gene identification. Sci. Rep. 7, 7874. doi: 10.1038/s41598-017-08256-8
Lv, J., Sun, D., Huan, P., Song, L., Liu, P., Li, J. (2018). QTL mapping and marker identification for sex-determining: indicating xy sex determination system in the swimming crab (Portunus trituberculatus). Front. Genet. 9, 1–9. doi: 10.3389/fgene.2018.00337
Martinez, V., Guimarães, E., Ruane, J., Scherf, B., Sonnino, A., Dargie, J. (2007). Marker-assisted selection in fish and shellfish breeding schemes. Marker-Assisted Selection-Current Status and Future Perspectives in Crops, Livestock, Forestry and Fish 17, 329–362. doi: 978-92-5-105717-9
McNamara, J. C., Faria, S. C. (2012). Evolution of osmoregulatory patterns and gill ion transport mechanisms in the decapod Crustacea: a review. J. Comp. Physiol. B-Biochem. Syst. Environ. Physiol. 182, 997–1014. doi: 10.1007/s00360-012-0665-8
Ooijen, J. W. V., Boer, M. P., Jansen, R. C., Maliepaard, C. (2000). MapQTL 4.0: Software for the calculation of QTL positions on genetic maps (user manual). Order J. Theor. Ordered Sets Appl. 501, 2412–2421. doi: 10.1139/e87-227
Ooijen, J. W. V. (1992). Accuracy of mapping quantitative trait loci in autogamous species. Theor. Appl. Genet. 84, 803–811. doi: 10.1007/bf00227388
Ping, F., Jianjian, L., Ping, L., Jian, L., Baoquan, G. (2017). Effects of different salinity level on free amino acid composition in muscle and hemolymph of the swimming crab Portunus trituberculatus. J. Fish. China 41, 374–381. doi: 10.11964/jfc.20160210281
Poompuang, S., Hallerman, E. M. (1997). Toward detection of quantitative trait loci and marker-assisted selection in fish. Rev. Fish. Sci. 5, 253–277. doi: 10.1080/10641269709388600
Ren, Q., Pan, L. (2014). Digital gene expression analysis in the gills of the swimming crab (Portunus trituberculatus) exposed to elevated ambient ammonia-N. Aquaculture 434, 108–114. doi: 10.1016/j.aquaculture.2014.08.008
Ritter, C., Helenius, A. (2000). Recognition of local glycoprotein misfolding by the ER folding sensor UDP-glucose:glycoprotein glucosyltransferase. Nat. Struct. Biol. 7, 278. doi: 10.1038/74035
Romano, N., Zeng, C. S. (2012). Osmoregulation in decapod crustaceans: implications to aquaculture productivity, methods for potential improvement and interactions with elevated ammonia exposure. Aquaculture 334, 12–23. doi: 10.1016/j.aquaculture.2011.12.035
Shao, C., Niu, Y., Rastas, P., Liu, Y., Xie, Z., Li, H., et al. (2015). Genome-wide SNP identification for the construction of a high-resolution genetic map of Japanese flounder (Paralichthys olivaceus): applications to QTL mapping of Vibrio anguillarum disease resistance and comparative genomic analysis. DNA Res. 22, 161–170. doi: 10.1093/dnares/dsv001
Song, T., Gao, Q., Xu, Z., Song, R. (2011). The cloning and characterization of two ammonium transporters in the salt-resistant green alga, Dunaliella viridis. Mol. Biol. Rep. 38, 4797–4804. doi: 10.1007/s11033-010-0621-1
Sunkar, R., Bartels, D., Kirch, H. H. (2003). Overexpression of a stress-inducible aldehyde dehydrogenase gene from Arabidopsis thaliana in transgenic plants improves stress tolerance. Plant J. 35, 452–464. doi: 10.1046/j.1365-313X.2003.01819.x
Tsai, J.-R., Lin, H.-C. (2007). V-type H+-ATPase and Na+,K+-ATPase in the gills of 13 euryhaline crabs during salinity acclimation. J. Exp. Biol. 210, 620–627. doi: 10.1242/jeb.02684
Wei, Q., Wang, Y., Qin, X., Zhang, Y., Zhang, Z., Wang, J., et al. (2014). An SNP-based saturated genetic map and QTL analysis of fruit-related traits in cucumber using specific-length amplified fragment (SLAF) sequencing. BMC Genomics 15, 1–10. doi: 10.1186/1471-2164-15-1158
Xu, Q. H., Liu, Y. (2011). Gene expression profiles of the swimming crab Portunus trituberculatus exposed to salinity stress. Mar. Biol. 158, 2161–2172. doi: 10.1007/s00227-011-1721-8
Yu, Y., Zhang, X., Yuan, J., Li, F., Chen, X., Zhao, Y., et al. (2015). Genome survey and high-density genetic map construction provide genomic and genetic resources for the Pacific White Shrimp Litopenaeus vannamei. Sci. Rep. 5, 1–14. doi: 10.1038/srep15612
Zarei, A., Trobacher, C. P., Shelp, B. J. (2018). Arabidopsis aldehyde dehydrogenase 10 family members confer salt tolerance through putrescine-derived 4-aminobutyrate (GABA) production (vol 6, 35115, 2016). Sci. Rep. 8, 1–11. doi: 10.1038/srep46967
Keywords: quantitative trait loci, low salinity tolerance, Portunus trituberculatus, association analysis, salinity marker
Citation: Lv J, Sun D, Yan D, Ti X, Liu P and Li J (2019) Quantitative Trait Loci Mapping and Marker Identification for Low Salinity Tolerance Trait in the Swimming Crab (Portunus trituberculatus). Front. Genet. 10:1193. doi: 10.3389/fgene.2019.01193
Received: 06 May 2019; Accepted: 28 October 2019;
Published: 20 November 2019.
Edited by:
James J. Cai, Texas A&M University, United StatesReviewed by:
Mahendar Thudi, International Crops Research Institute for the Semi-Arid Tropics (ICRISAT), IndiaReinaldo A. De Brito, Federal University of São Carlos, Brazil
Copyright © 2019 Lv, Sun, Yan, Ti, Liu and Li. This is an open-access article distributed under the terms of the Creative Commons Attribution License (CC BY). The use, distribution or reproduction in other forums is permitted, provided the original author(s) and the copyright owner(s) are credited and that the original publication in this journal is cited, in accordance with accepted academic practice. No use, distribution or reproduction is permitted which does not comply with these terms.
*Correspondence: Jian Li, bGlqaWFuQHlzZnJpLmFjLmNu; bHZqakB5c2ZyaS5hYy5jbg==