 Kevin Maebe
 Reet Karise
 Ivan Meeus
 Marika Mänd
 Guy Smagghe
- 1Department of Plants and Crops, Faculty of Bioscience Engineering, Ghent University, Ghent, Belgium
- 2Institute of Agricultural and Environmental Sciences, University of Life Sciences, Tartu, Estonia
Bumblebee species with declining population trends tend to show lower genetic diversity levels than stable species. The observed difference might be explained by abundance differences, with declining bumblebee species having lower genetic diversity levels simply due to their lower local species abundances. However, whether this holds true is not known. Here, we investigated whether bumblebee local abundances determines population genetic diversity levels. Therefore, local species abundances were measured for bumblebee species at four locations in Belgium and two locations in Estonia during bumblebee foraging years 2013–2017. These locations and countries were chosen to ensure the greatest possible variance in both local abundances and population trends for these species. Hence, genetic diversity levels were obtained for seven species by genotyping collected specimens with 16 microsatellites. Our results showed that the observed patterns in genetic diversity did not depend on local species abundance. So, although declining bumblebee species can become locally abundant, they will still show lower genetic diversity levels than stable species. This result implies that measuring bumblebees’ local abundance cannot be used to directly determine the health status of a population. Furthermore, this result has also major impact on future conservation strategies as increasing the genetic diversity levels of declining species will be very difficult, and habitat quality should be high to maintain their populations, otherwise these species are doomed to disappear first.
Introduction
An essential factor for species survival is the level of genetic diversity present within its populations. Species which have a low level of intraspecific genetic diversity will have more limited potential to adapt to current and future changes in the environment (Frankham, 2005; Zayed, 2009; Habel et al., 2014; Koch et al., 2017). Small populations are more likely to have lower genetic diversity levels than large populations due to the impact of genetic drift, the random loss of genetic diversity over time (Reed and Frankham, 2003; Frankham, 2005; Zayed, 2009). However, high levels of gene flow and improved dispersal capacities can compensate for loss of allelic richness due to drift. In smaller less-connected populations, gene flow may be more limited, decreasing its buffering effect, which leads to lower genetic diversity and increase brother–sister mating chances, and in turn to inbreeding and inbreeding depression (Frankham, 2005; Zayed, 2009; Habel et al., 2014). The latter dynamics can further diminish genetic variability within small populations, potentially creating a vicious circle, known as the extinction vortex, which could ultimately lead to extinction (Frankham, 2005; Zayed, 2009; Habel et al., 2014).
Bumblebees are eusocial insects, living in large colonies mostly founded by one queen and many workers (Alford, 1975; Goulson, 2010). In most bumble bee species, queens are monoandrous with their offspring being fullsibs, having 75% or more genetic similarity between them (Estoup et al., 1995; Schmid-Hempel and Schmid-Hempel, 2000; Goulson, 2010). The high relatedness of sisters can be explained by bumblebees’ haplodiploid sex-determination system in which unfertilized eggs, being hemizygous at the single sex-determining locus, will develop in haploid males or drones, and at which fertilized eggs will develop in diploid female offspring (workers and daughter queens) when being heterozygous at the sex locus. However, fertilized eggs can also develop into diploid males if being homozygous (Duchateau et al., 1994; Cook and Crozier, 1995; Whitehorn et al., 2009). The probability of such matched-pair matings at the sex locus is normally low due to the rather high number of alleles at this loci (46 alleles in B. terrestris; Duchateau et al., 1994). However, the presence of diploid drones will cause negative effects on population growth and survival, particularly in populations with low variation at the sex locus, which are typically small and/or inbred populations (Cook and Crozier, 1995; Duchateau and Marien, 1995; Gerloff and Schmid-Hempel, 2005; Whitehorn et al., 2009).
Multiple studies have shown that bumblebee species with declining population trends tend to have lower genetic diversity levels compared with stable bumblebee species (Darvill et al., 2006; Ellis et al., 2006; Goulson et al., 2008; Charman et al., 2010; Cameron et al., 2011). This observation has been often explained as a reduction of genetic diversity over time (Goulson et al., 2008; Charman et al., 2010) due to the impact of one or multiple possible drivers of bee decline, e.g. agricultural intensification, new pathogens, and climate changes, lowering population sizes (Potts et al., 2010; Meeus et al., 2011; Vanbergen et al., 2013; Rasmont et al., 2015). However, studies using historical populations found a similar difference in genetic variation between declining and stable bumblebee species (Lozier and Cameron, 2009; Lozier et al., 2011; Maebe et al., 2015; Maebe et al., 2016), detecting no major drop in genetic diversity over one century in Belgium, possibly due to dispersal countering drift effects (Maebe et al., 2016). The latter result indicates that, at least for Belgian populations, species abundance, and genetic diversity are not linked. This is in conflict with the rather general theory, that when a certain species is locally abundant, its large population should have a higher amount of genetic variation than observed at a location where this species is less abundantly present (Reed and Frankham, 2003; Frankham, 2005; Zayed, 2009). However, for social insects, such as bumblebees, this might thus not be always true.
Here, we investigated if species abundance determines genetic diversity levels in eusocial bumblebee species, and this on both local and larger scale. Hence, we searched whether genetic diversity is linked with species IUCN status (or European pattern of occurrence), and compared this with local abundance measures. Therefore, specimens of seven bumblebee species (B. ruderarius, B. soroeensis, B. sylvarum, B. hortorum, B. hypnorum, B. lapidarius, and B. pascuorum) were collected from two countries: Belgium and Estonia. Three species have restricted distribution and declining population trends in Belgium (B. ruderarius, B. soroeensis, and B. sylvarum), while the remaining four species have a more widespread distribution and showed fairly stable population trends (B. hortorum, B. hypnorum, B. lapidarius, and B. pascuorum) (division based on Maebe et al., 2016 and refs herein). Although the latter bumblebee species are also dominantly present in Estonia, these species occur in different abundances, while the "declining" species are more abundantly present and even showing increasing population trends (Table 1). Bumblebee workers were collected from six locations, four in Belgium (Francorchamps, Moorsel, Torgny, and Trivières) and two in Estonia (Harjumaa and Põlvamaa) during bumblebee foraging years from 2013 to 2017. For each species, genetic diversity was estimated from each sampling location using 16 microsatellite markers. Furthermore, species local abundance was determined as its relative abundance (= its present abundance compared to the total species abundance presented at that location). This approach allowed us to investigate the link between bumblebee local abundance and genetic diversity.
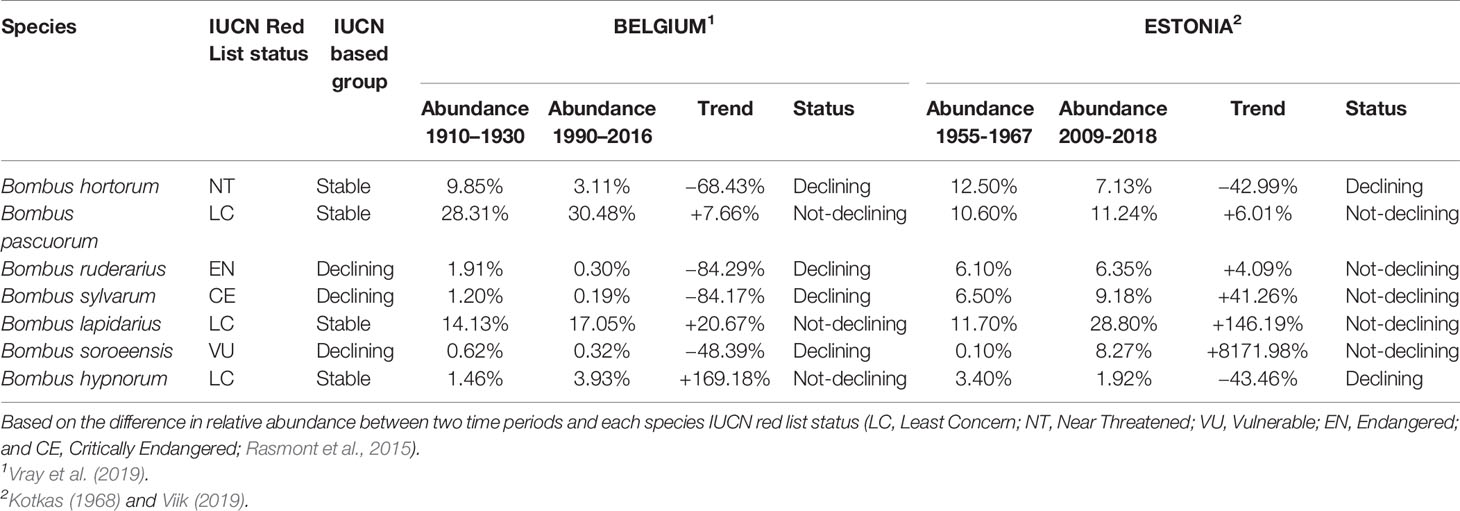
Table 1 Species population trends for Estonian and Belgian bumblebees.
Material and Methods
Sampling and Proportional Abundance Measurement
A sampling effort for specimens from seven bumblebee species (B. hortorum, B. hypnorum, B. pascuorum, B. ruderarius, B. soroeensis, B. sylvarum, and B. hypnorum) was performed at four sampling locations in Belgium and two in Estonia during bumblebee foraging seasons from 2013 to 2017. Selected sampling locations within both countries were around 56–210 km apart, while the distance between both countries ranged 1,650 km (Figure 1). Specimens were collected from each location for three species, B. hortorum, B. hypnorum, and B. pascuorum. Unfortunately, the other species were only present at three out of seven sampling locations (one Estonian and two Belgian locations for B. hypnorum, one Belgian and two Estonian locations for B. ruderarius, B. soroeensis, and B. sylvarum; Table 2).
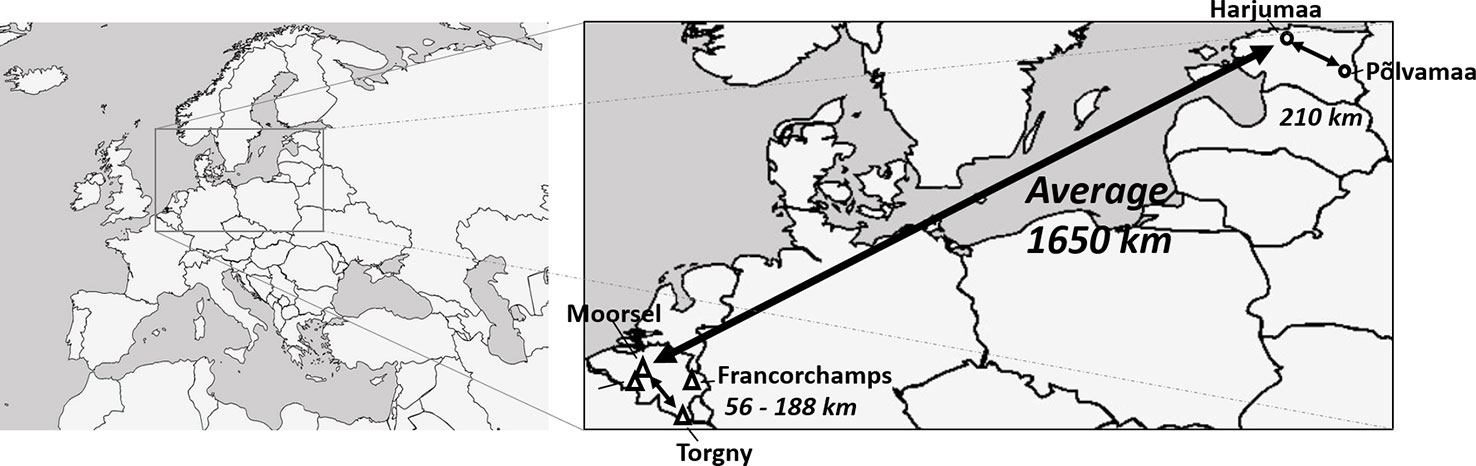
Figure 1 Map of sampling locations in Belgium and Estonia (adapted Figure from Maebe et al. 2019 under Creative Commons Attribution 4.0 International License; https://creativecommons.org/licenses/by/4.0/).
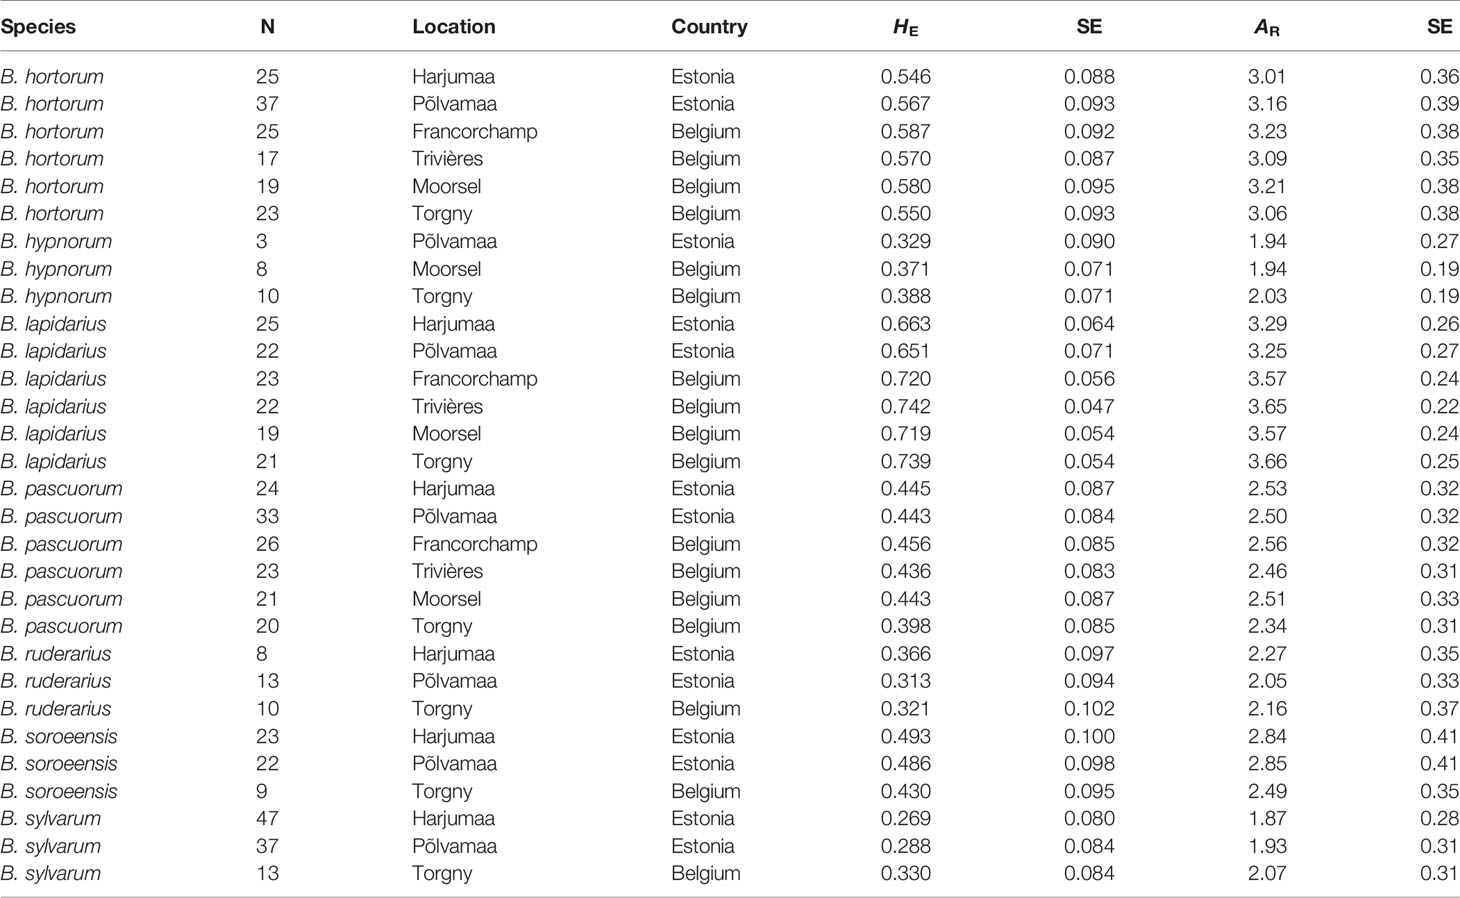
Table 2 Estimated mean HE and AR (± SE) in Belgian and Estonian bumblebee populations.
392 bumblebee specimens were collected from the four selected Belgian locations: Francorchamps, Moorsel, Torgny, and Trivières, and were already genotyped at 16 microsatellite loci within a previous study (Maebe et al., 2016; Table 2). These specimens were part of an intensive sampling performed within a national bumblebee project (Belbees) during 3 days in the bumblebee foraging season of 2013 and 5 days in 2015. At pollinator-suitable weather conditions, all encountered bumblebees were sampled during straight ahead transect walks using a net. Species abundances were calculated as the proportion of a species abundance versus the total bumblebee abundance collected at that particular location (Table 3).
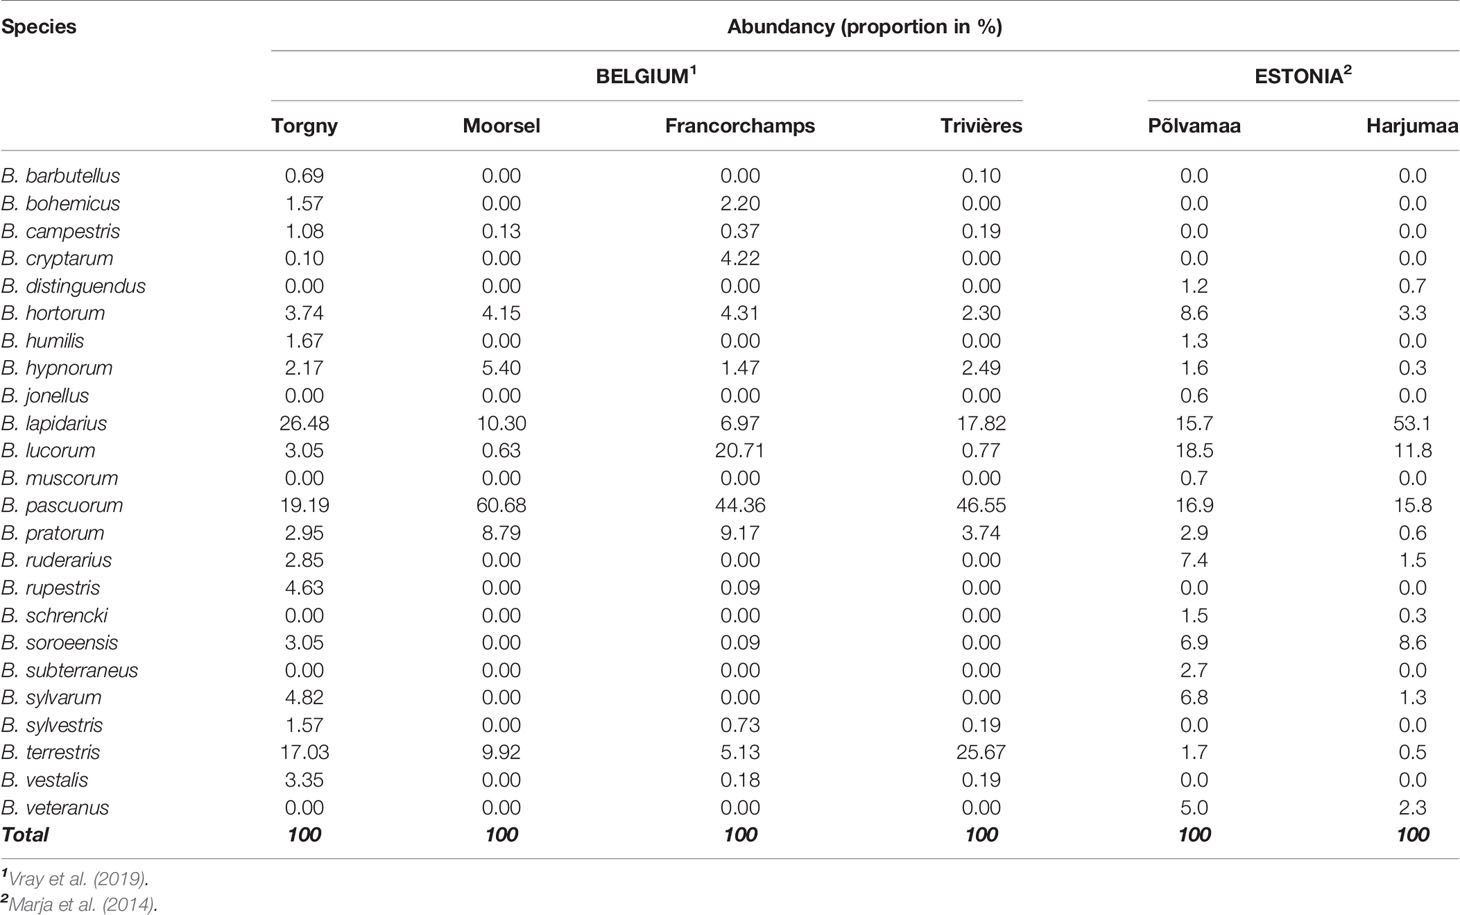
Table 3 Bumblebee relative abundances in Belgium and Estonia locations.
In Estonia, Harjumaa and Põlvamaa were selected as sampling locations (Table 2). Sampling was performed during the bumblebee foraging seasons of 2015 and 2017. Individual specimens were collected with small glass jars from a flower, killed with chloroform, and stored in a −20°C freezer. The Estonian bumblebee abundance data were derived from Marja et al. (2014), from which the North and South Estonia abundances were used as estimates for Harjumaa and Põlvamaa, respectively. Here, per species local abundances were also calculated (Table 3).
DNA Extraction and Microsatellite Protocol
DNA extraction and analysis were performed only on the Estonian specimens, with the same method as was done in a previous study for the Belgian specimens (see Maebe et al., 2016). One middle leg of an individual bumblebee worker was used for DNA extraction using a Chelex DNA extraction protocol (see methods described in Maebe et al., 2015). Specimens were genotyped with 16 microsatellite (MS) loci which gave reliable signals in previous research using different bumblebee species (Supplementary Table 1; Maebe et al., 2015; Maebe et al., 2016; Maebe et al., 2018). MS were amplified using the Type-it QIAGEN PCR kit using four multiplex mixes as described in Maebe et al. (2016). The PCR protocol, capillary electrophoreses, and fragment scoring were performed with the method as described in Maebe et al. (2013).
Linkage Disequilibrium, Hardy–Weinberg Equilibrium, and Sister Detection
Linkage disequilibrium, Hardy–Weinberg equilibrium (HW) deviations, and the presence of null alleles were tested for all populations by using Fstat 2.9.3 (Goudet, 2001), GenAlEx v6.5 (Peakall and Smouse, 2006), and Microchecker (Van Oosterhout, 2004), respectively. All specimens which could not be scored in a reliable manner for 10 or more loci were removed. Furthermore, after detection of full-siblings with Colony 2.0 (Wang, 2004) employing corrections for genotyping errors (5% per locus) and by the two allele algorithm and consensus method implemented in Kinalyzer (Ashley et al., 2009), we retained only one sister per colony (see also Maebe et al., 2015).
Genetic Diversity
GenAlEx v6.5 (Peakall and Smouse, 2006) was used to estimate Nei’s unbiased expected heterozygosity (HE) and observed heterozygosity (HO) (Nei, 1978) per population and for all species. With Hp-Rare 1.1 (Kalinowski, 2015) we estimated sample size-corrected private allelic richness (AR) normalized to 10 gene copies.
Impact of Local Abundance on Level of Genetic Diversity
To be able to detect if species abundance influences the observed differences in species genetic diversity, Linear Mixed Models (LMMs) were performed for each species and both genetic diversity parameters (AR and HE) in RStudio (R Development Core Team, 2008) with R package lme4 version 1.1-10 (Bates et al., 2015) as described in Maebe et al., 2018. In short: species, local abundance, and location were set as fixed factors and microsatellite loci as a random factor. The best model fitting our data was selected based on the Akaike’s Information Criterion (AIC) by using the “dredge” command within the MUMIn package (Barton 2015; Maebe et al., 2016; Maebe et al., 2018). The main effect of the factor of interest was analyzed for each selected LMM by performing Likelihood Ratio Tests (LTR) in which the model with factors was compared with a “null” model without these factors (Maebe et al., 2018). After computing the marginal and conditional coefficient of determination, Tukey HSD post hoc comparisons were performed using the R package multcomp to find differences in genetic diversity due to species local abundance, location and/or species (Hothorn et al., 2008; described in Maebe et al., 2018, and references therein).
Genetic Diversity and IUCN Status
Based on the IUCN bumblebee red list status, bumblebee species were organized in two groups, either “stable” or “declining” species (Table 1). The group of the “stable” species consisted out of four species (B. hortorum, B. hypnorum, B. lapidarius, and B. pascuorum) of which all species had an IUCN status of “Least Concern” (LC), except for B. hortorum which have a “Near Threatened” (NT) status (Rasmont et al., 2015). The three remaining species, B. ruderarius, B. soroeensis, and B. sylvarum, were grouped as “declining” species, as they all have a threatened IUCN status ("Endangered” (EN), “Vulnerable” (VU), and “Critically Endangered” (CE), respectively; Rasmont et al., 2015; Table 1). Secondly, for each country, bumblebee species were divided in two groups based on their population trends, being “declining” or “not-declining” species. Such a population trend was made for each species based on the difference in relative abundance of that species between two time periods: for Belgium between 1910–1930 and 1990–2016 (Vray et al., 2019; Table 3), while for Estonia between 1955–1967 and 2009–2018 (Kotkas, 1968; Viik, 2019; Table 3). Genetic diversity parameters (AR and HE) were compared between the different groups by LMMs in RStudio (R Development Core Team, 2008) with R package lme4 version 1.1-10 (Bates et al., 2015). Here, models were run with microsatellite “loci” as random factor, and “group” as fixed factor. Tukey post hoc tests were performed as described above.
Results
All 16 microsatellites could be amplified and scored reliably in the seven Bombus species. In total, 628 specimens (309 Belgian and 319 Estonian specimens) remained for further genetic analysis out of 729 specimens, due to the removal of full-sibs which were detected by Colony 2.0 and Kinalyzer analyses, and discarding of specimens which have more than five loci of missing data from both Belgian and Estonian dataset. Furthermore, no significant linkage disequilibrium between loci were detected, and Hardy–Weinberg equilibrium tests displayed no or only limited heterozygote deficits.
Correlation Between Local Abundance and Genetic Diversity
Overall for populations and species, allelic richness (AR) ranged from 1.87 to 3.66, with a mean AR of 2.70. Mean HE was 0.488, with individual population values ranging from 0.269 to 0.739 (Table 2). Linear regression showed low and non-significant correlations between local abundance and AR or HE (R2 = 0.0261, p = 0.393; R2 = 0.0419, p = 0.278; respectively; Figure 2) suggesting that only a low amount of variation of genetic diversity is explained by local abundance. By comparing the AIC scores of the different LMM models, the best model explaining the observed patterns of both genetic diversity parameters was not the model with “abundance”, but with “species” as the only fixed factor (Table 4). The importance of the factor “species” for both AR and HE was clearly shown by comparing the models with and without “species” as fixed factor (LRT, χ2 = 154.07, d.f. = 6, p < 0.001; and χ2 = 140.72, d.f. = 6, p < 0.001, respectively). However, addition of abundance as an extra fixed factor had no significant impact on the model, as became clear after comparing the models with both “species” and “abundance” as fixed factors to the models without abundance as additional fixed factor (LRT, AR and HE: χ2 = 0.1307, d.f. = 1 p = 0.718; and χ2 = 0.0598, d.f. = 1, p = 0.807, respectively). Marginal and conditional R2 were similar for both AR and HE, 16.4% and 57.1% versus 15.2% and 55.7%, respectively (Nakagawa and Schielzeth, 2013). Post hoc tests were performed and showed significant differences in genetic diversity levels between the seven bumblebee species (Table 5 and Supplementary Tables 2 and 3).
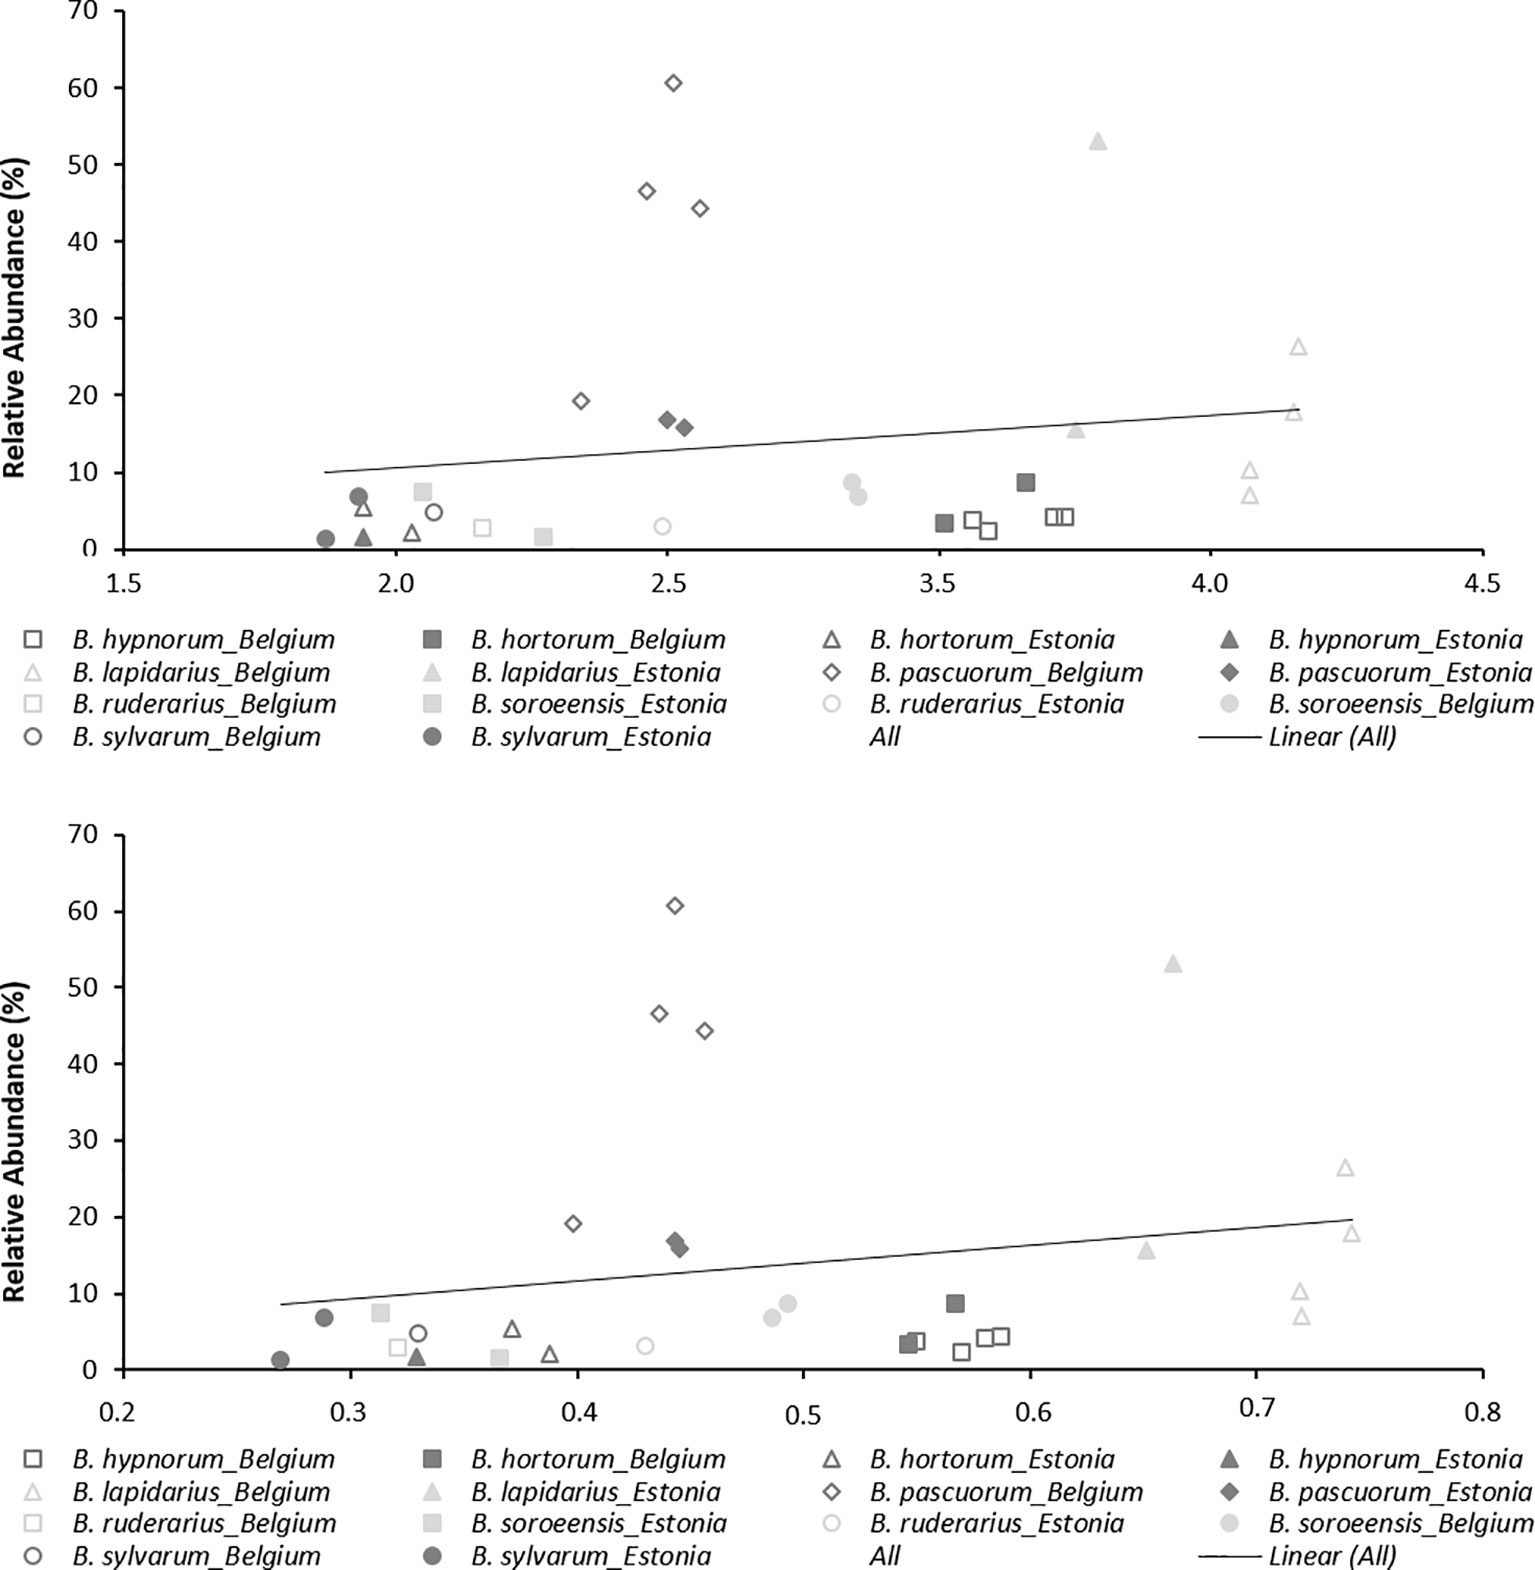
Figure 2 Correlation between relative abundance and genetic diversity parameters (AR and HE).
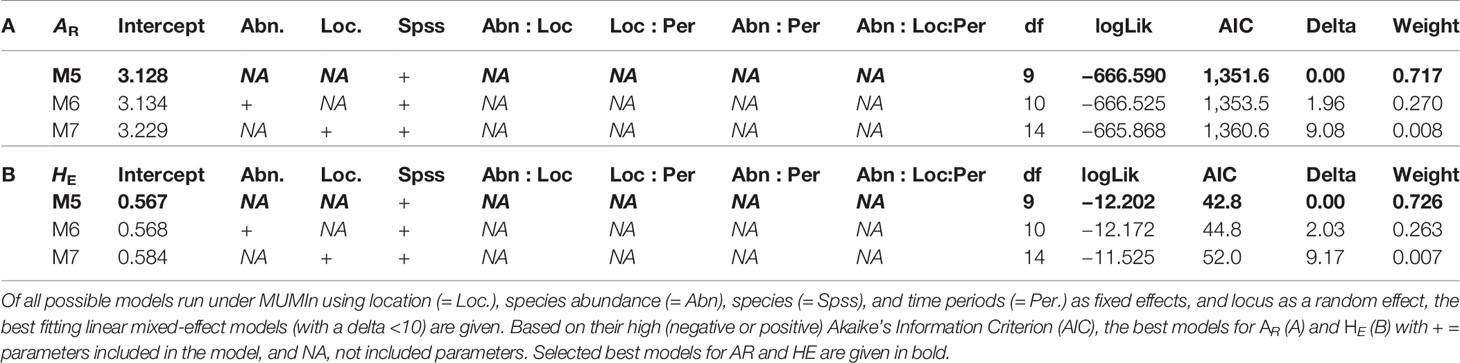
Table 4 Selection of best fitting model explaining the genetic diversity pattern.
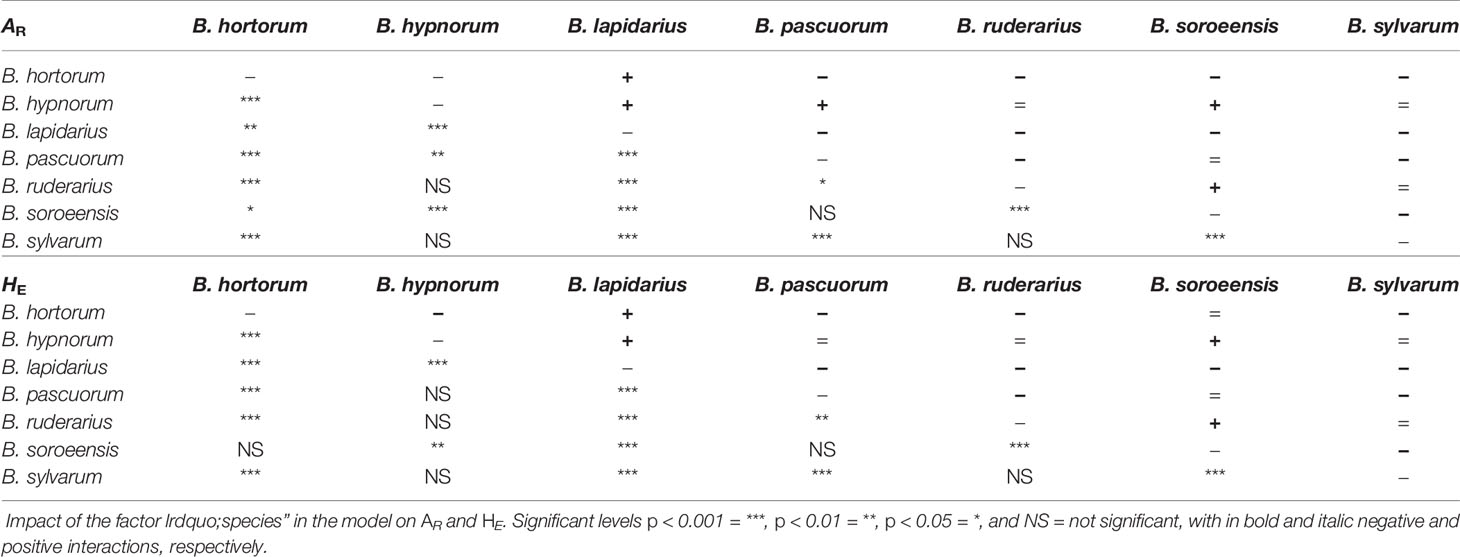
Table 5 Post hoc results of the selected linear mixed models (LMM).
Genetic Diversity Differences Between Species Groups?
Comparing both AR and HE between the two IUCN groups showed a significantly higher genetic diversity level in “stable" bumblebee species compared to the contemporary “declining" species (post hoc tests: AR, t = 5.874, p < 0.001, and HE, t = 6.226, p < 0.001; Table 6). However, genetic diversity was similar when comparing populations with "not-declining" compared with those with "declining" population trends (post hoc tests; AR, t = −0.489, p = 0.625, and HE, t = 0.172, p = 0.864; Table 6).
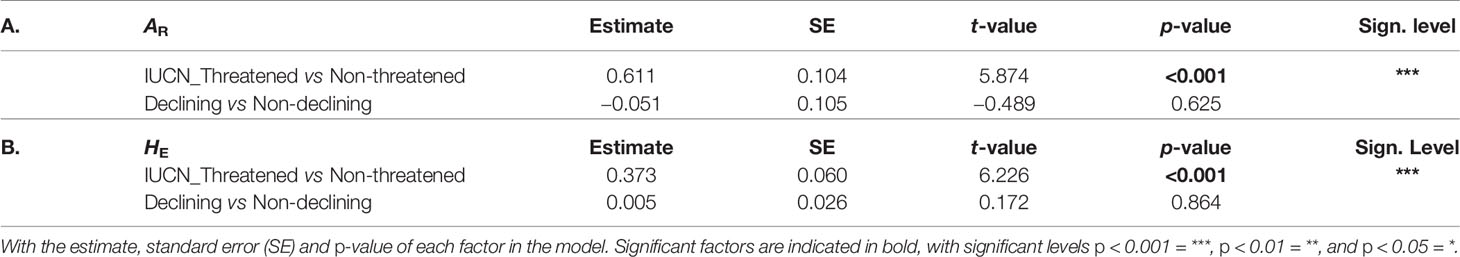
Table 6 Post hoc results of the LMM comparing genetic diversity between species groups LMM’s results for (A) AR and (B) HE.
Discussion
In this study, we investigated whether genetic diversity is determined by species local abundance. By genotyping specimens of seven bumblebee species from Belgium and Estonia with 16 microsatellites, we were able to estimate genetic diversity and to compare this with local species abundance. This approach allowed us to conclude that observed genetic diversity patterns were not significantly dependent on species local abundance. Indeed, the best models explaining genetic diversity patterns did not include local abundance as a factor, and both AR and HE were not significantly correlated with abundance (Figure 2). This is rather unexpected as one might think that when a certain species is locally abundant, this large population should normally have a higher amount of genetic variation than may be observed at a location where this species is less abundantly present. However, this is not always true. Indeed, when the local environment has enough food, resources, and is well suited to harbor a large population of bumblebees, then a bumblebee population can become locally large without increasing its genetic diversity levels. This may be partly explained by bumblebees’ haplodiploid sex-determination system in which unfertilized eggs develop into haploid males and fertilized eggs into diploid females, where workers do not mate and normally do not contribute to the next generation, and where each colony consists of a single mated queen and her offspring (Alford, 1975; Goulson, 2010). Such colonies can have large numbers of specimens which are in fact all "clones" with 75% or more genetic similarity between them (Goulson, 2010). A population consisting of large colonies founded by closely related queens will harbor many closely related workers and thus can have large population numbers but lower genetic variation than one might expect. Furthermore, several studies have shown that bumblebees are able to recover from genetic bottlenecks by increasing population sizes without increasing their genetic diversity levels (Schmid-Hempel et al., 2007). Although these populations are characterized with having many specimens, and thus are at first glance in a healthy condition, these populations are under severe fitness risks, due to the low genetic variation which makes these populations vulnerable to additional future environmental changes (Frankham, 2005; Zayed, 2009; Habel et al., 2014; Koch et al., 2017). Indeed, populations with low genetic variation show less population growth and survival (Whitehorn et al., 2009), and are more susceptible to diseases (Whitehorn et al., 2011; Cameron et al., 2011; Whitehorn et al., 2014). Hence, when neighboring populations have rather similar levels of genetic diversity, then increasing a populations’ genetic diversity through high amounts of gene flow will not be possible within a short time span, making these populations even at higher risk. The latter, implying that neighboring populations have similar genetic diversity cannot be proven in our study, as no in depth sampling of multiple locations was performed and much variation may thus be missed from unsampled populations. However, the similar genetic diversity levels we observed within the populations of a certain bumblebee species (Table 2), suggest that genetic diversity levels in neighboring populations may be very similar. This in turn would mean that for conservational purposes, increasing genetic diversity levels may not so easily be achieved.
Here, grouping the bumblebee species by IUCN status into “declining” and “stable” (Table 6) showed similar results as described by Maebe et al. (2016), confirming lower genetic diversity levels within the populations of declining species than observed within widespread, stable species (as been observed and/or discussed in: Darvill et al., 2006; Ellis et al., 2006; Goulson et al., 2008; Charman et al., 2010; Cameron et al., 2011). Furthermore, our results showed clear differentiation of genetic diversity based on species. Indeed, the best models explaining observed AR and HE included species as fixed factor (Table 4), and post hoc tests showed multiple significant differences in genetic diversity between species (Table 5). Those results assume that the maximum level of genetic diversity which a species could achieve might be always lower than in other species. The latter might be due to species-specific population characteristics such as lower queen production, smaller colonies, low dispersal capacity, etc., which all could limit the generation of higher genetic diversity levels within the populations of a certain species, and/or due to past population dynamics which have altered diversity levels within species’ populations in the past (as hypothesized in Maebe et al., 2016). The hypothesis of past population dynamics influencing genetic variability has been raised attention as a recent study showed a clear drop in genetic diversity over time in south-Brazilian bumblebee species (Maebe et al., 2018) which contradicted the temporal stability observed within the European bumblebees (Maebe et al., 2016). The authors explained this difference due to deforestation differences between both continents, hypothesizing that in Europe major reductions in genetic diversity occurred earlier in time (Maebe et al., 2018). Whether this holds true must be further investigated, but the lower levels in genetic diversity observed in certain species might thus be due to different impact of land-use changes, such as deforestation, on particular bumblebee species.
To conclude, our results showed that measuring bumblebees’ local abundance cannot be used to directly determine the health status of a population, especially on a longer term. Furthermore, as bumblebee species with less genetic diversity have lower fitness (e.g. Cameron et al., 2011; Whitehorn et al., 2011; Whitehorn et al., 2014), it seems that for conservation purposes, measuring genetic diversity parameters can give a good prediction value whether a certain population or bumblebee species is more or less vulnerable towards future population decline.
Data Availability Statement
Microsatellite genotypes of each specimen are archived at DRYAD: https://doi.org/10.5061/dryad.7q3n40d.
Author Contributions
KM and IM designed the research. RK provided specimens. KM analyzed the data. KM wrote the paper, while all co-authors (RK, IM, MM, and GS) helped in improving the manuscript.
Funding
This study was funded by the Belgian Science Policy (BELSPO) as part of the Belbees project (grant BR/132/A1/BELBEES), the Research Foundation-Flanders (FWO) under EOS Project named CLIPS (Grant 3094785) and research project (Grant 3G042618), and the Institutional Research Funding (IUT36-2) of the Estonian Ministry of Education; European Regional Development Fund project ForBee of RITA program.
Conflict of Interest
The authors declare that the research was conducted in the absence of any commercial or financial relationships that could be construed as a potential conflict of interest.
Acknowledgments
The authors would like to thank Alexandra Hart for proofreading the manuscript. Furthermore, we thank two anonymous reviewers for their constructive comments which helped to improve our manuscript.
Supplementary Material
The Supplementary Material for this article can be found online at: https://www.frontiersin.org/articles/10.3389/fgene.2019.01262/full#supplementary-material
References
Ashley, M. V., Caballero, I. C., Chaovalitwongse, M., Dasgupta, B, Govindan, P., Sheikh, H. I., et al. (2009). Kinalyzer, a computer program for reconstructing sibling groups. Mol. Ecol. Resour. 9, 1127–1131. doi: 10.1111/j.1755-0998.2009.02562.x
Barton, K. (2015). MuMIn: Multi-model inference. R package version 1.15.1. (http://CRAN.R-project.org/package=MuMIn).
Bates, D., Maechler, M., Bolker, B., Walker, S. (2015). Fitting linear mixed-effects models using lme4. J. Stat. Software 67 (1), 1–48. doi: 10.18637/jss.v067.i01
Cameron, S. A., Lozier, J. D., Strange, J. P., Koch, J. B., Cordes, N., Solter, L. F., et al. (2011). Patterns of widespread decline in North American bumblebees. Proc. Natl. Acad. Sci. U. S. A. 108, 662–667. doi: 10.1073/pnas.1014743108
Charman, T. G., Sears, J., Green, R. E., Bourke, A. F. G. (2010). Conservation genetics, foraging distance and nest density of the scarce Great Yellow Bumblebee (Bombus distinguendus). Mol. Ecol. 19, 2661–2674. doi: 10.1111/j.1365-294X.2010.04697.x
Cook, J. M., Crozier, R. H. (1995). Sex determination and population biology in the Hymenoptera. Trends Ecol. Evol. 10, 281–286. doi: 10.1016/0169-5347(95)90011-X
Darvill, B., Ellis, J. S., Goulson, D. (2006). Population structure and inbreeding in a rare and declining bumblebee Bombus muscorum, (Hymenoptera: Apidae). Mol. Ecol. 15, 601–611. doi: 10.1111/j.1365-294X.2006.02797.x
Duchateau, M. J., Marien, J. (1995). Sexual biology of haploid and diploid males in the bumble bee Bombus terrestris. Insectes Soc. 42, 255–266. doi: 10.1007/BF01240420
Duchateau, M. J., Hishiba, H., Velthuis, H. H. W. (1994). Diploid males in the bumble bee Bombus terrestris. Entomol. Exp. Appl. 71, 263–269. doi: 10.1111/j.1570-7458.1994.tb01793.x
Ellis, J. S., Knight, M. E., Darvill, B., Goulson, D. (2006). Extremely low effective population sizes, genetic structuring and reduced genetic diversity in a threatened bumble bee species Bombus sylvarum, (Hymenoptera: Apidae). Mol. Ecol. 15, 4375–4386. doi: 10.1111/j.1365-294X.2006.03121.x
Estoup, A., Tailliez, C., Cornuet, J. M., Solignac, M. (1995). Size homoplasy and mutational processes of interrupted microsatellites in 2 bee species, Apis mellifera and Bombus terrestris (Apidae). Mol. Biol. Evol. 12, 1074–1084. doi: 10.1093/oxfordjournals.molbev.a040282
Frankham, R. (2005). Genetics and extinction. Biol. Conserv. 126, 131–140. doi: 10.1016/j.biocon.2005.05.002
Gerloff, C. U., Schmid-Hempel, P. (2005). Inbreeding depression and family variation in a social insect, Bombus terrestris (Hymenoptera: Apidae). Oikos 111, 67–80. doi: 10.1111/j.0030-1299.2005.13980.x
Goudet, J. (2001). Updated from Goudet, J. Fstat (version 1.2): a computer program to calculate F-statistics. J. Hered. 86, 485–486 (1995. doi: 10.1093/oxfordjournals.jhered.a111627 Fstat: a program to estimate and test gene diversities and fixation indices (version 2.9.3).
Goulson, D., Lye, G. C., Darvill, B. (2008). Decline and conservation of bumble bees. Ann. Rev. Entomol. 53, 191–208. doi: 10.1146/annurev.ento.53.103106.093454
Goulson, D. (2010). Bumblebees, behaviour, ecology and conservation (Oxford: Oxford University Press), 336.
Habel, J. C., Husemann, M., Finger, A., Danley, P. D., Zachos, F. E. (2014). The relevance of time series in molecular ecology and conservation biology. Biol. Rev. 89, 484–492. doi: 10.1111/brv.12068
Hothorn, T., Bretz, F., Westfall, P. (2008). Simultaneous inference in general parametric models. Biom. J. 50, 346–363. doi: 10.1002/bimj.200810425
Kalinowski, S. T. (2015). HP-RARE 1.0: a computer program for performing rarefaction on measures of allelic richness. Mol. Ecol. Notes 5, 187–189. doi: 10.1111/j.1471-8286.2004.00845
Koch, J. B., Looney, C., Sheppard, S., Strange, J. P. (2017). Patterns of population genetic diversity and structure across bumblebee communities in the Pacific Northwest. Conserv. Genet. 18, 507–520. doi: 10.1007/s10592-017-0944-8
Kotkas, H. (1968). The sowing technologies, pre-mowing and pollinators of red clover seed fields. Summary of PhD study. Punase ristiku seemnepõllu külviviisid, eelniitmised ja tolmeldajad: dissertatsioon; Eesti Maaviljeluse ja Maaparanduse Teadusliku Uurimise Instituut; Jõgeva Sordiaretusjaam, Jõgeva 186 l., 32 lk. 32. https://www.ester.ee/record=b4004568
Lozier, J. D., Cameron, S. A. (2009). Comparative genetic analyses of historical and contemporary collections highlight contrasting demographic histories for the bumblebees Bombus pensylvanicus and B. impatiens in Illinois. Mol. Ecol. 18, 1875–1886. doi: 10.1111/j.1365-294X.2009.04160.x
Lozier, J. D., Strange, J. P., Stewart, I. J., Cameron, S. A. (2011). Patterns of range-wide genetic variation in six North American bumblebee (Apidae: Bombus) species. Mol. Ecol. 20, 4870–4888. doi: 10.1111/j.1365-294X.2011.05314.x
Maebe, K., Meeus, I., Maharramov, J., Grootaert, P., Michez, D., Rasmont, P., et al. (2013). Microsatellite analysis in museum samples reveals inbreeding before the regression of Bombus veteranus. Apidologie 44 (2), 188–197. doi: 10.1007/s13592-012-0170-9
Maebe, K., Meeus, I., Ganne, M., De Meulemeester, T., Biesmeijer, K., Smagghe, G. (2015). Microsatellite analysis of museum specimens reveals historical differences in genetic diversity between declining and more stable Bombus species. PloS One 10, e0127870. doi: 10.1371/journal.pone.0127870
Maebe, K., Meeus, I., Vray, S., Claeys, T., Dekoninck, W., Boevé, J.–L, et al. (2016). A century of temporal stability of genetic diversity in wild bumblebees. Sci. Rep. 6, 38289. doi: 10.1038/srep38289
Maebe, K., Golsteyn, L., Nunes-Silva, P., Blochtein, B., Smagghe, G. (2018). Temporal changes in genetic variability in three bumblebee species from Rio Grande do Sul, South Brazil. Apidologie 49 (3), 415–429. doi: 10.1007/s13592-018-0567-1
Maebe, K., Karise, R., Meeus, I., Mänd, M., Smagghe, G. (2019). Pattern of population structuring between Belgian and Estonian bumblebees. Sci. Rep. 9, 9651. doi: 10.1038/s41598-019-46188-7
Marja, R., Herzon, I., Viik, E., Elts, J., Mänd, M., Tscharntke, T., et al. (2014). Environmentally friendly management as an intermediate strategy between organic and conventional agriculture to support biodiversity. Biol. Conserv. 178, 146–154. doi: 10.1016/j.biocon.2014.08.005
Meeus, I., Brown, M. J. F., De Graaf, D. C., Smagghe, G. (2011). Effects of invasive parasites on bumblebee declines. Conserv. Biol. 25, 662–671. doi: 10.1111/j.1523-1739.2011.01707.x
Nakagawa, S, Schielzeth, H. (2013). A general and simple method for obtaining R2 from generalized linear mixed-effects models. Methods Ecol. Evol. 4, 133–142. doi: 10.1038/s41598-019-46188-7
Nei, M. (1978). Estimation of average heterozygosity and genetic distance from a small number of individuals. Genetics 89, 583–590.
Peakall, R., Smouse, F. (2006). “GENALEX 6: Genetic Analysis in Excel,” in Population Genetic Software for Teaching and Research (Canberra, Australia: Australian National University). doi: 10.1111/j.1471-8286.2005.01155.x
Potts, S. G., Biesmeijer, J. C., Kremen, C., Neumann, P., Schweiger, O., Kunin, W. E. (2010). Global pollinator declines: trends, impacts and drivers. Trends Ecol. Evol. 25, 345–353. doi: 10.1016/j.tree.2010.01.007
R Development Core Team. (2008). R: A language and environment for statistical computing. R Foundation for Statistical Computing http://www.R-project.org.
Rasmont, P., Franzen, M., Lecocq, T., Harpke, A., Roberts, S., et al. (2015). Climatic risk and distribution atlas of European bumblebees. BioRisk 10, 1–236. doi: 10.3897/biorisk.104749
Reed, D. H., Frankham, R. (2003). Correlation between fitness and genetic diversity. Conserv. Biol. 17, 230–237. doi: 10.1046/j.1523-1739.2003.01236.x
Schmid-Hempel, R., Schmid-Hempel, P. (2000). Female mating frequencies in Bombus spp. from Central Europe. Insectes Soc. 47, 36–41. doi: 10.1007/s000400050006
Schmid-Hempel, P., Schmid-Hempel, R., Brunner, P. C., Seeman, O. D., Allen, G. R. (2007). Invasion success of the bumblebee, Bombus terrestris, despite a drastic genetic bottleneck. Heredity 99, 414–422. doi: 10.1038/sj.hdy.6801017
Vanbergen, A. J., The Insect Pollinators Initiative. (2013). Threats to an ecosystem service: pressures on pollinators. Front. Ecol. Environ. 11(5), 251–259. doi: 10.1890/120126
Van Oosterhout, C., Hutchinson, W. F., Wills, D. P. M., Shipley, P. (2004). MICROCHECKER: software for identifying and correcting genotyping errors. Mol. Ecol. Notes 4, 535–538. doi: 10.1111/j.1471-8286.2004.00684.x
Viik, E. (2019). Kimalaste mitmekesisuse ja arvukuse uuring (Monitoring of bumble bee diversity and abundance—translated from Estonian). Report for Estonian Rural Development Plan (ERDP) for 2014–2020. http://pmk.agri.ee/mak/wp-content/uploads/sites/2/2019/03/3_1_kimalased.pdf
Vray, S., Rollin, O., Rasmont, P., Dufrêne, M., Michez, D., Dendoncker, N. (2019). A century of local changes in bumblebee communities and landscape composition in Belgium. J. Insect Conserv. 1–13. doi: 10.1007/s10841-019-00139-9
Wang, J. L. (2004). Sibship reconstruction from genetic data with typing errors. Genetics 166, 1963–1979. doi: 10.1534/genetics.166.4.1963
Whitehorn, P. R., Tinsley, M. C., Brown, M. J. F., Darvill, B., Goulson, D. (2009). Impacts of inbreeding on bumblebee colony fitness under field conditions. BMC Evol. Biol. 9, 152. doi: 10.1186/1471-2148-9-152
Whitehorn, P. R., Tinsley, M. C., Brown, M. J. F., Varvill, B., Goulson, D. (2011). Genetic diversity, parasite prevalence and immunity in wild bumblebees. Proc. R. Soc. Lond. B Biol. Sci. 278, 1195–1202. doi: 10.1098/rspb.2010.1550
Whitehorn, P. R., Tinsley, M. C., Brown, M. J. F., Varvill, B., Goulson, D. (2014). Genetic diversity and parasite prevalence in two species of bumblebee. J. Insect Conserv. 18 (4), 667–673. doi: 10.1007/s10841-014-9673-1
Keywords: genetic diversity, bumblebees, local abundance, microsatellite loci, population genetics
Citation: Maebe K, Karise R, Meeus I, Mänd M and Smagghe G (2019) Level of Genetic Diversity in European Bumblebees is Not Determined by Local Species Abundance. Front. Genet. 10:1262. doi: 10.3389/fgene.2019.01262
Received: 08 July 2019; Accepted: 15 November 2019;
Published: 10 December 2019.
Edited by:
Frederic J. J. Chain, University of Massachusetts Lowell, United StatesReviewed by:
Yessica Rico, Instituto de Ecología (INECOL), MexicoClement Fisher Kent, York University, Canada
Copyright © 2019 Maebe, Karise, Meeus, Mänd and Smagghe. This is an open-access article distributed under the terms of the Creative Commons Attribution License (CC BY). The use, distribution or reproduction in other forums is permitted, provided the original author(s) and the copyright owner(s) are credited and that the original publication in this journal is cited, in accordance with accepted academic practice. No use, distribution or reproduction is permitted which does not comply with these terms.
*Correspondence: Guy Smagghe, Z3V5LnNtYWdnaGVAdWdlbnQuYmU=
†ORCID: Ivan Meeus, orcid.org/0000-0002-4492-5967
Guy Smagghe, orcid.org/0000-0001-8334-3313
Kevin Maebe, orcid.org/0000-0002-3741-2143