 Allen F. Ryan1*
 Chanond A. Nasamran2
 Kwang Pak1
 Clara Draf1
 Kathleen M. Fisch2
 Nicholas Webster3
 Arwa Kurabi1
- 1Departments of Surgery/Otolaryngology, UC San Diego School of Medicine, VA Medical Center, La Jolla, CA, United States
- 2Medicine/Center for Computational Biology & Bioinformatics, UC San Diego School of Medicine, VA Medical Center, La Jolla, CA, United States
- 3Medicine/Endocrinology, UC San Diego School of Medicine, VA Medical Center, La Jolla, CA, United States
Single-cell transcriptomics was used to profile cells of the normal murine middle ear. Clustering analysis of 6770 transcriptomes identified 17 cell clusters corresponding to distinct cell types: five epithelial, three stromal, three lymphocyte, two monocyte, two endothelial, one pericyte and one melanocyte cluster. Within some clusters, cell subtypes were identified. While many corresponded to those cell types known from prior studies, several novel types or subtypes were noted. The results indicate unexpected cellular diversity within the resting middle ear mucosa. The resolution of uncomplicated, acute, otitis media is too rapid for cognate immunity to play a major role. Thus innate immunity is likely responsible for normal recovery from middle ear infection. The need for rapid response to pathogens suggests that innate immune genes may be constitutively expressed by middle ear cells. We therefore assessed expression of innate immune genes across all cell types, to evaluate potential for rapid responses to middle ear infection. Resident monocytes/macrophages expressed the most such genes, including pathogen receptors, cytokines, chemokines and chemokine receptors. Other cell types displayed distinct innate immune gene profiles. Epithelial cells preferentially expressed pathogen receptors, bactericidal peptides and mucins. Stromal and endothelial cells expressed pathogen receptors. Pericytes expressed pro-inflammatory cytokines. Lymphocytes expressed chemokine receptors and antimicrobials. The results suggest that tissue monocytes, including macrophages, are the master regulators of the immediate middle ear response to infection, but that virtually all cell types act in concert to mount a defense against pathogens.
Introduction
The middle ear (ME) is a bone-encased, air-filled cavity that links the external ear to the inner ear. Bounded externally by the tympanic membrane, it houses the three ossicles that transmit acoustic vibrations from the eardrum to the cochlea. It is connected to the nasopharynx by the Eustachian tube, which provides intermittent ventilation and pressure release, as well as clearance via ciliary activity.
The ME is a frequent site of infection, especially in children. More than 90% of children experience otitis media (OM), which is chronic-recurrent in 15−20% (Rosenfeld and Bluestone, 2003). It is the most common cause of physician visits and surgery at ages less than 5 years (Cullen et al., 2009). OM leads to hearing loss during a critical period of language acquisition and learning, and has been associated with deficits in both language and learning (Friel-Patti et al., 1982; Wendler-Shaw et al., 1993). OM can be well-controlled by therapy, but the annual cost in the United States is estimated at >$5 billion (Ahmed et al., 2014). In contrast, OM is a very serious disease in developing countries due to limited access to medical care. Under-treated suppurative OM is estimated by the World Health Organization to be responsible for 28,000 annual deaths due to intracranial infection and to cause half of the world’s burden of severe hearing loss, approximately 240 million cases (Arguedas et al., 2010). The resolution of uncomplicated, acute OM occurs in less than one week, even without antibiotic treatment. This is too rapid for the de novo elaboration of cognate immunity, suggesting that OM is normally resolved by innate immunity. Indeed, deficiencies in innate immune genes have been linked to OM susceptibility in both mice and humans (Leichtle et al., 2011; Rye et al., 2011).
The ME is an atypical mucosal site, characterized by a largely rudimentary cellular structure, yet with the capability to rapidly transform into a respiratory-type epithelium. The majority of the resting ME cavity is lined by a monolayer of simple squamous epithelial cell overlying a sparse stroma and vasculature. However, upon infection and inflammation, hyperplasia can produce a 20-fold increase in thickness, into a pseudostratified, columnar epithelium populated with ciliated, goblet and secretory cells, within a few days. Upon the resolution of infection, the mucosa returns to its baseline structure (Lim, 1979).
The cells that make up the normal ME mucosa have been studied primarily morphologically. Early studies were limited to the observation of a simple squamous lining epithelium with ciliated cells in some areas, especially near the orifice of the Eustachian tube (e.g., Kolmer and Mellendorff, 1927; Wolff, 1943). Later investigations noted morphological details that confirmed a simple squamous epithelial structure with minimal stroma throughout much of the ME, but with some areas of cuboidal, columnar and pseudostratified epithelium, primarily near the Eustachian tube but also in recesses and corners of the ME (e.g., Hentzer, 1970). Blood vessels, lymphatics, and small numbers of immunocytes including macrophages, lymphocytes and plasma cells were also noted in the stroma, as were melanocytes (Lin and Zak, 1982). In addition, histochemistry was used to demonstrate the presence of mucopolysaccharides within both ciliated and non-ciliated epithelial cells (e.g., Sade, 1966).
The introduction of electron microscopy to ME studies added significant details regarding ME cell types. Based on their ultrastructure, Lim and Hussl (1969) classified ME epithelial cells as non-ciliated without secretory granules, mucus-secreting goblet cells with abundant secretory granules, intermediary secretory cells with fewer secretory granules, ciliated cells, and subsurface basal cells. Hentzer (1976) added a sixth class that he termed intermediate cells, which he proposed could differentiate into any of the other surface cell types, with intermediary secretory cells a transitional stage into goblet cells. Ultrastructural studies also noted pericytes in association with the endothelial cells of vessels.
Additional information has been added by immunohistochemistry. Takahashi et al. (1989) identified macrophages, T-cells and B-cells in the subepithelial stroma of the normal ME. However, these cells were sparse, with on average less than one B cell in a histological section through the entire ME, and 1−5 macrophages and T-cells per section. They thus comprised a very small fraction of the cells present in the normal ME, as observed morphologically by Lim (1979). Immunohistochemistry was also used to document the presence of melanocytes (Lin and Zak, 1982), pericytes (Zhang et al., 2015), natural killer cells (Jecker et al., 1996), and mast cells (Stenfors et al., 1985).
More recently, a lineage study found that the ME mucosal epithelium in mice has two distinct embryonic origins. Epithelial cells in approximately half of the ME cavity closest to the Eustachian tube orifice originate from the endoderm of the branchial arches, while the remainder originates from the neural crest. In the normal ME, ciliated and goblet cells were observed only in cells of endodermal origin, although many non-ciliated, non-secretory cells were also present (Thompson and Tucker, 2013). More recently, ciliated cells have been documented in the region of neural crest origin (Luo et al., 2017). However, the dual origin of cells adds yet another layer of complexity to ME cell types.
Recent studies have also evaluated the transcriptome of the normal ME mucosa (MacArthur et al., 2013; Hernandez et al., 2015). These studies, which utilized bulk RNA, identified genes expressed in the normal ME. However, they could not address the genes expressed individually by the different ME cell types. Cell-specific patterns of genes expression would help to define the functions of various cell types and their ability to respond to ME infection.
The purpose of the present study was to document the expression of genes in individual ME cells. We sought to identify the cell types present in the ME cavity at a single-cell resolution, to illuminate their functional characteristics, and to evaluate the cellular distribution of genes known to be important for the pathogenesis and resolution of OM.
Materials and Methods
Animals
Young adult (60−90 day old) wildtype C57Bl/6J mice (Charles River, Wilmington, MA, United States) were used. All procedures were performed to National Institutes of Health guidelines and approved by the Institutional Animal Care and Use Committee of the VA San Diego Medical Center.
Preparation of Cell Suspensions
Groups of six mice were deeply anesthetized (ketamine 50 mg/kg, xylazine 1 mg/kg, acepromazine 5 mg/kg in 50 μl, i.p.) and sacrificed by decapitation, avoiding significant pressure on the neck to prevent the rupture of blood vessels in the ME. Six animals were required to generate a sufficient number of cells for a 10X Genomics run, because a ME tissue sample from a single animal are small. The ME bullae were isolated and opened along the suture that divides the lateral from the medial ME. ME mucosal tissue was gently harvested from the bullar bone. Care was taken not to include any tissue from the ME muscles. The pooled tissue was incubated with 0.5 mg/ml thermolysin (Sigma-Aldrich, #T7902) in Leibovitz’s buffer for 25–30 min in a 37°C/5% CO2 humidified tissue culture incubator to dissociate the extracellular matrix. The thermolysin was then aspirated, the tissue rinsed, and the sample incubated in FACSMax cell dissociation solution (Genlantis, #T200100). The cell mixture was triturated with a pipette and further dissociated into single cells mechanically by passing through a 23 G blunt-ended needle. Dissociated cells were passed through a 40 μm cell strainer (BD Biosciences) to eliminate clumps before sorting and collected into a FACS tube on ice containing PBS buffer with 0.04% BSA. Cell viability was assessed by Trypan blue exclusion staining and cells counted with a hemocytometer (Countess II, Thermo Fisher Scientific). Cell viability was greater than 95%. Following counting, the samples were diluted to 700 cells/μL. Three replicates were performed since the typical yield of a 10X genomics run is about 2,000 cells, and we wanted to evaluate a higher number, plus we wanted independent biological samples to assess replicability of the data.
Single-Cell Library Preparation and Sequencing
Libraries were prepared using the Chromium Controller (10X Genomics, Pleasanton, CA, United States) in conjunction with the Single Cell 3’ Reagent Kit v2 kit user guide. Briefly, the cell suspensions were diluted with nuclease-free water according to manufacturer instructions to achieve an estimated cell count of 1,950 to 2,858 per sample. cDNA synthesis, barcoding, and library preparation were then carried out in the Chromium controller according to the manufacturers’ instructions. The libraries were sequenced on an Illumina HiSeq 2500 (Illumina, San Diego, United States) with a read length of 26 bp for read 1 [cell barcode and unique molecule identifier (UMI)], 8 bp i7 index read (sample barcode), and 98 bp for read 2 (actual RNA read). Reads were first sequenced in the rapid run mode, allowing for fine-tuning of sample ratios in the following high-output run. Combining the data from both flow cells yielded approximately 200 million reads per sample.
Single-Cell Data Analysis
Reads were demultiplexed using Cellranger 2.0.2 (10X Genomics) and mkfastq in conjunction with bcl2fastq 2.17.1.14 (Illumina). The reads were subsequently aligned to the murine reference genome (mm10 with annotations from Ensembl release 84), filtered, and quantified using the Cellranger count command. Cellranger aggr (10X Genomics) was further used to generate an initial secondary analysis (t-distributed stochastic neighbor embedding; t-SNE), principal component analysis (PCA) clustering. Graph-based, as well as K-means (K = 2–10) analysis of gene expression was used to identify the 50 most differentially regulated genes that distinguished each PCA cell cluster. Cellranger aggr was used to merge the count matrices from 3 independent samples.
Additional clustering analysis was conducted using R package Seurat (Satija et al., 2015) to merge the data from the three independent samples and generate overall cell clusters. Cells were filtered based on quality control measurements recommended by the Seurat developers. Genes that were expressed in less than 0.1% of cells and cells that expressed less than 750 unique genes were excluded from the analysis. Cells that expressed greater than 7.5% mitochondrial genes were also excluded, as they represent dead or injured cells. After filtering, 6,370 of 6,770 cells remained.
After quality filtering, counts were log normalized. The FindVariableGenes function in Seurat was used to identify 2,207 highly variable genes that were used for downstream analysis. Finally, the data were scaled and subject to PCA to reduce the dimensionality of the dataset.
We used overrepresentation enrichment analysis (ORA) from R package WebGestaltR. Searched geneontology biological process database. Looked for enrichment in significantly differentially expressed genes (adjusted p-value < 0.05) for each cluster versus all highly variable genes (n = 2,207).
Identification of Cell Types
Cells were identified by assessing gene expression in the clusters of the three independent samples. Two methods were used to evaluate each of the samples. In the first, the expression of well-recognized cell marker genes was mapped to the graph-based clusters. For a second means of identification, the top 50 differentially expressed genes in each cluster were evaluated for their known expression by different cell types using the GeneCards database and the literature. From both methods, exclusively expressed genes (defined as being expressed by >50% of the cells in a cluster at high levels versus <2.5% of the cells of all other clusters at low levels) that were associated with an individual cell type were then assessed for their known cellular expression in the literature and in the GeneCards database.
Immunohistochemistry
Expression of select genes used for cell identification was verified by immunohistochemistry. Paraffin sections of MEs were deparaffinized, and antigen retrieval performed with citrate buffer, pH 6.0. The sections were exposed to primary antibodies to: EPCAM (Sino Biological), DYNLRB2 (Thermo Fisher Scientific), COL1A2 (LSBio), LRG (Proteintech), CSFR1 (LSBio) and PTPRCAP (Antibodies.online), DEFB1 (BiossUSA), AREG (LSBio), ECRG4 (Biorbyt), followed by secondary antibodies labeled with Alexa 488 (Abcam).
Expression of Innate Immune Genes
Acute OM in most children resolves in less than a week even in the absence of antibiotic treatment (Little et al., 2001), a period too short for the full engagement of cognate immunity. This implicates innate immunity in the normal resolution of ME infection. In order to assess the capacity of resting ME cells to rapidly engage innate immunity, we assessed the expression levels of innate immune genes in our single-cell transcriptomes. For this analysis we used the Mouse Genome Informatics gene ontology (GO) list of 1599 innate immune transcripts representing 809 individual genes: GO:0045087.
Results
Single-Cell Metrics
The mean number of transcriptomes per sample was 2,257, typical for a single-cell sample on the 10X genomics device, for a total of 6,770 cells. As noted above, quality control eliminating cells with a high proportion of mitochondrial genes likely to be dead or dying cells as well as outliers, left a total of 6,370 cells. A mean of 45.6 million reads/sample resulted in the detection of 17,322 genes for each tissue sample, with an average 20,425 reads/cell, 3,894 UMIs/cell and 1,576 genes/cell. The quality control metrics for each sample are presented in Table 1.
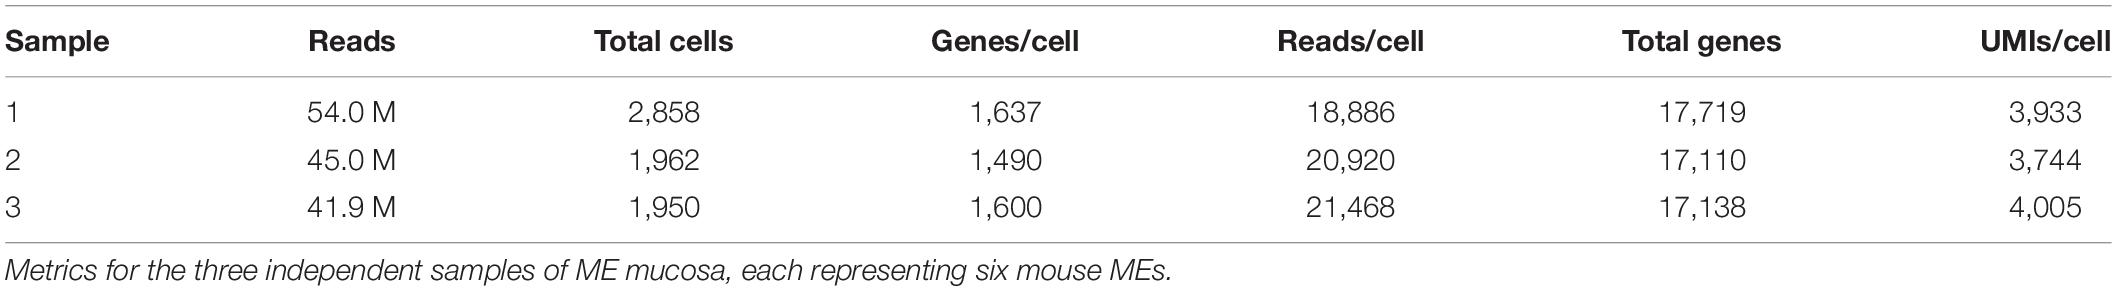
Table 1. Single cell metrics.
Generation of Cell Clusters
Clustering of ME cell transcriptomes using the 10X Cellranger pipeline resulted in a similar pattern of cell groupings for each of the samples, identifying 11 (Figure 1), 8 and 7 clusters in the three separate samples. Some of these clusters were subdivisions of spatially contiguous cell groups, and generally it was variation in the number of these subgroups that produced differences in cluster number between samples. However, later analysis confirmed that marker genes present in the sample with the most clusters (11) also distinguished cell groups in the two samples with fewer clusters, even though they had not been separated by PCA. To increase the depth of analysis, cell sequences from the three samples were merged and analyzed using Seurat. Seurat t-SNE clustering of the merged samples yielded 17 cell clusters, which are illustrated in Figure 2A. Several clusters consisted of discrete groups of cells. Others were parts of multi-cluster cell groupings, as observed in the Cellranger analysis.
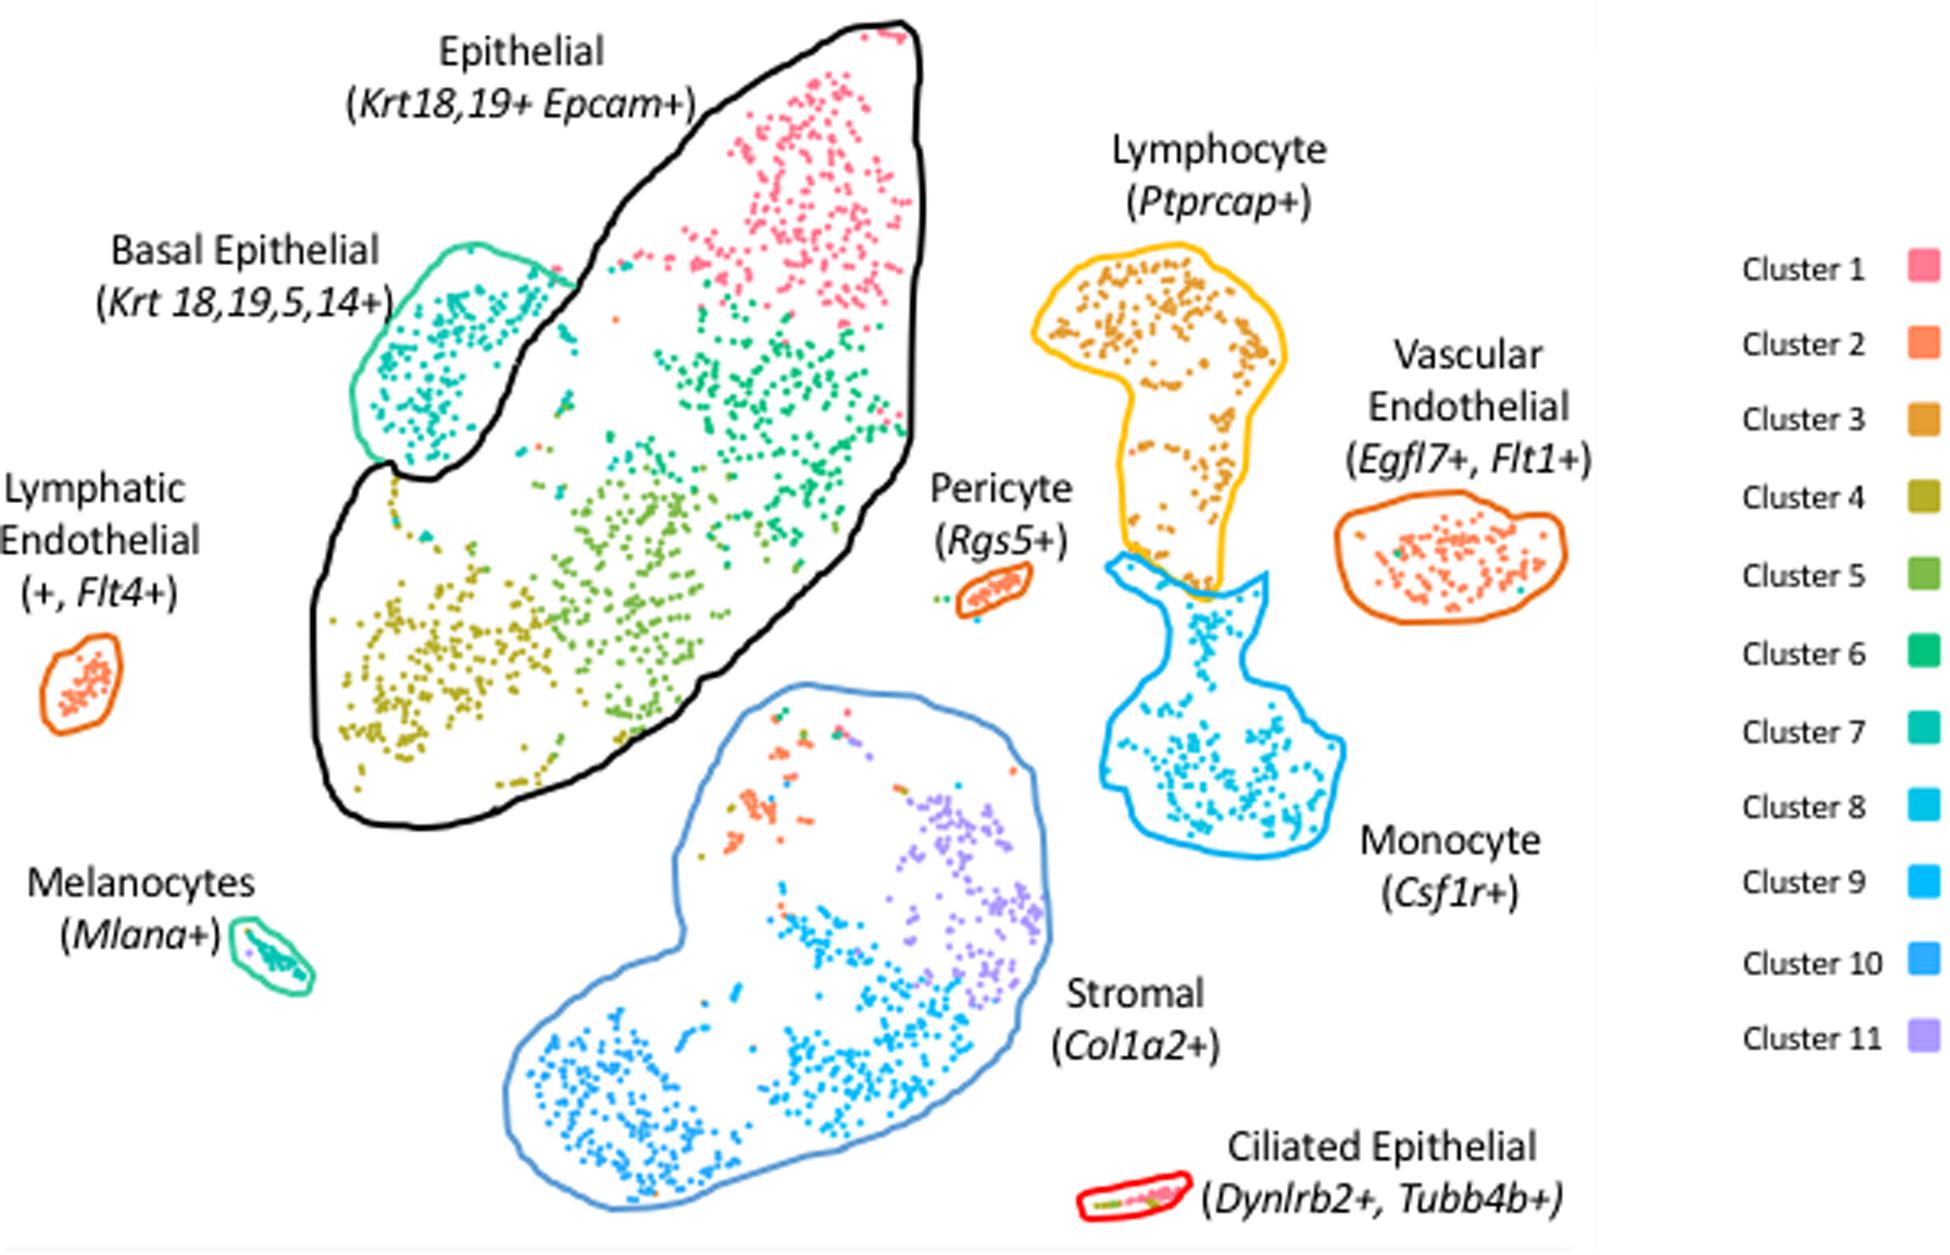
Figure 1. PCA clusters of cells from a sample of six normal mouse ME mucosae, generated by 10X Genomics Cellranger. Eleven separate clusters (1–11) were produced. Marker genes were used to identify the cells of each cluster.
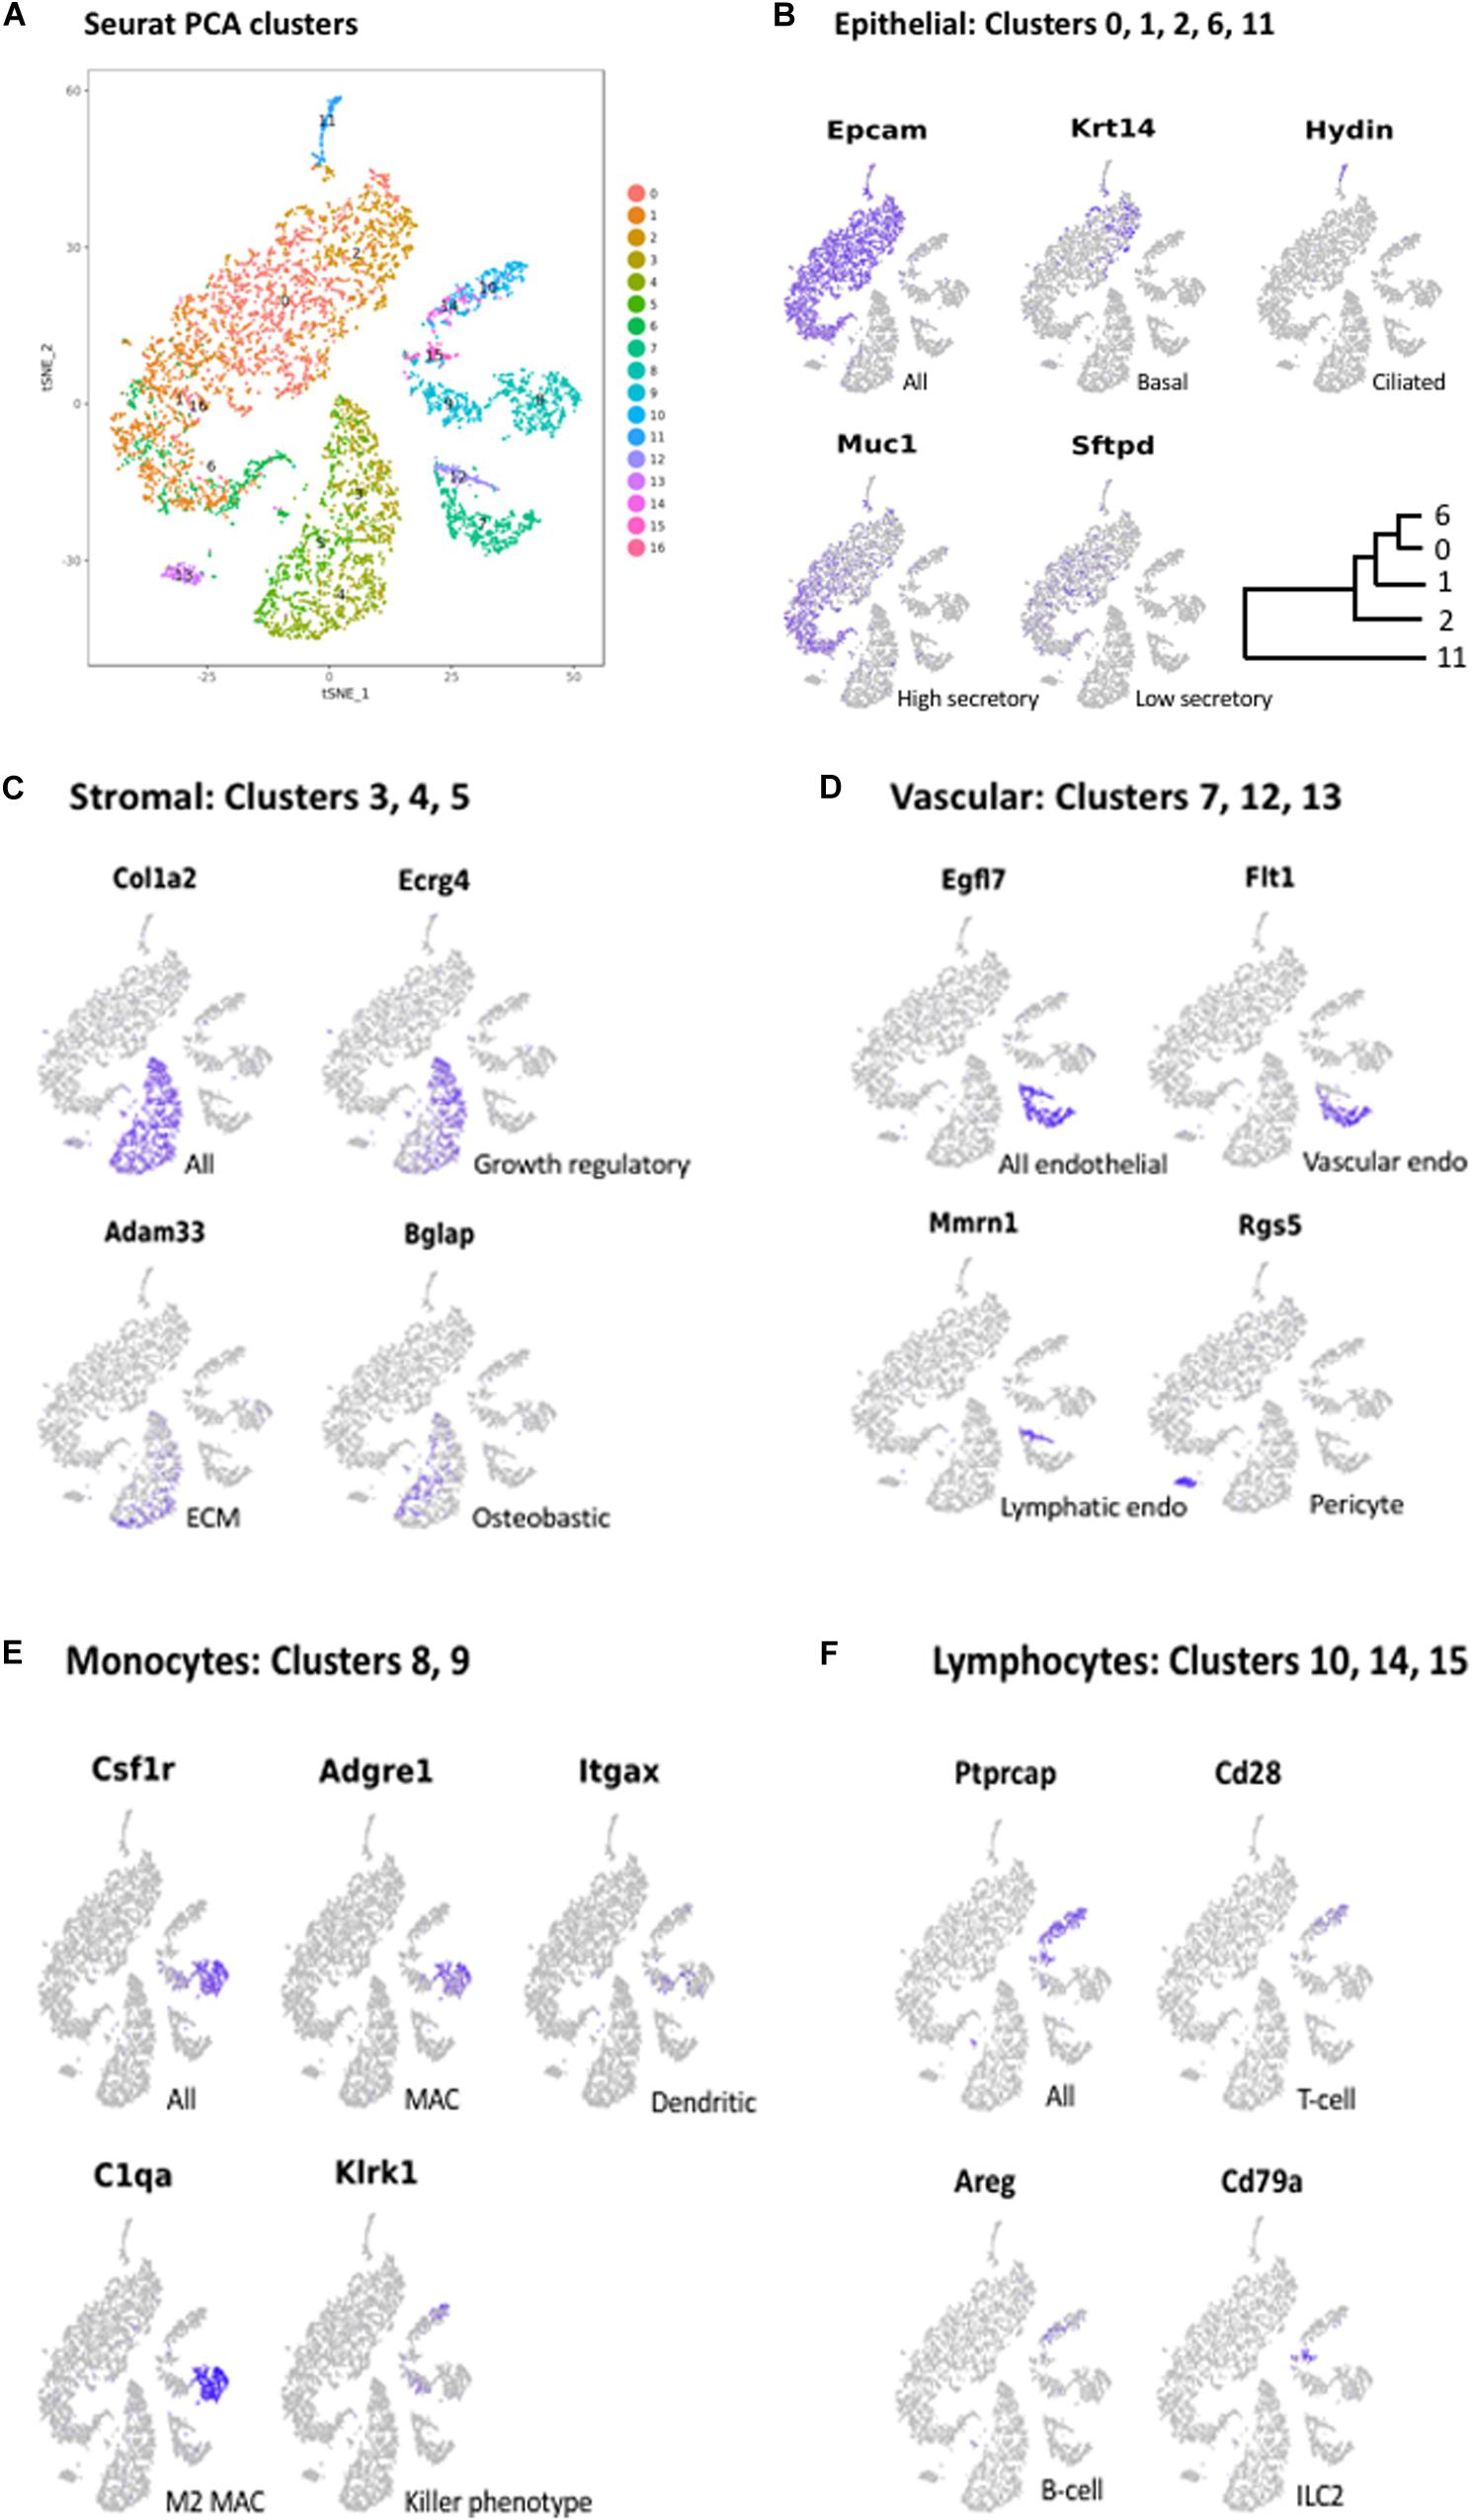
Figure 2. (A) PCA clusters generated from the cells of all three mucosal samples, generated with Seurat. Seventeen clusters (0–16) were identified. Marker genes were again used to determine the cells types present in each cluster. Some cell types that were grouped in contiguous clusters by Cellranger were separated in the Seurat analysis. Marker gene expression in: (B) Epithelial cell clusters (0, 1, 2, 6, 11); (C) Stromal cell clusters (3, 4, 5); (D) Vascular cell clusters (7, 12, 13); (E) Monocyte clusters (8, 9); and (F) Lymphocyte clusters (10, 14, 15).
Identification of ME Cell Types
As noted above, the expression of cell type marker genes that are well recognized in the literature was used to identify ME cell types (Figure 2). Evaluation of cluster-specific genes (expressed by the majority of cells in a single cluster and very few cells from other clusters) was also used to confirm ME cell type identity, when the literature or the GeneCards database indicated that expression was limited to a single cell type. Genes used to identify ME cell types are presented in Table 2.
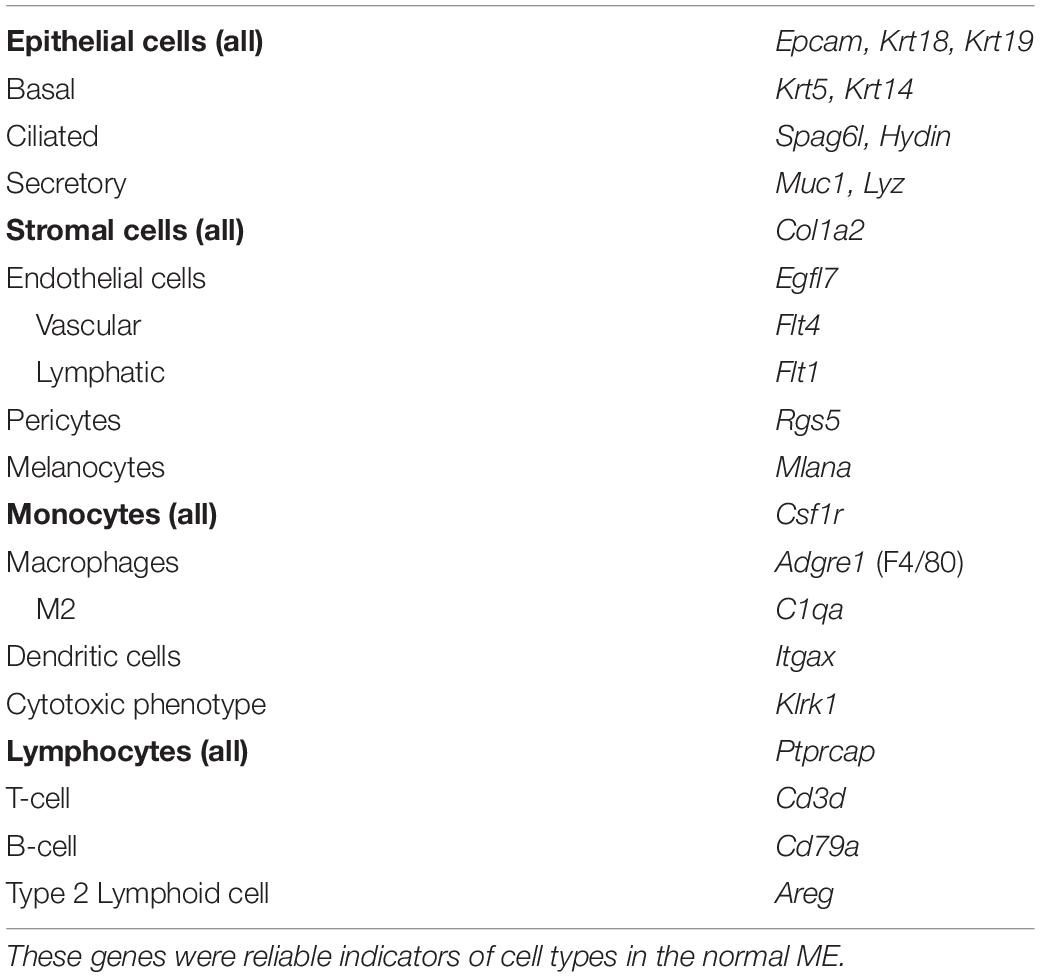
Table 2. Genes used to identify ME cell types.
Epithelial Cells
The largest number of cells (51.5% of all cells in the merged samples) showed expression of genes typical of epithelia (Hackett et al., 2011), including the epithelial cell adhesion gene Epcam (Figure 2B), the cytokeratin genes Krt18 and Krt19, several claudin genes, and Muc16. This included the cells of Seurat Clusters 0, 1, 2, 6, and 11. Two of these clusters were readily identified as epithelial subtypes: Cluster 2 exclusively expressed Krt5, Krt14 (Figure 2B), and Krt17, recognized markers of basal epithelial cells. Cluster 11, physically separate from the other epithelial clusters in the Seurat PCA analysis (Figure 2A), exclusively expressed many genes characteristic of ciliated cells (Hoh et al., 2012), including those encoding dynein axosomal heavy (e.g., Dnah5) Intermediate and light chains, the dynein regulator Dynlrb2 (dynein light chain roadblock 2) as well as Hydin (axonemal central pair apparatus protein) (Figure 2B).
Melanocytes
Embedded within the larger epithelial cell grouping that included Clusters 0, 1, 2 and 6 was a small number of cells (Cluster 16, consisting of only 1.8% of all cells) that did not express epithelial markers. The cells of this cluster uniquely expressed markers for melanocytes (Yang et al., 2014), including many involved in melanin synthesis: Pmel (premelanosome protein), Mlana (melan-A) which is required for PMEL function, Dct (dopamine tautomerase, involved in PMEL synthesis), Slc45a2 (Solute carrier family 45 member 2) involved in melanin synthesis and Tyrp1 (tyrosine-related protein 1) which regulates melanin synthesis).
Stromal Cells
After epithelial cells, the next largest group of cells (22.6% of all cells) expressed genes typical of stromal cells. This included Clusters 3, 4, and 5 (Figure 2A), the cells of which expressed numerous extracellular matrix (ECM)/connective tissue proteins, such as Col1a1 (collagen type 1 alpha 1), Col1a2 (Figure 2C), Fbln1 (fibulin 1, a fibrillar ECM), Wisp2 (Wnt1 inducible signaling pathway protein, a connective tissue growth factor); Adamts5 (ADAM metallopeptidase with thrombospondin type 1), a connective tissue organization factor, Fmod (fibromodulin) collagen fibrillogenesis factor involved in ECM assembly, and Cdh11 (cadherin 11), an ECM synthesis regulator.
Endothelial Cells and Pericytes
Cells associated with the vasculature comprised 9.2% of all cells on our samples. Clusters 7 and 12 exclusively expressed the endothelial cell marker Egfl7 (encoding a secreted endothelial protein involved in angiogenesis) (Figure 2D). They were also the only cells expressing several other genes related to angiogenesis including Lrg1 (A TGF-beta binding protein), Mmrn2 (A TGF-beta antagonist), Rasip1, Vegfr2, and Sox18. In addition, they expressed Selp (P selectin) and Icam2, both involved in endothelial recruitment of leukocytes. The cells of Cluster 13 expressed marker genes for pericytes, including Rgs5 (Figure 2D), a hypoxia-inducible G-protein regulatory subunit involved in angiogenesis and regulation of leukocyte extravasation.
Monocytes
Monocyte lineage cells comprised 8.52% of our samples. The cells of Clusters 8 and 9 uniquely expressed many monocyte marker genes, including Csf1r (colony stimulating factor 1 receptor) (Figure 2E), Aif1 (monocyte activation) c300d (receptor involved in innate immunity), Lst1 (lymphocyte proliferation inhibitor), Clec12a (negative regulator of monocyte and granulocyte function) and Ccl2 (macrophage chemoattractant). Cluster 8 cells also exclusively expressed macrophage-specific markers, such as Adgre1 (F4/80 antigen) (Figure 2E), Ccl3 (MIP1alpha) and Mrc1 (macrophage mannose receptor). Many but not all cells in Cluster 9 preferentially expressed Itgax (mature dendritic cell marker) (Figure 2E) and Cd209a (dendritic cell adhesion molecule), consistent with dendritic cell identity. The non-macrophage, non-dendritic cell monocytes were a mixed population of inflammatory (Ccr2+, Ly6C2+) and resident, homeostatic (Cx3cr1+, Ly6C2–) phenotypes (Gordon and Taylor, 2005).
Lymphocytes
The lymphocytes of Clusters 10, 14, and 15 (comprised 6.2% of our samples. All exclusively expressed a murine lymphocyte-specific gene Ptprcap (encoding a key regulator of lymphocyte activation) (Figure 2F). Cluster 10 cells also expressed Cd2 and Cd28 (Figure 2F), markers of both T- and NK-cells. The cells of Cluster 14 did not express specific T-cell or B-cell markers. However, they exclusively expressed Areg (Figures 2F, 3), an immunoregulatory member of the EGF family which is produced by type 2 innate lymphoid cells (ILC2s) (Zaiss et al., 2015). Consistent with an ILC2 phenotype, they also expressed Il7r and Thy1, Il13, and Gata3 (Gasteiger et al., 2017). Cluster 15 cells expressed B-cell markers including Cd19, Cd79a (Figure 2F) and Cd79b (involved in B-cell antigen recognition), H2-dmb2 (a B-cell class II molecule), Mzb1 (which regulates Ca2+ stores to diversify B-cell function).
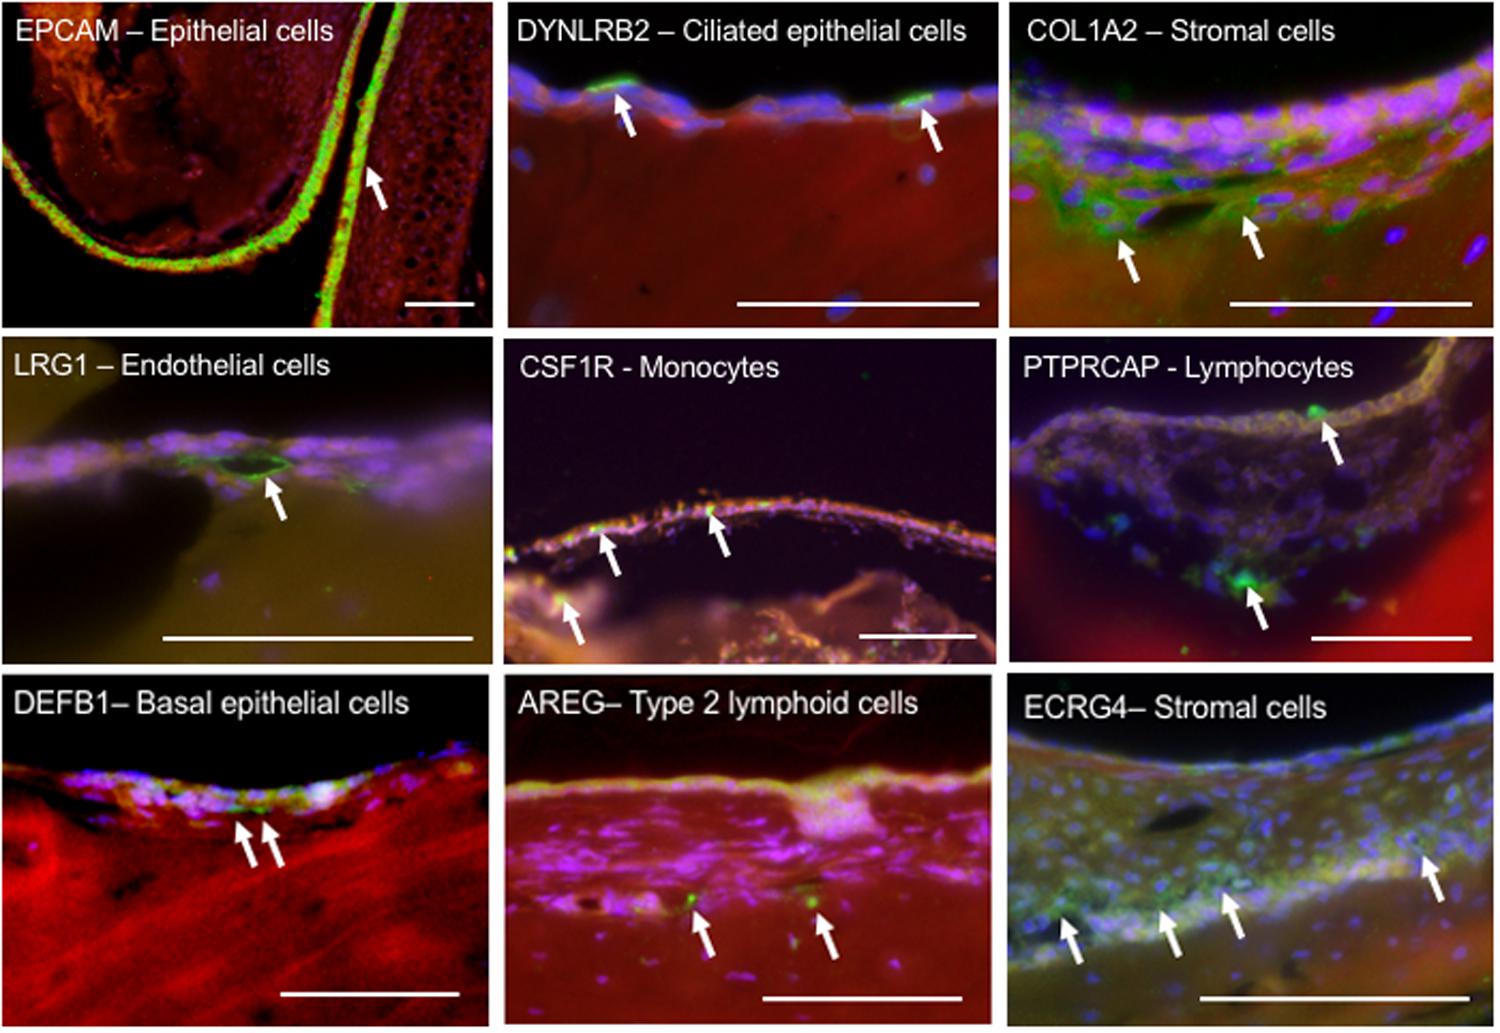
Figure 3. Immunohistochemical localization of select proteins encoded by marker genes, used to identify cell types in the ME mucosa. Paraffin sections were labeled with phalloidin (red), DAPI (blue) and Alexa 488-conjugated secondary antibodies (green). The upper six panels represent marker genes used to identify cell types known to be present in the ME. The three lower panels represent less expected findings: DEFB1 expression in basal epithelial cells; AREG indicating type II lymphoid cells; and ECRG4, often expressed in epithelia, in stromal cells. Scale bars represents 100 μm.
The expression of selected genes used to identify ME cell types is further illustrated by immunohistochemical labeling in Figure 3.
Differential Expression of Genes by ME Cell Clusters
The above analysis employed marker genes to identify cell types in our ME samples. However, the majority of the genes that were significantly differentially expressed between clusters, and which defined them in PCA analysis, were not markers for a given cell type. A total of 2,207 genes were differentially expressed between Seurat t-SNE clusters. For purposes of illustration, Figure 4 shows a heat map of the top 5 genes that were differentially regulated between each of the various clusters, and that contributed to cluster generation. It can be seen from the figure that most clusters expressed gene sets that clearly differentiated them from other cell groups. Genes that were highly expressed by different ME cell types, either exclusive to that type (as defined previously) or strongly preferentially, are described below.
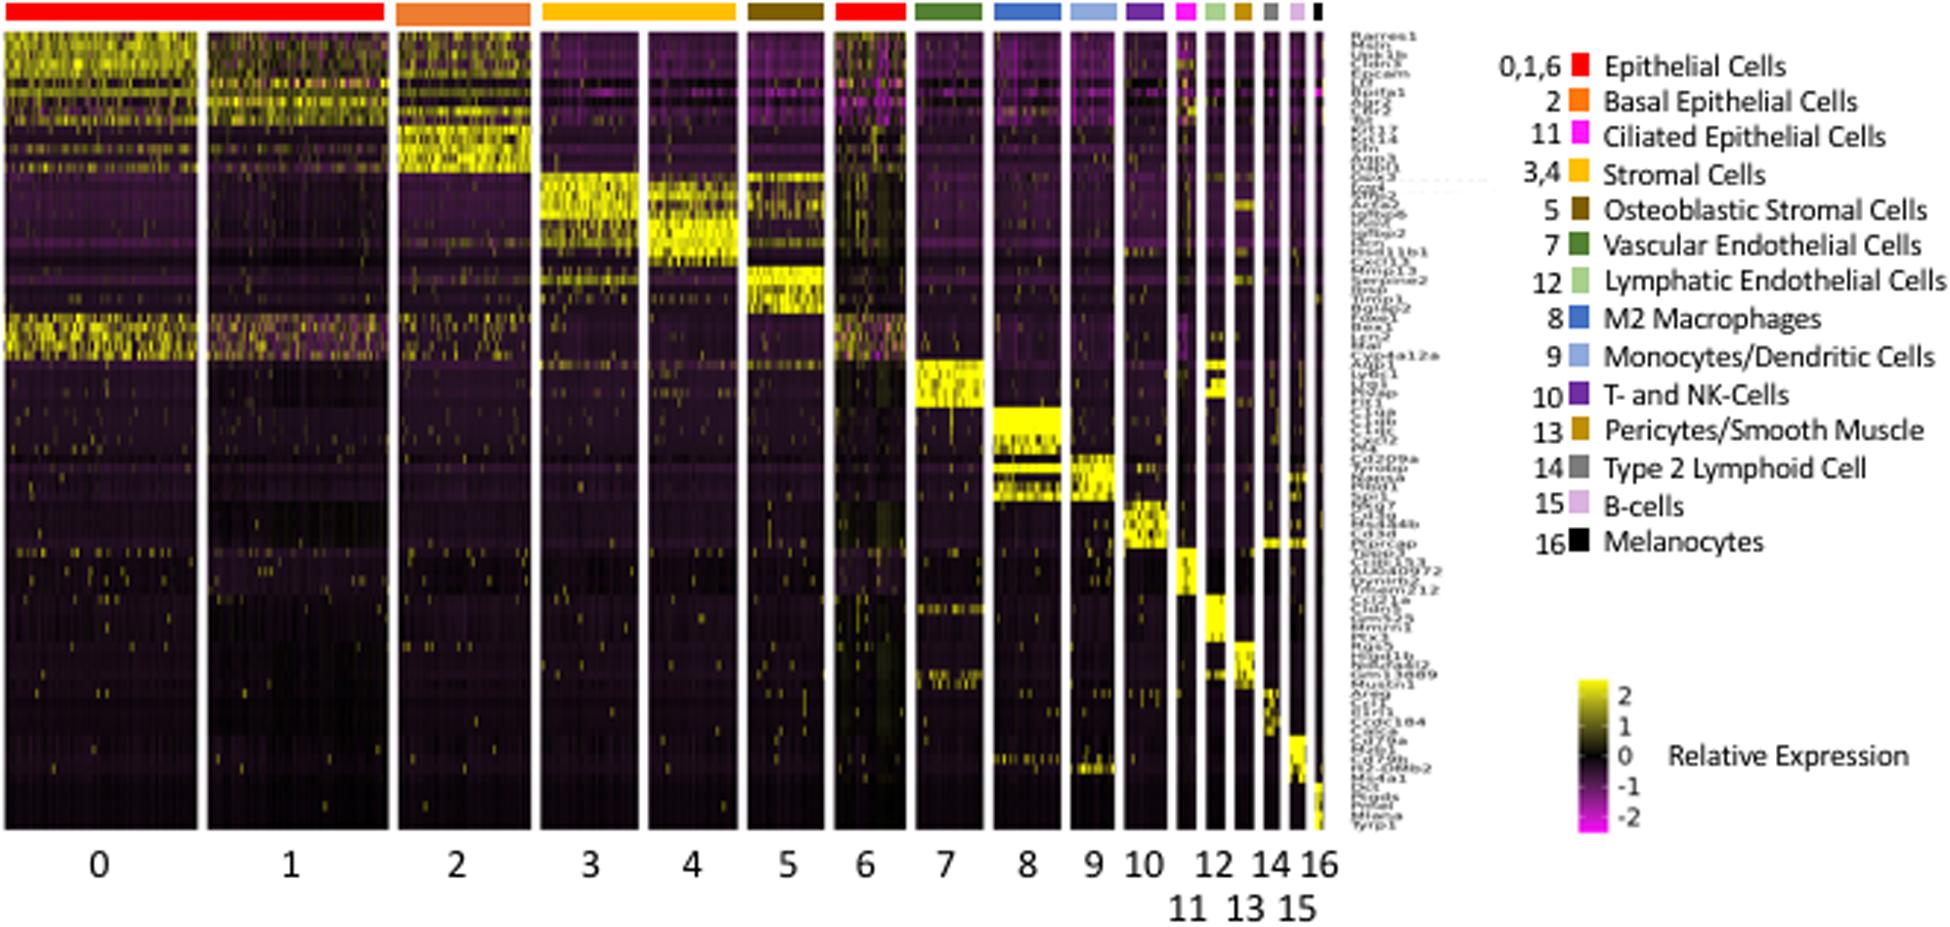
Figure 4. Heatmap illustrating the 5 most differentially regulated genes for each of the 17 Seurat cell clusters. Most clusters were clearly delineated by the differential gene expression. However, three epithelial clusters (0, 1, and 6) showed somewhat overlapping patterns of expression.
Epithelial Cells
Many of the genes exclusively expressed by cells in all five ME epithelial populations are involved in fluid or solute regulation, including Aqp5, Cldns 3, 4, and 7, Fxyd3, Kcnj16; Atp1b1, Fxyd3 and Slc6a1.
The cells of Clusters 0, 1, and 6 appeared to be closely related and expressed relatively few genes exclusively. Rather, this group of clusters expressed genes in common, often exhibiting relative differences in expression. A number of genes were expressed in these clusters in a gradient, with the descending order 1, 6 and 0. This included Muc1 (Figure 2B), Muc5b, Muc16, Tff2 (Trefoil factor 2, mucin stabilization gene), Reg3g (secreted lectin), as well as Lyz2 (lysozyme) and Ltf (lactotransferrin), both antimicrobials. Also expressed with this gradient were Agr2 (anterior gradient 2) involved in mucin assembly and Mgst1 (microsomal glutathione S-transferase 1) involved in leukotriene and prostaglandin synthesis. These gene gradients are consistent with Cluster 1 cells exhibiting the highest level of secretory activity. Cluster 1 cells also expressed high levels of Upk1b, involved in the stabilization and strengthening of apical cell membranes, suggesting presence at the luminal surface of the mucosa.
Genes expressed with an opposite gradient, highest in Cluster 0 and lowest in Cluster 1, included Bcam and Igfbp5, involved in ECM binding, and Sftpd (Figure 2B) encoding surfactant protein D. Genes that defined Cluster 6 included Cyp4a12a (iron binding oxyreductase), Mal (vesicle trafficking from Golgi), Lcn2 (iron sequestration), Bex1 (growth factor signaling) and Foxe1 (transcription factor involved in TGF and WNT regulation). However, these genes were also expressed in Clusters 0, at higher levels than in Cluster 6, and to a lesser extent in Clusters 1 and 2 (see Figure 4).
The basal epithelial cells of Cluster 2 cells strongly expressed Sfn (a regulator of cell signaling and cell cycle), Aqp3, Dapl1 (G coupled receptor activity), and Anax8. Aquaporin 3 is found in the basolateral membranes of kidney collecting duct cells, where it provides a pathway for water to exit these cells. This may play a similar role in the exit of water from the ME mucosal epithelium at its basal surface. Annexin 8 is a calcium binding protein found in mature and functional epithelial cells, where it participates in exocytosis. Interestingly, basal epithelial cells were also the only ME cells to strongly express Defb1, encoding the antimicrobial, beta defensin 1 (Figure 3).
In addition to many genes related to cilia, the ciliated epithelial cells of Cluster 11 exclusively expressed Muc4, encoding a membrane mucin that can activate ERBB2 and stimulate epithelial proliferation. They also preferentially expressed an unusually high number of genes for which no function has been well described, including among others Tmem212, Ccdc153, C9orf116, Fam183b, Sec14l3, and antisense IncRNA AU40972.
Stromal Cells
Cluster 3 was distinguished from other clusters by significantly higher levels of expression of growth regulators, including Ecrg4 (epithelial cell growth regulator) (Figures 2C, 3) which in other tissues is often expressed in epithelial cells (Kurabi et al., 2013), Sfrp2 (Wnt signaling modulator), Serpinf1 (angiogenesis and cell differentiation inhibitor) and Aspn (TGFß and BMP inhibitor).
Cluster 4 exclusively expressed Adam33 (cell−ECM interactions) (Figure 2C), Dpt (ECM assembly) and Col28a1 (collagen chain trimerization). The cluster preferentially expressed other genes related to ECM generation: including Gpc6 (growth factor and ECM receptor), Dcn (ECM assembly), Mfap4 and Mfap5 (ECM proteins); as well as genes involved in defense against infection: Cxcl13 (anti-microbial, B-cell chemoattractant) and Adm (antimicrobial and fluid regulation).
The cells of Cluster 5 strongly expressed Mmp13 (ECM breakdown), Serpine2 (regulator of cell signaling) and Timp1 (MMP inhibitor). They also exclusively expressed several genes consistent with osteoblast function, including Bglap (an abundant Ca-binding bone protein) (Figure 2C), Bglap2 (a hormone secreted by osteoblasts), Ibsp (a major structural protein in bone) and Sfrp4 (involved in bone morphogenesis), as well as Tnc (ECM protein tenascin C), Podnl1 (collagen binding), and Ackr4 (a decoy receptor that inactivates cytokines).
Endothelial Cells
Of the two groups of endothelial cells, Cluster 7 strongly expressed Aqp1, Ly6c1 (an immunocyte antigen also expressed by endothelial cells), Lrg1 (TGFß receptor binding) and Plvap (microvascular permeability). They exclusively expressed Flt1 (VEGFR1) (Figure 2D), Aplnr and Vwf (Von Willebrand factor), consistent with vascular endothelium, as well as the scavenger cytokine receptor Ackr1. Cluster 12 cells exclusively expressed Prox1 (a homeobox protein), Flt4 (VEGF receptor 3) and Reln (Reelin), all markers for lymphatic endothelial cells, as well as Ccl21a (T-cell chemotaxis), Cldn5 (tight junction protein), Gm525 (unknown function), Ptx3 (angiogenesis and inflammation), Mmrn1 (a factor V/Va receptor) (Figure 2D) and the cytokine scavenger receptor gene Ackr2.
Pericytes
The pericytes of Cluster 13 exclusively expressed three hypoxia-inducible mitochondrial genes involved in regulating the shift between glucose and glycogen metabolism: Higd1b; Ndufa4l2 and Cox4i2. They were the only ME cells to express genes involved in regulating vascular tone, including Des, Olf558, Myh11, Myocd and Kcne4 (Jepps et al., 2015). They also expressed Cspg4, encoding a proteoglycan that stimulates endothelial cell motility during microvascular morphogenesis and Ephx3, encoding a protein involved in water permeability barriers. They strongly expressed GM13889 (unknown function) and Mustn1 (muscle development).
Macrophages
The macrophages of Cluster 8 preferentially expressed genes observed in M2 (alternatively activated) macrophages, such as those encoding the complement components C1qa (Figure 2E), C1qb and Ciqc and the fractalkine receptor Cx3cr1 (Italiani and Boraschi, 2014). They also strongly expressed Cxcl2 (macrophage inflammatory protein 2), Pf4 (neutrophil and monocyte chemotaxis) Tyrobp (neutrophil activation), Plbd1 (hydrolase activity) and Spi1 (macrophage differentiation). Interestingly, none of the cells in this clusters expressed the mature macrophage marker Itgam (MAC-1), but many expressed Cd33, characteristic of immature macrophages.
Dendritic Cells/Monocytes
Most of the cells in Cluster 9 preferentially expressed Itgax (mature dendritic cell marker) and Cd209a (dendritic cell adhesion molecule), consistent with dendritic cell identity. However, these cells also expressed the NK gene Klrk1 (Figure 2E). This indicates that they are primarily NK dendritic cells, which possess cytotoxic capability. These cells are usually present as a small subset of dendritic cells in blood and tissue (Chan et al., 2006), but appear to represent about 40% of dendritic cells (Itgax+) in the ME. In common with Cluster 8, the dendritic cells and monocytes of Cluster 9 strongly expressed Tyrobp, Plbd1 and Spi. They also exclusively expressed Cd209a (pathogen receptor). As noted above, less differentiated monocytes expressed genes consistent with either the classical (pro-inflammatory) or resident (homeostatic) phenotypes.
Lymphocytes
Many of the lymphocytes of Clusters 10 expressed the T-cell receptor genes Cd3d and Cd3g, as well as CD3e and Cd3z, indicating that they are gamma/delta T-cells. Consistent with this identity, very few expressed Cd4. Gamma/delta T-cells are common in mucosal and other barrier tissues where they serve as part of the front-line defense against infection. Many also expressed Nkg7 (a natural killer cell granule protein) suggesting a cytotoxic phenotype. A small subpopulation expressed Cd8a and Cd8b1. Cd8ab-positive gamma-delta T-cells have been identified as a unique cytotoxic population that is negatively correlated with disease states (Kadivar et al., 2016). The larger population of Cd8–/Cd4– cells are known as double-negative T-cells. In other tissues, the majority of double-negative T-cells bear the alpha/beta receptors consistent with cognate immunity (Antonelli et al., 2006). However, in the ME mucosa the majority appear to bear the gamma/delta receptor more consistent with innate immune function. Gamma/delta T-cells are also involved in M2 macrophage polarization (Mathews et al., 2015). Cluster 10 cells also strongly expressed Ms4a4b, a negative regulator of T-cell proliferation.
The ILC2 cells of Cluster 14 type exclusively expressed Il5 and Il13, Th2 cytokines associated with this cell type, as well as Il1rl1 and Icos, which have been associated with helper cell function, and Cxcr6, associated with memory, naïve (Cd28+) and regulatory (Il7r+) T-cells. They also strongly expressed, Il1rl1 (possibly helper T-cell function), Ccdc184 (unknown function), and Calca (calcium regulation, antimicrobial).
The B-cells of Cluster 15 expressed many genes related to B-cell function, including Cd22 (essential for B-cell−B-cell interactions); Dank1 (mobilization of intracellular B-cell stores); Spi6 (B-cell development); Pou2af1 (essential for B-cell response to antigens), Ms4a1 (B-cell development) and various Fc receptor genes involved in B-cell activation. They also expressed Pax5, involved in early but not late B-cell development, suggesting that ME B-cells are not fully mature. A small number of cluster cells expressed Jchain, involved in the production of secretory factor.
In addition to evaluating differentially expressed genes, we applied an analysis of the GO: biological processes the genes for which were most highly expressed by different cell clusters. Not surprisingly the results summarized in Table 3, are largely consistent with functions that can be inferred from the differentially regulated genes presented above.
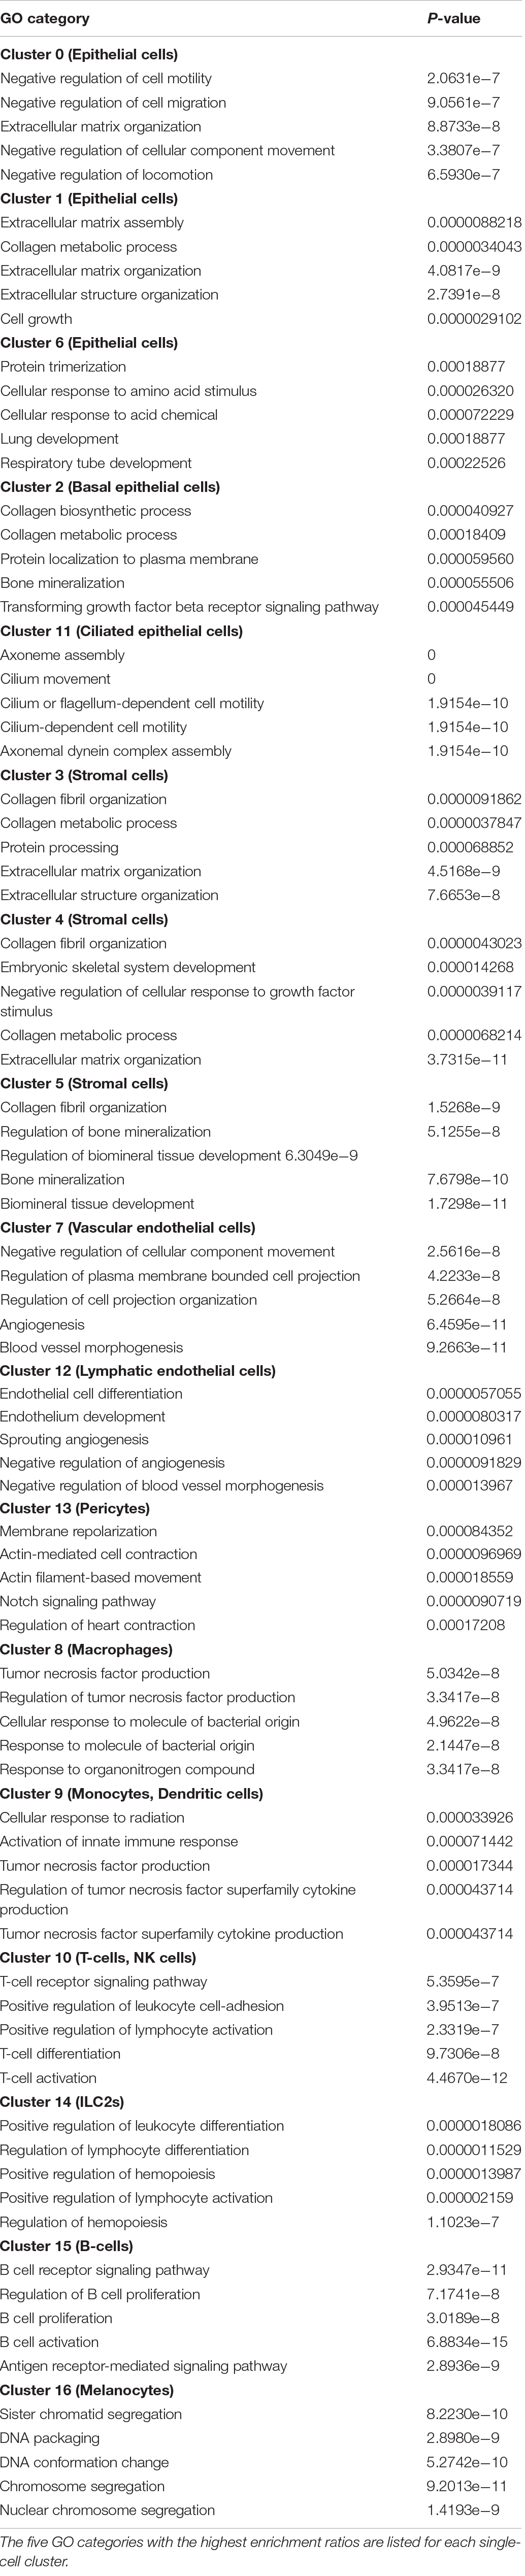
Table 3. Single-cell cluster enrichment of GO: biological process.
Expression of Innate Immune Genes by ME Cell Types
The genes reviewed above were identified based purely on differential expression across cell clusters. In order to evaluate the expression of genes specifically related to OM, we first assessed genes related to innate immunity across ME cell clusters and types. Acute OM in the average child resolves in less than one week (Little et al., 2001). This is not sufficient time to mount a robust cognate immune response, which implies that normal resolution of acute OM is mediated by innate immunity. Indeed, studies in mice with deletions of individual genes for innate immune receptors or effectors have found that, while lack of some genes leads to more severe deficits in recovery from bacterial OM, virtually all show a deficit (Kurabi et al., 2016). This finding indicates that the innate immune system participates in normal OM recovery, and that the genetic machinery with which to initiate innate immunity resides in the cells of the normal ME. We therefore evaluated the expression of genes in Mouse Genome Informatics GO category 0045087 “Innate Immunity.” Out of 809 genes in the category, expression of 805 was detected in cells of the normal ME.
For a few genes, there was broad expression across all ME cell types. These included Bipfa1 (contributes to airway surface liquid homeostasis and proper clearance of mucus) as well as three ribosomal proteins with innate immune subfunctions: Rpl13a (suppression of inflammatory genes); Rpl39 (viral gene transcription) and Rps19 (suppression of interferon production).
For a total of 520 innate immune genes, there were significant expression differences between cell types. A heat map illustrating the expression of the 520 genes across all ME cells is presented in Supplementary Figure S1, while Figure 5 shows the expression of a more readily visualized set of 109 innate immune genes, those with the most robust expression, ordered by cell type. Table 4 lists the most differentially expressed innate immune genes for each cell cluster. All clusters expressed distinct sets of innate immune genes.
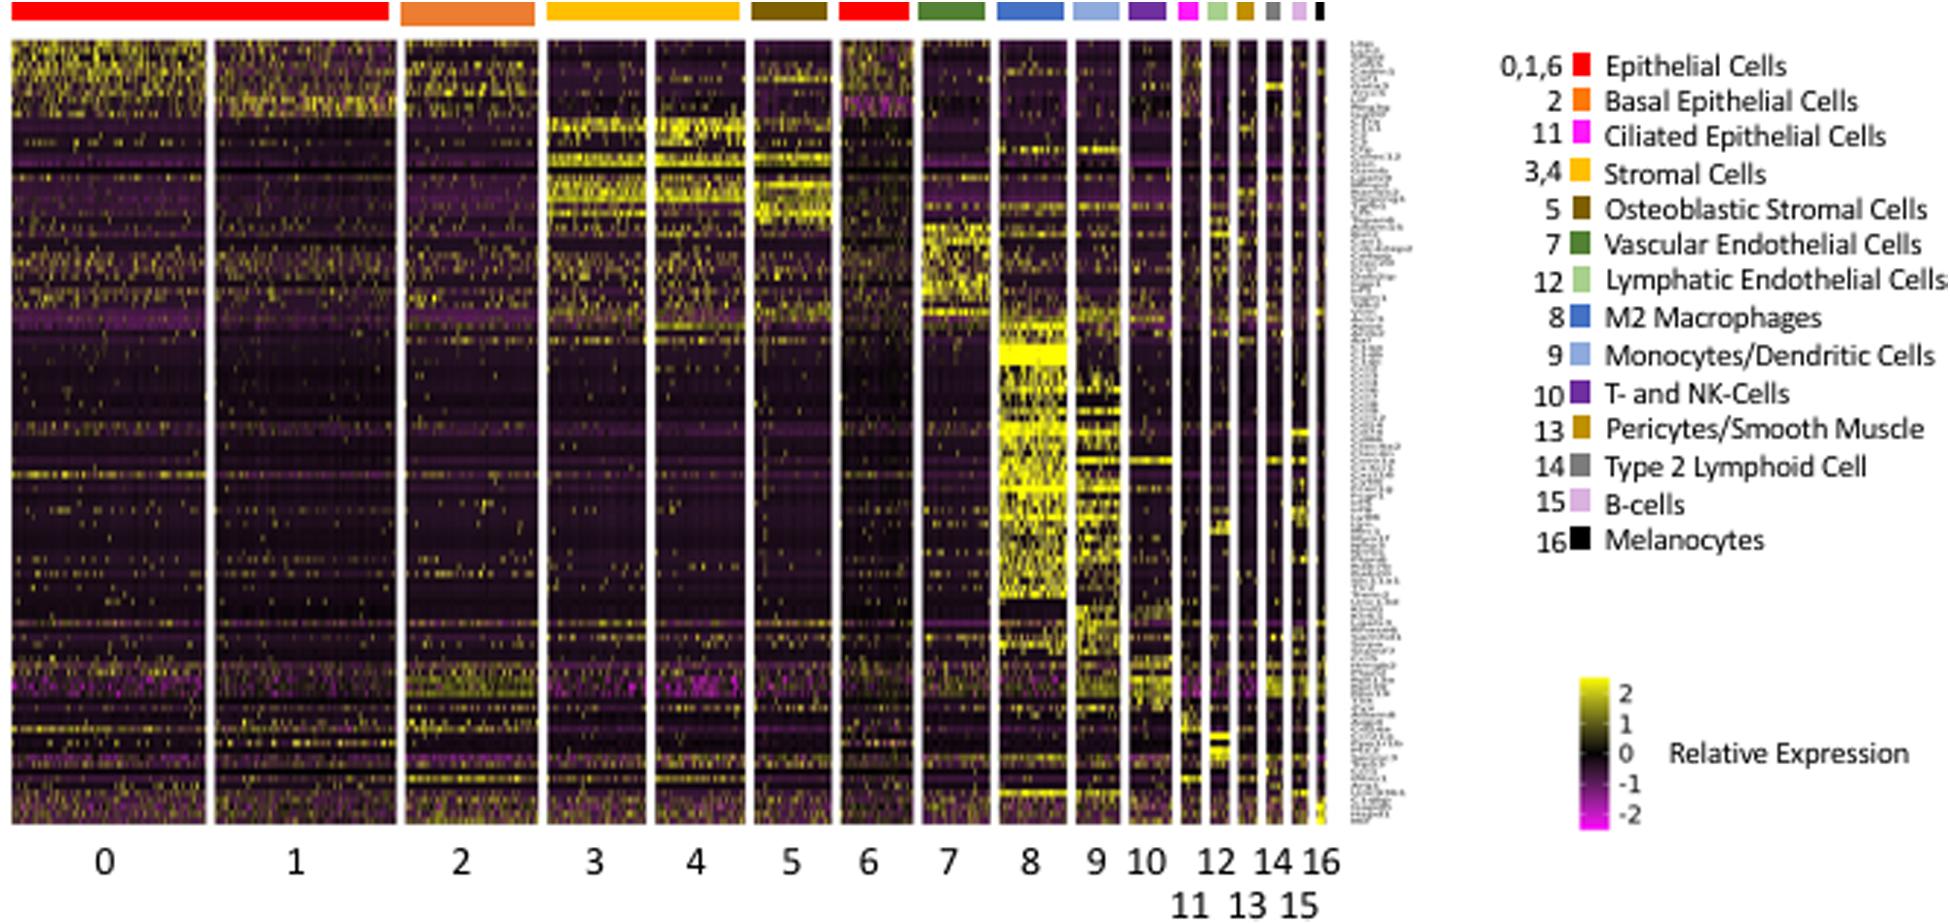
Figure 5. Heatmap illustrating the expression of the 109 most differentially regulated innate immune genes, arranged by cell cluster in which they are differentially expressed. Cluster 8 cells (macrophages) expressed the greatest number.

Table 4. Single-cell Cluster Expression of Innate Immune Genes.
The epithelial cells of Cluster 0 expressed Lbp (component of the endotoxin receptor), Lcl2 (antibacterial protein) Sftpd (surfactant protein D), Xrcc5 (antiviral response) Cd55 (negative complement regulator) and Hmgb2 (innate immune DNA/RNA receptor). They also expressed genes related to leukocyte recruitment and activation, including Csf1 (macrophage differentiation) and Cxcl16 (T-cell recruitment). Cluster 1 epithelial cells expressed the genes for the anti-microbials lactoferrin and REG3γ, and the interferon-stimulated antivirals CD25 and ISG20. The basal epithelial cells of Cluster 2 expressed several complement genes, as well as Axl (TLR inhibition), Rab20 (antibacterial response), and the anti-viral gene Ifit1. Cluster 6 epithelial cells expressed Sftpd. The ciliated epithelial cells of Cluster 11 expressed a small set of diverse innate immune genes including Hist1b2bc (antibacterial responses), Il1rn1 (receptor-blocking inhibitor of IL1ß), Ifit1, and Aqp4.
Innate immune genes expressed by all stromal cells of Clusters 3, 4 and 5 included Colec12, (antimicrobial response), Mmp2 (positive regulator of inflammatory NFκB signaling), Rarres2 (chemotactic and anti-inflammatory factor), and Serpinb1 (negative complement regulation). Clusters 3 and 4 uniquely expressed several complement factors and Lgals9 (soluble, negative regulator of T- and NK-cells). Cluster 4 expressed the complement factor gene C2. Clusters 3 and 5 expressed Cfn (negative complement regulator), while Cluster 5 expressed Tgfb1 (multifunctional, including inhibition of T-cell Th1, Th2 and cytotoxic phenotypes) and Tspan6 (negative regulator of innate immunity).
The vascular endothelial cells of Clusters 7 expressed Adam15 (epithelial−T-cell interactions) Cav1 (T-cell activation, negative regulation of TGFß1), Cebpg (IL4 gene activation), Dab2ip (participates in TNF, IFN and LPS signaling pathways), Iigp1 (IFN-inducible antimicrobial), Irf1 (IFN production), Irgm1 (IFN-induced negative regulator of mucosal immune responses), Vim (viral and bacterial attachment) and Samhd1 (response to virus, mediation of TNF response).
The lymphatic endothelial cells of Cluster 12 strongly expressed Tspan6, Mrc1, Ccl21a (all described above) as well as Bst2 (antiviral), Arrb2 (involved in multiple signaling pathways including that of CCL19), Ptx3 (positive regulation of innate response to pathogens) and Serinc3 (resistance to viral infection).
The pericytes of Cluster 13 expressed the complement gene C1s1, Cav1 (negative regulator of inflammation) and Ifitm1.
Some of the innate immune genes expressed by Cluster 8 macrophages are marker genes for this cell types, as noted above. Also expressed preferentially by this cell type were nine genes related to pathogen receptor signaling, a total of ten chemotactic chemokine genes, four genes related to complement response, six immune modulators including four negative regulators and the antibacterial gene Scl11a1.
Cluster 9 monocytes and dendritic cells preferentially expressed a subset of the genes expressed by Cluster 8 macrophages, but also expressed two genes encoding NK cell lectins related to cytotoxicity, Klrd1 and Klrk1; Lgals3 (PMN and mast cell activation, macrophage chemotaxis); Rnase6 (antibacterial); Samhd1 (antiviral responses); Sirpa (negative regulation of dendritic cells and phagocytosis); Slamf7 (killer cell activation); and Unc93b1 (intracellular TLR transport).
The T-cells and NK cells of cluster 10 strongly expressed Coro1a (required for lytic granule secretion from cytotoxic cells), Klrd1, Klrk1, Ccl5 (leukocyte chemoattractant or chemotaxis inhibitor, depending on splicing), Hmgb2 (innate immune DNA/RNA receptor), Rpl14a (ribosomal protein upregulated by endotoxin, Ceppi et al., 2009) and Txk (involved in Th1 cytokine production). The ILC2s of Cluster 14 expressed Cor1a, Samhd1, Ccl1 (monocyte chemotaxis), Arg1 (promotes acute type 2 inflammation), and C1qbp (involved in multiple infection and inflammatory responses). The B cells of Cluster 15 expressed Cd74 (MIF receptor), Corol1a, Irf8 (regulates IFN responses), Ly86 (involved in endotoxin response with TLR4), Ptpn6 (hematopoietic cell signaling), Slamf7 (NK cell activation) and Unc93b1.
The melanocytes of Cluster 16 strongly expressed Vim, Gapdh (in innate immunity, IFNg-induced transcript-selective translation inhibition) and Mif (regulation of macrophage function).
Discussion
The results of this study provide, for the first time, a molecular landscape of the cells that make up the normal mucosal lining of the ME prior to OM. They also identify the resting ME cells that express major determinants of innate immunity. As noted above, innate immunity is responsible for the normal resolution of OM (e.g., Underwood and Bakaletz, 2011; Kurabi et al., 2016). The immediate response provided by the cell of the normal ME is critical to initiating this first line of defense against infection. We found that the cells of the ME have distinctly different potential capacities to contribute immediately to innate immunity. Our results also provide a baseline against which to measure the responses of ME cells to infection in future studies.
Cell Types of the Normal ME
Seurat PCA analysis of 6,370 ME cells identified 17 cell clusters, each of which displayed a distinct set of genes. The expression of key genes by most of these clusters correspond to cell types that have been observed previously in the ME, while others identify cells not previously known to be present.
Epithelial Cells
As noted above, previous authors have proposed five (Lim and Hussl, 1969; Lim, 1979) or six (Hentzer, 1976) morphological categories of ME epithelial cells: basal, intermediate, non-secretory, intermediary secretory, secretory and ciliated epithelial cells. Our transcriptome data are more consistent with five subtypes. Of the five clusters of cells expressing epithelial markers, basal (Cluster 2) and (Cluster 11) ciliated epithelial cell clusters were clearly identified. The three remaining clusters, 0, 1, and 6, were less differentiated by gene expression and presumably less specialized. However, Cluster 1 showed the highest expression of genes encoding secreted factors, including mucins, indicating that this cluster likely consists of fully developed secretory epithelial cells. Secretory genes were expressed at progressively lower levels in Clusters 6 and 0. However, Cluster 0 exclusively expressed surfactant D, also suggestive of an epithelial surface location, and the most innate immune genes of any epithelial type, indicating a prominent role in initial defense of the ME. This cluster may thus represent the morphologically defined “non-secretory” surface epithelial cells. Cluster 6 gene expression was intermediate between that of Clusters 0 and 1, consistent with an intermediate epithelial cell capable of transitioning into either of these two phenotypes.
Regarding the two disparate origins of ME epithelial cells noted by Thompson and Tucker (2013), neural crest versus branchial arch endoderm, there are no recognized adult gene markers for cells of neural crest origin. The small number of melanocytes observed in Cluster 16, which were scattered through epithelial clusters in the Seurat analysis and are assumed to be of neural crest origin (Lin and Zak, 1982), did not express epithelial markers. In addition, we saw no categories of ME epithelial cells that might reasonably be supposed to correspond to this division. It seems likely that dissection of the ME mucosa from the corresponding regions prior to single-cell analysis would be required to determine whether different embryologic origins correspond to any transcriptome and/or functional variations.
Stromal Cells
Based on their morphology, ME stromal cells have generally been classified as fibrocytes, with little further distinction. Clusters 3, 4, and 5 were identified as stromal by the expression of many ECM genes. Cluster 5, expressing bone formation genes, appears to correspond to osteoblastic cells. The ME has a strong propensity to generate new bone beneath the stromal layer during OM (Cayé-Thomasen et al., 1999). Cluster 3 was characterized by preferential expression of genes targeting tissue growth, including that of epithelial cells, while cluster 4 expressed genes encoding antimicrobials. These clusters indicate the presence of two additional classes of stromal cells in the ME, cell types not previously recognized on morphological or histochemical grounds.
Vascular Cells
Blood vessels, although sparse in the ME, have long been recognized (Lim, 1979). Therefore the vascular endothelial cells of Cluster 8 were to be expected. Morphological studies have also noted the presence of lymphatics in the ME based (Lim and Hussl, 1975), and drainage from the ME to lymph nodes of the neck has been demonstrated (Galich, 1973; Lim and Hussl, 1975), validating lymphatic endothelial cells of Cluster 9 cells. The documentation of capillaries and post-capillary venules in the ME (e.g., Goldie and Hellström, 1990) makes the observation of pericytes in Cluster 13 unremarkable. Gene expression related to hypoxia, contractility and water permeability are consistent with pericyte regulation of vascular tone, based on oxygen tension, and fluid entry into the ME.
Leukocytes
Clusters 8 and 9 expressed monocyte markers, while most Cluster 8 cells also expressed macrophage genes consistent with an M2 (alternatively activated) phenotype. Macrophages have been documented in the normal ME (Takahashi et al., 1989; Jecker et al., 1996), but the M2 phenotype has not previously been appreciated. The dendritic cells and less defined monocytes of Cluster 9 have also been noted before in the ME (Jecker et al., 1996). The expression of genes associated with cytotoxicity by dendritic cells indicates a killer phenotype, not recognized previously at this site. Less differentiated monocytes of the classical and resident phenotypes have also not previously been differentiated in the resting ME.
Cells in Clusters 10, 14, and 15 expressed a lymphocyte marker gene Ptprcap. Cluster 10 also expressed T-cell and NK-cell genes, while Cluster 15 expressed genes found in B-cells. All three of these lymphocyte types have been reported from the ME (Takahashi et al., 1989). However, the ILC2s of Cluster 14 were not previously reported to be present in the ME.
The number of leukocytes in the normal ME mucosa has often been reported to be relatively low (e.g., Takahashi et al., 1989), and lymphocytes to be especially uncommon (Jecker et al., 1996). However, we observed a substantial number of leukocytes (14.7%) in our normal ME cell samples. This disparity could be caused by differential survival of cells through the tissue digestion and cellular dispersion processes employed. However, it seems unlikely that leukocytes would be dramatically more resistant to these procedures than other cells. Another potential explanation is the diversity of subtypes and the difficulty of definitively identifying leukocytes. For example, many investigators have used the MAC1 antibody, which labels the Itgam gene product present in mature macrophages, to identify these cells. However, we found that few macrophages in the normal ME expressed this gene, since the macrophages were likely M2 cells of incomplete maturity.
It should be noted that not all leukocytes known to be present in the ME were found in this study. Several groups (e.g., Watanabe et al., 1991), including our own (Ebmeyer et al., 2005), have documented the presence of mast cells in the normal ME mucosa. Despite this, we were unable to identify any consistent mast cell gene signatures in our cell samples. For example, the entire family of seven mast cell protease (Mcpt) genes showed no expression in any of our ME cells. Other mast cell markers were either absent or were expressed in various cells that had been identified as other cell types with no consistent pattern. The reasons for this are not clear. The number of mast cells in the ME mucosa is not high, so this could represent a sampling issue. Alternatively, the C57BL/6 mouse used in this study may lack ME mast cells, as compared to the guinea pig or WB/B6F1 hybrid mice used in the above studies. However, it seems most likely that mast cells did not survive the cell dissociation method used in this study. The fragility of mast cells isolated from tissues has been noted by others (Kulka and Metcalfe, 2010).
With the exception of mast cells, we were thus able to identify all of the cell types that have been identified previously in the ME using alternative methodologies. In addition, we added new types not previously identified in the normal tympanic cavity. Finally, we obtained a sufficient number of cells for each type to evaluate their individual transcriptomes. This allowed us to achieve our goal of documenting the differences in cell function, as well as the expression of innate immune genes across ME cell types.
Differential Functions of ME Cell Types
Expression differences identified by clustering analysis and screening of innate immune gene beyond those that specified cell identity, provided clues as to the functional role of cells in the normal ME.
Epithelial Cells
The movement of fluids across the mucosal epithelium into and out of the ME is clearly an important aspect of ME homeostasis, OM pathogenesis and fluid clearance during recovery from infection. As indicated by claudin gene expression, the cells of the epithelium are joined by tight junctions. Therefore the expression of genes involved in fluid/solute transport across cell membranes by all epithelial clusters is not unexpected, as is expression of the surface liquid layer homeostasis gene Bipfa1. Cluster 1 epithelial cells also expressed many genes consistent with presence at the epithelial surface and with secretory activity, including cell-surface and secreted mucins as well as antimicrobials. Cluster 0 similarly expressed antimicrobials, along with surfactant D and ECM-binding genes, suggesting a possible role in basement membrane interactions and that secretory activity is distributed across more than one epithelial cell type. As noted above, Cluster 6 gene expression overlapped with that of Cluster 0 and 1, suggesting an intermediate phenotype. The expression of genes related to tissue proliferation by the basal epithelial cells of Cluster 2 are consistent with them being a source of epithelial cells. However, they also expressed beta defensin 1, further evidence that secretory activity is distributed. Assuming that basal cells are located below the epithelial surface, this antimicrobial may defend against bacteria that invade the mucosa. Cluster 11 ciliated cells expressed Aqp4 and Muc4. Altogether, epithelial cells of the ME mucosa appear specialized for fluid transport and secretory activity.
Stromal Cells
The expression of genes by stromal cell clusters was dominated by those related to ECM generation and remodeling. Cluster 3 cells appear also to be specialized for the regulation of epithelial and stromal cell growth, while Cluster 5 cells are likely involved in bone maintenance and remodeling.
Vascular Cells
The vascular endothelial cells of Cluster 7 expressed many genes involved in vascular permeability and fluid transport. They therefore work in combination with epithelial cells as the principle regulators of fluid balance in the ME. Not surprisingly, they also expressed genes involved in the recruitment of leukocytes and angiogenesis. Interestingly, vascular and lymphatic endothelial cells each preferentially expressed a different decoy cytokine receptor, which could serve to limit inflammation. Expression of genes involved in hypoxia responses and in regulating vascular tone is typical of pericytes.
Leukocytes
Not surprisingly, most of the genes preferentially expressed by leukocytes were involved in immune and inflammatory responses. However, the M2 phenotype and expression of negative immune regulators by the macrophages of Cluster 8 are consistent with a homeostatic and anti-inflammatory role, rather than the pro-inflammatory phenotype of classically activated macrophages. Gene expression by dendritic cells and other monocytes of Cluster 9 was similar, although somewhat fewer genes were preferentially expressed. The lymphocyte types of Clusters 10, 14 and 15 preferentially expressed genes consistent with their expected functions.
Innate Immune Genes and the Defense of the ME
Infection of the ME activates an innate immune response extremely rapidly (MacArthur et al., 2013; Hernandez et al., 2015). This initial response is likely based largely on the repertoire of innate immune receptor and effector genes that are expressed by the cells of the normal ME. Disruption of many individual innate immune genes in mice has been shown to reduce the effectiveness of this innate response to infection, and to prolong OM. Moreover, several studies have identified polymorphisms in human innate immune genes that are linked to otitis media proneness in patients (see Kurabi et al., 2016 for a recent review). These studies underscore the importance of innate immunity in the immediate and long-term defense of the ME, which was our rationale for focusing on these genes in ME cell transcriptomes.
As can be seen from Figure 5, expression of innate immune genes is distributed across the various cell types of the ME. Epithelial cells appear specialized for the detection and response to pathogens, including the secretion of antibacterial peptides. However, they also expressed genes related to leukocyte recruitment and activation.
Stromal cells expressed several complement factors and pro-inflammatory genes, suggesting potential involvement in active inflammation. They also expressed many negative immune regulators, not only of complement but also of innate immunity in general as well as T- and NK-cells. They thus appear to serve as inhibitory modulators of inflammation to a greater extent than epithelial cells.
Endothelial cells and pericytes expressed several genes involved in the activation of inflammatory pathways and T-cells, but also several negative immune regulators.
The M2 macrophages in the ME expressed by far the most innate immune genes, with an emphasis on pathogen detection, leukocyte chemotaxis, complement activation, and both positive and negative inflammatory regulation. Their phenotype is consistent with immune homeostasis, but also readiness to act in case of infection. Monocytes/dendritic cell gene expression was similar to that seen in macrophages, but cytotoxic genes were additionally expressed.
The lymphocytes of cluster 10 were primarily gamma-delta T-cells that typically have an innate immune function, and consequently expressed several pathogen receptors and innate immune effectors. Cytotoxic T-cells and NK-cells were also present in this cluster. The ILC2s of cluster 14 expressed several genes involved in T-cell regulation and induction of inflammation. The B-cells of cluster 15, as expected, expressed genes related to antibody production.
In addition to individual genes, the GO: biological process gene categories that were most regulated in macrophages and monocytes are all subcategories of the GO category for innate immunity. For the remaining ME cell types, innate immunity was not among the GO categories with the highest degree of regulation. This is not surprising, since unlike macrophages and monocytes, the primary functions of these cells are not innate immunity. However, the fact that they also express many innate immune genes underscores the importance of innate immunity in virtually all ME cell types.
A striking feature of innate immune gene expression in normal ME cells was the large number of negative regulators of immunity and inflammation observed in the transcriptomes of many different cell types, in parallel with to pro-inflammatory genes. This pattern of expression suggests that, while the cells of the ME are primed to respond to infection by generating inflammation and other antimicrobial responses, these processes are actively held in check by immune inhibitory genes to ensure ME mucosal homeostasis. This not only must pro-inflammatory gene products be activated by pathogens at the initiation of OM, anti-inflammatory genes may need to be downregulated to allow maximally effective innate immunity to defend the ME. Other investigators have noted the importance of endogenous negative regulators in ameliorating OM Pathogenesis (e.g., Li et al., CYLD). Our results add a large number of additional negative regulators which were distributed across diverse ME cell types.
Limitations of the Study
Our analysis of single-cell transcriptomes is subject to a number of methodological limitations. As noted above, the numbers of different cell types recovered is dependent upon the survival of cells through the enzymatic digestion and dispersion techniques. While we were able to document an effect of this for mast cells, the extent to which selection bias may have influenced our other cell populations is not clear. Fortunately, we obtained sufficient numbers of cells in all cell populations to adequately survey gene transcription. However, the proportions of each cell type in our samples should not be taken to represent their relative abundance in vivo.
Another limiting effect is related to the limited number of genes that can be recovered from an individual cell. This means that abundant mRNAs are more likely to be represented than scarce transcripts. It has been argued that the detection of scarce mRNAs is stochastic, and that combining the results of 20 or more cells approaches the results of bulk RNASeq (Marinov et al., 2014). However, the possibility that scarcer transcripts were missed in a given cell population must be considered.
Other limitations reflect the nature of gene responses to infection. It is of course certain that the expression of innate immune and other genes by ME cells would change dramatically upon infection, and that some of these changes would be very rapid (MacArthur et al., 2013; Hernandez et al., 2015). Therefore, the roles of ME cells in the initial stage of OM, and beyond, would correspondingly change. Our data reflect only pre-existing mRNAs that may be expressed in readiness for a pathogen challenge. We plan to assess the results of infection on the transcriptomes of ME cell types. This work is in progress, and will be the basis of a future report. We felt that including results from infected ME cells would have made this paper unacceptably long.
Conclusion
The results of this study establish, for the first time, the differences that exist between the transcriptomes of cells in the normal ME. They identify not only previously known cell types, but also show the presence of novel cell types and subtypes. The genes that differentiate these cell types provide information on their roles in ME homeostasis, and their ability to respond immediately to infection. The results also provide a baseline from which to assess the molecular responses of ME cells to infection.
Data Availability Statement
The single cell transcriptome data is available in GEO (GSE146244, https://www.ncbi.nlm.nih.gov/geo/query/acc.cgi?acc=GSE146244).
Ethics Statement
The animal study was reviewed and approved by the Institutional Animal Care and Use Committee of the VA San Diego Medical Center.
Author Contributions
AR and AK wrote the main manuscript. KP, CD, and AK preformed the wet laboratory experiments. CN, KF, and NW performed the bioinformatics analyses. AR and CN generated the figures and table. All authors reviewed the final version of the manuscript.
Funding
This study was supported by grants from the NIH/NIDCD (DC006279, DC000129, and DC012595) and the Research Service of the VA (1I1BX001205) to AR, DC014801 to AK, and CA196853, CA155435, CA023100, and HD012303, VA Merit Review I01BX000130, and Senior Research Career Scientist Award BX002709 to NW, and NIH grant UL1TR001442 to the UCSD Clinical and Translational Research Institute.
Conflict of Interest
AR is a co-founder of Otonomy Inc., serves as a member of the Scientific Advisory Board, and holds an equity position in the company. The UCSD Committee on Conflict of Interest has approved this relationship. Otonomy, Inc., played no part in the research reported here.
The remaining authors declare that the research was conducted in the absence of any commercial or financial relationships that could be construed as a potential conflict of interest.
Supplementary Material
The Supplementary Material for this article can be found online at: https://www.frontiersin.org/articles/10.3389/fgene.2020.00358/full#supplementary-material
FIGURE S1 | A heat map illustrating the expression of the 520 differentially expressed genes, arranged alphabetically, across ME cell clusters.
References
Ahmed, S., Shapiro, N. L., and Bhattacharyya, N. (2014). Incremental health care utilization and costs for acute otitis media in children. Laryngoscope 124, 301–305. doi: 10.1002/lary.24190
Antonelli, L. R., Dutra, W. O., Oliveira, R. R., Torres, K. C., Guimarães, L. H., Bacellar, O., et al. (2006). Disparate immunoregulatory potentials for double-negative (CD4− CD8−) αβ and γδ T cells from human patients with cutaneous leishmaniasis. Infect. Immun. 74, 6317–6323. doi: 10.1128/iai.00890-06
Arguedas, A., Kvaerner, K., Liese, J., Schilder, A. G., and Pelton, S. I. (2010). Otitis media across nine countries: disease burden and management. Int. J. Pediatr. Otorhinolaryngol. 74, 1419–1424. doi: 10.1016/j.ijporl.2010.09.022
Cayé-Thomasen, P., Hermansson, A., Tos, M., and Prellner, K. (1999). Bone modeling dynamics in acute otitis media. Laryngoscope 109, 723–729. doi: 10.1097/00005537-199905000-00009
Ceppi, M., Clavarino, G., Gatti, E., Schmidt, E. K., de Gassart, A., Blankenship, D., et al. (2009). Ribosomal protein mRNAs are translationally-regulated during human dendritic cells activation by LPS. Immunome Res. 5:5. doi: 10.1186/1745-7580-5-5
Chan, C. W., Crafton, E., Fan, H. N., Flook, J., Yoshimura, K., Skarica, M., et al. (2006). Interferon-producing killer dendritic cells provide a link between innate and adaptive immunity. Nat. Med. 12, 207–213. doi: 10.1038/nm1352
Cullen, K. A., Hall, M. J., and Golosinskiy, A. (2009). Ambulatory surgery in the United States. Natl. Health Stat. Rpt. 11, 1–25.
Ebmeyer, J., Furukawa, M., Pak, K., Ebmeyer, U., Sudhoff, H., Broide, D., et al. (2005). Role of mast cells in otitis media. J. Allergy Clin. Immunol. 116, 1129–1135.
Friel-Patti, S., Finitzo-Hieber, T., Conti, G., and Brown, K. C. (1982). Language delay in infants associated with middle ear disease and mild, fluctuating hearing impairment. Pediatr. Infect Dis. 1, 104–109. doi: 10.1097/00006454-198203000-00008
Galich, R. (1973). Lymphatics in middle ear effusion. Laryngoscope 83, 1713–1716. doi: 10.1288/00005537-197310000-00011
Gasteiger, G., D’Osualdo, A., Schubert, D. A., Weber, A., Bruscia, E. M., and Hartl, D. (2017). Cellular innate immunity: an old game with new players. J. Innate Immun. 9, 111–125. doi: 10.1159/000453397
Goldie, P., and Hellström, S. (1990). Identification and characterization of middle ear vascular leakage sites in experimental otitis media. Ann. Otol. Rhinol. Laryngol. 99, 810–816. doi: 10.1177/000348949009901011
Gordon, S., and Taylor, P. R. (2005). Monocyte and macrophage heterogeneity. Nat. Rev. Immunol. 5, 953–964. doi: 10.1038/nri1733
Hackett, N. R., Shaykhiev, R., Walters, M. S., Wang, R., Zwick, R. K., Ferris, B., et al. (2011). The human airway epithelial basal cell transcriptome. PLoS One 6:e18378. doi: 10.1371/journal.pone.0018378
Hentzer, E. (1970). Histologic studies of the normal mucosa in the middle ear, mastoid cavities and Eustachian tube. Ann. Otol. Rhinol. Laryngol. 79, 825–833. doi: 10.1177/000348947007900414
Hentzer, E. (1976). Ultrastructure of the middle ear mucosa. Ann. Otol. Rhinol. Laryngol. 85, 30–35. doi: 10.1177/00034894760850s208
Hernandez, M., Leichtle, A., Pak, K., Webster, N. J., Wasserman, S. I., and Ryan, A. F. (2015). The transcriptome of a complete episode of acute otitis media. BMC Genomics 16:259. doi: 10.1186/s12864-015-1475-7
Hoh, R., Stowe, T., Turk, E., and Stearns, T. (2012). Transcriptional program of ciliated epithelial cells reveals new cilium and centrosome components and links to human disease. PLoS One 7:e52166. doi: 10.1371/journal.pone.0052166
Italiani, P., and Boraschi, D. (2014). From monocytes to M1/M2 macrophages: phenotypical vs. functional differentiation. Front. Immunol. 5:514. doi: 10.3389/fimmu.2014.00514
Jecker, P., Pabst, R., and Westermann, J. (1996). The mucosa of the middle ear and Eustachian tube in the young rat: number of granulocytes, macrophages, dendritic cells, NK cells and T and B lymphocytes in healthy animals and during otitis media. Acta Otolaryn. 116, 443–450. doi: 10.3109/00016489609137871
Jepps, T., Carr, G., Lundegaard, P., Olesen, S., and Greenwood, I. (2015). Fundamental role for the KCNE4 ancillary subunit in Kv7.4 regulation of arterial tone. J. Physiol. 593, 5325–5340. doi: 10.1113/jp271286
Kadivar, M., Petersson, J., Svensson, L., and Marsal, J. (2016). CD8αβ+ γδ T cells: a novel T cell subset with a potential role in inflammatory bowel disease. J. Immunol. 197, 4584–4592. doi: 10.4049/jimmunol.1601146
Kolmer, W., and Mellendorff, M. (1927). Handbuch der mikroskopische anatomie des menchen. JAMA 89, 2215–2216.
Kulka, M., and Metcalfe, D. D. (2010). Isolation of tissue mast cells. Curr. Protoc. Immunol. 7, 7–25.
Kurabi, A., Pak, K., Dang, X., Coimbra, R., Eliceiri, B. P., Ryan, A. F., et al. (2013). Ecrg4 attenuates the inflammatory proliferative response of mucosal epithelial cells to infection. PLoS One 8:e61394. doi: 10.1371/journal.pone.0061394
Kurabi, A., Pak, K., Ryan, A. F., and Wasserman, S. I. (2016). Innate immunity: orchestrating inflammation and resolution of otitis media. Curr. Allergy Asthma Rep. 16:6.
Leichtle, A., Lai, Y., Wollenberg, B., Wasserman, S. I., and Ryan, A. F. (2011). Innate signaling in otitis media: pathogenesis and recovery. Curr. Allergy Asthma Rep. 11, 78–84. doi: 10.1007/s11882-010-0158-3
Lim, D. J. (1979). Normal and pathological mucosa of the middle ear and eustachian tube. Clin. Otolaryngol. Allied Sci. 4, 213–232. doi: 10.1111/j.1365-2273.1979.tb01888.x
Lim, D. J., and Hussl, B. (1969). Human middle ear epithelium. An ultrastructural and cytochemical study. Arch. Otolaryngol. 89, 835–849. doi: 10.1001/archotol.1969.00770020837009
Lim, D. J., and Hussl, B. (1975). Macromolecular transport by the middle ear and its lymphatic system. Acta Otolaryngol. 80, 19–31. doi: 10.3109/00016487509121296
Lin, C. S., and Zak, F. G. (1982). Studies on melanocytes. VI. Melanocytes in the middle ear. Arch. Otolaryngol. 108, 489–490. doi: 10.1001/archotol.1982.00790560027007
Little, P., Gould, C., Williamson, I., Moore, M., Warner, G., and Dunleavey, J. (2001). Pragmatic randomised controlled trial of two prescribing strategies for childhood acute otitis media. BMJ 322, 336–342. doi: 10.1136/bmj.322.7282.336
Luo, W., Yi, H., Taylor, J., Li, J. D., Chi, F., Todd, N. W., et al. (2017). Cilia distribution and polarity in the epithelial lining of the mouse middle ear cavity. Sci. Rep. 7:45870.
MacArthur, C. J., Hausman, F., Kempton, J. B., Choi, D., and Trune, D. R. (2013). Otitis media impacts hundreds of mouse middle and inner ear genes. PLoS One 8:e75213. doi: 10.1371/journal.pone.0075213
Marinov, G., Williams, B., Gertz, J., Myers, R., and Wold, B. (2014). From single-cell to cell-pool transcriptomes: stochasticity in gene expression and RNA splicing. Genome Res. 24, 496–510. doi: 10.1101/gr.161034.113
Mathews, J. A., Kasahara, D. I., Ribeiro, L., Wurmbrand, A. P., Ninin, F. M., and Shore, S. A. (2015). γδ T cells are required for m2 macrophage polarization and resolution of ozone-induced pulmonary inflammation in mice. PLoS One 10:e0131236. doi: 10.1371/journal.pone.0131236
Rosenfeld, R., and Bluestone, C. (2003). Evidence Based Otitis Media, 2nd Edn. Philadelphia, PA: Decker.
Rye, M. S., Bhutta, M. F., Cheeseman, M. T., Burgner, D., Blackwell, J. M., Brown, S. D., et al. (2011). Unraveling the genetics of otitis media: from mouse to human and back again. Mamm. Genome 22, 66–82. doi: 10.1007/s00335-010-9295-1
Satija, R., Farrell, J. A., Gennert, D., Schier, A. F., and Regev, A. (2015). Spatial reconstruction of single-cell gene expression data. Nat. Biotechnol. 33, 495–502. doi: 10.1038/nbt.3192
Stenfors, L. E., Albiin, N., Bloom, G. D., Hellström, S., and Widemar, L. (1985). Mast cells and middle ear effusion. Am. J. Otolaryngol. 6, 217–219. doi: 10.1016/s0196-0709(85)80088-0
Takahashi, M., Peppard, J., and Harris, J. P. (1989). Immunohistochemical study of murine middle ear and Eustachian tube. Acta Otolaryngol. 107, 97–103. doi: 10.3109/00016488909127485
Thompson, H., and Tucker, A. (2013). Dual origin of the epithelium of the mammalian middle ear. Science 339, 1453–1456. doi: 10.1126/science.1232862
Underwood, M., and Bakaletz, L. (2011). Innate immunity and the role of defensins in otitis media. Curr. Allergy Asthma Rep. 11, 499–507. doi: 10.1007/s11882-011-0223-6
Watanabe, T., Kawauchi, H., Fujiyoshi, T., and Mogi, G. (1991). Distribution of mast cells in the tubotympanum of guinea pigs. Ann. Otol. Rhinol. Laryngol. 100, 407–412. doi: 10.1177/000348949110000511
Wendler-Shaw, P., Menyuk, P., and Teele, D. (1993). “Effects of otitis media in first year of life on language production in the second year of life,” in Recent Advances in Otitis Media, ed. D. Lim (Philadephia, PA: Decker).
Yang, R., Zheng, Y., Li, L., Liu, S., Burrows, M., Wei, Z., et al. (2014). Direct conversion of mouse and human fibroblasts to functional melanocytes by defined factors. Nat. Commun. 5:5807.
Zaiss, D. M. W., Gause, W. C., Osborne, L. C., and Artis, D. (2015). Emerging functions of amphiregulin in orchestrating immunity, inflammation, and tissue repair. Immunity 42, 216–226. doi: 10.1016/j.immuni.2015.01.020
Keywords: single-cell, middle ear, otitis media, cluster-profiling, homeostasis
Citation: Ryan AF, Nasamran CA, Pak K, Draf C, Fisch KM, Webster N and Kurabi A (2020) Single-Cell Transcriptomes Reveal a Complex Cellular Landscape in the Middle Ear and Differential Capacities for Acute Response to Infection. Front. Genet. 11:358. doi: 10.3389/fgene.2020.00358
Received: 09 August 2019; Accepted: 24 March 2020;
Published: 15 April 2020.
Edited by:
Amélie Bonnefond, Institut National de la Santé et de la Recherche Médicale (INSERM), FranceReviewed by:
Fabien Delahaye, Institut Pasteur de Lille, FranceNelson L. S. Tang, The Chinese University of Hong Kong, China
Copyright © 2020 Ryan, Nasamran, Pak, Draf, Fisch, Webster and Kurabi. This is an open-access article distributed under the terms of the Creative Commons Attribution License (CC BY). The use, distribution or reproduction in other forums is permitted, provided the original author(s) and the copyright owner(s) are credited and that the original publication in this journal is cited, in accordance with accepted academic practice. No use, distribution or reproduction is permitted which does not comply with these terms.
*Correspondence: Allen F. Ryan, YWZyeWFuQHVjc2QuZWR1