 Wanjing Lei1
 Han Zeng2
 Hua Feng3,4
 Xufang Ru3,4
 Qiang Li3,4
 Ming Xiao1
 Huiru Zheng5
 Yujie Chen3,4*
 Le Zhang1,2*
- 1College of Computer Science, Sichuan University, Chengdu, China
- 2College of Computer and Information Science, Southwest University, Chongqing, China
- 3Department of Neurosurgery, Southwest Hospital, Third Military Medical University, Chongqing, China
- 4State Key Laboratory of Trauma, Burn and Combined Injury, Third Military Medical University, Chongqing, China
- 5School of Computing, Ulster University, Coleraine, United Kingdom
Subarachnoid hemorrhage (SAH) is devastating disease with high mortality, high disability rate, and poor clinical prognosis. It has drawn great attentions in both basic and clinical medicine. Therefore, it is necessary to explore the therapeutic drugs and effective targets for early prediction of SAH. Firstly, we demonstrate that LCN2 can effectively intervene or treat SAH from the perspective of cell signaling pathway. Next, three potential genes that we explored have been validated by manually reviewed experimental evidences. Finally, we turn out that the SAH early ensemble learning predictive model performs better than the classical LR, SVM, and Naïve-Bayes models.
Introduction
Subarachnoid hemorrhage (SAH) is the fastest developing and most critical hemorrhagic cerebrovascular disease, accounting for 5% of cerebrovascular diseases (Macdonald, 2014), and is associated with high rates of mortality and disability and poor clinical prognosis (Suarez et al., 2006). Although there have been significant advances in diagnostic methods, surgery, and endovascular techniques in recent years, the mortality rate of SAH remains as high as 15% (Macdonald et al., 2008).
Recent research has shown that early brain injury (EBI) may be the main cause of poor prognosis in SAH patients. Therefore, current SAH studies focus on exploring therapeutic drugs and targets for reduction of EBI after SAH and the early prediction of SAH (Sozen et al., 2011).
Lipocalin 2 (LCN2) is an acute secretory protein that regulates the pathophysiological processes of various organ systems in mammals and participates in the intrinsic immune protection of the central nervous system (CNS) (Flo et al., 2004; Ferreira et al., 2015). Studies of acute white matter injury in a mouse SAH model and the role of LCN2 in injury (Egashira et al., 2014) indicate that LCN2 plays an important part in SAH-induced white matter injury. Since above evidences suggest that LCN2 is closely related to SAH, we propose our first research question: is specific intervention for LCN2 (Warszawska et al., 2013) a promising SAH treatment strategy?
On the other hand, most previous studies (Chu et al., 2011; Ni et al., 2011; Zhang et al., 2017a) have only explored biomarkers for SAH prediction and treatment in a narrow molecular range, rather than taking a genome-wide approach. We propose our second research question: could we use a genome-wide approach to find potential biomarkers for SAH based on the effects of LCN2 treatment?
Previous studies have usually predicted SAH based on diagnostic imaging (Frontera et al., 2006; Ramos et al., 2019) and clinical automation data (Roederer et al., 2014), which may not provide enough predictive power. Thus, we propose our third research question: could we use key genes to build a more powerful early prediction model for SAH?
In this paper, we propose a new research plan to answer the above three research questions. First, we use SAH intervention experiments to screen out candidate genes that are susceptible to LCN2, then employ Fisher's exact test (Xie et al., 2011; Li et al., 2017; Xia et al., 2017; Zhang et al., 2019b) to choose signaling pathways from among the candidates under different experimental conditions. Second, we use E-Bayes (Carlin and Louis, 2010), SVM-RFE (Duan et al., 2005), SPCA (Zou et al., 2006), and statistical tests (Zhang et al., 2016, 2018, 2019b,d, 2020; Xiao et al., 2019) to investigate key genes from experimental data by considering both SAH and LCN2 as factors. Third, we integrate the logistic regression (LR), support vector machine (SVM), and Naive-Bayes algorithms (Xia et al., 2017; Zhang et al., 2017a, 2019a) into an ensemble learning model (Gao et al., 2017; Zhang et al., 2019b) to build a model for early SAH prediction.
First, manual review of the experimental evidence (Osuka et al., 2006; Majdalawieh et al., 2007; Hanafy et al., 2010; Hao et al., 2014; Kwon et al., 2015; Yu et al., 2018) demonstrates that we could intervene or treat SAH by targeting LCN2 from a cell signaling pathway perspective. Next, we explore three key genes that are sensitive to both SAH and LCN2 treatment, again using manual review of the experimental evidence (Huang et al., 2016; Sabo et al., 2017; Yu et al., 2018) to cross-validate the relationships between SAH and these key genes. Finally, we show that our SAH early prediction ensemble-learning model outperforms the classical LR, Naive-Bayes, and SVM models. In summary, we consider that this work provides a novel strategy for the future study of clinical treatment of SAH and related diseases.
Materials and Methods
Experimental Configuration
All experimental procedures were approved by the Ethics Committee of Southwest Hospital and were performed in accordance with the guidelines of the National Institutes of Health Guide for the Care and Use of Laboratory Animals.
Intervention Experiment for SAH
The original chip data for this experiment were provided by the Department of Neurosurgery, Southwest Hospital, PLA Military Medical University. SAH and sham-operated models were established; details are given in the Supplementary Material. Each experimental group included five mice, and the white matter area of the cerebral cortex was taken for gene chip testing. A total of 10 original chip samples were obtained from the SAH intervention experiments; these were divided equally into two groups as follows.
(1) SAH disease group: brain tissue in the white matter region of the cerebral cortex of SAH mice.
(2) Control group normal-1: brain tissue in the white matter region of the cerebral cortex of normal mice.
The chip was an Affymetrix GeneChip Mouse Gene 1.0 ST Array. Raw data included sample RNA extraction (white matter brain cells from the SAH model and from normal mice), sample RNA quality detection (total RNA>1 ug), cDNA synthesis, sense strand cDNA fragmentation, biotin labeling, chip hybridization, chip elution, and chip scanning. The raw data are available at http://www.ebi.ac.uk/arrayexpress/experiments/E-MTAB-8407.
We then carried out mass analysis and used the R Bioconductor package to perform quality control for each original chip (the SAH disease group and the control group normal-1). In the output gray scale image (Figure S1) for each chip sample, each chip name and the four corner patterns were very clear, and the contrast between light and dark was moderate.
The right panel of Figure 1A shows the Relative Log Expression (RLE) boxplot for these 10 chips. The center of each sample was close to the position RLE = 0. This indicates that the expression levels of most genes in the sample were consistent. In addition, Figure S2 describes a normalized unscaled standard errors (NUSE) detection (Marta and Marc, 2014). Since Figure S2 shows that the center of each sample is close to the position NUSE = 1, we consider that the samples are too stable to have obvious batch effect. Then, we used Robust Multi-chip Analysis (RMA) (Irizarry et al., 2003) for data preprocessing, including background and perfect match probes (PM) correction, normalization, and summarization, to obtain the probe expression data matrix (Table S1). Finally, clustering analysis (Liu et al., 2019; Xiao et al., 2019; Zhang et al., 2019c; Wu and Zhang, 2020) (Figure S3) shows that the major differences between the chip of each group comes from SAH.
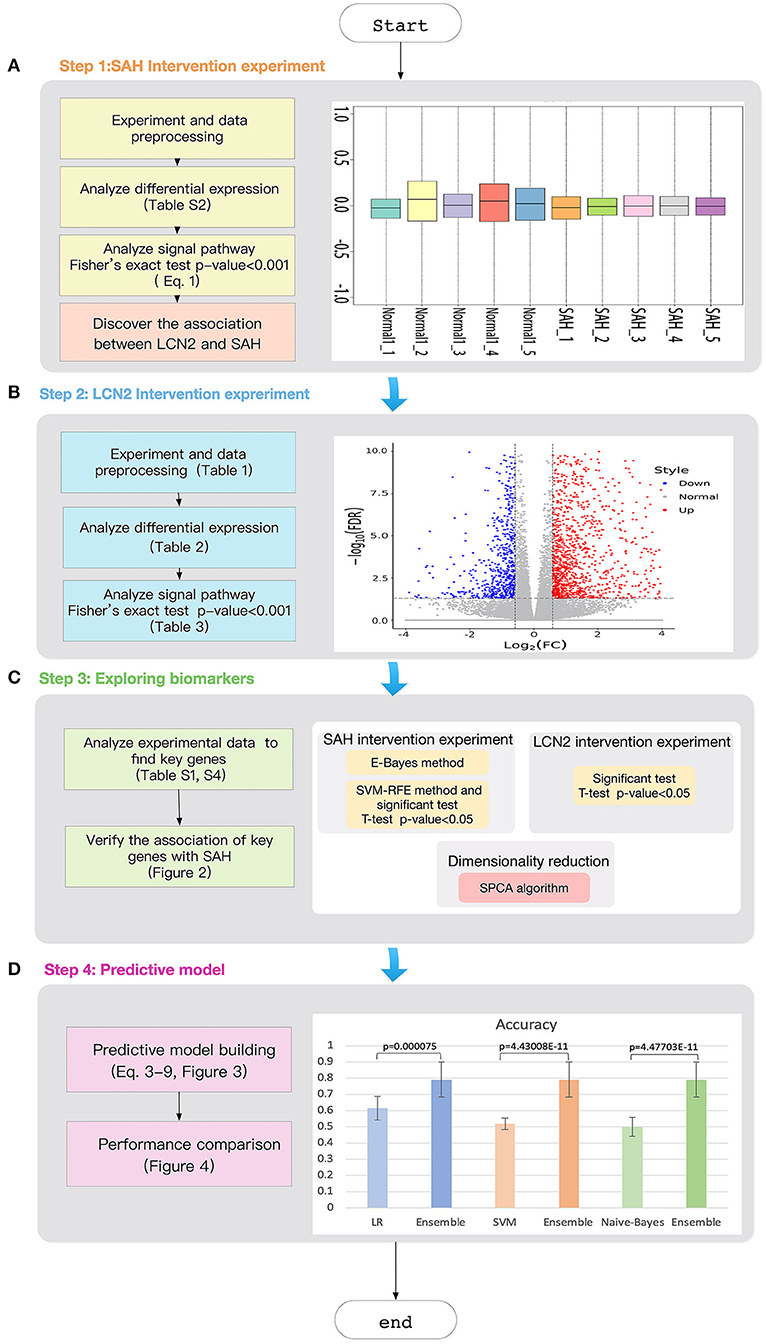
Figure 1. Workflow of the study. (A) SAH intervention experimental chip RLE box line diagram; the abscissa is log_2 (Median value of sample expression) and the ordinate represents each chip; (B) The volcano map of the comparison group SAH-siRNA-NC (1 day) vs normal-2. The abscissa is log2(Fold change) and the ordinate is −log10(FDR); The red point is the up-regulated gene, the blue point is the down-regulated gene, and the non-dispersive point is the non-differentiated gene; (C) Key gene screening workflow; (D) The accuracy for ensemble learning, LR, SVM and Naive-Bayes.
Intervention Experiment for LCN2
Here, in order to interfere with the expression of LCN2, 2 μL of specific short interfering RNAs (siRNAs) was delivered into the lateral ventricle with a Hamilton syringe. The injection was performed 48 h before SAH and three groups were used, as described below. We detail the procedures in the Supplementary Material.
(1) SAH-siRNA-LCN2: the SAH model was established and treated with intrathecal injection of LCN2 siRNA, and two samples were taken on the first and third days after surgery.
(2) SAH-siRNA-NC: the SAH model was established and treated with intrathecal NC siRNA, and two samples were taken on the first and third days after surgery, which helped us to remove the interference factors associated with the siRNA vector.
(3) Control group normal-2: the brain tissue of the white matter region of the cerebral cortex without any treatment.
The total number of samples in all experiments was 25 (Table 1). RNA sequencing was performed on the samples and the raw data are available at https://www.ncbi.nlm.nih.gov/sra/PRJNA575372.

Table 1. Experimental sample description after LCN2 intervention experiment.
Workflow of the Study
The workflow of the study is illustrated in Figure 1. First, we designed the intervention experiment for SAH detailed in section “Intervention Experiment for SAH”, which allowed us to obtain the differential genes under different experimental conditions. Based on these differential genes, we could identify the key signaling pathways.
As targeting LCN2 could result in changes in these related signaling pathways (causing remission or promotion of SAH), we consider that LCN2 plays an important part in the entire biological cell process for SAH.
Next, we used an intervention experiment for LCN2 to obtain gene expression levels for diseased and normal mouse brain cells at different time points. Then, we employed commonly used dimensional reduction algorithms to explore three key genes under the impact of both SAH and LCN2 treatment.
Finally, we used these three key genes as classifiers to develop an ensemble learning model for early SAH prediction, the predictive power of which was much better than that of the classic LR, Naive-Bayes, and SVM models.
Results
Signaling Pathway Analysis
Differentially Expressed Gene Selection
We used E-Bayes, one of the most commonly used methods for differential expression analysis (Edwards et al., 2005), to screen the differential genes by setting Fold change ≥ 1.5 and p-value < 0.05. Table S2 lists 2942 differentially expressed genes, accounting for 10.16% of the total number of genes (28,944). Among them, there were 1016 and 1926 genes with upregulated and downregulated expression (Figure S4), respectively.
Pathway Analysis
We used Equation 1 and the data in Table S3 to explore related signaling pathways by carrying out Fisher's exact test (Xia et al., 2017) using Kobas 3.0 (Wu et al., 2006; Xie et al., 2011; Ai and Kong, 2018) for the differentially expressed genes from Table S2.
Here, N is the number of genes in the sample and n is the number of genes contained in the pathway. Nf is the number of differentially expressed genes and nf is the number of differentially expressed genes included in the pathway.
The Fisher's exact test assumes H0:p1 = p2; the alternative hypothesis is H1:p1 ≠ p2. p1is the probability that the differentially expressed gene will fall in the pathway, and p2 is the probability that the non-differentiated gene does not fall in the pathway. The p-value (pF) of Fisher's exact test was obtained by Equation 1.
Table S2 lists 70 signaling pathways for which the p-value was less than 0.001. LCN2 is a protein involved in MAPK signaling pathways that protects the CNS as part of the innate immune system (Warszawska et al., 2013). Previous studies have shown that LCN2 activates phosphorylation of p38 MAPK, which phosphorylates the Ser168 and Ser170 sites of NFATc4 and inhibits nuclear translocation of NFATc4 (Olabisi et al., 2008). NFATc4 is a key factor in remyelination and closely related to SAH, indicating that white matter damage after SAH is associated with remyelination (Kao et al., 2009; Guo et al., 2017).
Therefore, we hypothesize that LCN2 could promote the phosphorylation of transcription factor NFATc4 and inhibit its nuclear transcription by activating p38 MAPK, thereby preventing remyelination and causing white matter damage after SAH.
LCN2 Intervention Experimental Results Analysis
To prove our hypothesis, we designed a LCN2 intervention experiment (Figure 1B) to test whether LCN2 could affect SAH from the perspective of the differential expressed genes and the related signaling pathways.
First, we used the DESeq2 (Varet et al., 2016) method to select differentially expressed genes from SAH-siRNA-LCN2 and normal-2, SAH-siRNA-NC and normal-2, and SAH-siRNA-LCN2 and SAH-siRNA-NC groups on days 1 and 3, respectively (Table 1). The results are shown in Table 2, Table S4, and Figure S5.
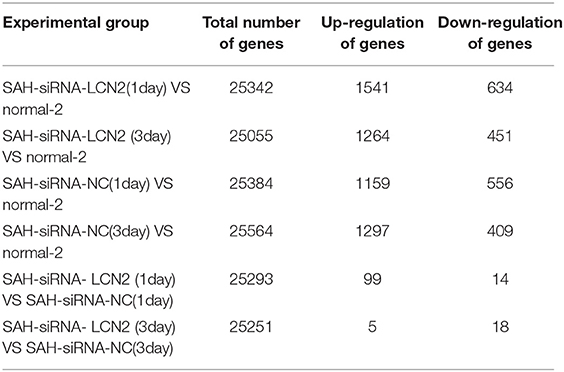
Table 2. Differential expressed genes for different experimental group.
Next, we used Kobas 3.0 (Wu et al., 2006; Xie et al., 2011; Ai and Kong, 2018) to carry out Fisher's exact test for the differential genes in Table 2, to identify related signaling pathways (Table S5). Next, we used the manually reviewed evidence (Osuka et al., 2006; Majdalawieh et al., 2007; Hanafy et al., 2010; Hao et al., 2014; Kwon et al., 2015; Yu et al., 2018) to cross-validate the SAH-related signaling pathways in Table S5. Table 3 lists the cross-validated SAH-related signaling pathways.
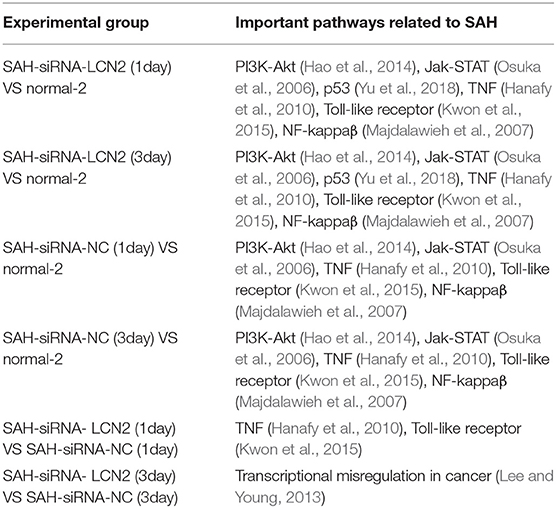
Table 3. Cross-validated SAH related signaling pathway.
As shown in Table 3, all the experimental groups had SAH-related signaling pathways except the transcriptional misregulation in cancer signaling pathway (Lee and Young, 2013) in the SAH-siRNA-LCN2 (3 day) vs. SAH-siRNA-NC (3 day) experimental group. However, as one of the proteins from this pathway, Gzmb (Table S5), is closely associated with post-ischemic brain cell death (Chaitanya et al., 2010), we consider that it could be a new target for secondary brain injury inhibition (Armstrong et al., 2017). Therefore, we conclude that specific intervention for LCN2 is a promising SAH treatment strategy.
Feature Selection
After demonstrating the impact of LCN2 on SAH, we chose potential biomarkers for SAH using a genome-wide approach. Figure 1C shows the workflow used to choose key genes that were not only related to both SAH and LCN2 but were also insensitive to treatment at different time points. Figure 1C shows the following three modules.
(1) SAH intervention experiment module
Owing to the large number of differential genes (Table S2), it was necessary to further narrow down the scope of the screening. First, we used the E-Bayes method (Edwards et al., 2005) to filter the probe expression data matrix (Table S1) by the E-Bayes function of R's limma package (Smyth et al., 2005). The differential probes were obtained by setting the filter parameters to Fold change ≥2 and p-value < 0.05.
Second, we used SVM-RFE (Duan et al., 2005) (Equation 2) to rank the genes in the probe expression data matrix, and then carried out the t-test and F-test (Zhang et al., 2017b) for the top 100 genes.
where yi and yj represent the classification labels of probes xi and xj, respectively; K(xi, xj) is the kernel function, i, j = 1, 2, …, n; α is obtained by training the SVM classifier; DJ(i) is the sort function; and H is the matrix.
We then combined the results of these two methods to obtain the significant probes for both the E-Bayes and SVM-RFE methods.
Finally, we used the transcription cluster annotation file (version: MoGene-1_0-st-v1) downloaded from the Affy (Gautier et al., 2004) website to extract the gene ID for these probes, resulting in 47 key genes (Table S6).
(2) LCN2 intervention experiment module
We performed t-tests and F-tests (Zhang et al., 2017b) for the key genes (Table S6) in the SAH-siRNA-LCN2 (1 day) vs. normal-2 and SAH siRNA-LCN2 (3 day) vs. normal-2 groups (Table S4).
There were 15 and 13 statistically significantly differential genes for the SAH-siRNA-LCN2 (1 day) vs. normal-2 group (Table S7) and the SAH-siRNA-LCN2 (3 day) vs. normal-2 group (Table S8), respectively. Taking the intersection of the results from these two experimental groups gave nine key genes, Tk1, Cyr61, Nupr1, Dcn, Lum, Olig1, Pcolce2, Slc6a9, and Kcnt2, which were sensitive to both SAH and LCN2 intervention, regardless of treatment, at different time points.
(3) Dimensional reduction module
Next, we employed the SPCA algorithm (Zou et al., 2006; Li et al., 2017) to perform dimensional reduction for the nine key genes. This resulted in five candidate genes (Tk1, Cyr61, Olig1, Slc6a9, and Pcolce2). However, manual review of the experimental evidence indicated that only Cyr61 (Yu et al., 2018), Olig1 (Sabo et al., 2017), and Slc6a9 (Huang et al., 2016) were closely related to SAH, cerebral hemorrhage, and brain injury. Therefore, we considered these three genes (Figure 2, Table S9) to be potential biomarkers for SAH.
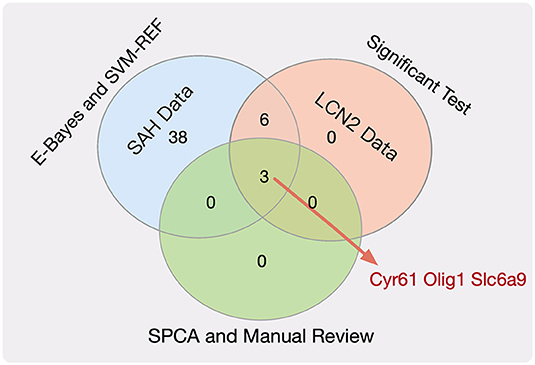
Figure 2. Venn plot for the key genes.
Ensemble Learning Model
Early SAH Prediction Model
This study used three classification algorithms, LR (Hosmer et al., 2013), SVM (Suykens and Vandewalle, 1999), and Naive-Bayes (Wang et al., 2007) to develop the SAH prediction model, using the selected key genes as the respective classifiers. These three classic methods were then integrated into a novel ensemble learning model to improve the predictive accuracy.
Figure 3 shows the workflow of the SAH prediction model, based on our previous studies (Li et al., 2017; Xia et al., 2017; Zhang et al., 2019b). The key equations of the model are as follows.
Here, Dt(i) is the weight distribution, t is the iteration time, i is the index of the sample, and n is the number of the sample. εt and αt are the error rate and weight of each weak classifier ht, respectively. For a sample set S = { (x1, y1), (x2, y2), …, (xn, yn) }, xn are the samples and yn ∈ {0, 1} are the labels; yi=0 indicates that xi is not an SAH patient, and yi=1 indicates that xi is an SAH patient. Hm is the homomorphic integration for each weak classifier ht; m is the index of the weak classifier, m = 1, 2, 3; T is the threshold of the iteration time; PHm is the predictive probability of disease; and EHmis the estimated probability of the model Hm. Y (x) is the result of the final classifier obtained by a voting method (Dietterich, 2000).
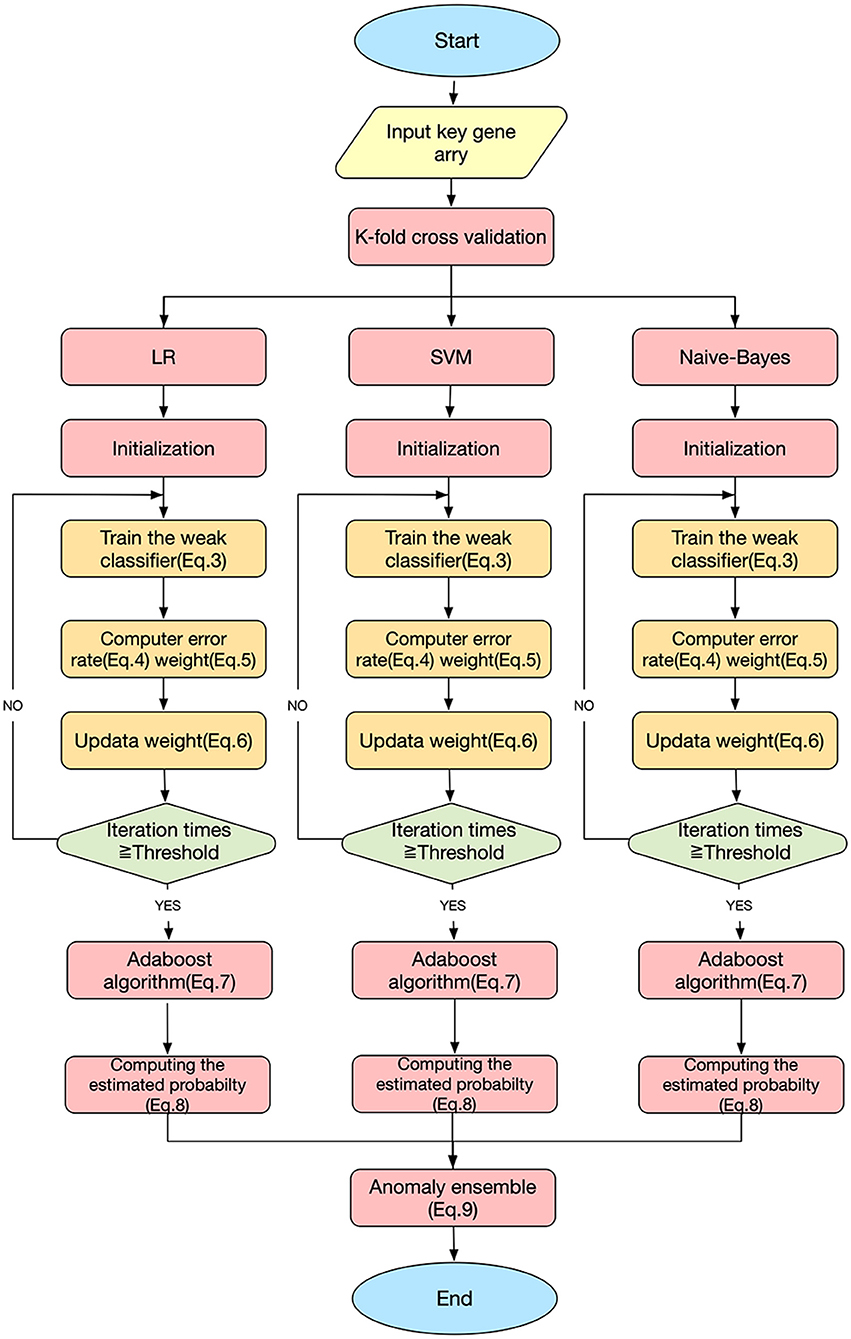
Figure 3. SAH predictive ensemble learning model.
Predictive Performance Comparison
Figure 4A compares the classification performance for the LR, Naive-Bayes, SVM, and ensemble learning models, based on four commonly used classification measurements (Table S10) (Zhang et al., 2019b). The numerical values used in Figure 4A are listed in Table S11; these demonstrate that the ensemble learning method outperforms the other three methods with respect to accuracy, precision, sensitivity and specificity. The ROC chart plotted in Figure 4B compares the classification effects of LR, Naive-Bayes, SVM, and ensemble learning models. The classification effect of ensemble learning models is also superior to the other three.
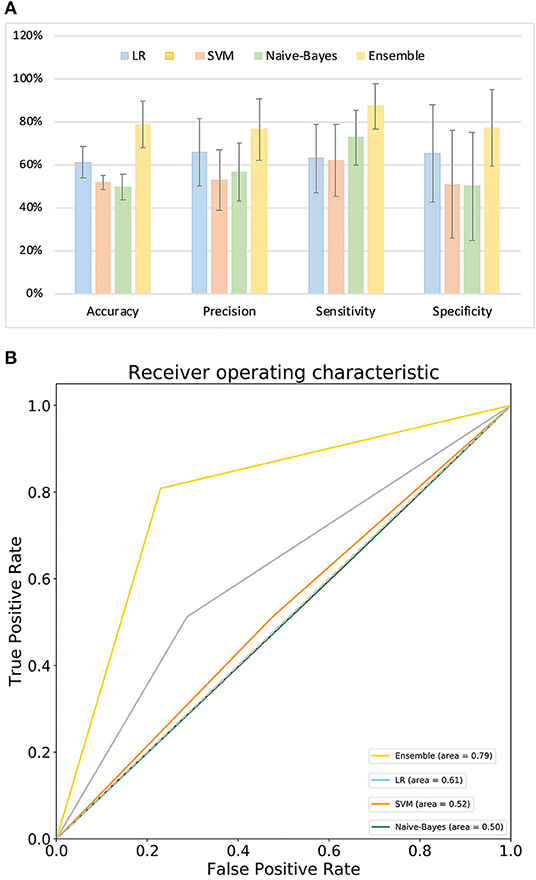
Figure 4. Model performance. (A) Comparison of classification performance of LR, SVM, Naive-Bayes, and ensemble learning model; (B) ROC chart plotted for LR, SVM, Naive-Bayes, and ensemble learning model.
Discussion
This study aimed to interrogate the potential therapeutic targets of SAH and use them as classifiers to develop a model for early prediction of SAH.
To achieve this aim, we proposed the following three scientific questions. First, is specific intervention involving LCN2 a promising SAH treatment strategy? Second, could we choose potential biomarkers for SAH at a genome-wide level by considering the effects of LCN2? Third, could we use key genes to build an SAH early prediction model with strong predictive power?
Regarding the first question, as the manually reviewed experimental evidence (Osuka et al., 2006; Majdalawieh et al., 2007; Hanafy et al., 2010; Hao et al., 2014; Kwon et al., 2015; Yu et al., 2018) and the results in Table 3 all indicate that LCN2-related signaling pathways play an important part in the pathogenesis SAH, we propose that LCN2 could promote or alleviate SAH-related diseases, and could also be used to treat SAH in the future.
To answer the second question, we used mathematical algorithms to explore five potential gene biomarkers (Tk1, Cyr61, Olig1, Slc6a9, and Pcolce2), considering the impact of both SAH and LCN2 treatment at different time points, and also used the manually reviewed experimental evidence to demonstrate that Cyr61 (Yu et al., 2018), Olig1 (Sabo et al., 2017), and Slc6a9 (Huang et al., 2016) were closely related to SAH. Although Tk1 and Pcolce2 have not been reported to be associated with SAH, we will investigate their connections in future work.
Regarding the third question, although this study represents significant progress in SAH prediction, it had several drawbacks. For example, the SAH intervention experiment sample size was too small for us to demonstrate high predictive accuracy for the model. In future work, we will integrate more recent bioinformatics research algorithms (Zhang et al., 2016, 2017a, 2018, 2019a,d; Gao et al., 2017; Zhang and Zhang, 2017) and data into the system to overcome the problems.
In summary, this study analyzed the impact of LCN2 on SAH and explored the key biomarkers of SAH under LCN2 treatment at different time points. An ensemble learning model was developed to predict SAH occurrence. The results demonstrate that LCN2 (Warszawska et al., 2013) can effectively intervene in or treat SAH from a cell signaling pathway perspective. Also, three key genes were identified and validated by manual review of the experimental evidence (Huang et al., 2016; Sabo et al., 2017; Yu et al., 2018). Finally, the results showed that the ensemble learning model performed better for early SAH prediction than the classical LR, SVM, and Naive-Bayes models.
Data Availability Statement
The raw data supporting the results of this article can be found in ArrayExpress (accession ID: E-MTAB-8407) and BioProject (accession ID: PRJNA575372).
Ethics Statement
The animal study was reviewed and approved by the Ethics Committee of Southwest Hospital.
Author Contributions
LZ and YC conceived the study and developed the model. HZe and WL performed the simulations for the model. WL and HZe wrote the manuscript. MX and HZh performed the analysis for the model. HF, XR, and QL contributed to acquisition of data. All authors read and approved the final manuscript.
Funding
This work has been supported in part by the National Science and Technology Major Innovation Program (No. 2018ZX10201002) and supported by the National Natural Science Foundation of China (No. 61372138), State Key Laboratory of Trauma, Burn and Combined Injury (No. SKLRCJF01), and Chongqing Talent Program (No. 4139Z2391).
Conflict of Interest
The authors declare that the research was conducted in the absence of any commercial or financial relationships that could be construed as a potential conflict of interest.
Supplementary Material
The Supplementary Material for this article can be found online at: https://www.frontiersin.org/articles/10.3389/fgene.2020.00391/full#supplementary-material
References
Ai, C., and Kong, L. (2018). CGPS: a machine learning-based approach integrating multiple gene set analysis tools for better prioritization of biologically relevant pathways. J. Genet. Genomics 45, 489–504. doi: 10.1016/j.jgg.2018.08.002
Armstrong, C. W., Bosio, E., Neil, C., Brown, S. G., Hankey, G. J., and Fatovich, D. M. (2017). Distinct inflammatory responses differentiate cerebral infarct from transient ischaemic attack. J. Clin. Neurosci. 35, 97–103. doi: 10.1016/j.jocn.2016.09.011
Carlin, B. P., and Louis, T. A. (2010). Bayes and Empirical Bayes Methods for Data Analysis. New York, NY: Chapman and Hall/CRC.
Chaitanya, G., Schwaninger, M., Alexander, J., and Babu, P. P. (2010). Granzyme-b is involved in mediating post-ischemic neuronal death during focal cerebral ischemia in rat model. Neuroscience 165, 1203–1216. doi: 10.1016/j.neuroscience.2009.10.067
Chu, S., Feng, D., Ma, Y., Zhang, H., Zhu, Z. A., Li, Z., et al. (2011). Expression of HGF and VEGF in the cerebral tissue of adult rats with chronic hydrocephalus after subarachnoid hemorrhage. Mol. Med. Rep. 4, 785–791. doi: 10.3892/mmr.2011.500
Dietterich, T. G. (2000). “Ensemble methods in machine learning,” in International Workshop on Multiple Classifier Systems (Berlin, Heidelberg: Springer), 1–15.
Duan, K-B., Rajapakse, J. C., Wang, H., and Azuaje, F. (2005). Multiple SVM-RFE for gene selection in cancer classification with expression data. IEEE Trans. Nanobiosci. 4, 228–234. doi: 10.1109/TNB.2005.853657
Edwards, J. W., Page, G. P., Gadbury, G., Heo, M., Kayo, T., Weindruch, R., et al. (2005). Empirical bayes estimation of gene-specific effects in micro-array research. Funct. Integr. Genomics 5, 32–39. doi: 10.1007/s10142-004-0123-0
Egashira, Y., Hua, Y., Keep, R. F., and Xi, G. (2014). Acute white matter injury after experimental subarachnoid hemorrhage: potential role of lipocalin 2. Stroke 45, 2141–2143. doi: 10.1161/STROKEAHA.114.005307
Ferreira, A. C., Mesquita, S. D., Sousa, J. C., Correianeves, M., Sousa, N., Palha, J. A., et al. (2015). From the periphery to the brain: Lipocalin-2, a friend or foe? Progr. Neurobiol. 131, 120–136. doi: 10.1016/j.pneurobio.2015.06.005
Flo, T. H., Smith, K. D., Sato, S., Rodriguez, D., Holmes, M. A., Strong, R. K., et al. (2004). Lipocalin 2 mediates an innate immune response to bacterial infection by sequestrating iron. Nature 432, 917–921. doi: 10.1038/nature03104
Frontera, J. A., Claassen, J., Schmidt, J. M., Wartenberg, K. E., Temes, R., Connolly, E. S., et al. (2006). Prediction of symptomatic vasospasm after subarachnoid hemorrhage: the modified fisher scale. Neurosurgery 59, 21–27. doi: 10.1227/01.NEU.0000218821.34014.1B
Gao, H., Yin, Z., Cao, Z., and Zhang, L. (2017). Developing an agent-based drug model to investigate the synergistic effects of drug combinations. Molecules 22:2209. doi: 10.3390/molecules22122209
Gautier, L., Cope, L., Bolstad, B. M., and Irizarry, R. A. (2004). Affy—analysis of affymetrix genechip data at the probe level. Bioinformatics 20, 307–315. doi: 10.1093/bioinformatics/btg405
Guo, D., Wilkinson, D. A., Thompson, B. G., Pandey, A. S., Keep, R. F., Xi, G., et al. (2017). MRI characterization in the acute phase of experimental subarachnoid hemorrhage. Transl. Stroke Res. 8, 234–243. doi: 10.1007/s12975-016-0511-5
Hanafy, K. A., Grobelny, B., Fernandez, L., Kurtz, P., Connolly, E., Mayer, S. A., et al. (2010). Brain interstitial fluid TNF-α after subarachnoid hemorrhage. J. Neurol. Sci. 291, 69–73. doi: 10.1016/j.jns.2009.12.023
Hao, X-K., Wu, W., Wang, C-X., Xie, G-B., Li, T., Wu, H-M., et al. (2014). Ghrelin alleviates early brain injury after subarachnoid hemorrhage via the PI3K/Akt signaling pathway. Brain Res. 1587, 15–22. doi: 10.1016/j.brainres.2014.08.069
Hosmer, D. W. Jr., Lemeshow, S., and Sturdivant, R. X. (2013). Applied logistic regression. John Wiley & Sons. doi: 10.1002/9781118548387
Huang, B., Xie, Q., Lu, X., Qian, T., Li, S., Zhu, R., et al. (2016). GlyT1 inhibitor NFPS exerts neuroprotection via GlyR alpha1 subunit in the rat model of transient focal cerebral ischaemia and reperfusion. Cell. Physiol. Biochem. 38, 1952–1962. doi: 10.1159/000445556
Irizarry, R. A., Hobbs, B., Collin, F., Beazer-Barclay, Y. D., Antonellis, K. J., Scherf, U., et al. (2003). Exploration, normalization, and summaries of high density oligonucleotide array probe level data. Biostatistics 4, 249–264. doi: 10.1093/biostatistics/4.2.249
Kao, S-C., Wu, H., Xie, J., Chang, C-P., Ranish, J. A., Graef, I. A., et al. (2009). Calcineurin/NFAT signaling is required for neuregulin-regulated schwann cell differentiation. Science 323, 651–654. doi: 10.1126/science.1166562
Kwon, M., Woo, S., Kurland, D., Yoon, S., Palmer, A., Banerjee, U., et al. (2015). Methemoglobin is an endogenous toll-like receptor 4 ligand—relevance to subarachnoid hemorrhage. Int. J. Mol. Sci. 16, 5028–5046. doi: 10.3390/ijms16035028
Lee, T. I., and Young, R. A. (2013). Transcriptional regulation and its misregulation in disease. Cell 152, 1237–1251. doi: 10.1016/j.cell.2013.02.014
Li, T., Cheng, Z., and Zhang, L. (2017). Developing a novel parameter estimation method for agent-based model in immune system simulation under the framework of history matching: a case study on influenza A virus infection. Int. J. Mol. Sci. 18:E2592. doi: 10.3390/ijms18122592
Liu, G-D., Li, Y-C., Zhang, W., and Zhang, L. (2019). A brief review of artificial intelligence applications and algorithms for psychiatric disorders. Engineering. doi: 10.1016/j.eng.2019.06.008. [Epub ahead of print].
Macdonald, R. L. (2014). Delayed neurological deterioration after subarachnoid haemorrhage. Nat. Rev. Neurol. 10:44. doi: 10.1038/nrneurol.2013.246
Macdonald, R. L., Kassell, N. F., Mayer, S., Ruefenacht, D., Schmiedek, P., Weidauer, S., et al. (2008). Clazosentan to overcome neurological ischemia and infarction occurring after subarachnoid hemorrhage (CONSCIOUS-1) randomized, double-blind, placebo-controlled phase 2 dose-finding trial. Stroke 39, 3015–3021. doi: 10.1161/STROKEAHA.108.519942
Majdalawieh, A., Zhang, L., and Ro, H. S. (2007). Adipocyte enhancer-binding protein-1 promotes macrophage inflammatory responsiveness by up-regulating NF-kappaB via IkappaBalpha negative regulation. Mol. Biol. Cell 18, 930–942. doi: 10.1091/mbc.e06-03-0217
Marta, R., and Marc, R. R. (2014). IQRray, a new method for affymetrix microarray quality control, and the homologous organ conservation score, a new benchmark method for quality control metrics. Bioinformatics 32:2565. doi: 10.1093/bioinformatics/btw374
Ni, W., Gu, Y., Song, D. L., Leng, B., Li, P., and Mao, Y. (2011). The relationship between IL-6 in CSF and occurrence of vasospasm after subarachnoid hemorrhage. Acta Neurochir. Suppl. 110(Pt. 1), 203–208. doi: 10.1007/978-3-7091-0353-1_35
Olabisi, O. A., Soto-Nieves, N., Nieves, E., Yang, T. T., Yang, X., Raymond, Y., et al. (2008). Regulation of transcription factor NFAT by ADP-ribosylation. Mol. Cell. Biol. 28, 2860–2871. doi: 10.1128/MCB.01746-07
Osuka, K., Watanabe, Y., Yamauchi, K., Nakazawa, A., Usuda, N., Tokuda, M., et al. (2006). Activation of the JAK-STAT signaling pathway in the rat basilar artery after subarachnoid hemorrhage. Brain Res. 1072, 1–7. doi: 10.1016/j.brainres.2005.12.003
Ramos, L. A., Van Der Steen, W. E., Barros, R. S., Majoie, C. B., Van Den Berg, R., Verbaan, D., et al. (2019). Machine learning improves prediction of delayed cerebral ischemia in patients with subarachnoid hemorrhage. J. Neurointerv. Surg. 11, 497–502. doi: 10.1136/neurintsurg-2018-014258
Roederer, A., Holmes, J. H., Smith, M. J., Lee, I., and Park, S. (2014). Prediction of significant vasospasm in aneurysmal subarachnoid hemorrhage using automated data. Neurocrit. Care 21, 444–450. doi: 10.1007/s12028-014-9976-9
Sabo, J. K., Heine, V., Silbereis, J. C., Schirmer, L., Levison, S. W., and Rowitch, D. H. (2017). Olig1 is required for noggin-induced neonatal myelin repair. Ann. Neurol. 81, 560–571. doi: 10.1002/ana.24907
Smyth, G. K., Ritchie, M., Thorne, N., and Wettenhall, J. (2005). LIMMA: linear models for microarray data,” in Bioinformatics and Computational Biology Solutions Using R and Bioconductor (New York, NY: Springer), 397–420.
Sozen, T., Tsuchiyama, R., Hasegawa, Y., Suzuki, H., Jadhav, V., Nishizawa, S., et al. (2011). Immunological response in early brain injury after SAH. Acta Neurochir. Suppl. 110(Pt 1), 57–61. doi: 10.1007/978-3-7091-0353-1_10
Suarez, J. I., Tarr, R. W., and Selman, W. R. (2006). Aneurysmal subarachnoid hemorrhage. N. Engl. J. Med. 354, 387–396. doi: 10.1056/NEJMra052732
Suykens, J. A., and Vandewalle, J. (1999). Least squares support vector machine classifiers. Neural Process. Lett. 9, 293–300. doi: 10.1023/A:1018628609742
Varet, H., Brillet-Guéguen, L., Coppée, J-Y., and Dillies, M-A. (2016). SARTools: a DESeq2-and edgeR-based R pipeline for comprehensive differential analysis of RNA-Seq data. PLoS ONE 11:e0157022. doi: 10.1371/journal.pone.0157022
Wang, Q., Garrity, G. M., Tiedje, J. M., and Cole, J. R. (2007). Naive bayesian classifier for rapid assignment of rRNA sequences into the new bacterial taxonomy. Appl. Environ. Microbiol. 73, 5261–5267. doi: 10.1128/AEM.00062-07
Warszawska, J., Gawish, R., Sharif, O., Sigel, S., Doninger, B., Lakovits, K., et al. (2013). Lipocalin 2 deactivates macrophages and worsens pneumococcal pneumonia outcomes. J. Clin. Invest. 123, 3363–3372. doi: 10.1172/JCI67911
Wu, J., Mao, X., Cai, T., Luo, J., and Wei, L. (2006). KOBAS server: a web-based platform for automated annotation and pathway identification. Nucleic Acids Res. 34, 720–724. doi: 10.1093/nar/gkl167
Wu, W., and Zhang, L. (2020). Exploring the dynamics and interplay of human papillomavirus and cervical tumorigenesis by integrating biological data into a mathematical model. BMC Bioinformatics.
Xia, Y., Yang, C., Hu, N., Yang, Z., He, X., Li, T., et al. (2017). Exploring the key genes and signaling transduction pathways related to the survival time of glioblastoma multiforme patients by a novel survival analysis model. BMC Genomics 18:950. doi: 10.1186/s12864-016-3256-3
Xiao, M., Yang, X., Yu, J., and Zhang, L. (2019). CGIDLA: Developing the Web Server for CpG Island related Density and LAUPs (Lineage-associated Underrepresented Permutations) Study. IEEE/ACM Transac. Comput. Biol. Bioinformatics. doi: 10.1109/TCBB.2019.2935971. [Epub ahead of print].
Xie, C., Mao, X., Huang, J., Ding, Y., Wu, J., Dong, S., et al. (2011). KOBAS 2.0: a web server for annotation and identification of enriched pathways and diseases. Nucleic Acids Res. 39, W316–W322. doi: 10.1093/nar/gkr483
Yu, S., Zeng, Y. J., and Sun, X. C. (2018). Neuroprotective effects of p53/microRNA-22 regulate inflammation and apoptosis in subarachnoid hemorrhage. Int. J. Mol. Med. 41, 2406–2412. doi: 10.3892/ijmm.2018.3392
Zhang, L., Bai, W., Yuan, N., and Du, Z. (2019a). Comprehensively benchmarking applications for detecting copy number variation. PLoS Comput. Biol. 15:e1007069. doi: 10.1371/journal.pcbi.1007069
Zhang, L., Li, J., Yin, K., Jiang, Z., Li, T., Hu, R., et al. (2019b). Computed tomography angiography-based analysis of high-risk intracerebral haemorrhage patients by employing a mathematical model. BMC Bioinformatics 20:193. doi: 10.1186/s12859-019-2741-5
Zhang, L., Liu, G., Kong, M., Li, T., Wu, D., Zhou, X., et al. (2019d). Revealing dynamic regulations and the related key proteins of myeloma-initiating cells by integrating experimental data into a systems biological model. Bioinformatics. 26:btz542. doi: 10.1093/bioinformatics/btz542
Zhang, L., Liu, Y., Wang, M., Wu, Z., Li, N., Zhang, J., et al. (2017a). EZH2-, CHD4-, and IDH-linked epigenetic perturbation and its association with survival in glioma patients. J. Mol. Cell 9, 477–488. doi: 10.1093/jmcb/mjx056
Zhang, L., Qiao, M., Gao, H., Hu, B., Tan, H., Zhou, X., et al. (2016). Investigation of mechanism of bone regeneration in a porous biodegradable calcium phosphate (CaP) scaffold by a combination of a multi-scale agent-based model and experimental optimization/validation. Nanoscale 8, 14877–14887. doi: 10.1039/C6NR01637E
Zhang, L., Xiao, M., Zhou, J., and Yu, J. (2018). Lineage-associated underrepresented permutations (LAUPs) of mammalian genomic sequences based on a jellyfish-based LAUPs analysis application (JBLA). Bioinformatics 34, 3624–3630. doi: 10.1093/bioinformatics/bty392
Zhang, L., and Zhang, S. (2017). Using game theory to investigate the epigenetic control mechanisms of embryo development: comment on: “Epigenetic game theory: How to compute the epigenetic control of maternal-to-zygotic transition” by Qian Wang et al. Phys. Life Rev. 20, 140–142. doi: 10.1016/j.plrev.2017.01.007
Zhang, L., Zheng, C. Q., Li, T., Xing, L., Zeng, H., Li, T. T., et al. (2017b). Building up a robust risk mathematical platform to predict colorectal cancer. Complexity 2017:8917258. doi: 10.1155/2017/8917258
Zhang, L., Li, P., Zhao, J., Yang, X., Li, Z., and Yu, J. (2019c). Research Progress on the Three-Dimensional Structure of Genome. SCIENTIA SINICA Vitae.
Zhang, L., Zichun, D., Jun, Y., and Ming, X. (2020). CpG-island-based annotation and analysis of human housekeeping genes. Brief. Bioinformatics. bbz134. doi: 10.1093/bib/bbz134
Keywords: bioinformatics, genomics, big data, artificial intelligence, genetics
Citation: Lei W, Zeng H, Feng H, Ru X, Li Q, Xiao M, Zheng H, Chen Y and Zhang L (2020) Development of an Early Prediction Model for Subarachnoid Hemorrhage With Genetic and Signaling Pathway Analysis. Front. Genet. 11:391. doi: 10.3389/fgene.2020.00391
Received: 06 October 2019; Accepted: 30 March 2020;
Published: 21 April 2020.
Edited by:
Yi Zhao, Beijing University of Chinese Medicine, ChinaReviewed by:
Ping Luo, University Health Network, CanadaZhi-Ping Liu, Shandong University, China
Sheng Chen, Zhejiang University, China
Copyright © 2020 Lei, Zeng, Feng, Ru, Li, Xiao, Zheng, Chen and Zhang. This is an open-access article distributed under the terms of the Creative Commons Attribution License (CC BY). The use, distribution or reproduction in other forums is permitted, provided the original author(s) and the copyright owner(s) are credited and that the original publication in this journal is cited, in accordance with accepted academic practice. No use, distribution or reproduction is permitted which does not comply with these terms.
*Correspondence: Yujie Chen, eXVqaWVjaGVuNjg4NkBmb3htYWlsLmNvbQ==; Le Zhang, emhhbmdsZTA2QHNjdS5lZHUuY24=