 Chang Li1,2,3†
 Han Zou1,2,3†
 Zujian Xiong1,2,3
 Yi Xiong1,2,3
 Danielle F. Miyagishima4,5
 Siyi Wanggou1,3
 Xuejun Li1,3*
- 1Department of Neurosurgery, Xiangya Hospital, Central South University, Changsha, China
- 2Xiangya School of Medicine, Central South University, Changsha, China
- 3Hunan International Scientific and Technological Cooperation Base of Brain Tumor Research, Xiangya Hospital, Central South University, Changsha, China
- 4Department of Neurosurgery, Yale School of Medicine, New Haven, CT, United States
- 5Department of Genetics, Yale School of Medicine, New Haven, CT, United States
Background: Recent studies have identified several molecular subgroups of medulloblastoma associated with distinct clinical outcomes; however, no robust gene signature has been established for prognosis prediction. Our objective was to construct a robust gene signature-based model to predict the prognosis of patients with medulloblastoma.
Methods: Expression data of medulloblastomas were acquired from the Gene Expression Omnibus (GSE85217, n = 763; GSE37418, n = 76). To identify genes associated with overall survival (OS), we performed univariate survival analysis and least absolute shrinkage and selection operator (LASSO) Cox regression. A risk score model was constructed based on selected genes and was validated using multiple datasets. Differentially expressed genes (DEGs) between the risk groups were identified. Kyoto Encyclopedia of Genes and Genomes (KEGG), Gene Ontology (GO), and protein–protein interaction (PPI) analyses were performed. Network modules and hub genes were identified using Cytoscape. Furthermore, tumor microenvironment (TME) was evaluated using ESTIMATE algorithm. Tumor-infiltrating immune cells (TIICs) were inferred using CIBERSORTx.
Results: A 13-gene model was constructed and validated. Patients classified as high-risk group had significantly worse OS than those as low-risk group (Training set: p < 0.0001; Validation set 1: p < 0.0001; Validation set 2: p = 0.00052). The area under the curve (AUC) of the receiver operating characteristic (ROC) analysis indicated a good performance in predicting 1-, 3-, and 5-year OS in all datasets. Multivariate analysis integrating clinical factors demonstrated that the risk score was an independent predictor for the OS (validation set 1: p = 0.001, validation set 2: p = 0.004). We then identified 265 DEGs between risk groups and PPI analysis predicted modules that were highly related to central nervous system and embryonic development. The risk score was significantly correlated with programmed death-ligand 1 (PD-L1) expression (p < 0.001), as well as immune score (p = 0.035), stromal score (p = 0.010), and tumor purity (p = 0.010) in Group 4 medulloblastomas. Correlations between the 13-gene signature and the TIICs in Sonic hedgehog and Group 4 medulloblastomas were revealed.
Conclusion: Our study constructed and validated a robust 13-gene signature model estimating the prognosis of medulloblastoma patients. We also revealed genes and pathways that may be related to the development and prognosis of medulloblastoma, which might provide candidate targets for future investigation.
Introduction
Medulloblastoma is the most common central nervous system (CNS) malignancy in children (Louis et al., 2016; Northcott et al., 2019). The current revision of WHO classification of medulloblastoma integrates histological and molecular studies (Louis et al., 2016). It is established that medulloblastoma can be characterized into at least four major subgroups, Wingless (WNT), Sonic hedgehog (SHH), group 3, and group 4 (Taylor et al., 2012). While the WNT and SHH subgroup can be clearly identified based on the WNT and SHH signaling pathway mutations, much less is known about Group 3 and Group 4 tumors, and these subgroups remain as non-SHH/non-WNT medulloblastomas in WHO’s 2016 classification for diagnostic considerations (Louis et al., 2016). Group 3 and Group 4 tumors have few mutations but can be identified through transcriptional profiles (Ramaswamy et al., 2016b). Despite the difficulty in classification—and an overlap (intermediate 3/4 Group) between these tumors has been observed—Group 3 and Group 4 are indeed different subgroups featuring distinct clinicopathological and genomic characteristics (Łastowska et al., 2018; Schwalbe et al., 2019). Group 3 tumors have the worst prognosis of all medulloblastomas, whereas Group 4 tumors have an intermediate prognosis similar to that of SHH subgroup (Taylor et al., 2012). Although large cell/anaplastic (LCA) tumors can be found in all four molecular subgroups, the majority of this histological subtype are found in Group 3 tumors. Moreover, Group 3 tumors tend to have high levels of expression of the MYC proto-oncogene, bHLH transcription factor (MYC), whereas MYC expression in Group 4 tumors are relatively low. On the other hand, isochromosome 17q can be commonly seen in Group 4 tumors (approximately 66%), whereas it is less common in Group 3 tumors (approximately 26%) (Kool et al., 2012). While molecular subgroups improved our knowledge of medulloblastoma, there are still some limitations, particularly in the characterization of clinical outcomes. Wide variation in patient outcomes within the same subgroup has been observed (Ramaswamy et al., 2016b), and many subgroups show a subsequent level of structures, namely, subtypes of molecular subgroups (Taylor et al., 2012). Labeled with Greek letters, such as α, β, γ, etc., these subtypes are associated with distinct clinical outcomes. For example, study from Cho et al. (2011) demonstrated that Group 3β medulloblastomas have a clinical outcome similar to Group 4 tumors. However, the number of subtypes for each subgroup and the extent of overlap between subgroups remains unknown. Cavalli et al. (2017) identified 12 subtypes of the known molecular subgroups in their study of 763 medulloblastoma cases, while new subtypes featuring hotspot in-frame insertions that target Kelch repeat, BTB domain containing 4 (KBTBD4), and “enhancer hijacking” events that activate PR/SET domain 6 (PRDM6) were proposed in a recent study (Northcott et al., 2017). Therefore, a precise prognostic model with high efficacy and broad applicability would assist in prognostic prediction of the patients with medulloblastoma in addition to the molecular and histology characterization. In this study, we utilized expression data from the Gene Expression Omnibus (GEO) to construct a 13-gene signature that can robustly predict risk stratification of patients with specific identification of a high-risk group with significant worse overall-survival (OS) among medulloblastoma patients. We validated the efficacy and applicability of the model using two unique datasets sequenced using different platforms. Using this model, we identified differentially expressed genes (DEGs) and performed a pathway enrichment analysis. Furthermore, we performed comprehensive analyses of the protein–protein interaction (PPI), tumor microenvironment (TME), tumor-infiltrating immune cells (TIICs), and immune checkpoints of the medulloblastoma samples, and we assessed their correlation with our risk score model, to give insight into the underlying mechanism of the 13-gene signature and its relation with published molecular signatures of the disease. Our study has potential clinical significance in patient management and may shed light on the tumorigenesis of medulloblastoma.
Materials and Methods
Patient Cohorts and Data Preprocessing
Expression datasets of medulloblastomas (GSE85217, n = 763; GSE37418, n = 76) were acquired from GEO1 (Robinson et al., 2012; Morfouace et al., 2015; Cavalli et al., 2017; Ramaswamy and Taylor, 2019). Clinical data, including gender, histology, age, and molecular subgroup, were retrieved from corresponding publications (Robinson et al., 2012; Morfouace et al., 2015; Cavalli et al., 2017; Ramaswamy and Taylor, 2019). Patients without survival information were excluded. Considering the distinct clinical characteristics of infant medulloblastoma (Waszak et al., 2018), cases that were 3 years old or younger were excluded. To remove the batch effect (Luo et al., 2010), expression data were normalized using a quantile normalization method via the “limma” R package and log2 transformed (Ritchie et al., 2015). Outliers were detected using the “hclust” R package (Müllner, 2013) and excluded. Probes were mapped to genes per manufacturer’s instruction for each microarray platform when applicable (GRL22286, Affymetrix, United States2; GRL570, Affymetrix, United States3). For genes detected by multiple probe sets without recommended probes from the manufacturer, the probe with the highest expression covering the targeted region was selected for analysis. Probes without descriptions from the manufacturer were excluded. After data preprocessing, we randomly assigned cases in dataset GSE85217 to the training set (70%) or validation set 1 (30%) with proportionate stratification by the four molecular subgroups (SHH, WNT, Group 3, and Group 4). GSE37418 was assigned as validation set 2 for external validation. Of note, the datasets were sequenced on different microarray platforms (GPL22286 for GSE85217; GPL570 for GSE37418).
Construction of the Gene Signature Model
The training set was used to construct the prognostic model. The univariate survival analysis was performed using the R packages “survival” and “surveminer” (Therneau and Grambsch, 2000) to identify OS-related genes. OS-related genes were defined as genes that were significantly associated with the OS (p < 0.05) in the univariate survival analysis. We then used a least absolute shrinkage and selection operator (LASSO) Cox proportional hazards model to identify signature genes predicting the OS of the patients. The optimal penalty parameter was estimated by 10-fold cross-validation in the training dataset (Tibshirani, 1997; Therneau and Grambsch, 2000). Genes with none-zero coefficients were selected for further model construction. Risk scores for each patient was calculated using the following formula:
n, Expi, and Li, represented the number of signature genes, gene expression level, and the coefficient of the gene, respectively. The cutoff between high-risk and low-risk groups was statistically estimated using the “maximally selected rank statistics method” (Lausen and Schumacher, 1992) with the training set.
Validation of the Gene Signature Model
Using the gene signature-based model constructed from the training set, risk scores were calculated for all patients in the validation set 1 and 2. Patients were then classified as being in a “high-risk” or “low-risk” group based on their risk scores, using the cutoff estimated from the training set. To validate the performance of the gene signature model, Kaplan–Meier survival (K–M) curves were plotted for “high-risk” and “low-risk” groups. The area under the curve (AUC) of the receiver operating characteristic (ROC) for 1-, 3-, and 5-year OS were calculated for risk scores.
To assess the independent predictive value of the gene signature when considering clinical factors, univariant and multivariant analyses were performed by integrating the age, gender, tumor histology, molecular subgroups, as well as risk groups of the patient. To visualize the performance of the risk score model, heatmaps were plotted using R package “ggplot2” by clustering signature genes and risk groups.
Differentially Expressed Gene (DEGs) Analysis
DEGs between the high-risk and low-risk group were identified using R package “limma.” Genes with fold change > 1.5 or <0.5 (Dalman et al., 2012), and adjusted p-value < 0.01 after Benjamini–Hochberg (BH) multiple test adjustment were considered differentially expressed. The Gene Ontology (GO) enrichment analysis was performed for DEGs using R package “clusterProfiler” and R/Bioconductor annotation data package “org.Hs.eg.db” (Yu et al., 2012; Carlson, 2019). The Kyoto Encyclopedia of Genes and Genomes (KEGG) analysis was performed using WEB-based Gene SeT AnaLysis Toolkit4, with hypergeometric test statistical method and BH method applied. The “TOP” method was used to identify enriched categories in which the top most significant categories were selected after ranking based on the false discovery rate (FDR).
Protein–Protein Interaction (PPI) Analysis
Protein–protein interaction network of the DEGs was constructed using The Search Tool for the Retrieval of Interacting Genes (STRING5) (Szklarczyk et al., 2019). The constructed network was then visualized using Cytoscape software. The Molecular Complex Detection (MCODE) plugin was used to identify significant modules of the PPI network, and modules with score ≥ 4 and nodes ≥ 20 were included in this study (Bader and Hogue, 2003). A GO enrichment analysis were performed for DEGs in each module for functional enrichment analysis. Hub genes of the PPI network were identified using CytoHubba based on the predication of two topological analysis methods, maximal clique centrality (MCC) and Degree (Chin et al., 2014).
Analysis of Tumor Microenvironment (TME) and Estimation of Tumor Purity as Well as Stromal and Immune Cell Admixture
Tumor microenvironment plays an important role in the development and prognosis of tumors, and the main components of TME are immune and stromal cells (Koelwyn et al., 2017). To infer the stromal, immune, and other non-tumor component admixture in the TME of medulloblastomas, immune score, stromal score, and tumor purity of each sample were calculated using the Estimation of STromal and Immune cells in MAlignant Tumor tissues using an Expression data (ESTIMATE) algorithm (Yoshihara et al., 2013). We then compared the immune score, stromal score, and tumor purity between the high-risk and low-risk group classified by our risk model, and we also assessed their correlations with the risk score.
Analysis of Tumor Infiltrating Immune Cells (TIICs)
CIBERSORTx6 is an algorithm developed to estimate the abundance of TIICs based on gene expression data. Using the CIBERSORTx algorithm, we profiled 22 immune cells in each medulloblastoma sample. We then analyzed the correlation between the fraction of the immune cells and the expression level of the newly identified candidate genes (including signature genes and network hub genes). We also compared the fraction of infiltrating immune cells between the high-risk and low-risk group indicated by the 13-gene signature model.
Statistical Analysis
R software version 3.6.2 and SPSS software version 21 were used for all statistical analysis. Spearman’s correlation between continuous variables, such as risk score, level of gene expression (log2 transformed), immune score, stromal score, tumor purity, and immune cell fraction, were evaluated, and p-values were adjusted using the BH method. Continuous variables between different subgroups of medulloblastomas were compared using Wilcoxon rank-sum test (Mann–Whitney U test), or Kruskal–Wallis H test followed by Dunn’s post hoc tests for pairwise comparisons. The p-value for survival analysis was calculated using R package “survminer” as aforementioned, and pairwise comparisons were performed using “pairwise_survdiff” function. The calculated p values were adjusted using the BH method provided by the package. P < 0.05 was considered statistically significant.
Results
Characteristics of the Studied Cohorts
After data preprocessing, 531 of 763 cases in the GSE85217 dataset and 70 of 76 cases in the GSE37418 dataset were included in this study (Table 1). Cases in GSE85217 were proportionately stratified by molecular subgroups and randomly assigned as training set (371, 70%) or validation set 1 (n = 160, 30%). Additionally, cases in GSE37418 were assigned as the external validation set 2 (n = 70).
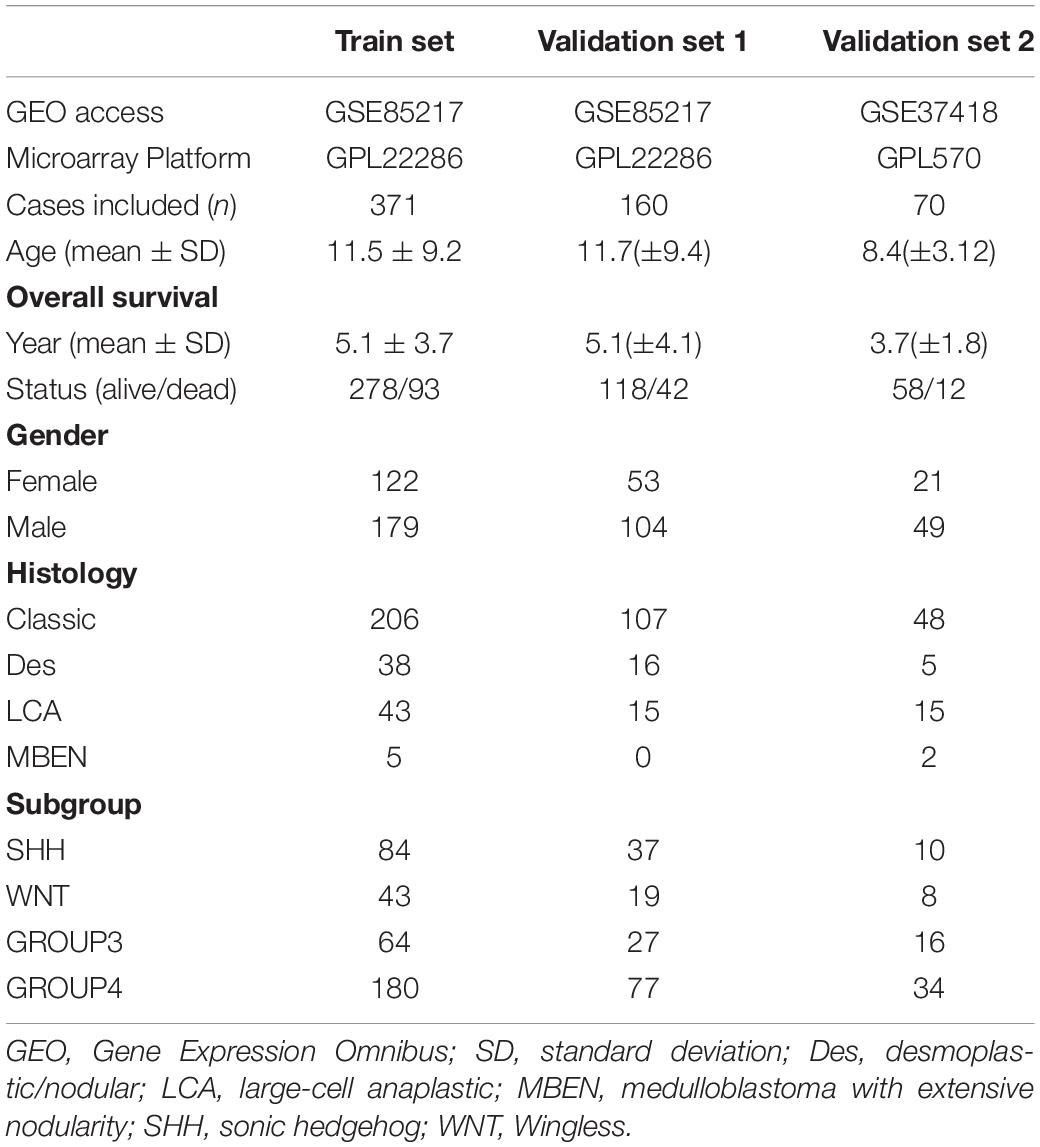
Table 1. Summary of studied cohorts.
The clinical characteristics of the datasets were summarized in Table 1, and the study design and workflow were summarized in Figure 1.
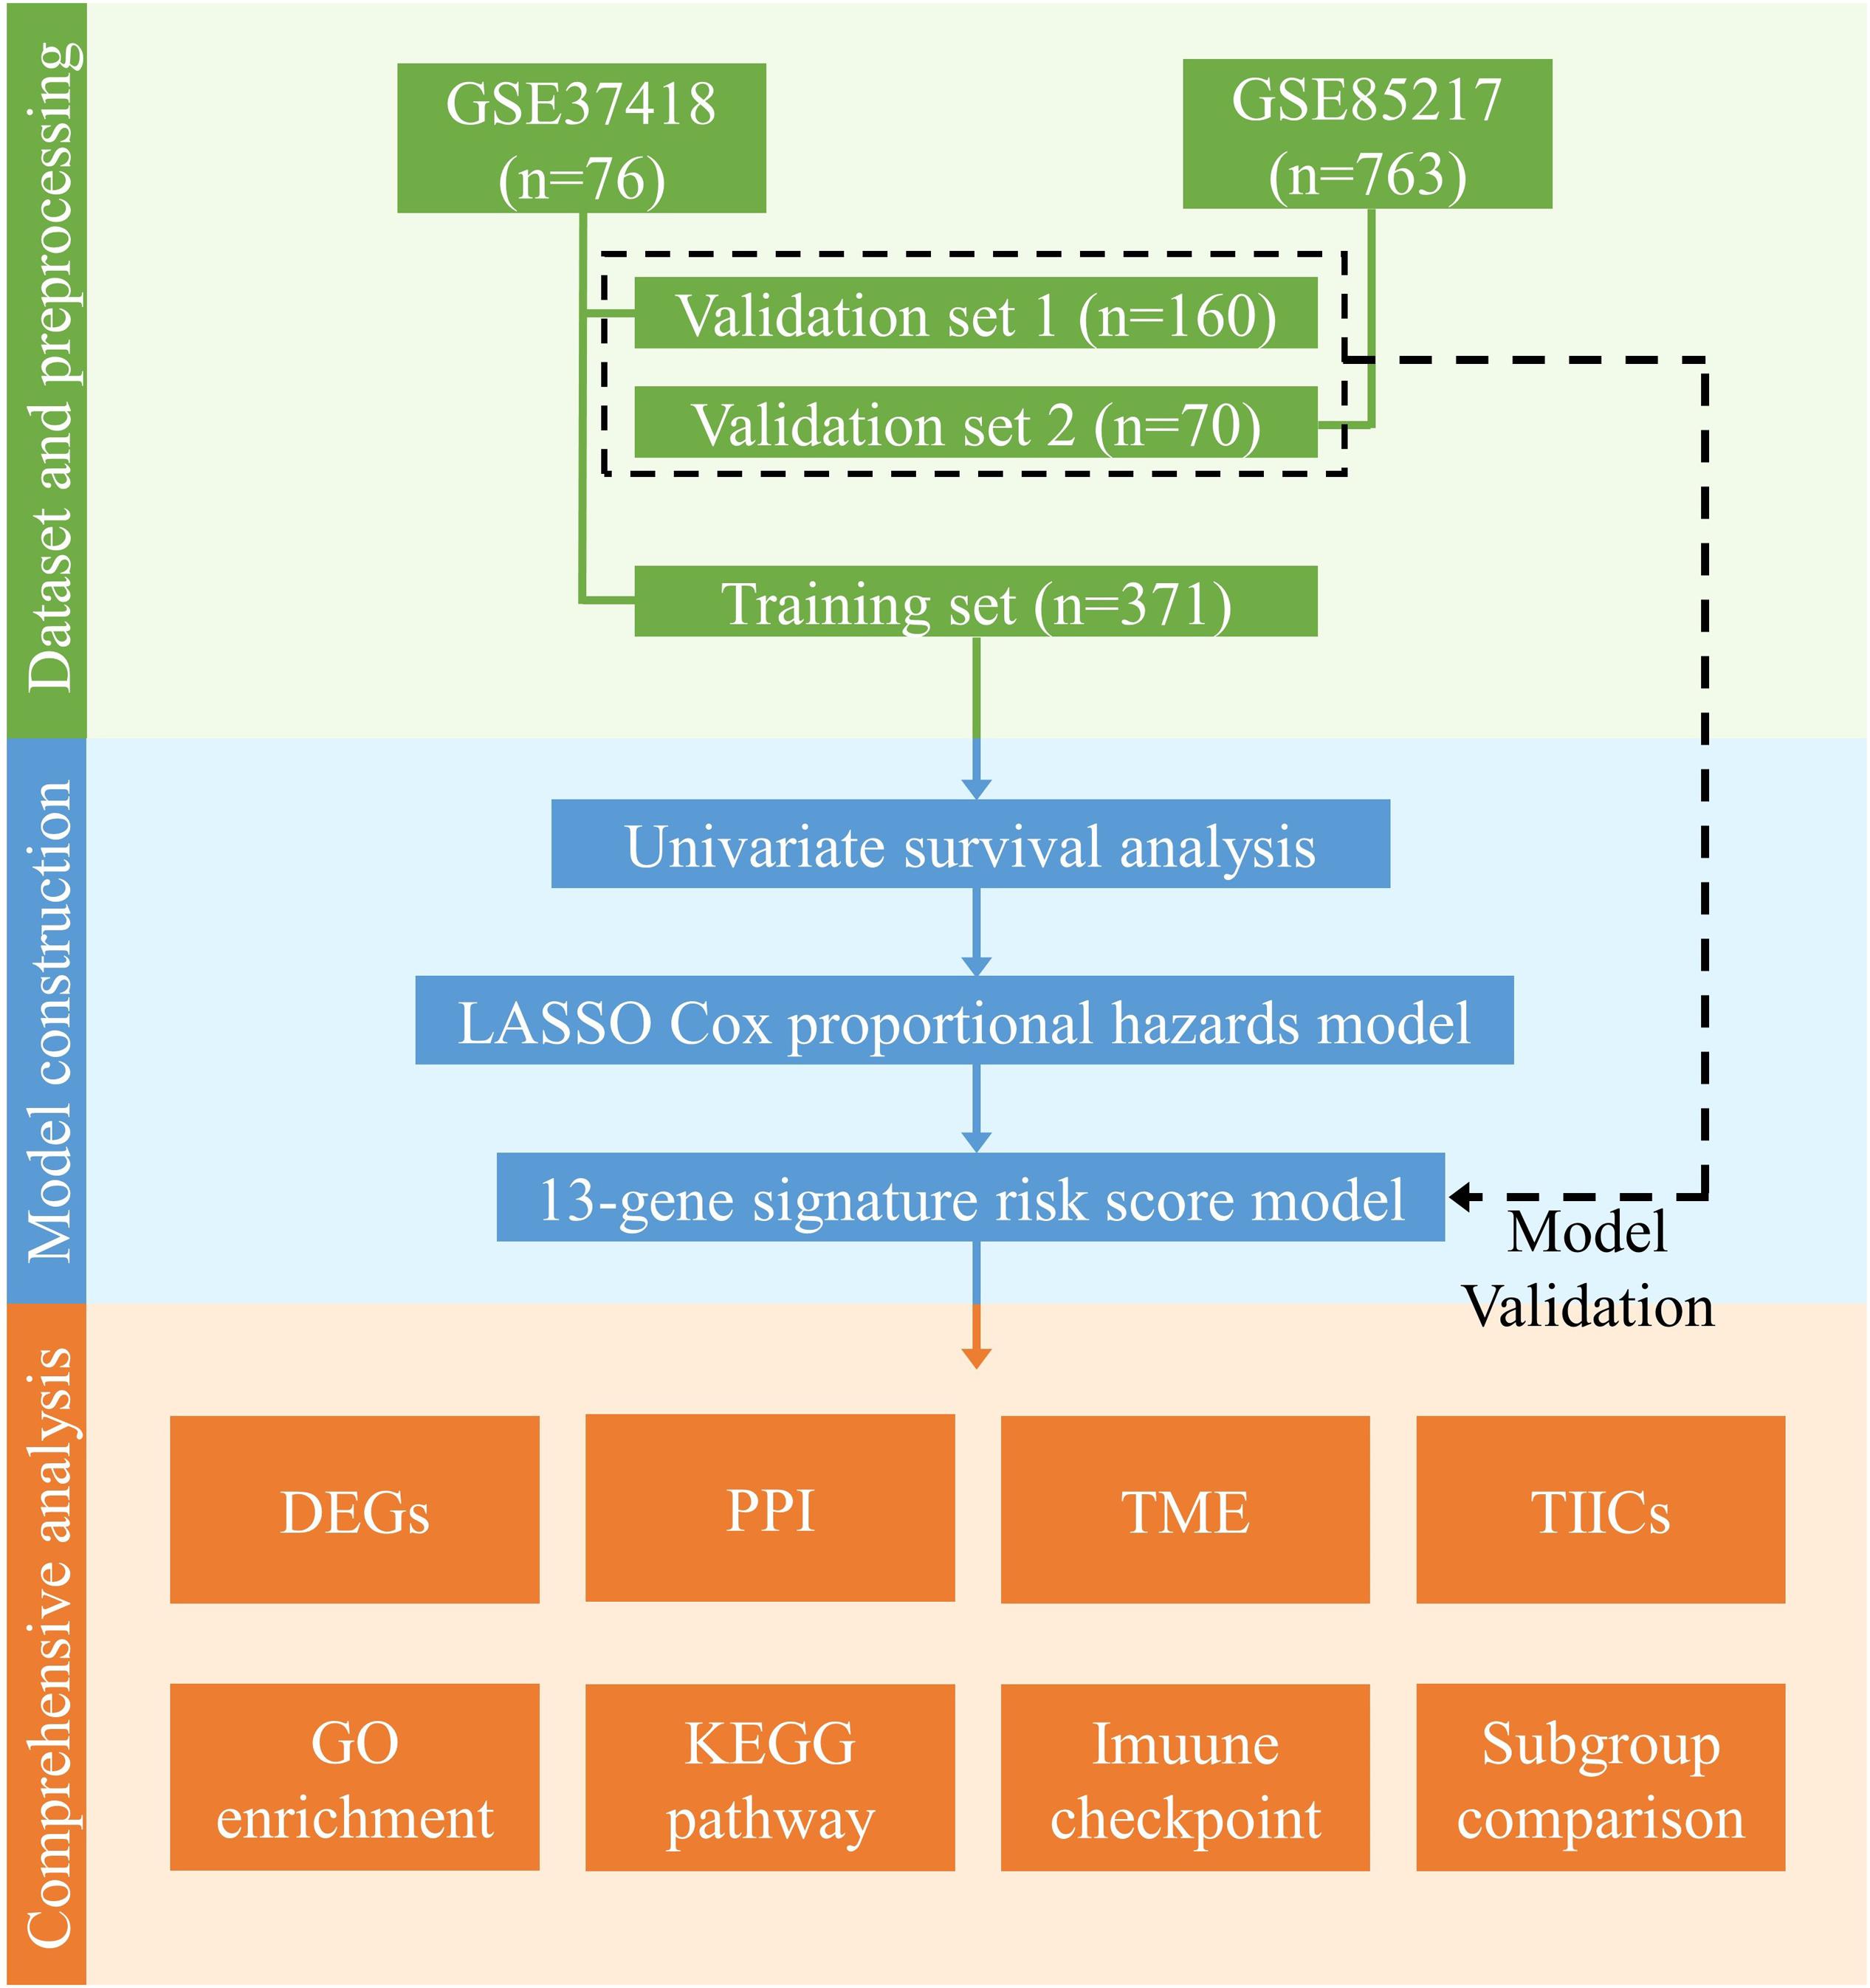
Figure 1. Design and workflow of this study. Public medulloblastoma datasets, including 763 (GSE85217) and 76 cases (GSE37418), were included in our analysis. Cases in GSE85217 were divided into the training set (n = 371) and validation set 1 (n = 160), and cases in GSE37418 were assigned as validation set 2 (n = 70) for cross-platform and external validation. We constructed our gene-signature-based risk score model using a training set and validated with two validation sets. Using the constructed model, we then performed comprehensive analysis, including analysis of DEGs, PPI network, TME, TIICs, immune checkpoint, KEGG pathways, and GO enrichment, as well as a comparison of established medulloblastoma molecular and histological subgroups.
Construction of the Gene Signature Model
Prognostic model was constructed using the training set (n = 371, GSE85217). We included 21028 of 21641 probes with description from the manufacture and unambiguously mapped genes, from the microarray platform (GPL22286). A univariate survival analysis was performed, and we identified 2,438 OS-related genes (Supplementary Table 1) (p < 0.05). We further screened these genes using LASSO-penalized regression, and 14 genes with none-zero coefficient was selected by cross-validation (Figure 2A and Table 2). Among them, we excluded ENSG00000186838 (Selenoprotein V, SELENOV), which cannot be properly mapped in the GPL570 platform. Finally, a total of 13 genes were selected for the construction of prognostic model, including cytochrome B5 domain containing 2 (CYB5D2), filamin binding LIM protein 1 (FBLIM1), interleukin 27 receptor subunit alpha (IL27RA), cell migration inducing hyaluronidase 1 (CEMIP), dynein axonemal heavy chain 2 (DNAH2), pitrilysin metallopeptidase 1 (PITRM1), FKBP prolyl isomerase 4 (FKBP4), Cyclin Y (CCNY), phospholipase A2 Group IVE (PLA2G4E), immunoglobulin kappa variable 1/OR2-108 (IGKV1OR2-108), ZFP3 Zinc Finger Protein (ZFP3), XK related 5 (XKR5), and spectrin repeat containing nuclear envelope family member 3 (SYNE3). Most of the 13 signature genes (except for IGKV1OR2-108, ZFP3, XKR5, and SYNE3) were reported to be related to neurological functions and diseases, which are summarized in Table 3 and will be further discussed in detail.
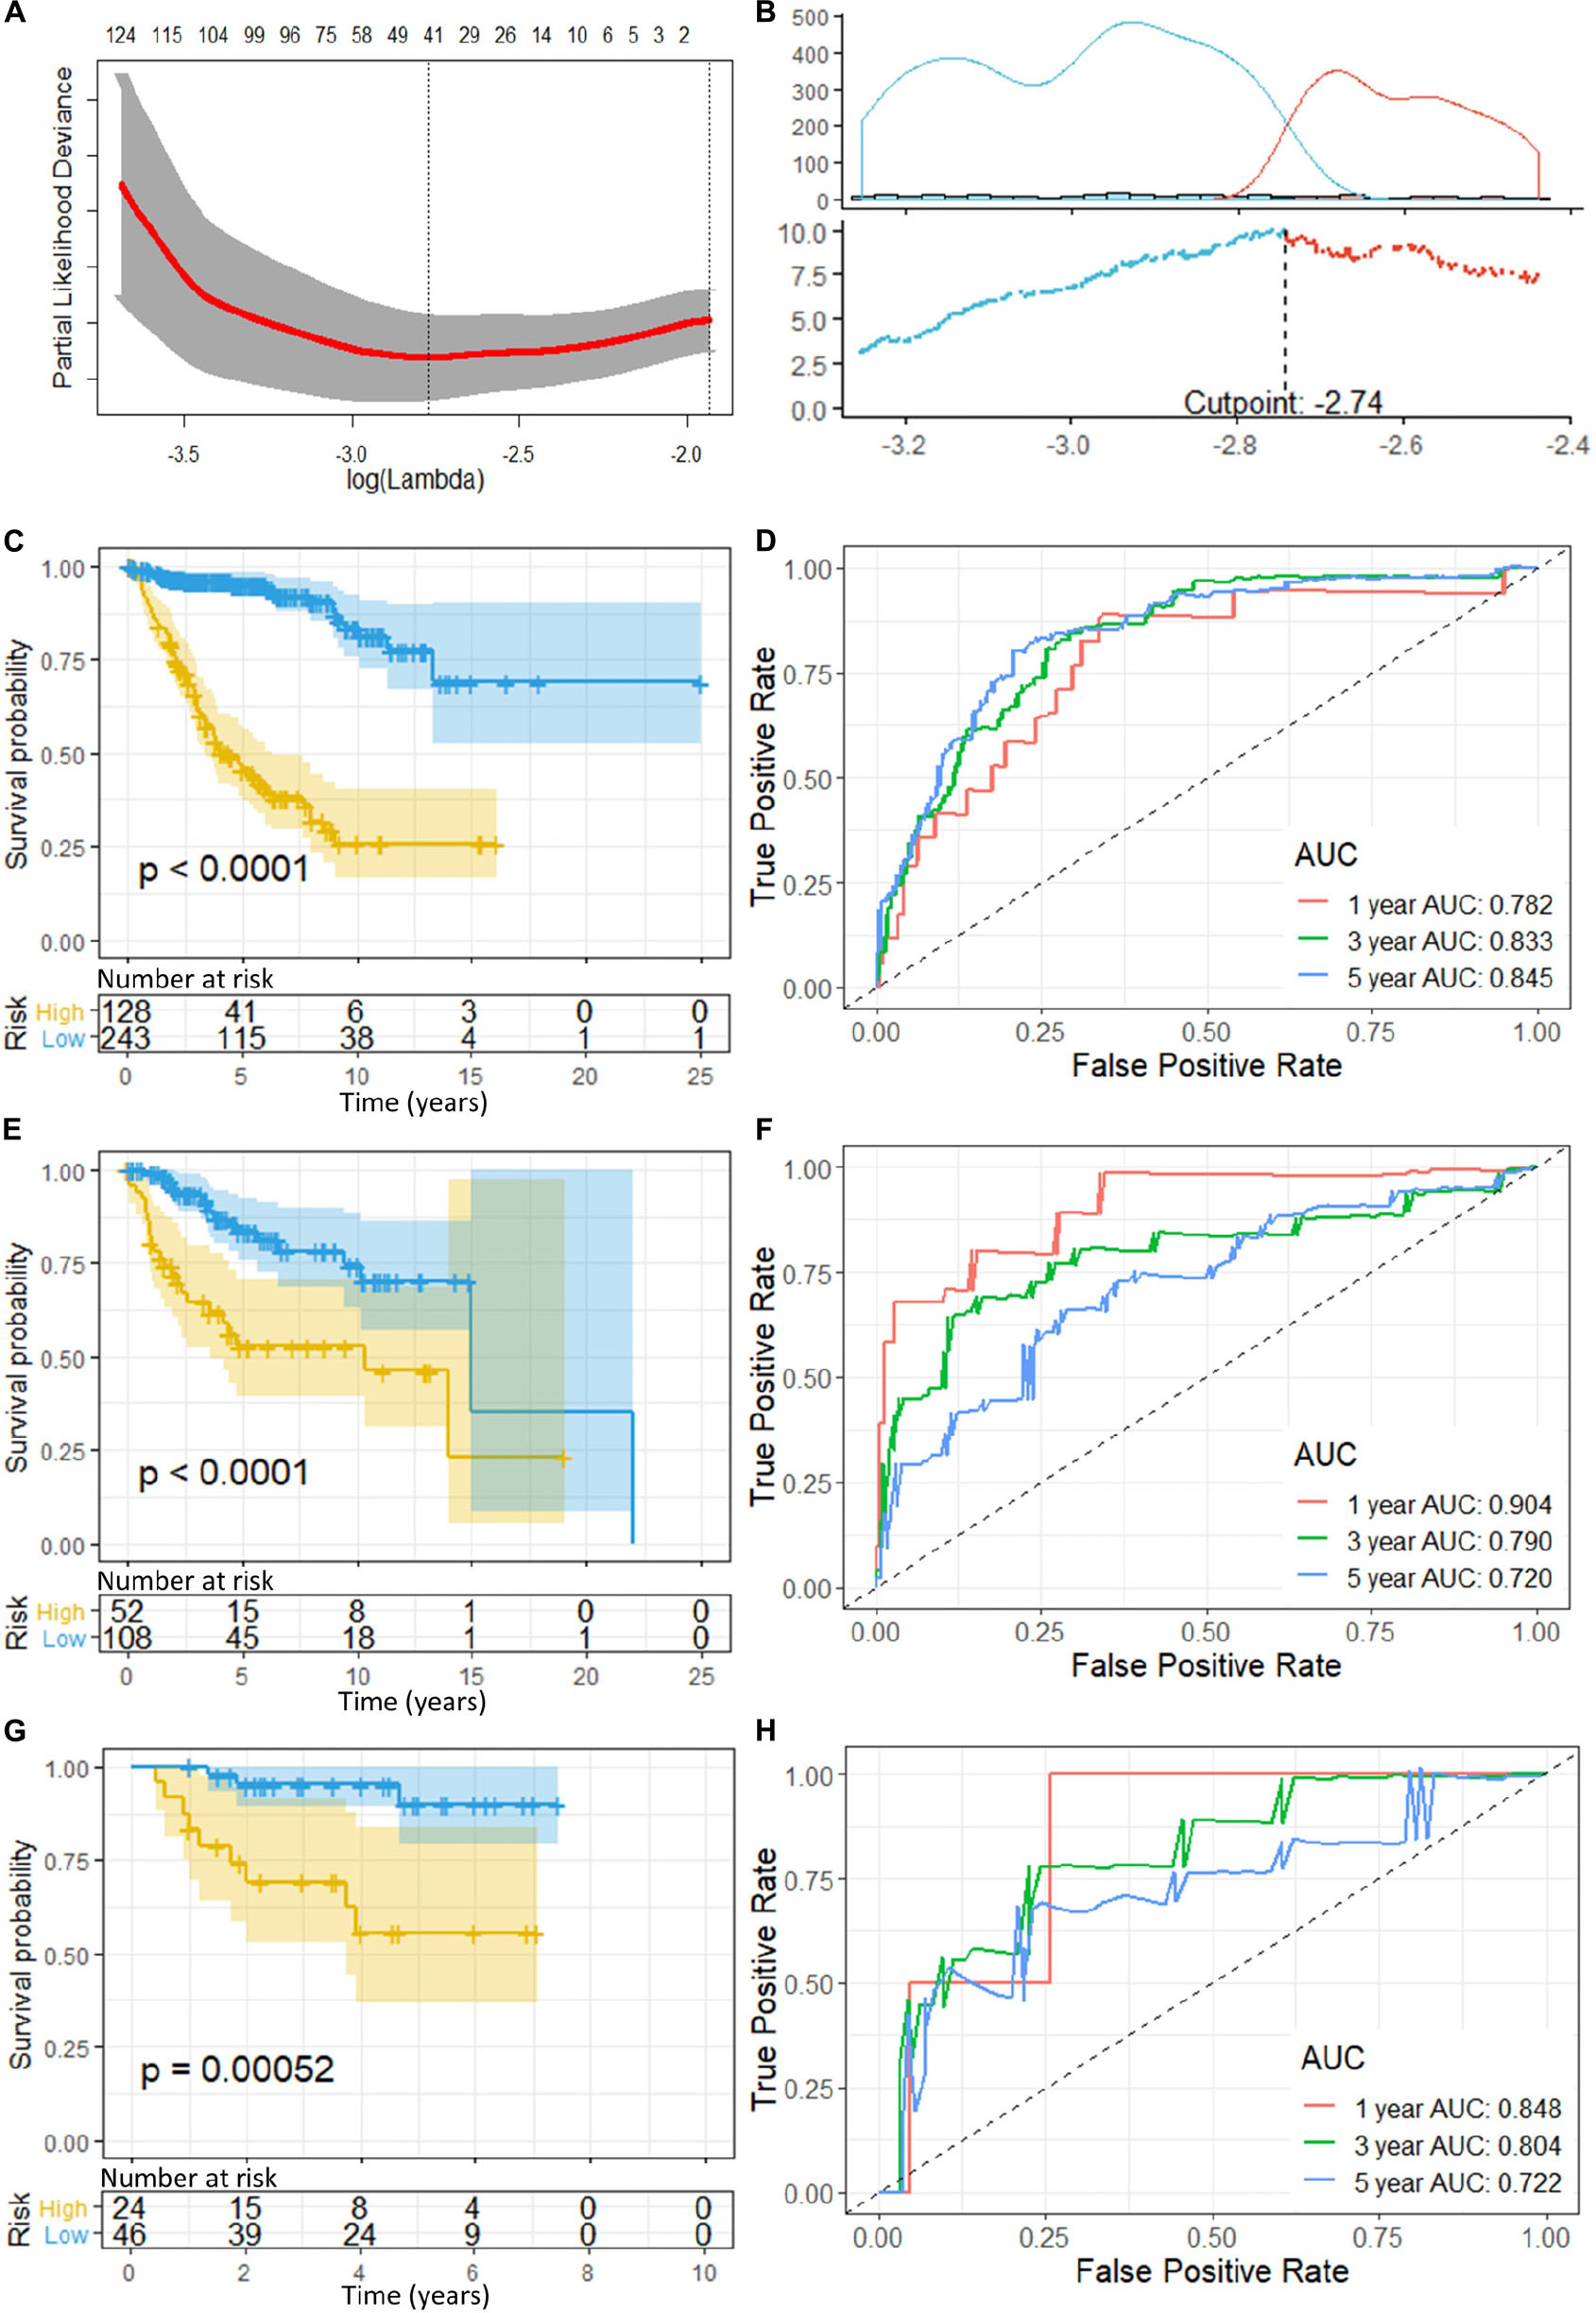
Figure 2. (A) Cross-validation of LASSO, the optimized log (lambda) was indicated by the dot line; (B) Optimizing the cutoff of the risk score using “maximally selected rank statistics method,” and an optimal cutoff of –2.74 was indicated; (C) K-M curve and (D) ROC of the training set; (E) K-M curve and (F) ROC of the validation set 1; and (G) K–M curve and (H) ROC of the validation set 2. P-value < 0.05 were considered statistically significant. Greater AUCs reflects better discrimination, while AUCs close to 0.5 reflects no discrimination. AUC, area under curve.
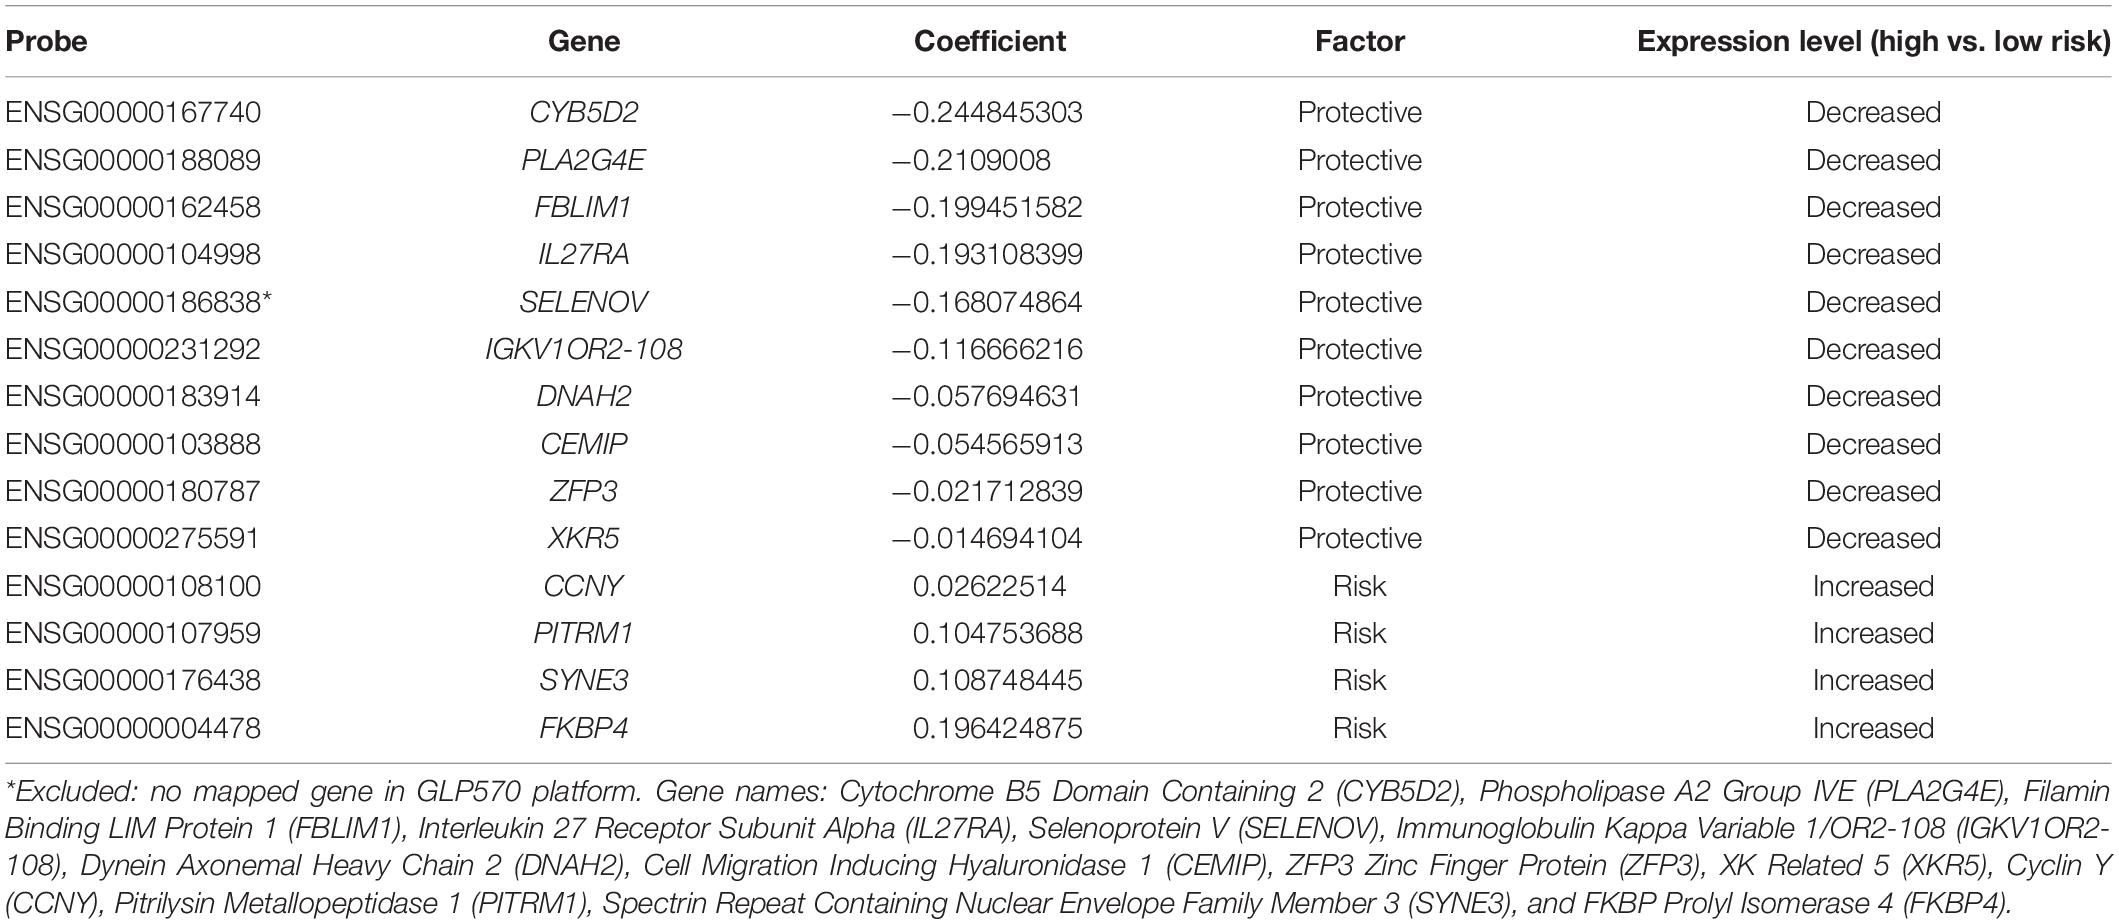
Table 2. Gene signature selected for model construction.
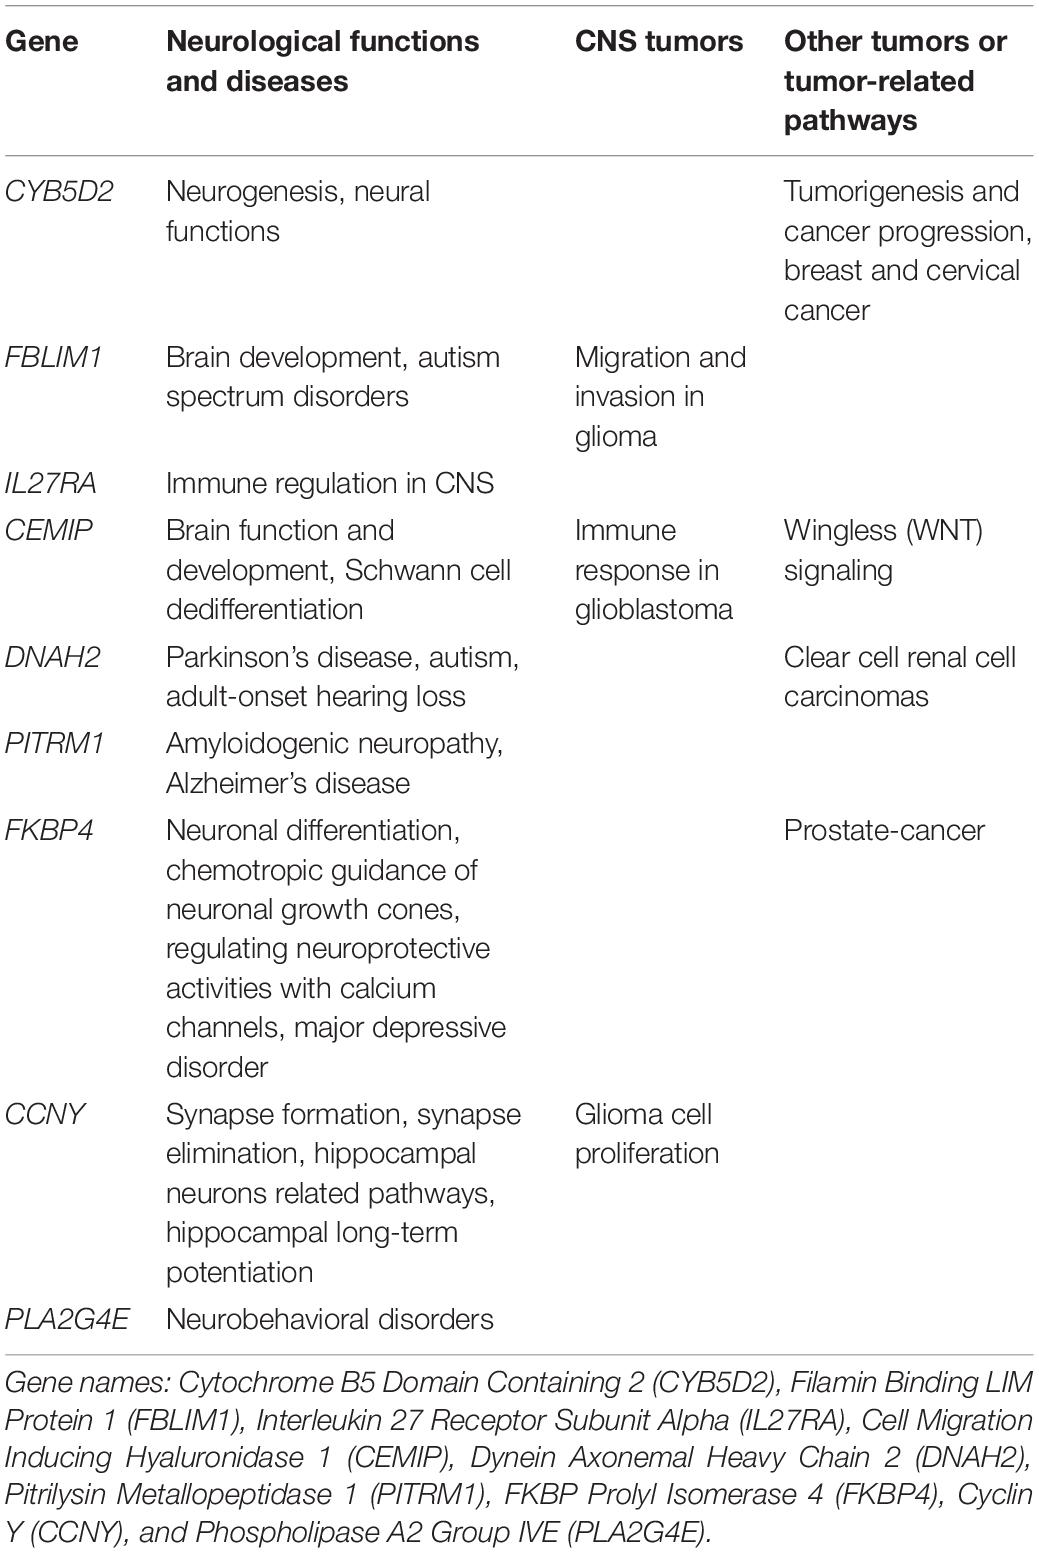
Table 3. Summary of signature genes related to neurological functions or diseases.
Risk scores for each patient can be calculated as:
“Maximally selected rank statistics method” indicated an optimal cutoff of −2.74 (Figure 2B) for the training set. Patients with a risk score of less than or equal −2.74 were classified into low-risk groups, while those above −2.74 were classified into high-risk groups. K–M curves were plotted, and patients in the high-risk group demonstrated significant worse OS than those in the low-risk group (high-risk n = 128, low-risk n = 243, p < 0.0001) (Figure 2C). ROC analysis was performed to assess the accuracy of the risk score model, and the AUCs for 1-, 3-, and 5-year OS were 0.782, 0.833, and 0.845, respectively (Figure 2D).
Validation of the Gene Signature Model
To validate the gene signatures, we applied the constructed model to the validation set 1 (n = 160, GSE85217), resulting in 52 high-risk cases and 108 low-risk cases, respectively. K–M curves demonstrated a significantly lower OS of the high-risk group compared with that of the low-risk groups (high-risk n = 52, low-risk n = 108, p < 0.0001) (Figure 2E). The ROC yielded AUCs of 0.904, 0.790, and 0.720 for 1-, 3-, and 5- year OS prediction, respectively (Figure 2F). These analyses indicated a great performance of our 13-gene signature model predicting the OS of the patients in the validation set 1.
Additionally, we applied the constructed model to validation set 2 (n = 70, GSE37418), which was generated with a different study group and microarray platform (GPL570), to further validate its applicability. In validation set 2, 24 patients were predicated to be in the high-risk group while 46 were predicated to be in the low-risk group. K–M curves demonstrated a significant lower OS of the high-risk group compared with low-risk group (high-risk n = 24, low-risk n = 46, p = 0.00052) (Figure 2G). The ROC yielded AUCs of 0.848, 0.804, and 0.722 for 1-, 3-, and 5- year OS prediction, respectively (Figure 2H). These results were very similar to our training and validation set 1, indicating a consistent performance of our model when applied to an external, cross-platform dataset. To visualize the performance of the gene signature, heatmaps were plotted for the 13-gene signature in each dataset (Figure 3).
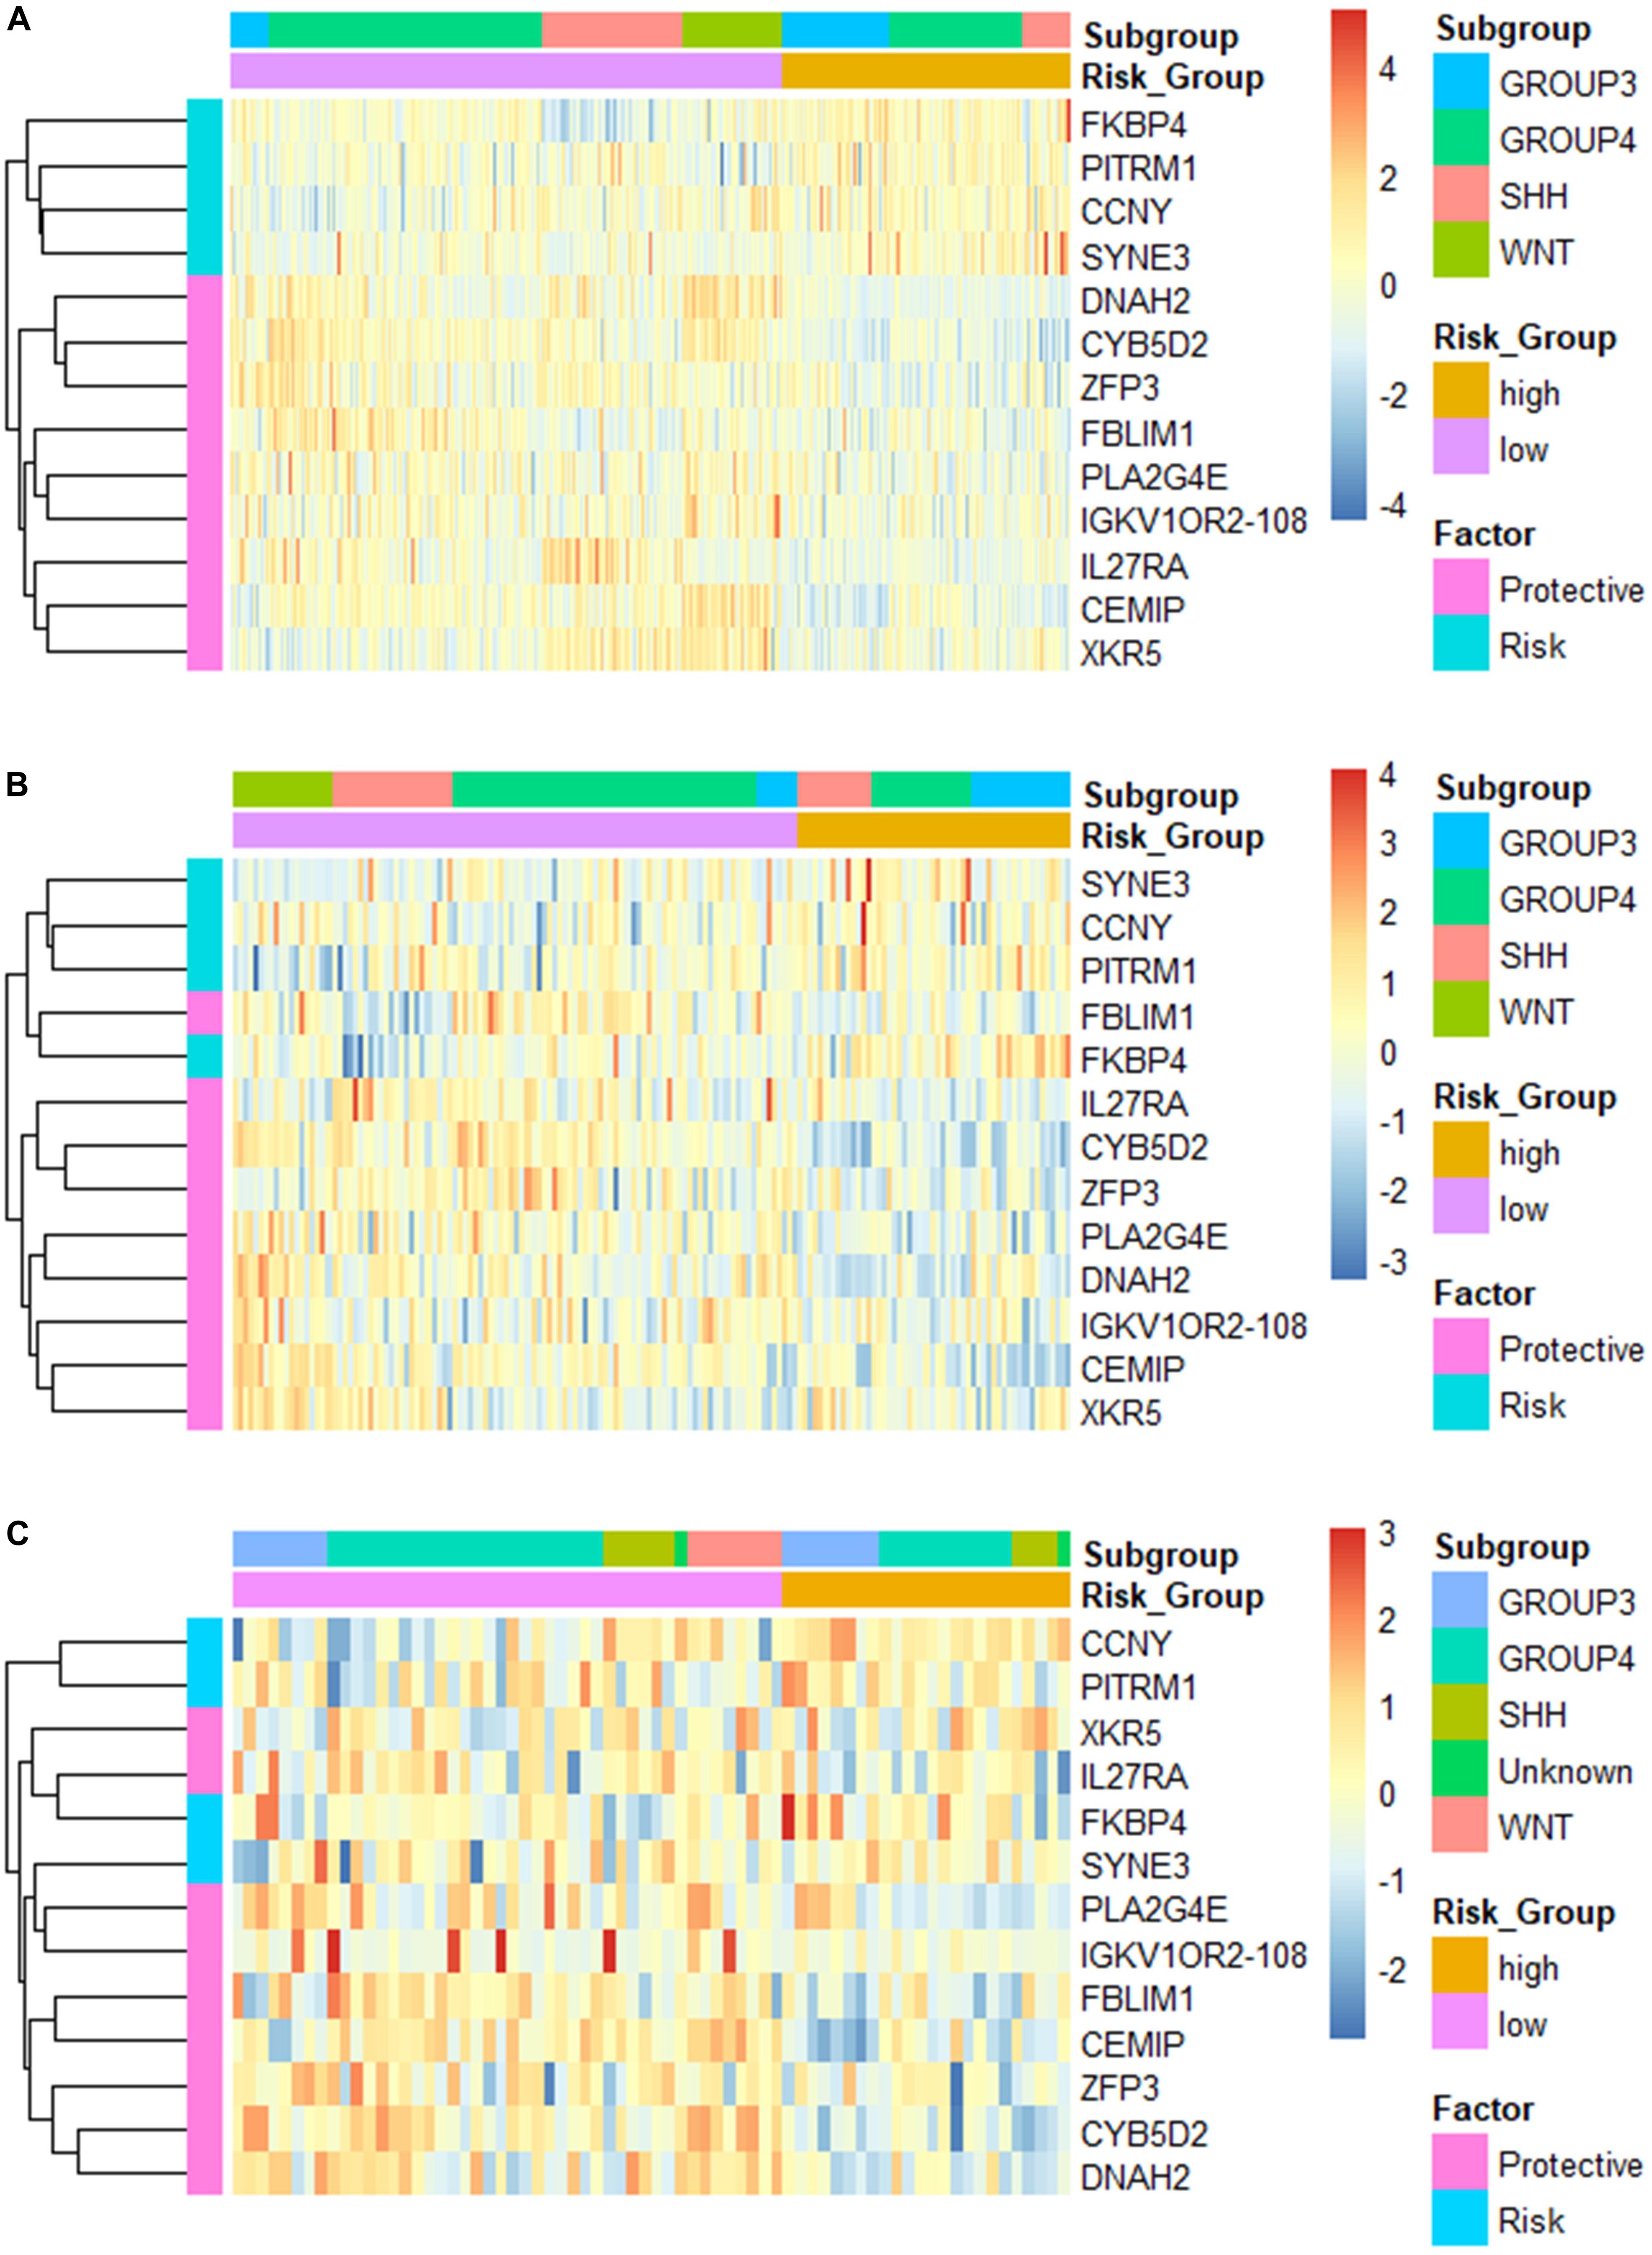
Figure 3. Heatmap of the constructed 13-gene signature for (A) training set; (B) validation set 1; and (C) validation set 2, clustered by gene expression level and risk groups.
Independent Predictive Value of the Gene Signature
Patients in the validation set 1 (n = 160) and validation set 2 (n = 70) were used to assess the independent predictive value of the 13-gene signature. Univariant Cox analysis demonstrated that the OS for patients was significantly associated with risk groups in both validation set 1 (Hazard ratio, HR = 0.31, p = 0.00022) and validation set 2 (HR = 0.14, p = 0.003), while no significant correlation with clinical factors including age, gender, and molecular subgroups were observed (Table 4). The risk group was the only factor significantly associated with OS in the multivariant cox analysis (Validation set 1: HR = 0.3, p = 0.00107; Validation set 2: HR = 0.14, p = 0.00407). Although a significant association between histology types and OS was observed in the validation set 1 in univariate analysis (HR = 1.7, p = 0.044), it was not significant when assessed in multivariant cox analysis (HR = 1.51, p = 0.12). These findings indicate that the risk group was an independent predictor for the OS.
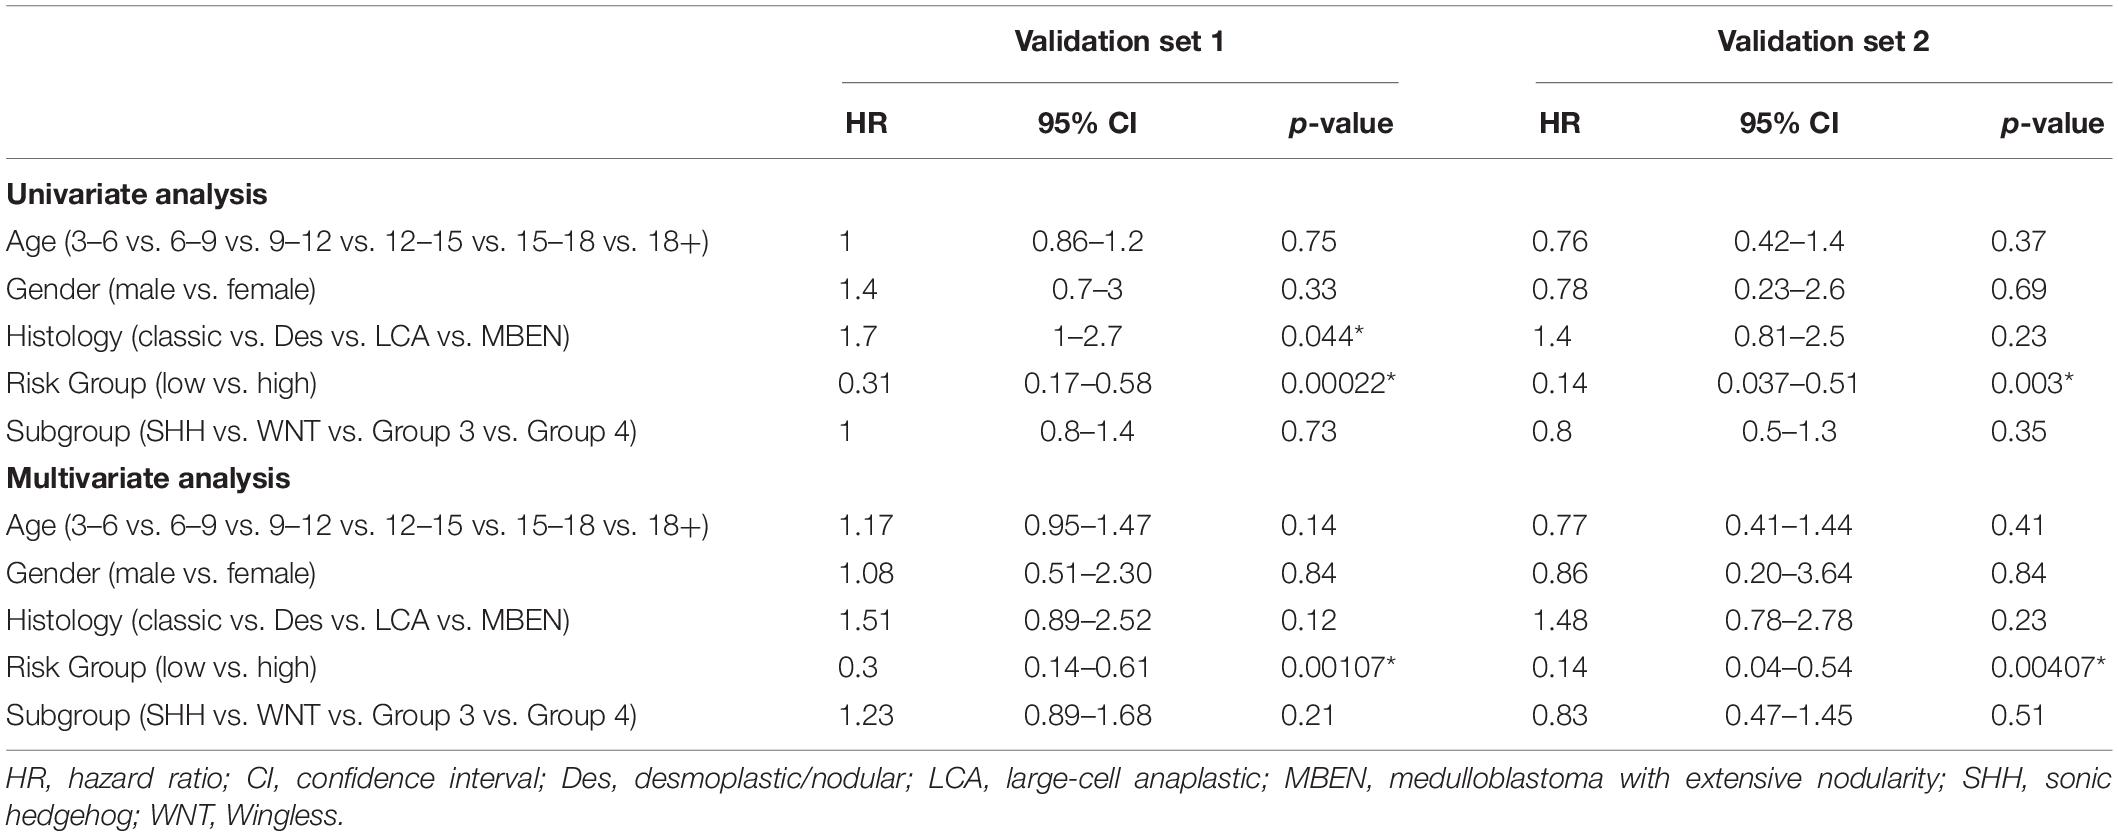
Table 4. Univariate and multivariate survival analysis for validation sets.
Comparison of Risk Scores Among Molecular and Histological Subgroups
Despite proven to be an independent predictor of the OS, the risk score seemed to vary among different medulloblastoma subgroups. We then compared the risk scores among established medulloblastoma molecular subgroups, including SHH, WNT, group 3, and group 4, as well as histology types, including classic, desmoplastic, LCA, and medulloblastoma with extensive nodularity (MBEN), using the GSE85217 dataset. We found that the risk score of each molecular and histological subgroup was consistent with its OS. For example, Group 3 medulloblastomas, known to feature the worst survival, were found to have the highest risk scores (Figure 4A) and the worst OS (Figure 4C), whereas WNT tumors, which are thought to have by far the best survival, demonstrated the lowest risk score (Figure 4A) and the best OS among all molecular subgroups (Figure 4C) (Kool et al., 2012; Taylor et al., 2012; Shih et al., 2014). LCA medulloblastomas were found to have the highest risk score, which was significantly higher than that of classic (p < 0.001) and desmoplastic medulloblastomas (p < 0.001) (Figure 4B). Consistently, LCA demonstrated the worst OS among all histology types, which was significantly shorter than that of classic (p < 0.001) and desmoplastic medulloblastomas (p < 0.001) (Figure 4D).
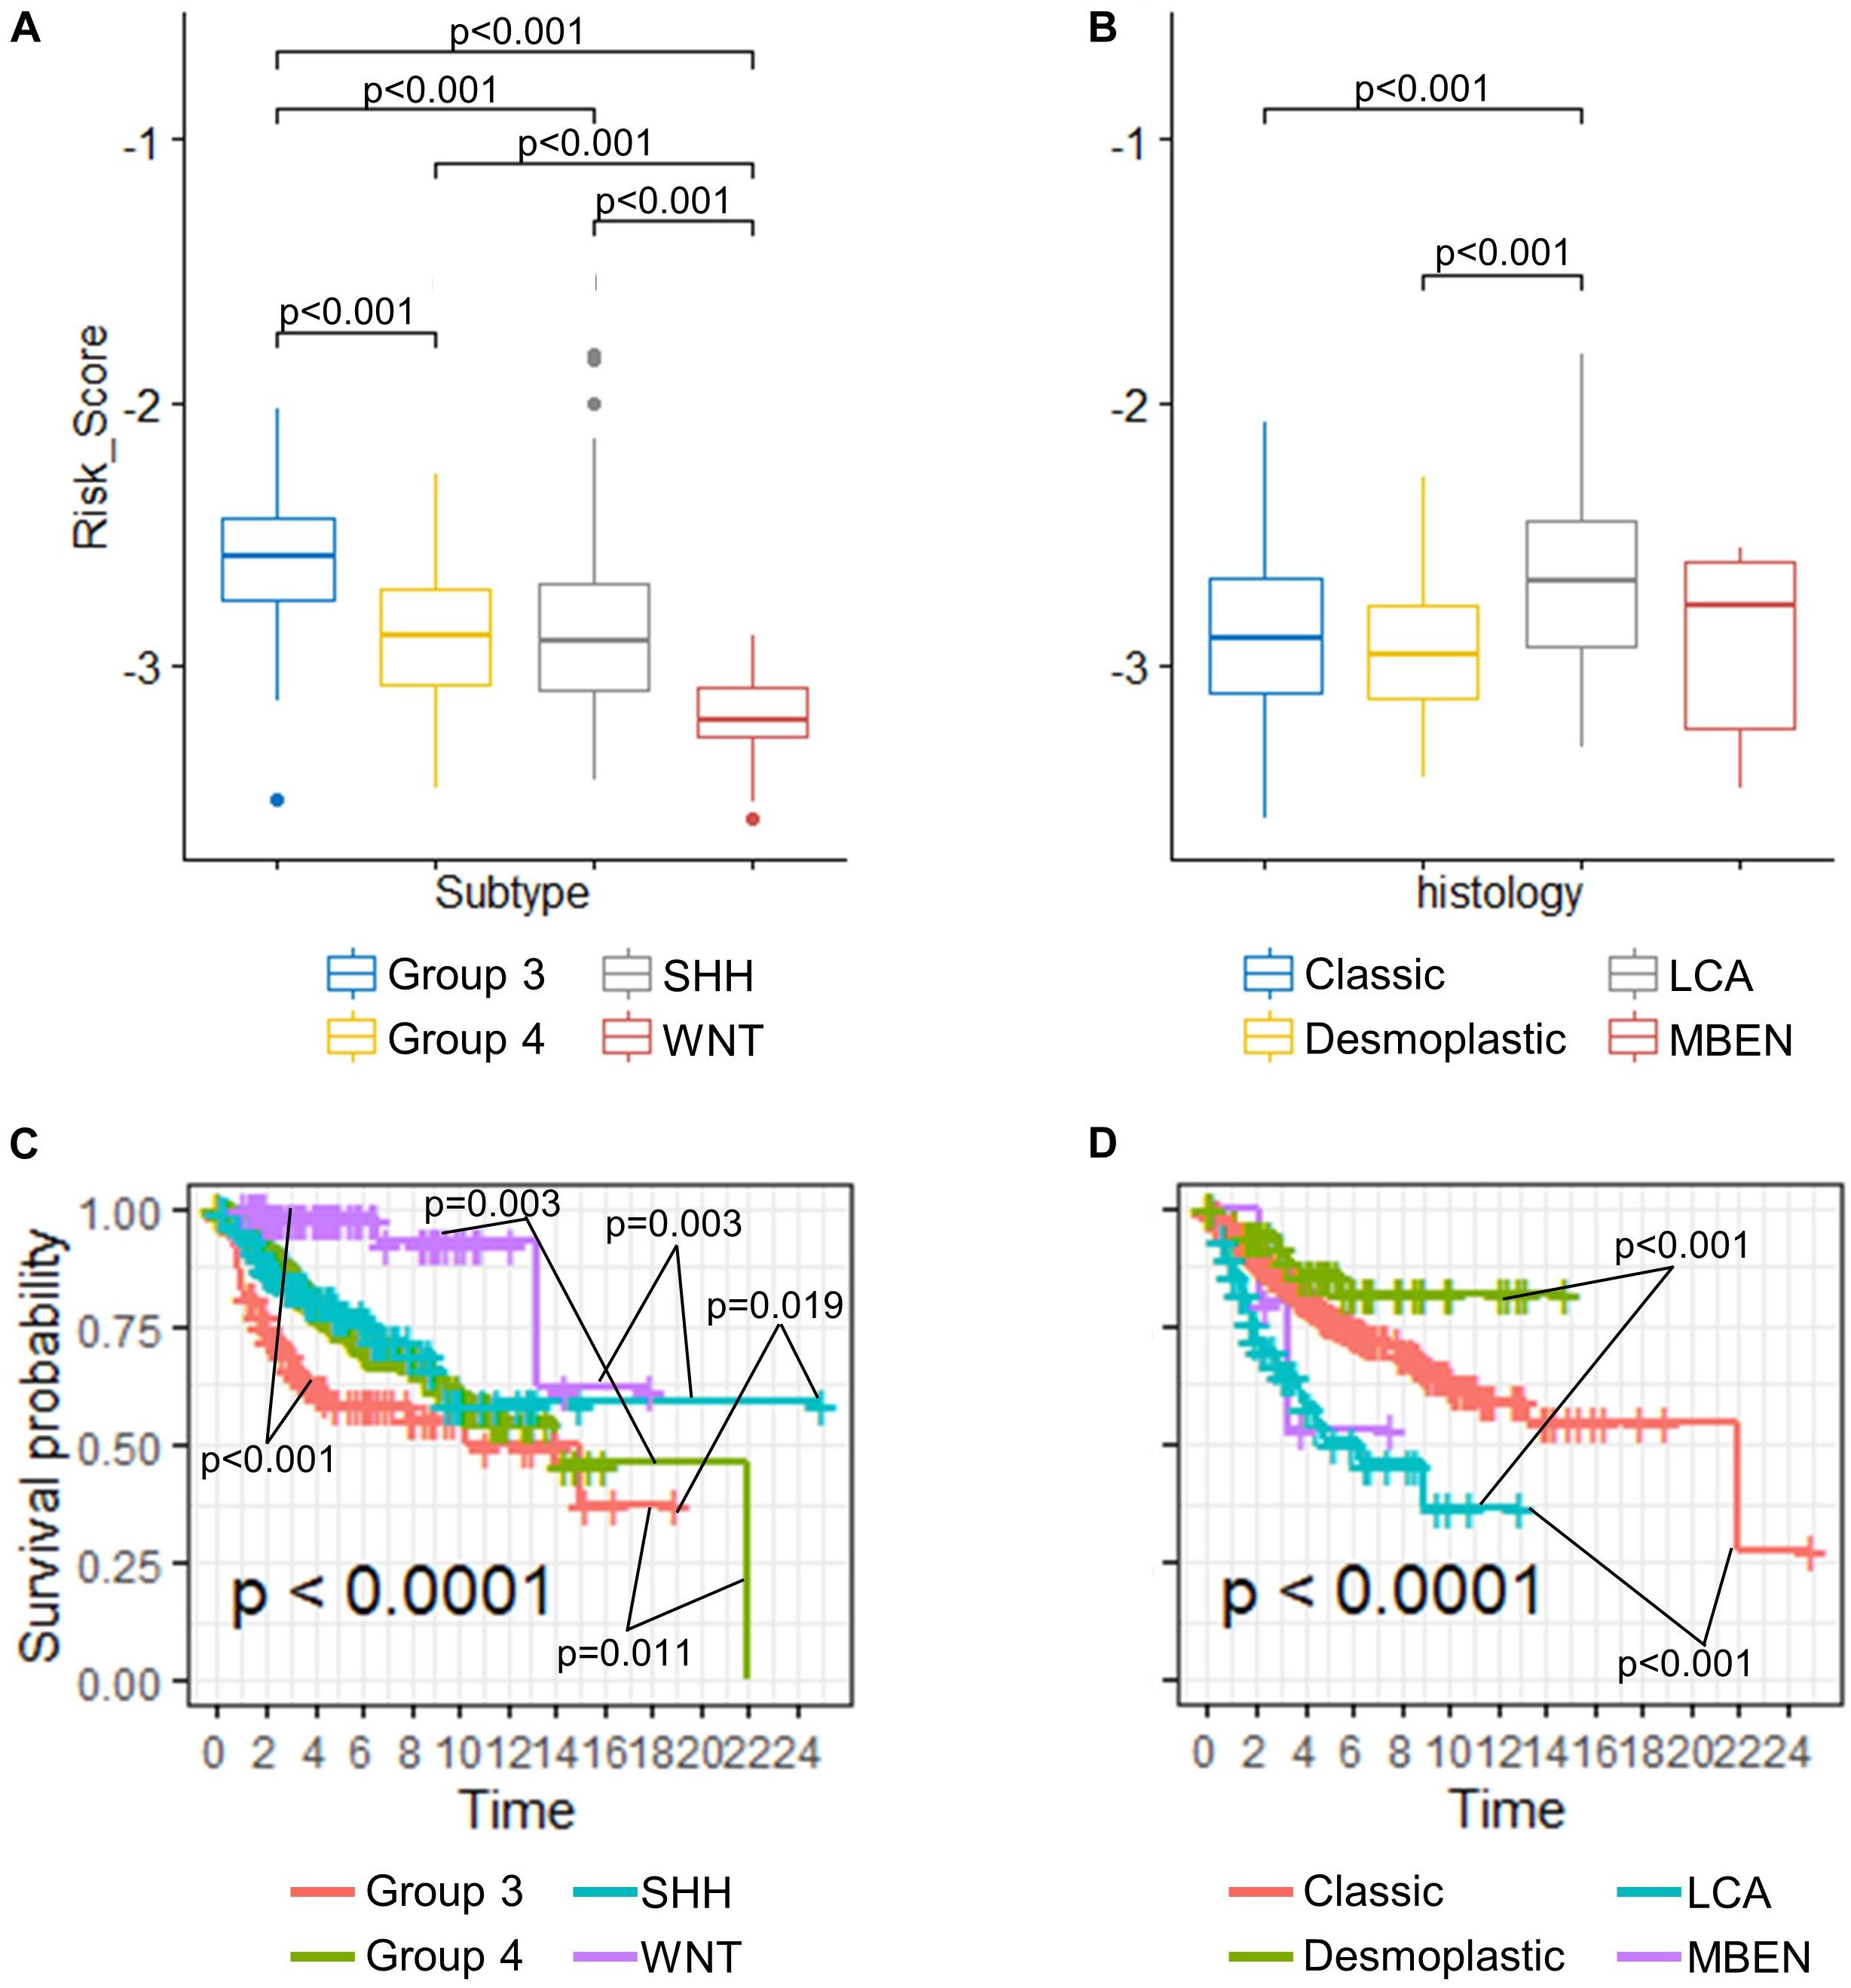
Figure 4. (A) Comparison of risk scores in different (A) molecular subgroups and (B) histological subtypes (Kruskal–Wallis H test followed by Dunn’s post hoc tests for pairwise comparisons). K–M curves of different (C) molecular subgroups and (D) histological subtypes (P-values were calculated using “survminer” and were adjusted using the BH method).
Differentially Expressed Gene (DEG), GO Enrichment, and KEGG Analysis
Using the validated gene signature model and expression data of GSE85217 (high-risk n = 180, low-risk n = 351), we identified 265 DEGs (Figure 5A and Supplementary Table 2) between the high-risk and low-risk group. GO analysis demonstrated that these genes were highly related to neurological functions, as DEGs were found to be significantly enriched in biological processes, such as axon development, axonogenesis, axon guidance, neuron projection guidance, and neuron fate commitment; cellular components, such as presynapse, synaptic membrane, neuronal cell body, postsynaptic membrane, synaptic vesicle membrane, and GABA-ergic synapse; and molecular functions, such as substrate-specific channel activity and channel activities, including the ion channel, gated channel, cation channel, and voltage-gated channel (Figure 5B). A KEGG analysis demonstrated enrichment of DEGs in synapse-related pathways (Figure 5C and Supplementary Table 3) and the WNT signaling pathway, which was widely reported in medulloblastomas (Xia et al., 2019; Majd and Penas-Prado, 2019).
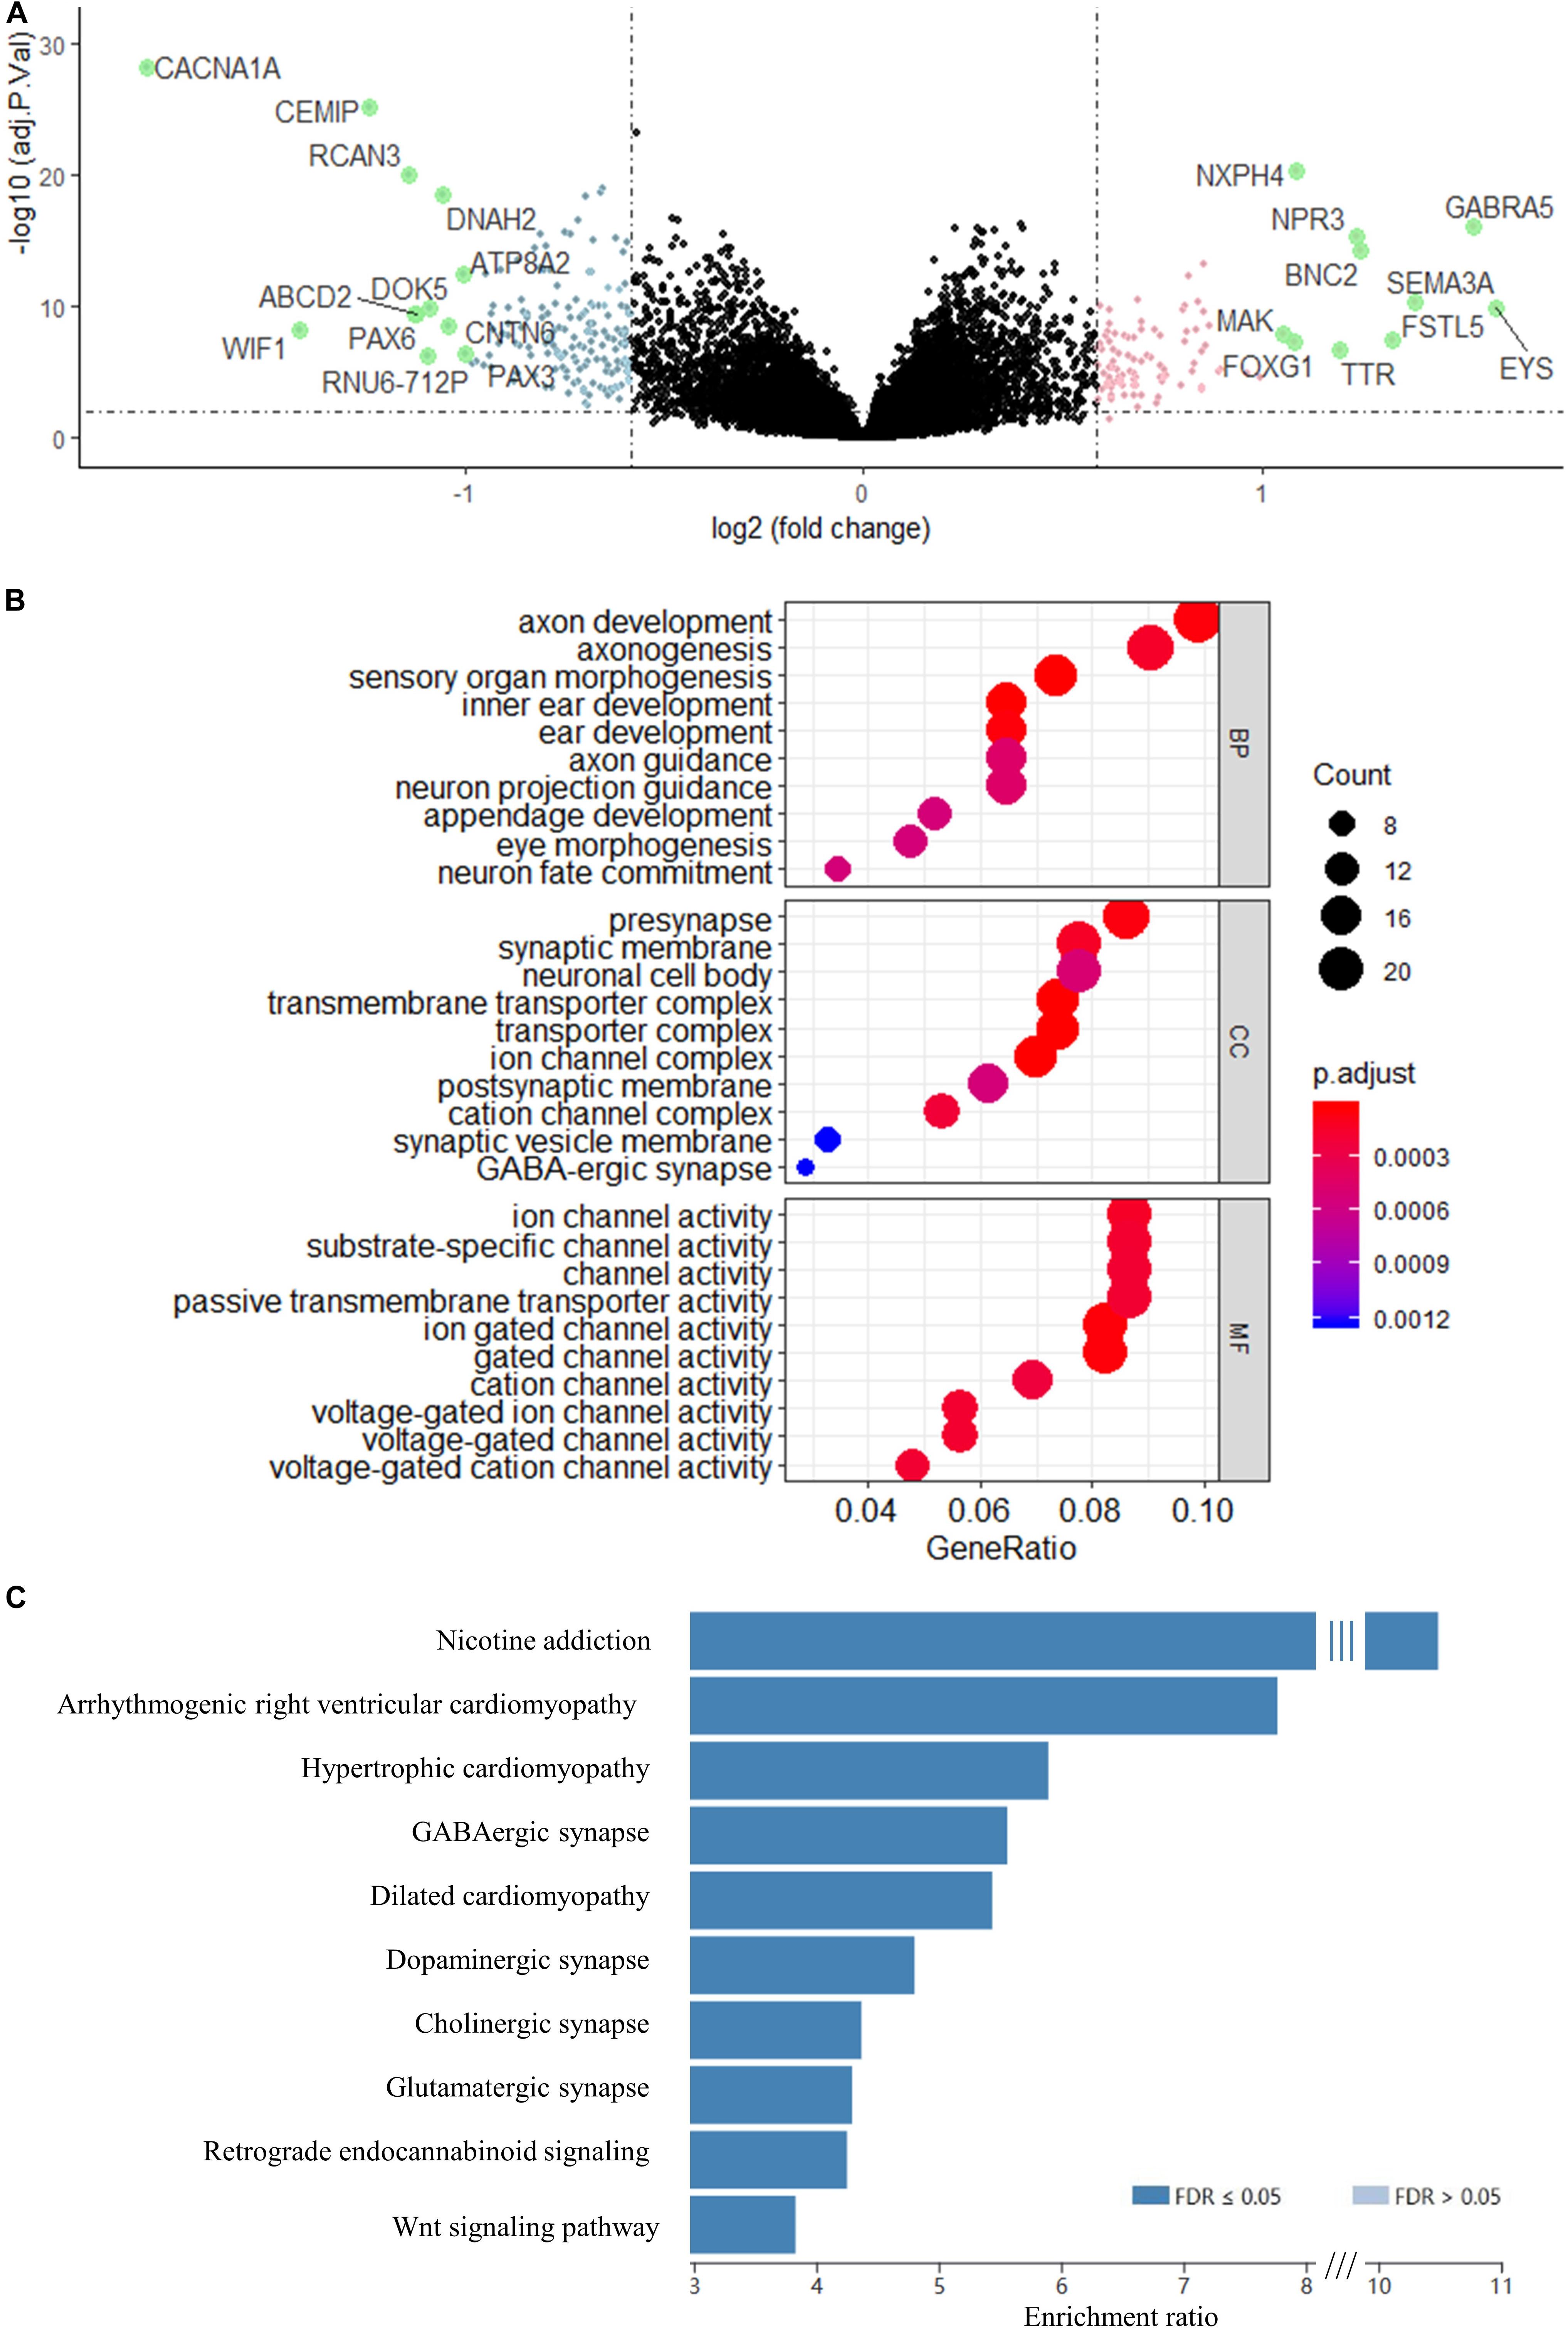
Figure 5. Volcano map of DEGs between risk groups. Genes with a red color were upregulated, whereas genes with a blue were downregulated. Genes with absolute Log2FC > 1 are highlighted in green. (B) GO enrichment analysis of the DEGs. BP, biological process; CC, cellular component; MF, molecular function. (C) KEGG analysis of the DEGs. Genes were selected by “TOP” 10 method using WEB-based Gene Set Analysis Toolkit.
PPI Network Analysis and Prediction of Hub Genes and Network Modules
To further understand the interaction between the DEGs and their roles in medulloblastoma, PPI network of these genes was constructed using STRING database and was visualized using Cytoscape. STRING analysis identified 254 nodes and 400 edges in this PPI network (enrichment p < 0.001) (Figure 6A and Supplementary Table 4). Using MCODE, three modules were identified from the PPI network (Figure 6B and Supplementary Table 6).
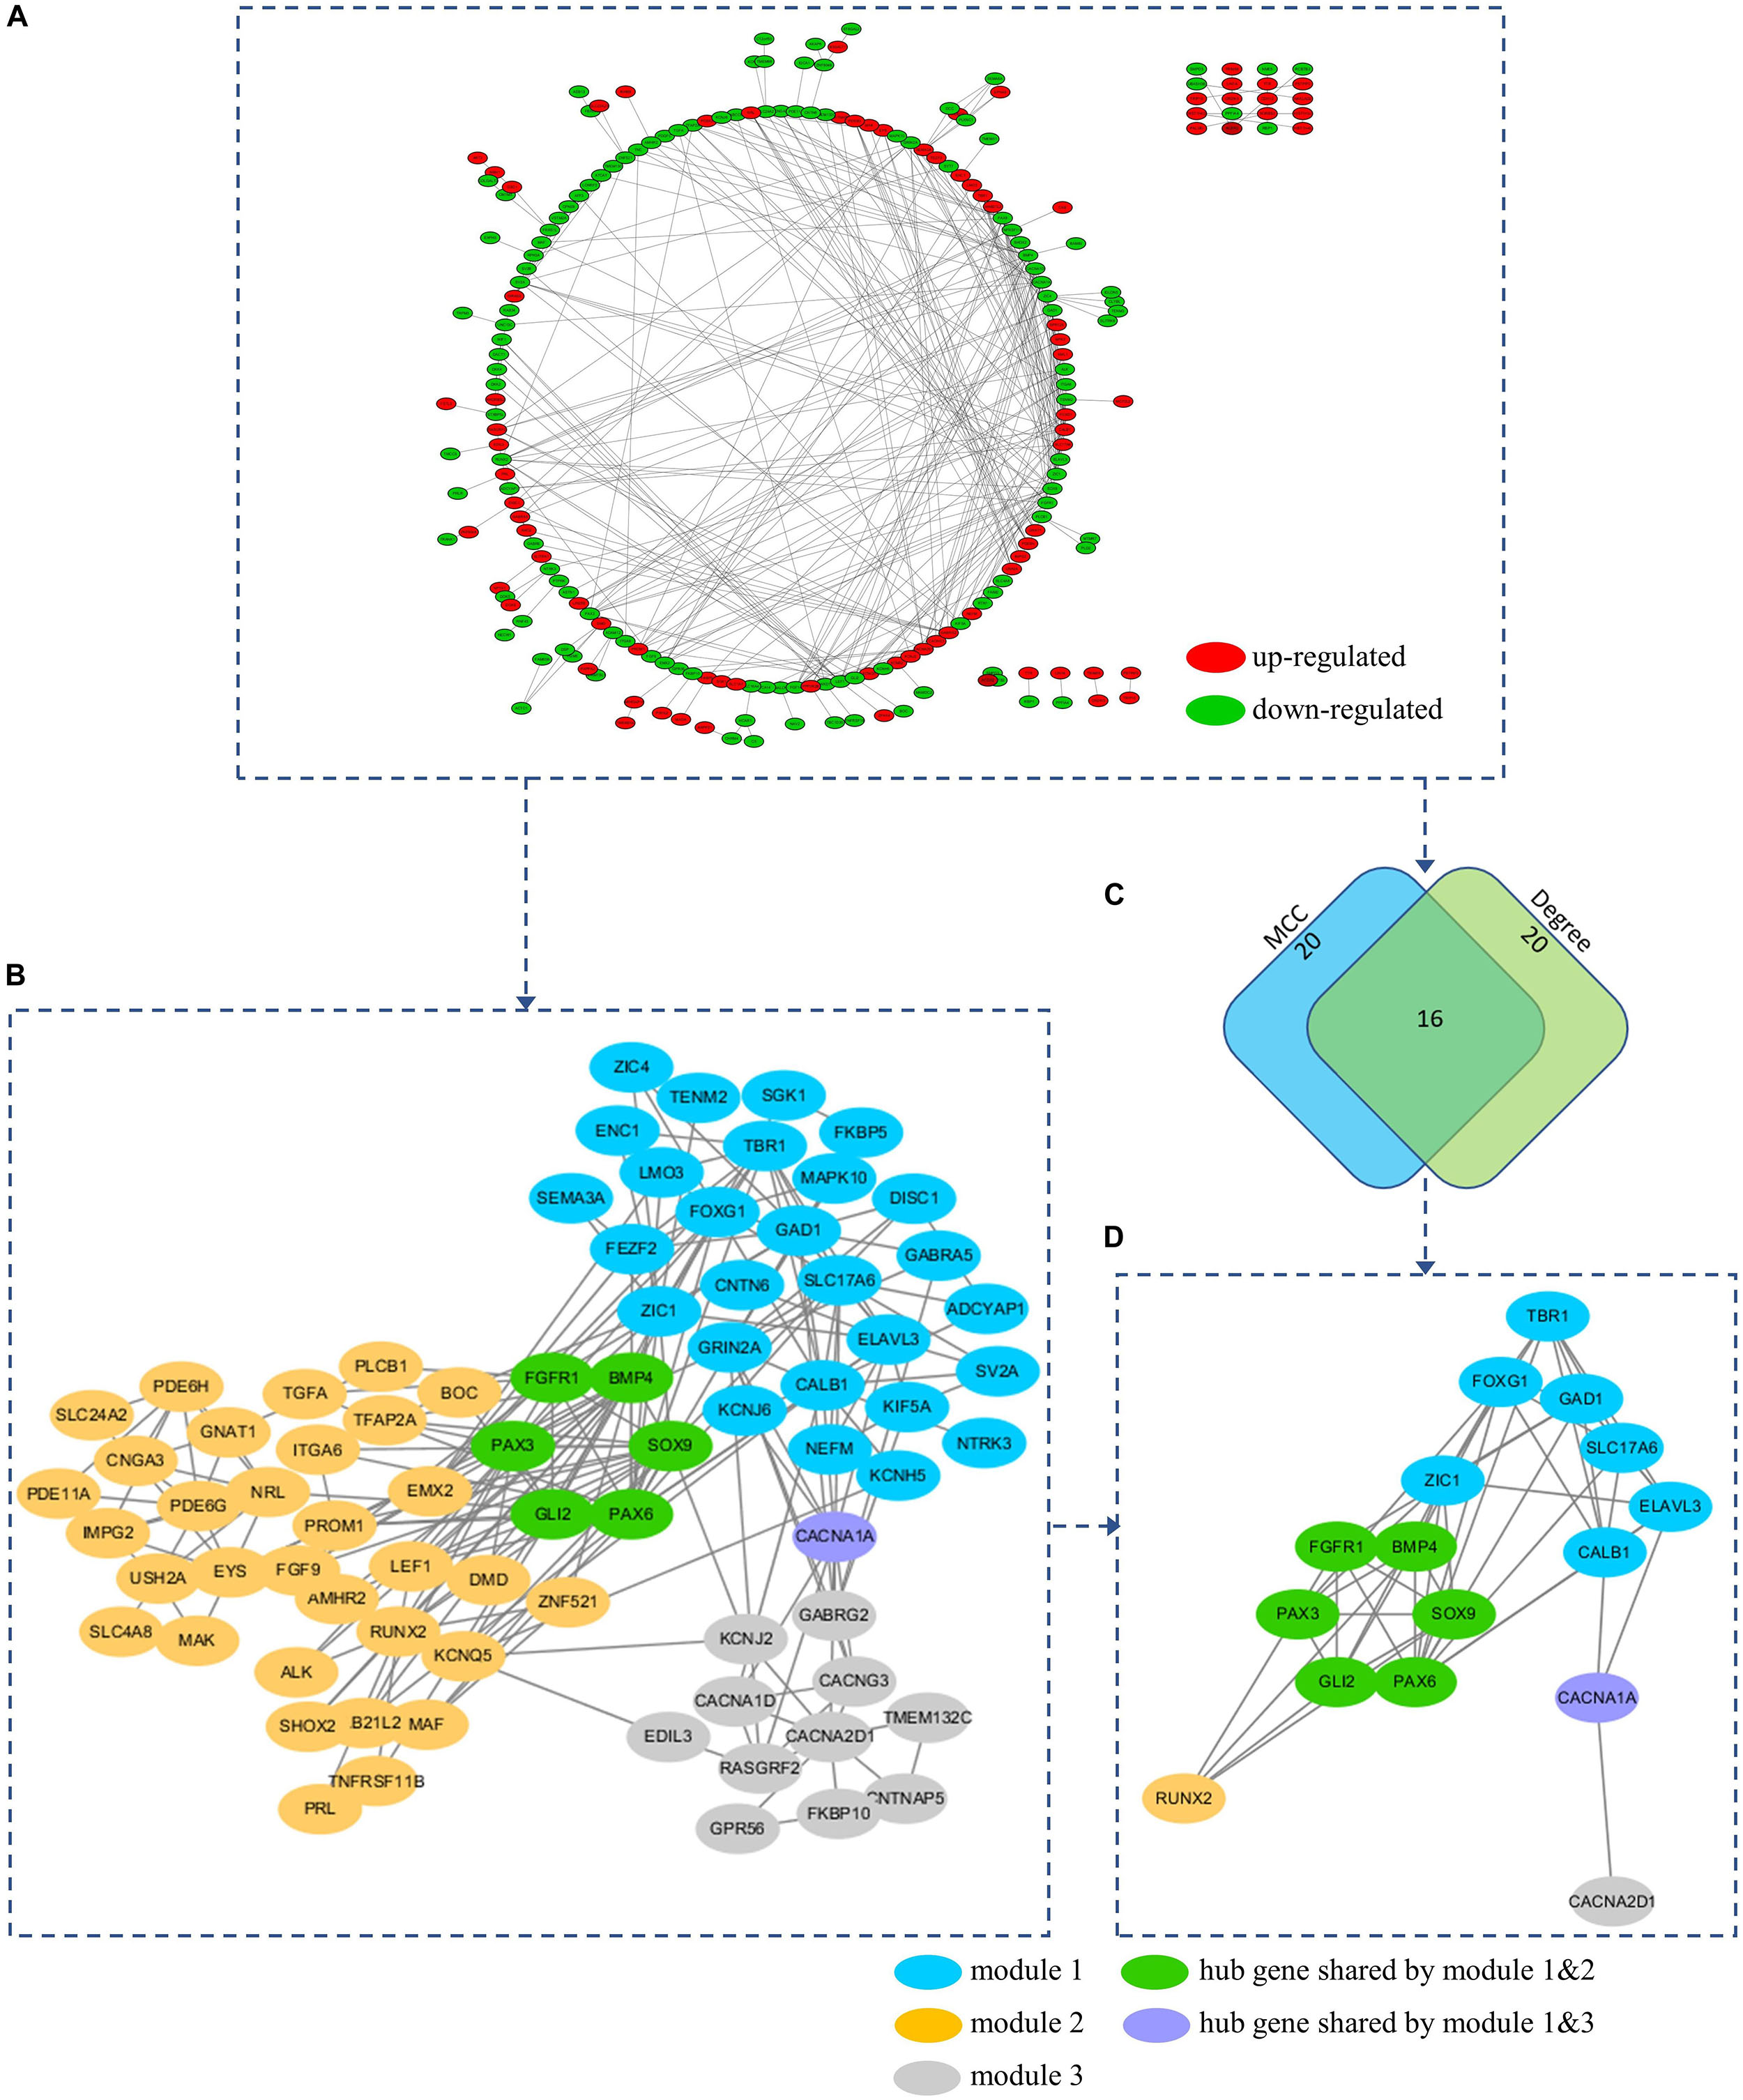
Figure 6. (A) PPI network of the DEGs. (B) A total of 3 modules (blue, yellow, and gray nodes) were identified from the PPI network using MCOD. (C) Hub genes were predicted based on the MCC and Degree method using Cytohubba. (D) A total of 16 hub genes were predicted from the PPI network. All hub genes can be found in at least on module. Hub gene FGFR1, BMP4, PAX3, SOX9, GLI2, and PAX6 were presented in both module 1 and 2 (Green nodes). Hub gene CACNA1A was presented in both module 1 and 3 (Purple nodes).
To explore the underlying mechanism of these modules, a GO enrichment analysis was performed for each module. Interestingly, we found that DEGs in module 1 were significantly enriched in pathways that were related to the development and function of CNS (including forebrain development, axonogenesis, positive regulation, telencephalon development, neuron fate commitment, forebrain generation of neurons, neuron migration, forebrain neuron differentiation, diencephalon development, forebrain regionalization, and forebrain neuron fate commitment) (Figure 7A and Supplementary Table 7), while those in module 2 were significantly enriched in pathways that were related to embryonic development (including eye development, visual system development, sensory system development, appendage development, limb development, inner ear development, visual perception, sensory perception of light stimulus, sensory organ morphogenesis, appendage morphogenesis, limb morphogenesis, embryonic organ morphogenesis, chondrocyte differentiation, embryonic limb morphogenesis, embryonic appendage morphogenesis, odontogenesis, regulation of chondrocyte differentiation, regulation of cartilage development, and regulation of mesenchymal cell proliferation) (Figure 7B and Supplementary Table 7). Therefore, module 1 and module 2 might be involved in the development of medulloblastomas, which are known as embryonal CNS tumors. For DEGs in module 3, however, the underlying mechanism and its relevance to medulloblastomas were less clear (Figure 7C). Notably, four subunits of the calcium voltage-gated channel (CACN), which has been reported as a novel target for medulloblastoma therapy (Phan et al., 2017; Huang et al., 2018), were predicted, including calcium voltage-gated channel subunit alpha1 A (CACNA1A), calcium voltage-gated channel subunit alpha1 D (CACNA1D), calcium voltage-gated channel auxiliary subunit alpha2delta 1 (CACNA2D1), and calcium voltage-gated channel auxiliary subunit gamma 3 (CACNG3).
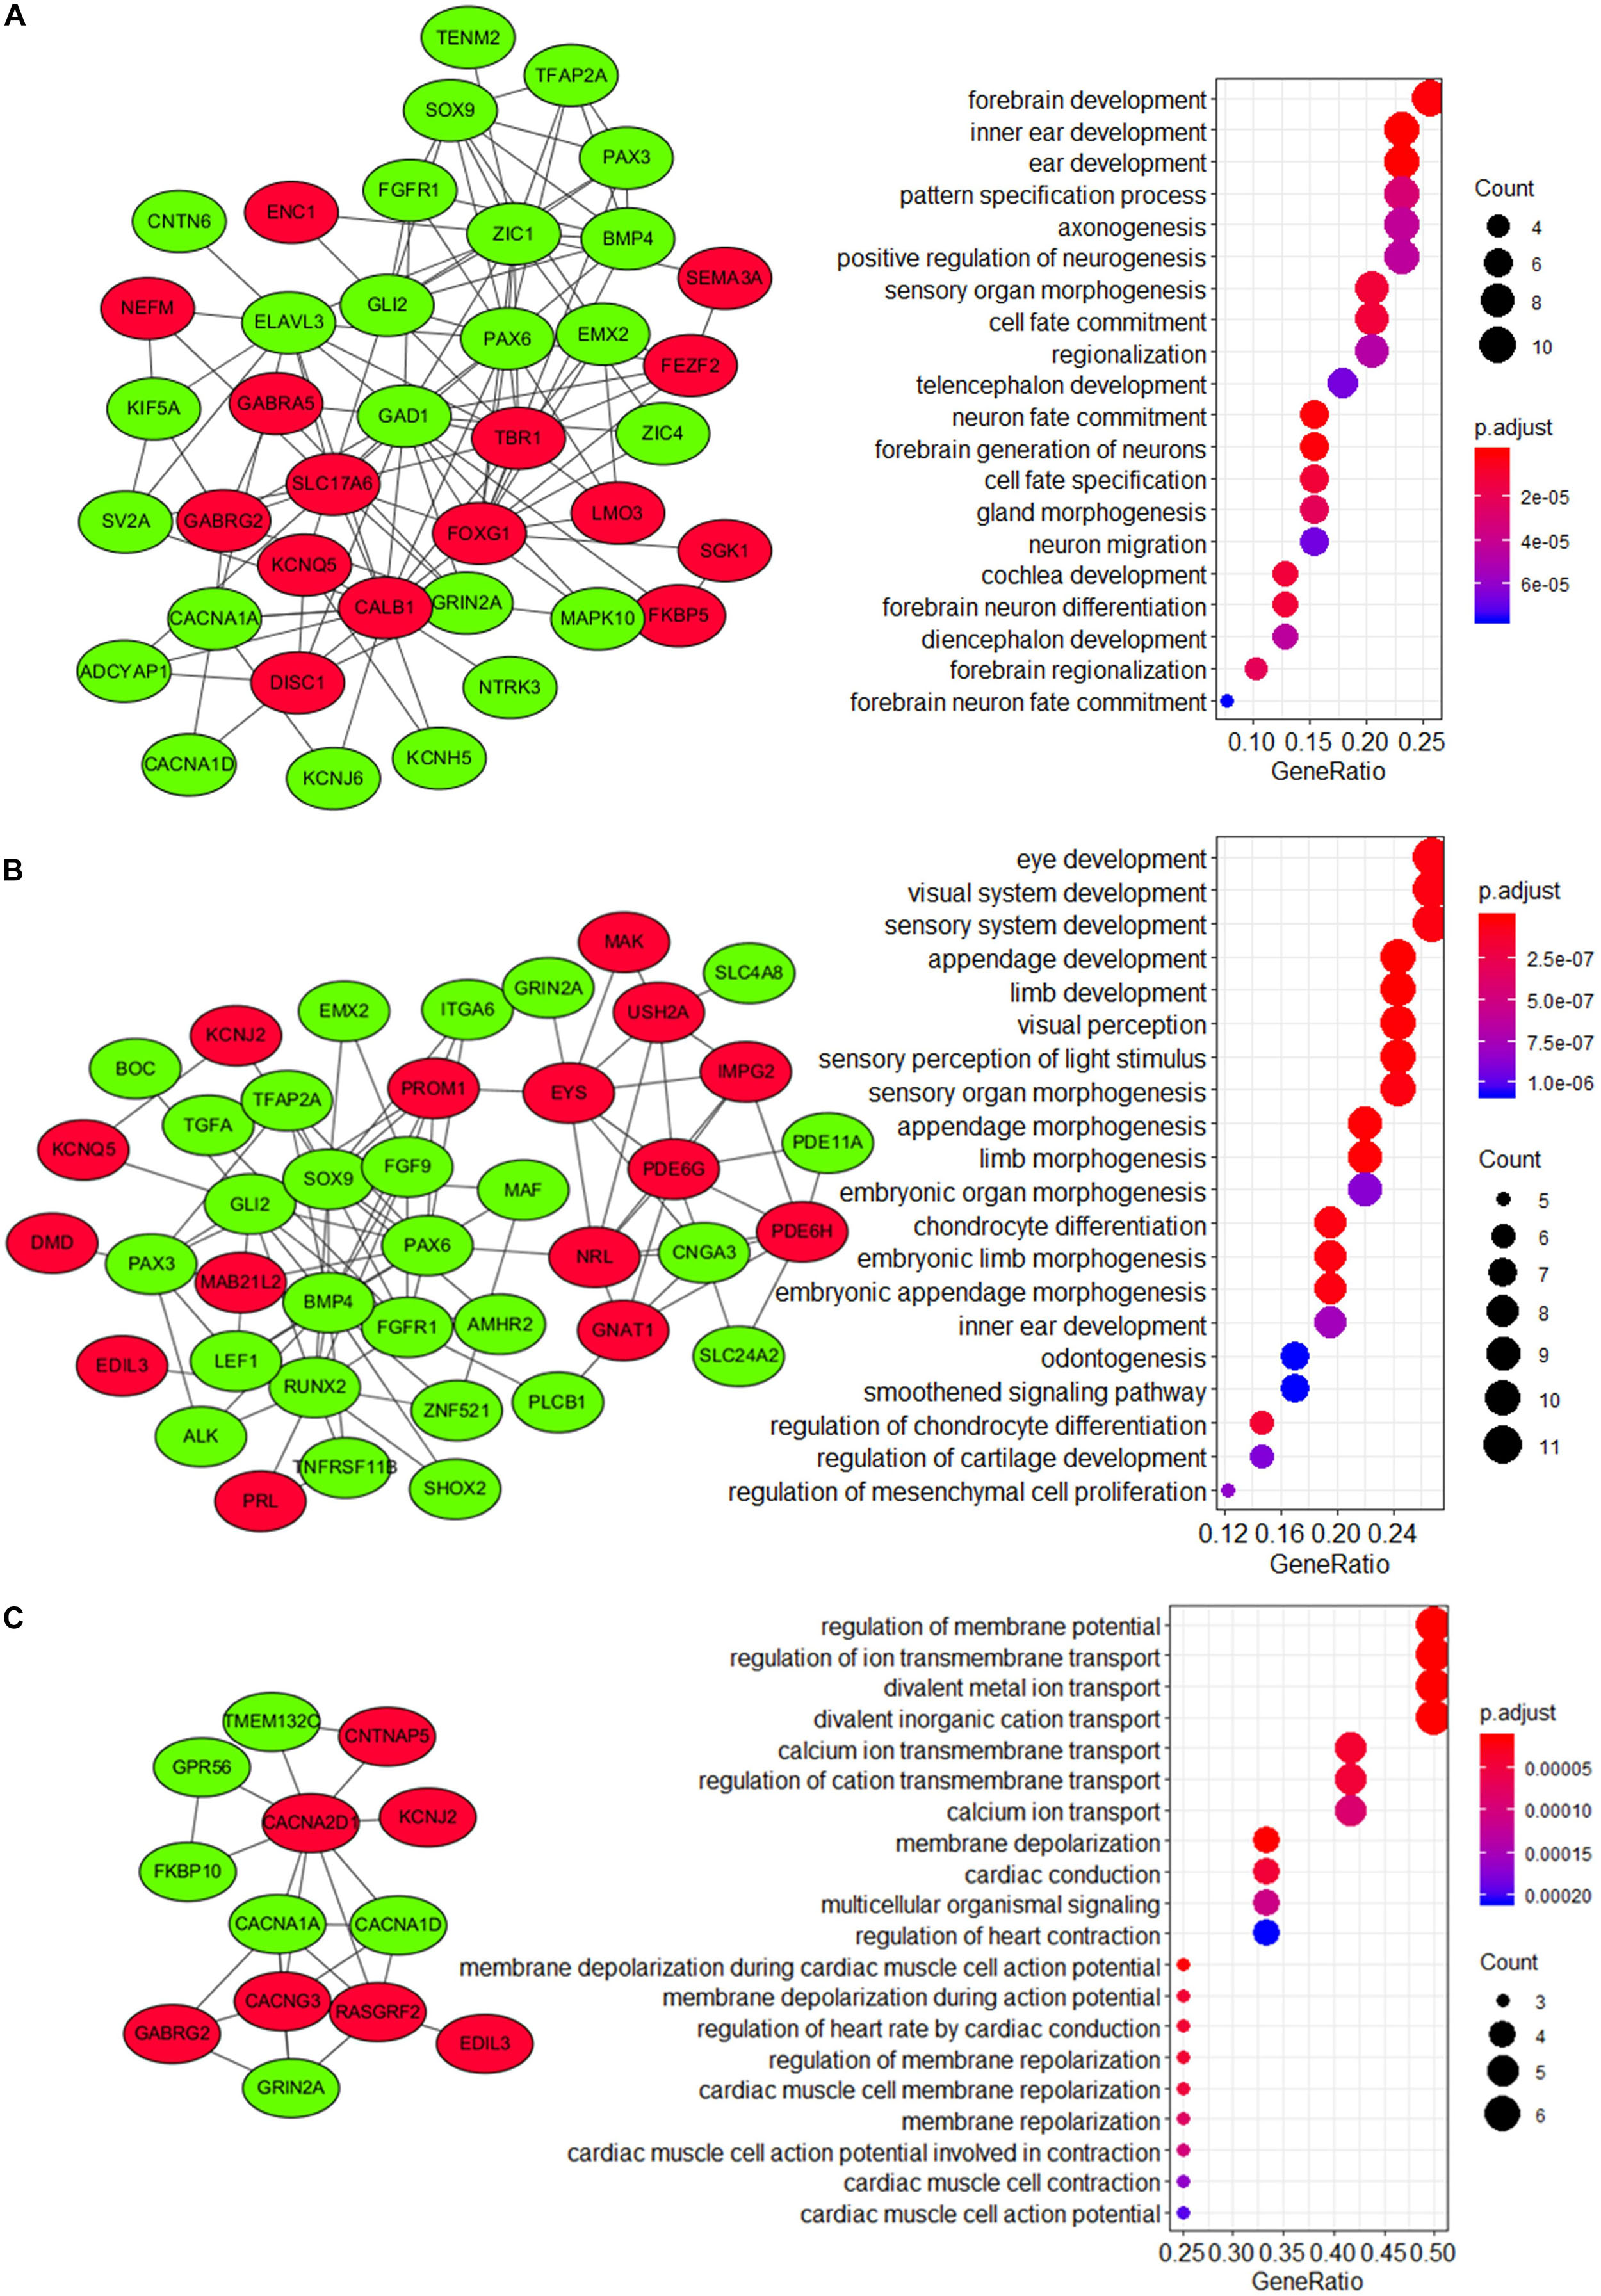
Figure 7. Visualization and GO enrichment analysis of DEGs in (A) module 1, (B) module 2, and (C) module 3. DEGs that were upregulated in the high-risk group are in red nodes, whereas those that were downregulated are in green nodes. (A) DEGs in module 1 were significantly enriched in pathways that are related to CNS development, while (B) DEGs in module 2 were significantly enriched in pathways that are related to embryonic development.
Hub genes were highly interconnected with network nodes, and intramodular hub genes in disease related modules have been reported to have clinical significance (Ivliev et al., 2010; Langfelder et al., 2013). Using Cytohubba, a total of 16 hub genes were predicted, including fibroblast growth factor receptor 1 (FGFR1), GLI family zinc finger 2 (GLI2), glutamate decarboxylase 1 (GAD1), CACNA1A, paired box 3 (PAX3), paired box 6 (PAX6), T-Box brain transcription factor 1 (TBR1), bone morphogenetic protein 4 (BMP4), calbindin 1 (CALB1), solute carrier family 17 member 6 (SLC17A6), SRY-Box transcription factor 9 (SOX9), Forkhead box G1 (FOXG1), Zic Family Member 1 (ZIC1), ELAV like RNA binding protein 3 (ELAVL3), RUNX family transcription factor 2 (RUNX2), and CACNA2D1 (Figures 6C,D and Supplementary Table 5). All 16 hub genes were presented in at least one of network modules predicted by MCOD. In addition, 6 hub genes were presented in both module 1 and 2 (FGFR1, BMP4, PAX3, SOX9, GLI2, and PAX6), while 1 hub gene was presented in both module 1 and 3 (CACNA1A) (Figures 6B,D). All hub genes presented in multiple modules have been reported in medulloblastomas which would be further discussed in the discussion section. These hub genes might be critical in the underlying mechanism of the PPI network.
Association of TME With the Risk Score Model and Molecular Subgroups of Medulloblastoma
TME is essential for tumor development and is involved in the drug resistance in cancers (Quail and Joyce, 2017). To understand the role of our risk score model in the TME of medulloblastomas, we inferred the stromal and immune cell admixture, which are of important in TME, as well as the tumor purity in the GSE85217 dataset using ESTIMATE algorithm. We first compared the TME in different molecular subgroups (Figure 8A). SHH tumors had the highest immune and stromal score but the lowest tumor purity among all subgroups. WNT tumors had a significantly lower immune score (p < 0.001) and higher tumor purity (p = 0.006) than SHH tumors, a significantly higher stromal scores than Groups 3 (p = 0.010) and Group 4 (p < 0.001) tumors, as well as a significantly lower tumor purity than Group 4 tumors (p = 0.006). The TME of Group 3 and Group 4 medulloblastomas seemed to be similar, as no significant differences in terms of the immune score (p = 1.000), stromal score (p = 1.000), and tumor purity (p = 1.000) were detected between these groups. We then analyzed the correlation between TME and the risk score (Figure 8B). The risk score of Group 4 tumors were positively correlated with both the stromal score (r = 0.169, p = 0.010) and the immune score (r = 0.131, p = 0.035) while negatively correlated with the tumor purity (r = −0.172, p = 0.010) (Figure 8B). No significant correlations were detected in other subgroups. We also compared the TME between different risk groups classified by our risk model (Supplementary Table 8), and found that high-risk group had significantly lower tumor purity compared to those classified into low-risk group (p = 0.045) in Group 4 medulloblastomas, while high-risk Group 3 medulloblastomas demonstrated significantly higher level of stromal scores compared to those classified as low-risk group in the same subgroup (p = 0.045). These findings might be suggestive of a subgroup-specific TME in medulloblastomas and indicated an association between our risk score model and these distinct TME profiles in Group 4 and SHH medulloblastoma.
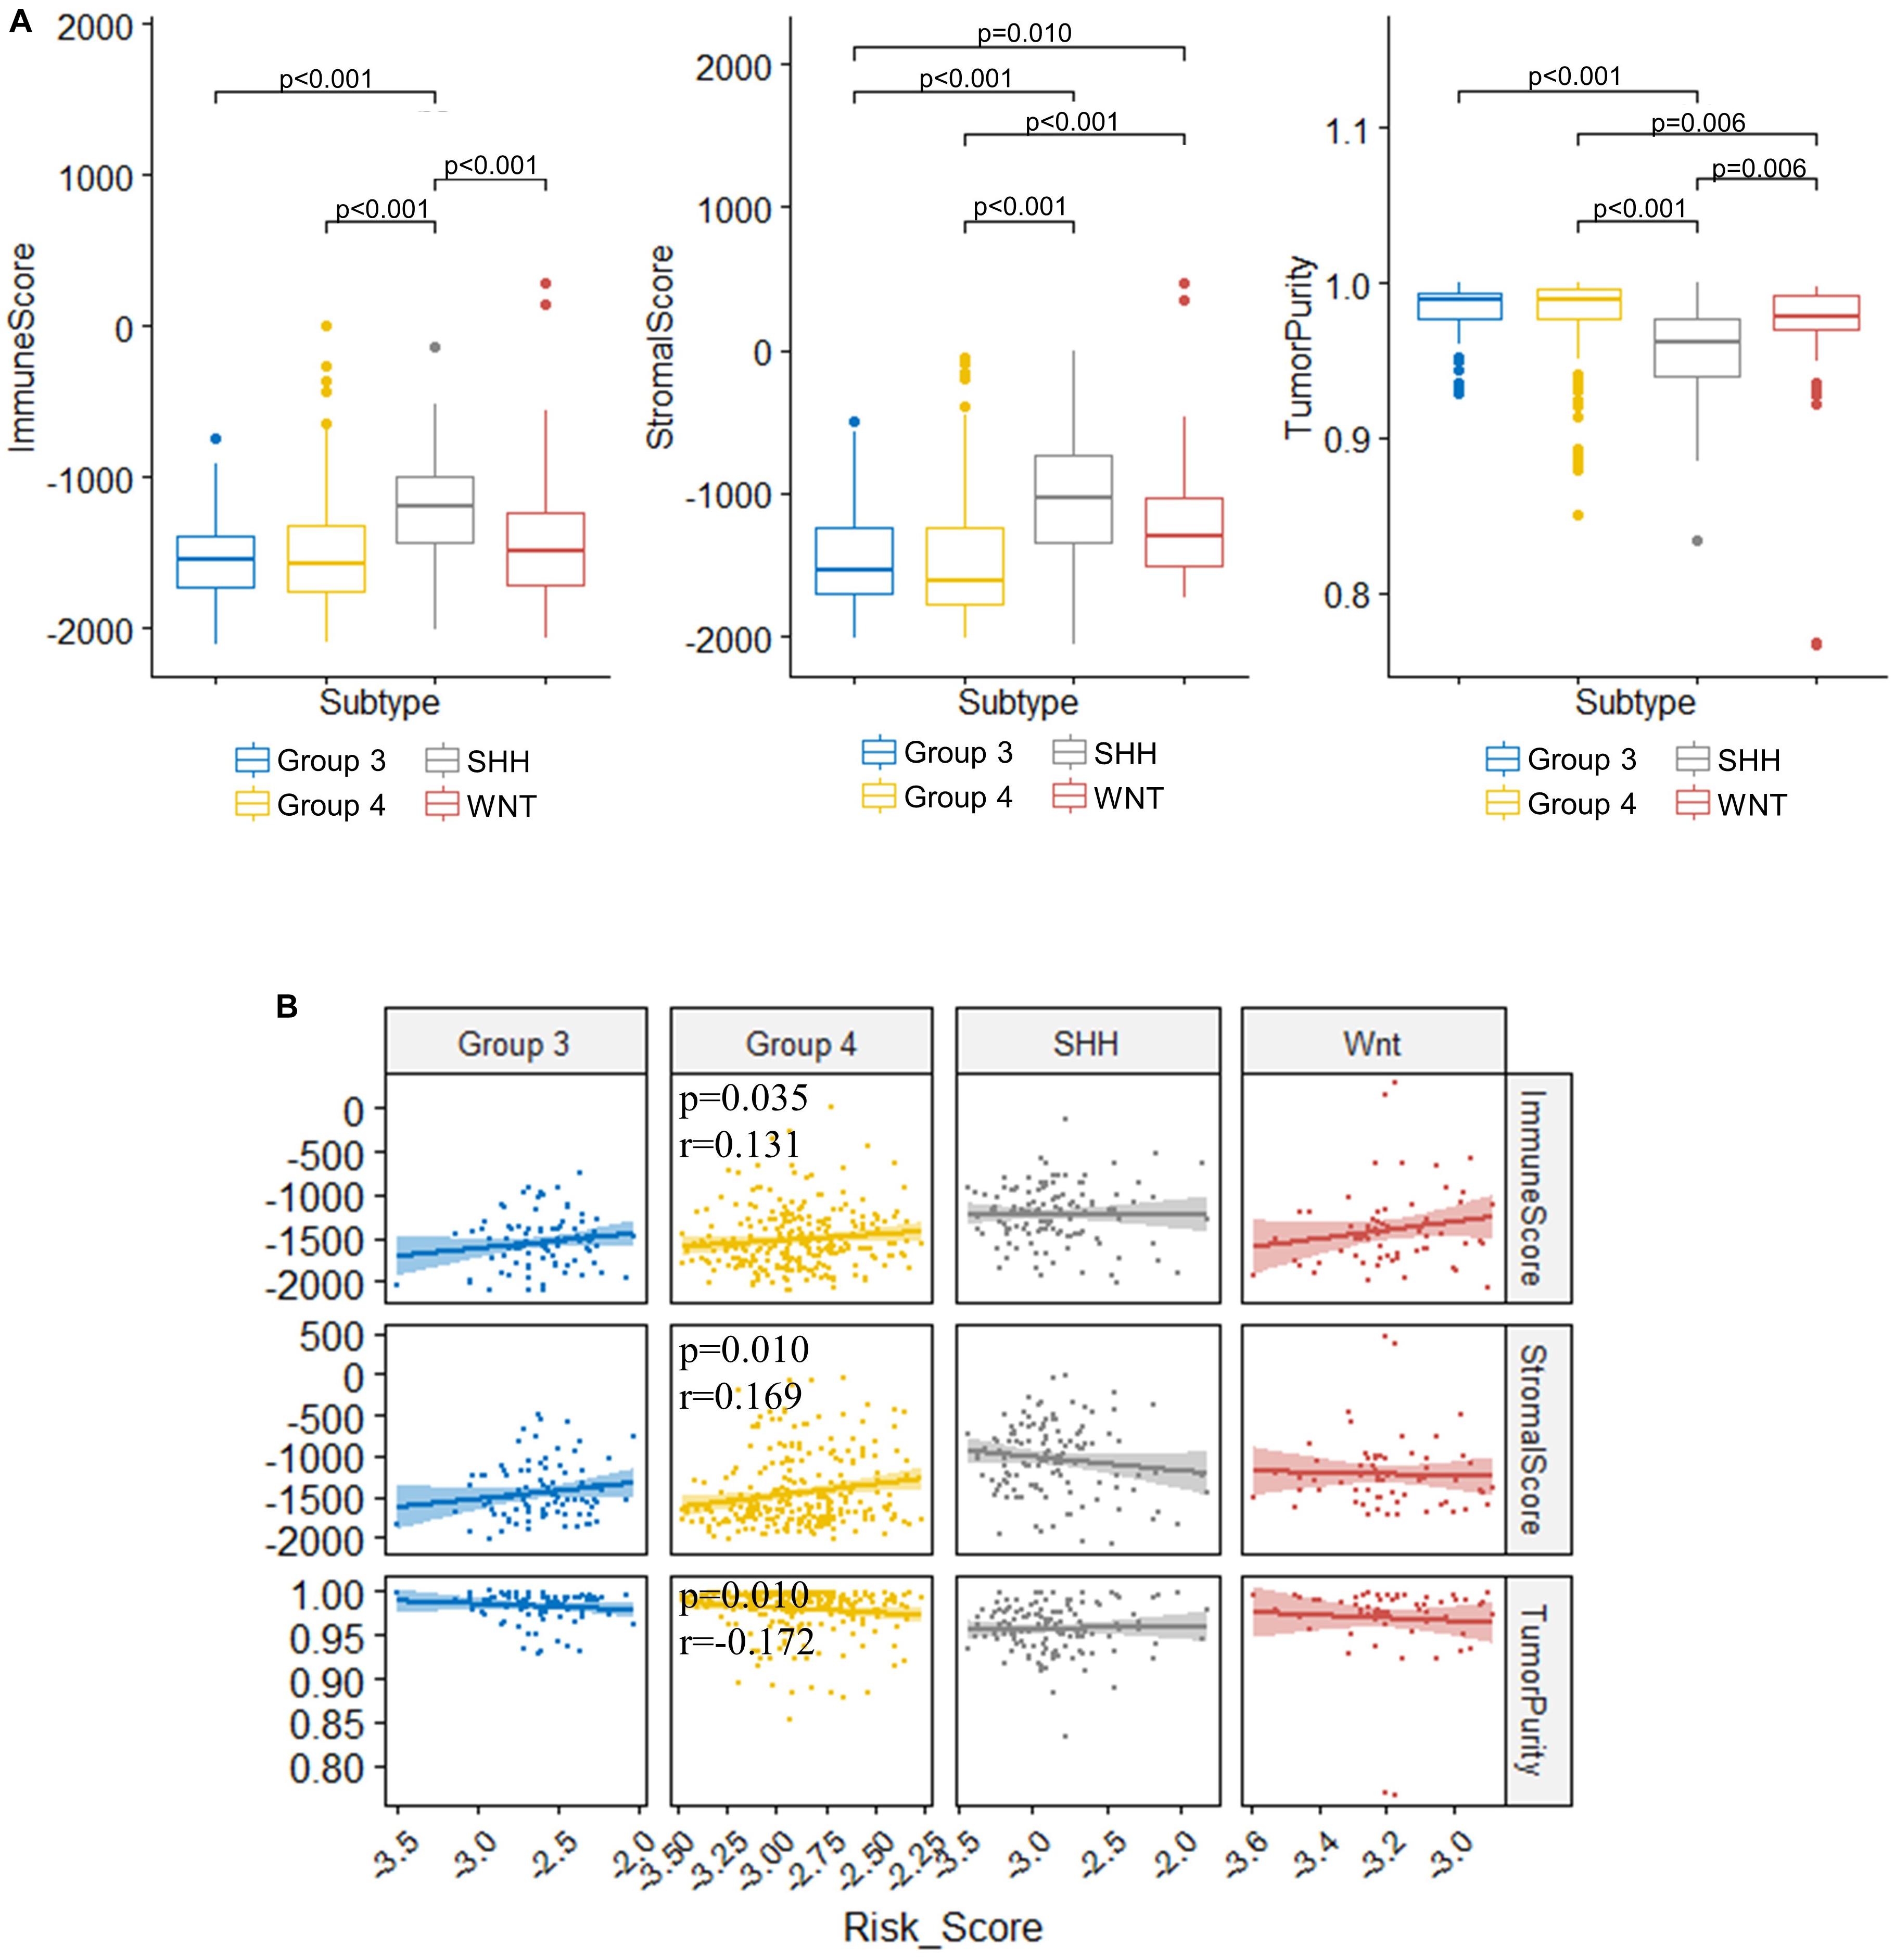
Figure 8. Significant correlations between the risk score and the immune score, stromal score, and tumor purity were found in the TME of Group 4 medulloblastomas. (A) Comparison of immune score, stromal score, and tumor purity between molecular subgroups (Kruskal–Wallis H test followed by Dunn’s post hoc tests for pairwise comparisons). (B) The correlation between risk scores and immune scores, stromal scores, as well as tumor purity (Spearman’s r and p. P values were adjusted using BH method. Only significant p-values were presented).
Association of TIICs and Immune Checkpoint With the Risk Score Model
To assess the relation between immune cell infiltration and our 13-gene signature, we profiled 22 TIICs using CIBERSORTx algorithm in the GSE85217 dataset (Figure 9A and Supplementary Table 9). We first investigated the correlation between the risk score and the immune cells (Figure 9B and Supplementary Table 10). For SHH cases, the risk score was positively correlated with naïve B cells (r = 0.347, p < 0.001) but negatively correlated with memory B cells (r = −0.259, p = 0.013) and plasma cells (r = −0.388, p < 0.001). In addition, the risk score of SHH cases was positively correlated with CD8 T cells (r = 0.316, p = 0.002) and regulatory T cells (r = 0.400, p < 0.001) but was negatively correlated with CD4 T cells (r = −0.343, p < 0.001). For Group 4 medulloblastomas, the risk score was negatively correlated with memory B cells (r = −0.232, p = 0.002) as well and positively correlated with M2 Macrophages (r = 0.262, p < 0.001).
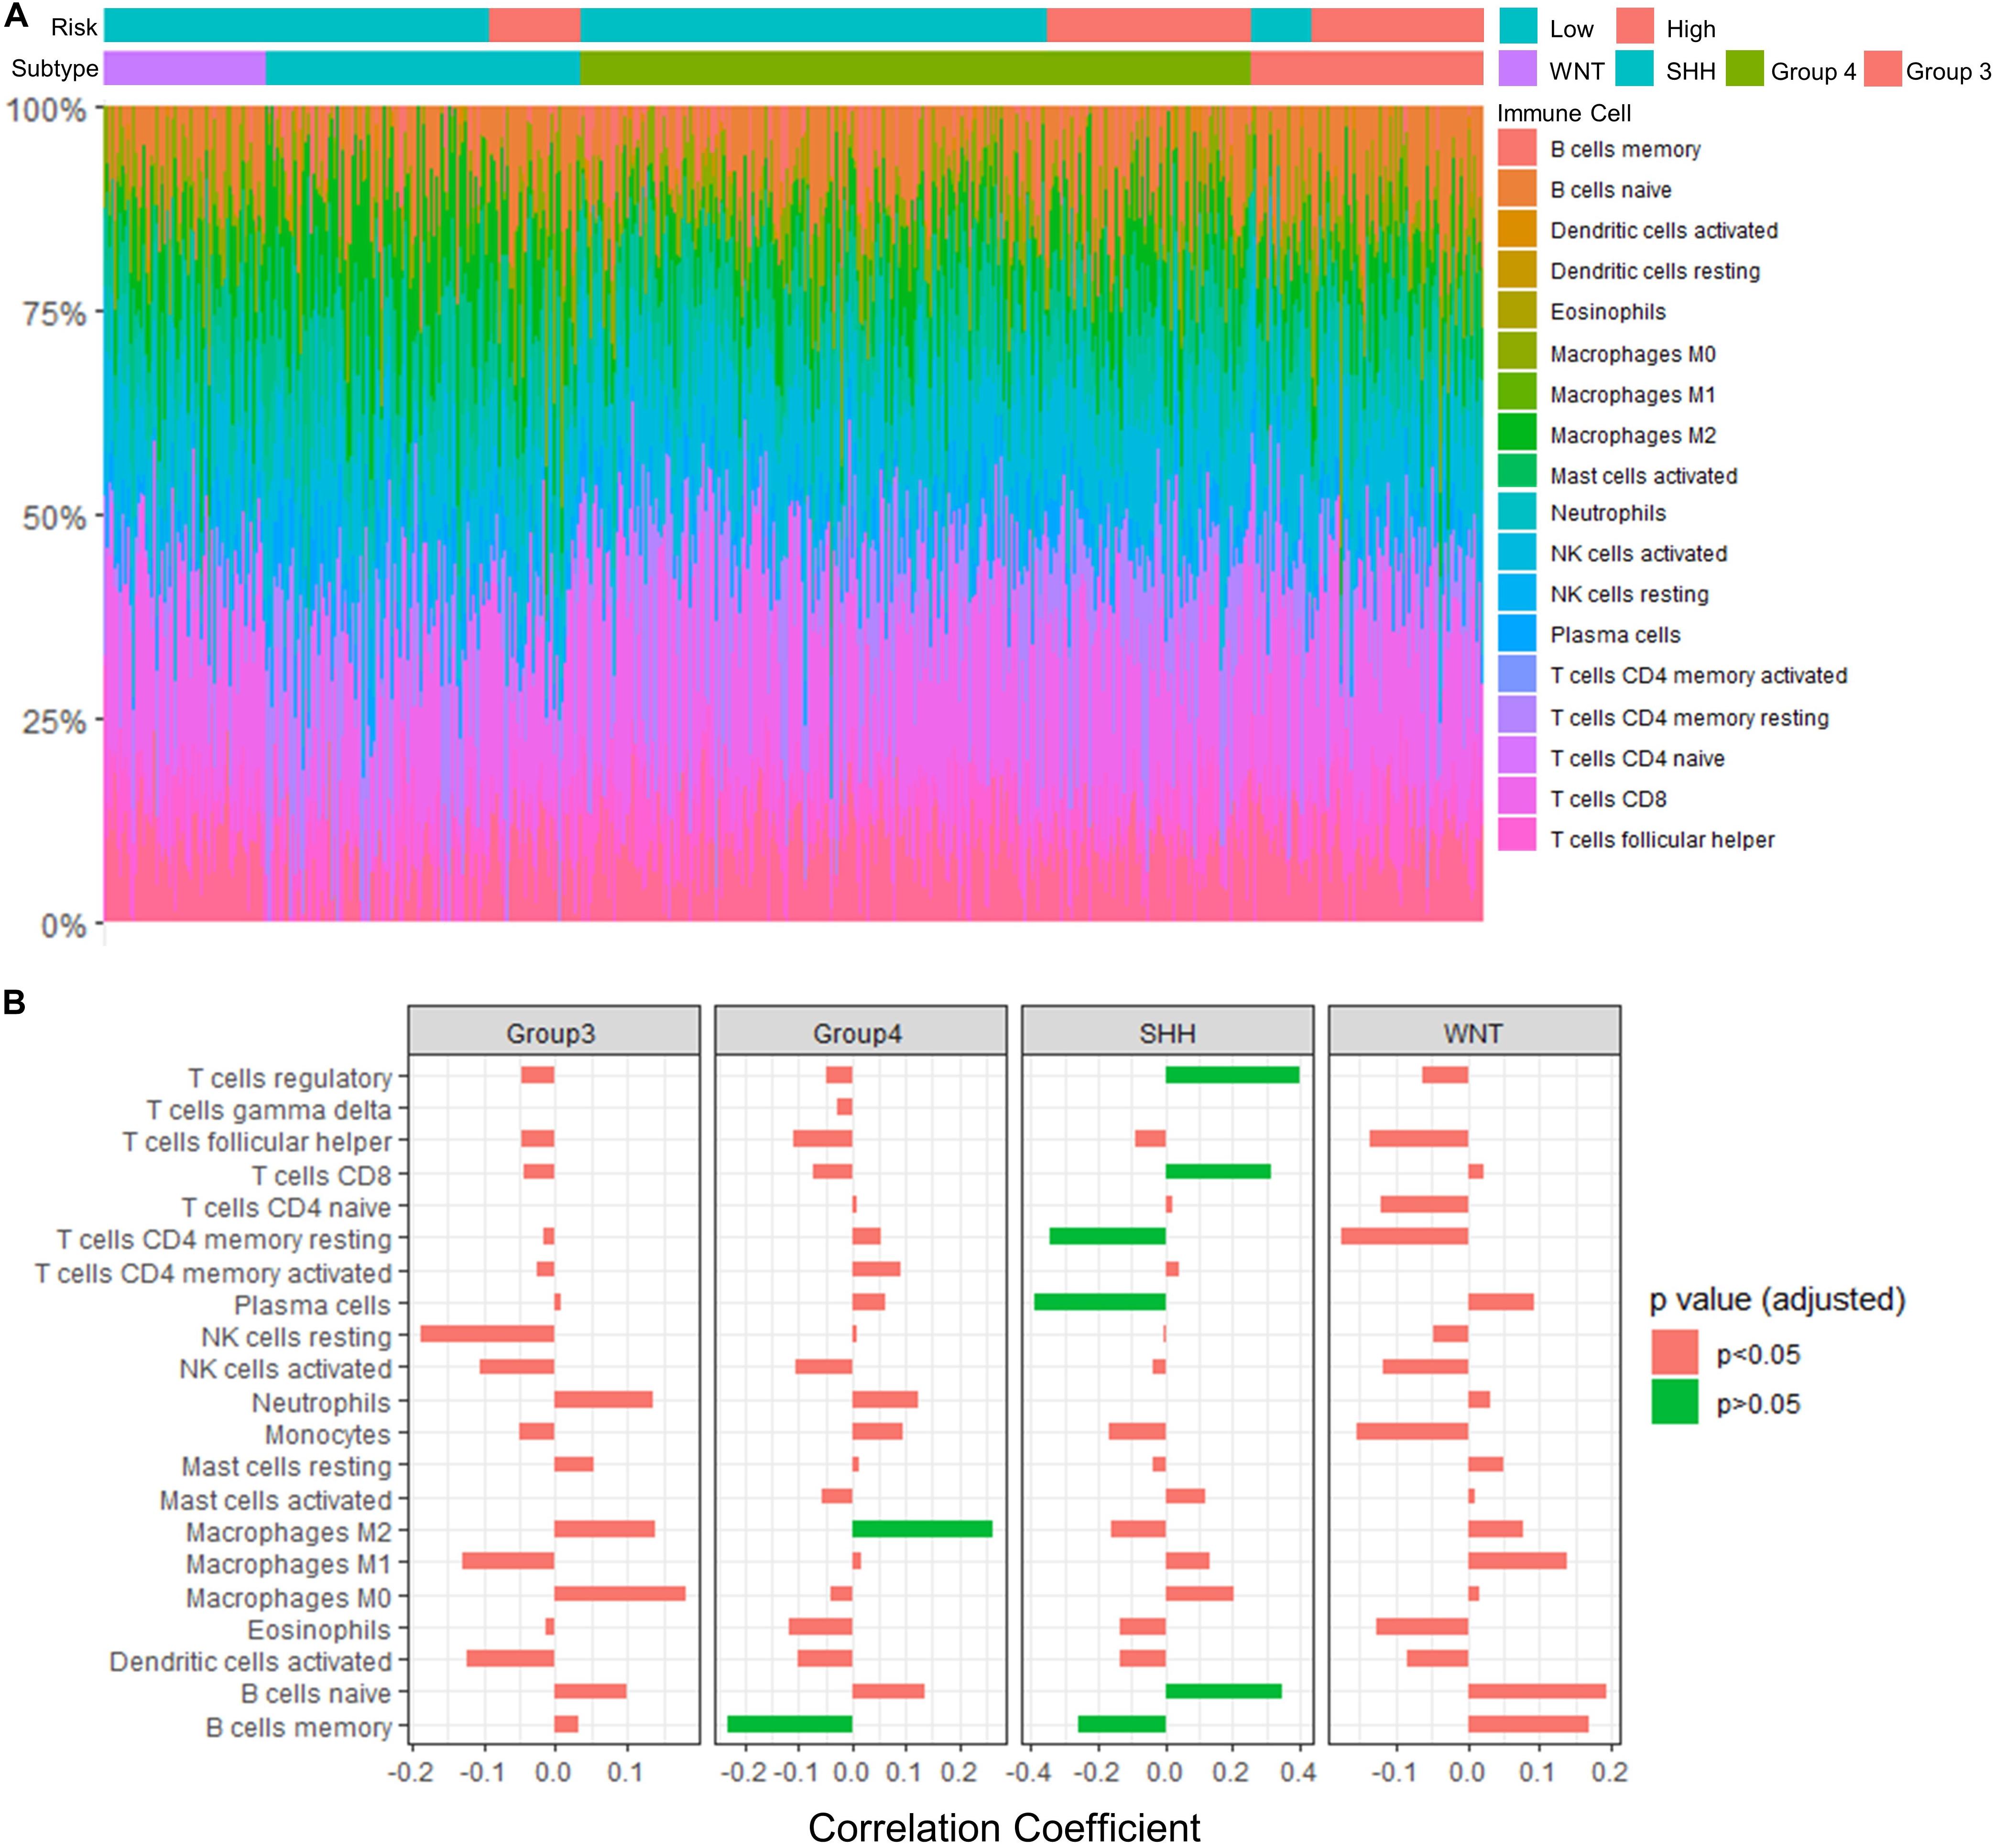
Figure 9. Significant correlations between the risk score and the fraction of TIICs were found in Group 4 and SHH medulloblastomas. (A) TIICs profile in GSE85217 dataset estimated using CIBERSORTx algorithm. (B) The correlation between the risk score and the fraction of infiltrating immune cells (Spearman’s r and p. P-values were adjusted using BH method). Significant correlations are in green color.
We also examined the association between our risk score model and immune checkpoint pathways, focusing on PD-L1 and cytotoxic T-lymphocyte associated protein 4 (CTLA4) since inhibitors targeting these checkpoints have been proposed to be effective in treating medulloblastoma animal models (Pham et al., 2016). We found that the risk score was significantly correlated with PD-L1 expression (p < 0.001, r = −0.162) but not with CTLA4 expression (Supplementary Table 11).
Correlation of TIICs With the Signature Genes and PPI Network Hub Genes
To further understand the role of our signature genes and PPI network hub genes in immune cells infiltration, we assessed the correlation between signature genes as well as network hub genes and fraction of immune cells (Figure 10 and Supplementary Table 12). For the B cells in SHH tumors, naïve B cells were significantly correlated with SOX9 (p = 0.001, r = −0.391), GLI2 (p = 0.026, r = −0.303), ZIC1 (p = 0.021, r = −0.315), CYB502 (p = 0.007, r = −0.350), and SYNE3 (p = 0.013, r = 0.331) expression (Figure 10A). Memory B cells were significantly correlated with SOX9 (p = 0.001, r = 0.398) and GLI2 (p = 0.028, r = 0.300) expression, and plasma cells were positively correlated with CYB502 (p = 0.049, r = 0.279), DNAH2 (p = 0.031, r = 0.296) and SYNE3 (p = 0.048, r = 0.280) expression (Figure 10A). Considering that SOX9, GLI2, ZIC1, CYB502, and DNAH2 were downregulated, whereas SYNE3 was upregulated in the high-risk group, the expression pattern of these genes was in accordance with our aforementioned observation that the risk score was positively correlated with naïve B cells but negatively correlated with memory B cells and plasma cells in SHH tumors. Interestingly, GLI2 and SOX9 were also significantly correlated with follicular helper T cells (Tfh) in SHH tumors (p = 0.048, r = 0.280; p = 0.011, r = 0.337, respectively) (Figure 10A). Since Tfh is known to be essential in directing B cells differentiation into memory B cells and plasma cells in the germinal center, these genes might be important in the regulation of tumor-infiltrating B cells in SHH medulloblastomas.
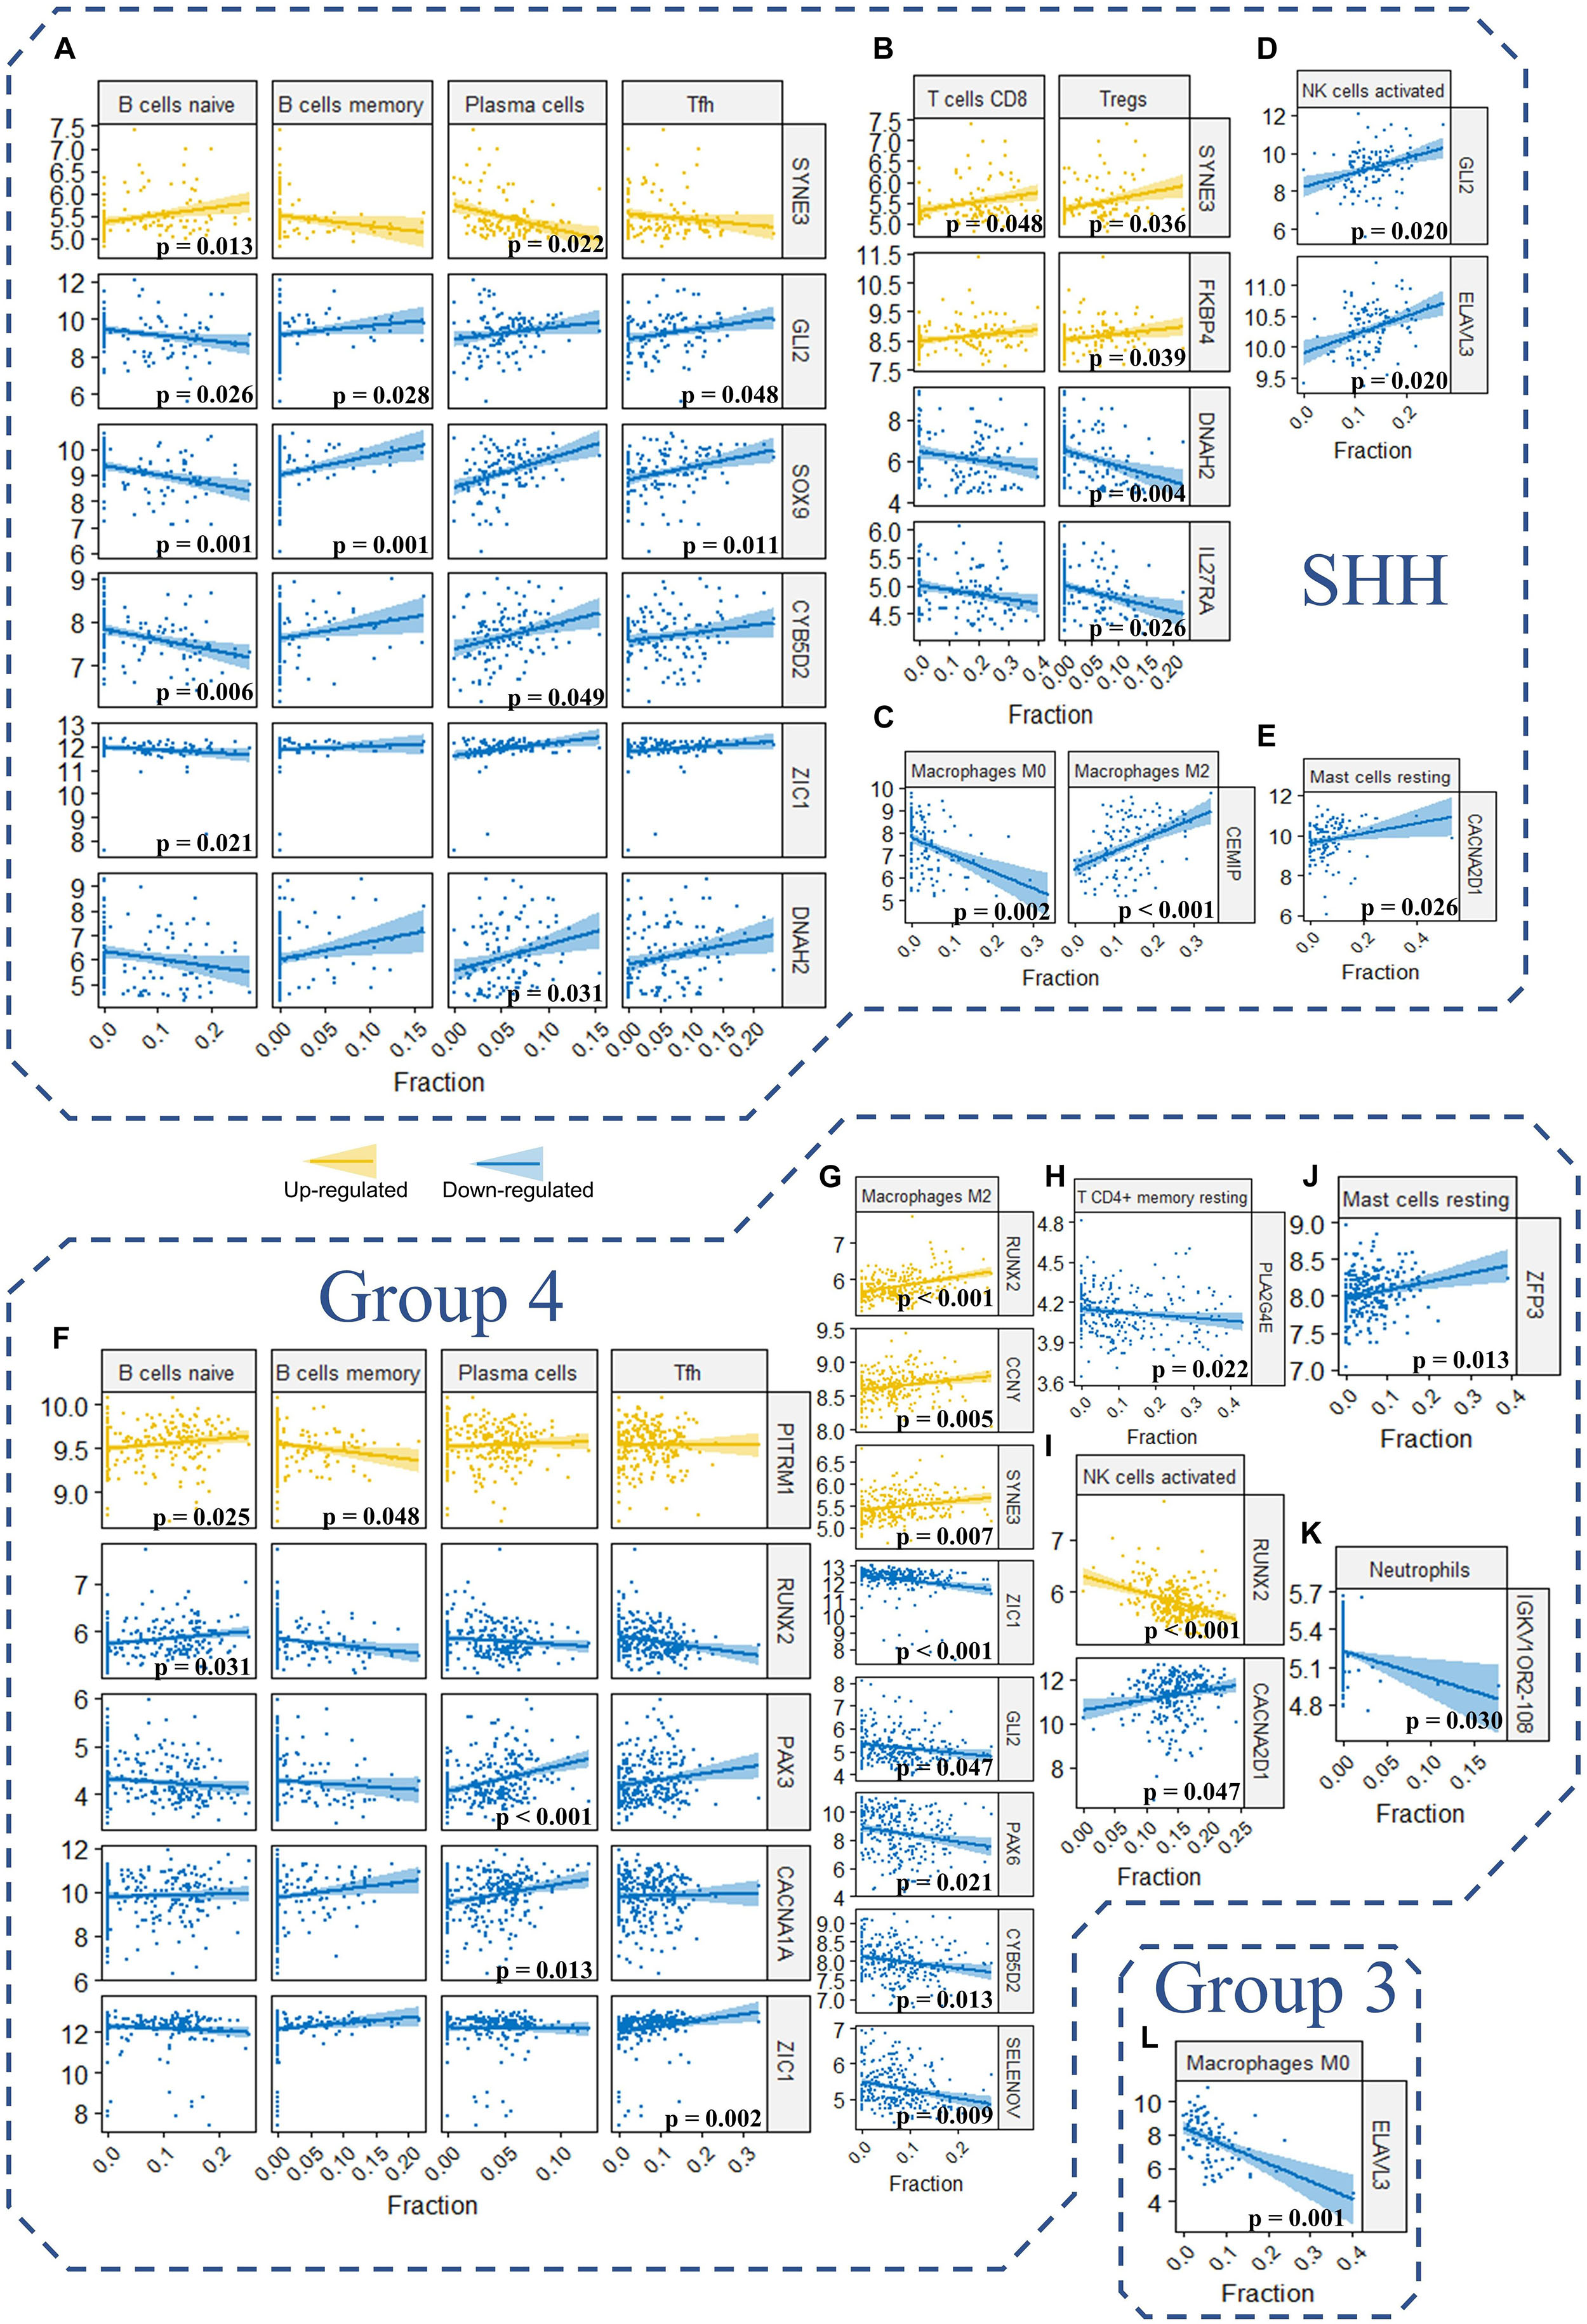
Figure 10. (A–L) The correlation between the expression level of the signature genes as well as hub genes and the fraction of the 22 TIICs in GSE85217 dataset (Spearman’s r and p. P-values were adjusted using BH method. Only genes and TIICs with significant correlations are presented).
Regarding other T cells in SHH medulloblastomas, CD8 T cells were significantly correlated with SYNE3 expression (p = 0.048, r = 0.280), and regulatory T cells were significantly correlated with SYNE3 (p = 0.036, r = 0.291), FKBP4 (p = 0.039, r = 0.288), IL27RA (p = 0.026, r = −0.304), and DNAH2 (p = 0.004, r = −0.362) expression (Figure 10B). Considering that FKBP4 and SYNE3 were upregulated, whereas IL27RA and DNAH2 were downregulated in the high-risk group, the expression pattern of these genes was in accordance with our previous observation that the risk score was positively correlated with CD8 T cells and regulatory T cells. Regarding macrophages in SHH medulloblastomas, CEMIP expression was negatively correlated M0 (p = 0.002, r = −0.378) while positively correlated with M2 macrophages (p < 0.001, r = 0.437) (Figure 10C). Since CEMIP was downregulated in the high-risk group, this finding was consistent with our observation of significantly increased fraction of M0 macrophages in the high-risk group. Moreover, activated NK cells were positively correlated with GLI2 (p = 0.020, r = 0.318) and ELAVL3 (p = 0.020, r = 0.317) expression (Figure 10D), and resting mastocyte cells were significantly correlated with CACNA2D1 expression (p = 0.026, r = 0.303) in SHH medulloblastomas (Figure 10E).
For Group 4 medulloblastomas, B naïve cells were positively correlated with RUNX2 (p = 0.031, r = 0.208) and PITRM1 (p = 0.025, r = 0.214) expression, and the latter was negatively correlated with memory B cells as well (p = 0.048, r = −0.198) (Figure 10F). Plasma cells were positively correlated with both PAX3 (p < 0.001, r = 0.360) and CACNA1A (p = 0.013, r = 0.228) expression (Figure 10F). These results were consistent with our observation that the risk score was negatively correlated with memory B cells. However, while the expression of both PITRM1 (p = 0.025, r = 0.214) and RUNX2 (p = 0.031, r = 0.208) was positively correlated with the fraction of naïve B cells, the former was upregulated whereas the latter was downregulated in the high-risk group (Figure 10F). This might explain non-significant correlation detected between risk score and naïve B cells in Group 4 tumors. Regarding T cells, Tfh was significantly correlated with ZIC1 expression (p = 0.002, r = 0.266), and resting memory T CD4 cells was significantly correlated with PLA2G4E expression (p = 0.022, r = −0.217) (Figures 10F,H).
In concordance with the aforementioned observations, a positive correlation between M2 macrophages and the risk score was detected in Group 4 medulloblastoma. Consequently, we found that M2 macrophages fraction were positively correlated with the expression of RUNX2 (p < 0.001, r = 0.326), CCNY (p = 0.005, r = 0.252) and SYNE3 (p = 0.007, r = 0.243) expression, which were upregulated in the high-risk group, while negatively correlated with the expression of ZIC1 (p < 0.001, r = −0.307), GLI2 (p = 0.047, r = −0.200), PAX6 (p = 0.021, r = −0.219), CYB5D2 (p = 0.013, r = −0.230), and SELENOV (p = 0.009, r = −0.239), which were downregulated in the high-risk group (Figure 10G). Activated NK cells were correlated with CACNA2D1 (p = 0.047, r = 0.199) and RUNX2 (p < 0.001, r = −0.325) expression (Figure 10I). Resting mastocyte cells were correlated with ZFP3 expression (p = 0.013, r = 0.231) (Figure 10J). Neutrophils were correlated with IGKV1OR2-108 expression (p = 0.030, r = −0.210) (Figure 10K). For Group 3 tumors, M0 Macrophages were significantly correlated with ELAVL3 expression (p = 0.001, r = −0.470) (Figure 10L).
Taken together, these findings indicated that our risk score model might be involved in the TIICs of medulloblastomas. The signatures genes and PPI network hub genes significantly correlated with immune cells may play a critical role in the medulloblastoma immune microenvironment, and their clinical significance requires further investigation.
Discussion
Previous studies have improved our understanding of medulloblastoma dramatically, but a robust prognostic signature has yet to be established for medulloblastoma patients. The risk stratification for medulloblastoma was suggested long ago without incorporating genetic findings (Packer et al., 2003). Magnetic resonance (MR) imaging-based signatures were promising in predicting molecular subgroups (Colafati et al., 2018) but have not been used in predicting patient prognosis. Although gene signatures were investigated in several studies, a major focus was on patient preselection for targeted therapy (Shou et al., 2015) or molecular classification (Corno et al., 2012; Chen et al., 2013). Northcott et al. (2012) presented a 22-subtype-specific gene signature that can predict molecular subgroup in 88% of recent Formalin Fixed Paraffin Embedded (FFPE) medulloblastoma samples (Northcott et al., 2012). Braoudaki et al. (2014) used a microRNA (miRNA) signature to predict the clinical outcome in pediatric CNS tumors, but only 34 medulloblastomas were analyzed with other brain tumors, identifying only two signature miRNAs, which were not used to construct predictive models. Tantawy et al. (2018) also investigated miRNA signature for medulloblastoma; however, only a total of 82 miRNAs were assessed, in a cohort of 30 medulloblastoma cases with another 90 pediatric brain tumors, resulting in only 1 miRNA that was specific to medulloblastoma. The prognostic model established by Tamayo et al. (2011) was the only model we found, that could be used to predict clinical outcomes based on expression profiles. While their model can predict tumor relapse, it was not constructed to predict survival of the patients.
In this study, we constructed a 13-gene signature risk score model predicting the OS of medulloblastoma patient. The robustness and applicability of this model was validated with two independent datasets, generated from two different microarray platforms. Our results demonstrated that this model can identify high-risk patients that have significantly shorter OS compared with low-risk patients. We further confirmed the 13-gene signature as an independent predictor when a variety of clinical factors were considered simultaneously. To our knowledge, this is the first study constructing and validating a gene signature-based prognostic model for medulloblastoma.
Most of the 13 signature genes were related to neurological functions and diseases, as well as CNS tumors and other tumors. CYB5D2 was related to neurogenesis, neural functions, tumorigenesis, and cancer progression (Kimura et al., 2010; Ryu et al., 2017). It was reported in breast (Ojo et al., 2019) and cervical cancer as well (Xie et al., 2011, 2016a,b; Bruce and Rybak, 2014). FBLIM1 was reported to promote migration and invasion in glioma (Ou et al., 2017), and participate in brain development and autism spectrum disorders (Kang et al., 2011; Pinto et al., 2014; Ishizuka et al., 2018). IL27RA might participate in immune regulation in CNS (Iwasaki et al., 2015; Yoshida and Hunter, 2015). CEMIP may be related to brain function and development (Yoshino et al., 2017, 2018), MEK/ERK-induced Schwann-cell dedifferentiation (Boerboom et al., 2017), immune response in glioblastoma (Motaln et al., 2012), and WNT signaling (Li et al., 2017; Duong et al., 2018; Liang et al., 2018). It was frequently reported in colorectal cancers as well (Fink et al., 2015; Zhang et al., 2017). DNAH2 mutation was reported in Parkinson’s disease (Gaare et al., 2018), autism (Butler et al., 2015), adult-onset hearing loss (Lewis et al., 2018), and clear cell renal cell carcinomas (Arai et al., 2015). PITRM1 was associated with amyloidogenic neuropathy (Boczonadi and Horvath, 2016; Brunetti et al., 2016; Smith-Carpenter and Alper, 2018) and Alzheimer’s disease (Alikhani et al., 2011; Deters et al., 2017). FKBP4 was found to be associated with major depressive disorder (Binder et al., 2004; Tatro et al., 2009a, b) and might be critical to early steps in neuronal differentiation (Quintá and Galigniana, 2012), chemotropic guidance of neuronal growth cones (Shim et al., 2009), and regulating neuroprotective activities with calcium channels (Ruan et al., 2008). It was also reported in malignancies like prostate cancer (Bhowal et al., 2017; Joshi et al., 2017) and breast cancer (Ostrow et al., 2009). CCNY knockout can inhibit glioma cell proliferation (Xu et al., 2010). It was known to regulate synapse formation, synapse elimination (Ou et al., 2010; Park et al., 2011), hippocampal neurons related pathways, and hippocampal long-term potentiation (Cho et al., 2015; Joe et al., 2017). PLA2G4E was reported to be strongly expressed in the brain, especially in neurons (Ogura et al., 2016), and was associated with neurobehavioral disorders (Everson et al., 2019; Morimoto et al., 2018).
To better understand the molecular mechanism underlying the 13-gene signature, we identified 265 DEGs by comparing the high-risk and low-risk group and performed GO and KEGG enrichment analysis for these genes. The results demonstrated that the DEGs were significantly associated with axon formation, synapse components, neuron components, and cell channel activities. Medulloblastoma is thought to arise from the granule cell precursors during the cerebellar development (Oliver et al., 2005; Roussel and Hatten, 2011). Cerebellar development occurs in multiple regions, including the ventricular zone surrounding the fourth ventricle and the upper rhombic lip (Martirosian et al., 2016). The former generates GABAergic neurons, while the latter generates glutamatergic neurons of cerebellum (Butts et al., 2014). Interestingly, we found that both the GABAergic and glutamatergic synapse pathways were associated with the 265 DEGs identified using the risk score model. Also, a GO analysis revealed that these DEGs were significantly enriched in pathways related to axon development and functions, including axonogenesis and axon guidance. Axon guidance pathways, such as Eph/ephrin signaling, were reported to play important roles in malignant brain tumor (Nakada et al., 2004; Pasquale, 2008; Miao et al., 2009). The Eph/ephrin signaling system plays a key role in the invasion of medulloblastoma, and EPH Receptor B2, EphB2, was found to be critical for invasion of pediatric medulloblastoma (Sikkema et al., 2012). Additionally, our results are consistent with previous report, which identified DEGs related to axon guidance in medulloblastoma spheres and core versus migrating cells and suggested a novel potential role for axon guidance signaling in medulloblastoma-propagating cells (Morrison et al., 2013). Moreover, KEGG analysis revealed that the DEGs were significantly enriched in WNT signaling pathways, which is known to be strongly related to medulloblastomas (Louis et al., 2016; Majd and Penas-Prado, 2019; Xia et al., 2019). Together, our study suggested that the 13 signature genes may play critical roles in the development of medulloblastoma by regulating these enriched pathways and functions through the DEGs.
Furthermore, we analyzed the PPI network of the 265 DEGs and identified 3 modules. Interestingly, GO enrichment analysis revealed that module 1 and module 2 were highly enriched in pathways that were related to CNS development and embryonic development, respectively. Defined as an embryonal CNS tumor, medulloblastoma is thought to arise from disruptions during the development of cerebellum as a result of dysregulated genes and pathways, including the Notch, WNT/β-Catenin, Transforming growth factor-beta (TGF-β)/bone morphogenetic protein (BMP), SHH/Patched, and Hippo pathways (Roussel and Hatten, 2011) in embryonic development. The aberrantly regulated DEGs in modules 1 and module 2 might be involved in this process considering their functional characteristics. Additionally, these modules were interconnected via several hub genes, namely, FGFR1, BMP4, PAX6, PAX3, SOX9, and GLI2, all of which have been related to medulloblastomas in previous studies. Fibroblast growth factor receptor (FGFR) signaling is known to drive SHH medulloblastomas and is critical in regulating medulloblastoma invasion, and FGFR1 has been demonstrated to mediate inhibition of SHH medulloblastoma growth (Kumar et al., 2018; Neve et al., 2019). Bone morphogenetic proteins (BMPs) are known to regulate SHH-induced granule cell progenitor proliferation during cerebellar development and cell migration and invasion in Group 4 medulloblastoma model (Merve et al., 2014). BMP4 can inhibit medulloblastoma proliferation and induce differentiation of medulloblastoma cells (Grimmer and Weiss, 2008; Zhao et al., 2008). The Paired box (PAX) gene family play a critical role in embryonic development especially the development of CNS. PAX6 participates neuronal fate determination and can be regulated by SHH signaling in medulloblastoma (Shahi et al., 2010). PAX3 is known to be involved in tumors originated from neural crest and has been related to neural cell adhesion molecules polysialylation, and, subsequently, cell–cell and cell–substratum interactions in medulloblastoma cells (Mayanil et al., 2000; Wang et al., 2008). SOX9 play an important role in glial fate determination and are commonly overexpressed in WNT and SHH medulloblastoma (Larsimont et al., 2015). SOX9 has been reported as a critical transcription factor in MYCN Proto-Oncogene, BHLH Transcription Factor, MYCN-driven medulloblastoma (Swartling et al., 2014) and can be related to drug resistance of these tumors (Rahmanto et al., 2016). Interestingly, SOX9 might function upstream of GLI2, which is known to be a major effector in the Hedgehog signaling, and act as a key driver of SHH medulloblastomas (Bar et al., 2007; Raleigh et al., 2018; Yin et al., 2019). These modules and genes are likely to play a important role in medulloblastomas and shed light on potential pathways and mechanism underlying our 13-gene signature model.
TME plays a critical role in the development, progression and treatment of brain tumors (Quail and Joyce, 2017). The risk score predicted by our 13-gene signature model was significantly correlated with the immune score, stromal score, and tumor purity in Group 4 medulloblastoma, indicating a potential role of our model in the TME. Furthermore, the prognostic significance of TIICs in the immune microenvironment of brain tumors has been investigated extensively, and immunotherapy has been proposed for medulloblastoma (Sonabend et al., 2012; Boussiotis and Charest, 2017). Bockmayr et al. (2018) suggested a subgroup-specific TIICs in medulloblastoma with distinct types of immunosuppression associated with macrophages and regulatory T cells or cytokines and immune checkpoints. Consistently, distinctive association between our model and molecular subgroups were identified, as the risk score was significantly related to naïve B cells, memory B cells, plasma cells, resting memory CD4 T cells, CD8 T cells, and regulatory T cells in SHH tumors, while it was significantly correlated with memory B cells and M2 macrophages in Group 4 tumors. Interestingly, we found that SHH medulloblastoma with higher risk score tend to have an increased fraction of naïve B cells but a decreased fraction of memory B cells and plasma B cells, suggesting a potential defection of naïve B cell activation or the subsequent maturation into plasma cells and memory B cells in the immune microenvironment of SHH medulloblastomas with a higher risk score. Moreover, we found that GLI2 and SOX9 might contribute to this disruption. Downregulation of these genes in cases with higher risk scores was not only associated with increased naïve B cells and decreased memory B cells and plasma cells but also a decreased fraction of Tfh cells, which is known to provide key signals to the B cells for their differentiation into plasma cells and memory B cells (McHeyzer-Williams et al., 2009). In summary, our 13-gene signature might be associated with the infiltrating B cells in the TME of SHH medulloblastoma. The underlying mechanism of this association and its clinical significance in medulloblastomas require further investigation.
Comprising up to ∼30% of the tumor mass, tumor-associated macrophages (TAMs) are the major component of the TME in brain tumors. Despite their function of promoting specific immunity, the presences of macrophages in TME are thought to be pro-tumorigenic and has been associated with tumor progression, immune evasion, and immune suppression (Hambardzumyan et al., 2016). In medulloblastoma, however, TAMs can improve patient outcome (Maximov et al., 2019). The paradoxical role of TAMs might be partially related to their different polarization which can be tumor killing (M1) or tumor promoting (M2) (Sica et al., 2008; Mills, 2012). Interestingly, the fraction of M2 macrophages in Group 4 medulloblastoma were positively correlated with the risk score and were significantly correlated with the expression level of four signature genes (CCNY, SYNE3, CYB5D2, and SELENOV) and four hub genes (GLI2, PAX6, RUNX2, and ZIC1). These findings may suggest our 13-gene signature model might participate the regulation of TAMs in the TME of Group 4 medulloblastomas.
The programmed death (PD-1) pathway is a promising therapeutic target for brain tumors (Topalian et al., 2016). However, although PD-L1 blockage treatment can improve the survival of Group 3 medulloblastoma in animal models (Pham et al., 2016), several studies indicated an absence of PD-L1 expression in medulloblastomas and suggested a limited value of immunotherapy with PD1/PD-L1 inhibitor (Majzner et al., 2017; Vermeulen et al., 2017), while others suggested that PD-L1 expression in medulloblastomas might be associated with infiltrating CD8+ T cells, and relatively high PD-L1 expression can be seen in some SHH and WNT cases (Bockmayr et al., 2018; Murata et al., 2018). Our analysis indicated that the risk score calculated using our 13-gene signature model was significantly correlated with PD-L1 expression and prognosis in medulloblastoma patients. Therefore, our risk model might have potential value in selecting candidate patients who may benefit from PD-L1 clinical trials.
This study is subject to several limitations. Infant medulloblastoma were not included in the analysis due to their distinct genomic and clinical features. Inclusion of these tumors could bias the patient outcome, especially due to their enrichment in SHH and Group 3 subgroups (Ramaswamy et al., 2016a). In addition, since we aimed to identify robust signature genes that are closely related to the prognosis of medulloblastoma patient, we focused on probes that unambiguously mapped to protein-coding genes or genes with known functions, and we filtered out a very small proportion of probes (n = 613, 2.8% of all 21641 probes) that have no description from the manufacturer of microarray platforms. It is not implausible that some genes were excluded simply due to their limited studies at the time. Moreover, we used a conventional approach of selecting the representative probe for genes detected by multiple probe sets for genes without recommended match per manufacturer’s instruction by selecting the probe covers the targeted gene with the highest expression level. This approach may be improved by alternative methods such as scoring systems, which have claimed to have optimized mapping (Li et al., 2011); an even more accurate prediction may thus have been achieved. Finally, SHH-activated Tumor Protein P53 (TP53)-mutant medulloblastomas were not classified in this study. Although this subgroup was included in the resent WHO classification (Louis et al., 2016), the datasets used in this study, as well as most of the existing medulloblastoma datasets, does not provide this information or only provide for a small proportion of the cases. Further sequencing of these tumors with p53 mutation might be needed so that the model could be revalidated with the most updated WHO classification.
In summary, using gene expression data from GEO, we constructed and validated a 13-gene signature risk score model predicting the overall survival of medulloblastoma patients that can effectively classify low-risk and high-risk groups. Most of these 13 signature genes were involved in neurological activities or disease and may play critical roles in medulloblastoma through DEGs that were found to be significantly enriched in pathways related to neurological functions. PPI analysis revealed gene modules highly related to CNS and embryonic development. The risk score was found to be associated with the TME and TIICs particularly in SHH and Group 4 medulloblastomas and was significantly correlated with PD-L1 expression. The signature genes and PPI network hub genes might play a role in regulation of TIICs. Our study may complement the current WHO classification for prognosis prediction and clinical management of medulloblastoma patients. This study also has the potential to provide insight into the tumorigenesis and pathogenesis of medulloblastoma and provide candidate molecular targets for therapeutic studies in the future.
Data Availability Statement
Publicly available datasets were analyzed in this study. This data can be found here: https://www.ncbi.nlm.nih.gov/geo/query/acc.cgi?acc=GSE85217; https://www.ncbi.nlm.nih.gov/geo/query/acc.cgi?acc=GSE37418.
Author Contributions
CL, HZ, ZX, SW, and XL carried out the study design. CL and SW performed the patient cohort and data preprocessing. CL, HZ, and ZX performed the model construction and validation. CL, ZX, and YX performed the differentially expressed gene analysis. CL, HZ, and ZX carried out the protein–protein interaction analysis, tumor microenvironment analysis, and tumor-infiltrating immune cells analysis. CL and HZ performed the statistical analysis. CL was responsible for the manuscript preparation. DM, SW, and XL carried out the critical revision of the manuscript. XL was responsible for the study overview and coordination.
Funding
This work was supported by the National Natural Science Foundation of China (Nos. 81472594 and 81770781).
Conflict of Interest
The authors declare that the research was conducted in the absence of any commercial or financial relationships that could be construed as a potential conflict of interest.
Supplementary Material
The Supplementary Material for this article can be found online at: https://www.frontiersin.org/articles/10.3389/fgene.2020.00429/full#supplementary-material
Footnotes
- ^ http://www.ncbi.nlm.nih.gov/geo/
- ^ https://www.ncbi.nlm.nih.gov/geo/query/acc.cgi?acc=GPL22286
- ^ https://www.ncbi.nlm.nih.gov/geo/query/acc.cgi?acc=GPL570
- ^ http://www.webgestalt.org
- ^ http://string-db.org
- ^ cibersortx.stanford.edu
References
Alikhani, N., Guo, L., Yan, S., Du, H., Pinho, C. M., Chen, J. X., et al. (2011). Decreased proteolytic activity of the mitochondrial amyloid-β degrading enzyme, PreP peptidasome, in Alzheimer’s disease brain mitochondria. J. Alzheimers. Dis. 27, 75–87. doi: 10.3233/JAD-2011-101716
Arai, E., Gotoh, M., Tian, Y., Sakamoto, H., Ono, M., Matsuda, A., et al. (2015). Alterations of the spindle checkpoint pathway in clinicopathologically aggressive CpG island methylator phenotype clear cell renal cell carcinomas. Int. J. Cancer 137, 2589–2606. doi: 10.1002/ijc.29630
Bader, G. D., and Hogue, C. W. (2003). An automated method for finding molecular complexes in large protein interaction networks. BMC Bioinformatics 13:2. doi: 10.1186/1471-2105-4-2
Bar, E. E., Chaudhry, A., Farah, M. H., and Eberhart, C. G. (2007). Hedgehog signaling promotes medulloblastoma survival via Bc/II. Am. J. Pathol. 170, 347–355. doi: 10.2353/ajpath.2007.060066
Bhowal, A., Majumder, S., Ghosh, S., Basu, S., Sen, D., Roychowdhury, S., et al. (2017). Pathway-based expression profiling of benign prostatic hyperplasia and prostate cancer delineates an immunophilin molecule associated with cancer progression. Sci. Rep. 7:9763. doi: 10.1038/s41598-017-10068-9
Binder, E. B., Salyakina, D., Lichtner, P., Wochnik, G. M., Ising, M., Pütz, B., et al. (2004). Polymorphisms in FKBP5 are associated with increased recurrence of depressive episodes and rapid response to antidepressant treatment. Nat. Genet. 36, 1319–1325. doi: 10.1038/ng1479
Bockmayr, M., Mohme, M., Klauschen, F., Winkler, B., Budczies, J., Rutkowski, S., et al. (2018). Subgroup-specific immune and stromal microenvironment in medulloblastoma. Oncoimmunology 7:e1462430. doi: 10.1080/2162402X.2018.1462430
Boczonadi, V., and Horvath, R. (2016). Amyloid-β in mitochondrial disease: mutation in a human metallopeptidase links amyloidotic neurodegeneration with mitochondrial processing. EMBO Mol Med. 8, 173–175. doi: 10.15252/emmm.201506050
Boerboom, A., Reusch, C., Pieltain, A., Chariot, A., and Franzen, R. (2017). KIAA1199: a novel regulator of MEK/ERK-induced Schwann cell dedifferentiation. Glia 65, 1682–1696. doi: 10.1002/glia.23188
Boussiotis, V. A., and Charest, A. (2017). Immunotherapies for malignant glioma. Oncogene 37, 1121–1141. doi: 10.1038/s41388-017-0024-z
Braoudaki, M., Lambrou, G. I., Giannikou, K., Milionis, V., Stefanaki, K., Birks, D. K., et al. (2014). Microrna expression signatures predict patient progression and disease outcome in pediatric embryonal central nervous system neoplasms. J Hematol Oncol. 7:96. doi: 10.1186/s13045-014-0096-y
Bruce, A., and Rybak, A. P. (2014). CYB5D2 requires heme-binding to regulate HeLa cell growth and confer survival from chemotherapeutic agents. PLoS One 9:e86435. doi: 10.1371/journal.pone.0086435
Brunetti, D., Torsvik, J., Dallabona, C., Teixeira, P., Sztromwasser, P., Fernandez-Vizarra, E., et al. (2016). Defective PITRM1 mitochondrial peptidase is associated with Aβ amyloidotic neurodegeneration. EMBO Mol Med. 8, 176–190. doi: 10.15252/emmm.201505894
Butler, M. G., Rafi, S. K., Hossain, W., Stephan, D. A., and Manzardo, A. M. (2015). Whole exome sequencing in females with autism implicates novel and candidate genes. Int. J. Mol. Sci. 16, 1312–1335. doi: 10.3390/ijms16011312
Butts, T., Green, M. J., and Wingate, R. J. (2014). Development of the cerebellum: simple steps to make a ‘little brain’. Development 141, 4031–4041. doi: 10.1242/dev.106559
Cavalli, F. M. G., Remke, M., Rampasek, L., Peacock, J., Shih, D. J. H., Luu, B., et al. (2017). Intertumoral heterogeneity within medulloblastoma subgroups. Cancer Cell 31:737-754.e6. doi: 10.1016/j.ccell.2017.05.005
Chen, P., Fan, Y., Man, T. K., Hung, Y. S., Lau, C. C., Wong, S. T., et al. (2013). A gene signature based method for identifying subtypes and subtype-specific drivers in cancer with an application to medulloblastoma. BMC Bioinformatics 14(Suppl. 18):S1. doi: 10.1186/1471-2105-14-S18-S1
Chin, C. H., Chen, S. H., Wu, H. H., Ho, C. W., Ko, M. T., and Lin, C. Y. (2014). cytoHubba: identifying hub objects and sub-networks from complex interactome. BMC Syst. Biol. 8(Suppl. 4):S11. doi: 10.1186/1752-0509-8-S4-S11
Cho, E., Kim, D. H., Hur, Y. N., Whitcomb, D. J., Regan, P., Hong, J. H., et al. (2015). Cyclin Y inhibits plasticity-induced AMPA receptor exocytosis and LTP. Sci. Rep. 5:12624. doi: 10.1038/srep12624
Cho, Y. J., Tsherniak, A., Tamayo, P., Santagata, S., Ligon, A., Greulich, H., et al. (2011). Integrative genomic analysis of medulloblastoma identifies a molecular subgroup that drives poor clinical outcome. J. Clin. Oncol. 29, 1424–1430. doi: 10.1200/JCO.2010.28.5148
Colafati, G. S., Voicu, I. P., Carducci, C., Miele, E., Carai, A., Di Loreto, S., et al. (2018). MRI features as a helpful tool to predict the molecular subgroups of medulloblastoma: state of the art. Ther. Adv. Neurol. Disord. 11:1756286418775370. doi: 10.1177/1756286418775375
Corno, D., Daniela, C., Pala, M., Cominelli, M., Cipelletti, B., Leto, K., et al. (2012). Gene signatures associated with mouse postnatal hindbrain neural stem cells and medulloblastoma cancer stem cells identify novel molecular mediators and predict human medulloblastoma molecular classification. Cancer Discov. 2, 554–568. doi: 10.1158/2159-8290.CD-11-0199
Dalman, M. R., Deeter, A., Nimishakavi, G., and Duan, Z. H. (2012). Fold change and p-value cutoffs significantly alter microarray interpretations. BMC Bioinformatics 13(Suppl. 2):S11. doi: 10.1186/1471-2105-13-S2-S11
Deters, K. D., Nho, K., Risacher, S. L., Kim, S., Ramanan, V. K., Crane, P. K., et al. (2017). Genome-wide association study of language performance in Alzheimer’s disease. Brain Lang. 172, 22–29. doi: 10.1016/j.bandl.2017.04.008
Duong, H. Q., Nemazanyy, I., Rambow, F., Tang, S. C., Delaunay, S., Tharun, L., et al. (2018). The Endosomal Protein CEMIP Links WNT Signaling to MEK1-ERK1/2 activation in selumetinib-resistant intestinal organoids. Cancer Res. 78, 4533–4548. doi: 10.1158/0008-5472.CAN-17-3149
Everson, T. M., Marsit, C. J., Michael, O., Shea, T., Burt, A., Hermetz, K., et al. (2019). Epigenome-wide analysis identifies genes and pathways linked to neurobehavioral variation in preterm infants. Sci. Rep. 9:6322. doi: 10.1038/s41598-019-42654-4
Fink, S. P., Myeroff, L. L., Kariv, R., Platzer, P., Xin, B., Mikkola, D., et al. (2015). Induction of KIAA1199/CEMIP is associated with colon cancer phenotype and poor patient survival. Oncotarget 6, 30500–30515. doi: 10.18632/oncotarget.5921
Gaare, J. J., Nido, G. S., Sztromwasser, P., Knappskog, P. M., Dahl, O., Lund-Johansen, M., et al. (2018). Rare genetic variation in mitochondrial pathways influences the risk for Parkinson’s disease. Mov. Disord. 33, 1591–1600. doi: 10.1002/mds.64
Grimmer, M. R., and Weiss, W. A. (2008). BMPs oppose Math1 in cerebellar development and in medulloblastoma. Genes Dev. 22, 693–699. doi: 10.1101/gad.1657808
Hambardzumyan, D., Gutmann, D. H., and Kettenmann, H. (2016). The role of microglia and macrophages in glioma maintenance and progression. Nat. Neurosci. 19, 20–27. doi: 10.1038/nn.4185
Huang, L., Garrett Injac, S., Cui, K., Braun, F., Lin, Q., Du, Y., et al. (2018). Systems biology-based drug repositioning identifies digoxin as a potential therapy for groups 3 and 4 medulloblastoma. Sci. Transl. Med. 10, eaat0150. doi: 10.1126/scitranslmed.aat0150
Ishizuka, K., Tabata, H., Ito, H., Kushima, I., Noda, M., Yoshimi, A., et al. (2018). Possible involvement of a cell adhesion molecule, Migfilin, in brain development and pathogenesis of autism spectrum disorders. J. Neurosci. Res. 96, 789–802. doi: 10.1002/jnr.24194
Ivliev, A. E., t Hoen, P. A., and Sergeeva, M. G. (2010). Coexpression network analysis identifies transcriptional modules related to proastrocytic differentiation and sprouty signaling in glioma. Cancer Res. 70, 10060–10070. doi: 10.1158/0008-5472.CAN-10-2465
Iwasaki, Y., Fujio, K., Okamura, T., and Yamamoto, K. (2015). Interleukin-27 in T cell immunity. Int. J. Mol. Sci. 16, 2851–2863. doi: 10.3390/ijms16022851
Joe, I. S., Kim, J. H., Kim, H., Hong, J. H., Kim, M., Park, M., et al. (2017). Cyclin Y-mediated transcript profiling reveals several important functional pathways regulated by Cyclin Y in hippocampal neurons. PLoS One 12:e0172547. doi: 10.1371/journal.pone.0172547
Joshi, J. B., Patel, D., Morton, D. J., Sharma, P., Zou, J., Hewa Bostanthirige, D., et al. (2017). Inactivation of ID4 promotes a CRPC phenotype with constitutive AR activation through FKBP52. Mol. Oncol. 11, 337–357. doi: 10.1002/1878-0261.12028
Kang, H. J., Kawasawa, Y. I., Cheng, F., Zhu, Y., Xu, X., Li, M., et al. (2011). Spatio-temporal transcriptome of the human brain. Nature 478, 483–489. doi: 10.1038/nature10523
Kimura, I., Nakayama, Y., Konishi, M., Kobayashi, T., Mori, M., Ito, M., et al. (2010). Neuferricin, a novel extracellular heme-binding protein, promotes neurogenesis. J. Neurochem. 112, 1156–1167. doi: 10.1111/j.1471-4159.2009.06522.x
Koelwyn, G. J., Quail, D. F., Zhang, X., White, R. M., and Jones, L. W. (2017). Exercise-dependent regulation of the tumour microenvironment. Nat. Rev. Cancer 17, 620–632. doi: 10.1038/nrc.2017.78
Kool, M., Korshunov, A., Remke, M., Jones, D. T., Schlanstein, M., Northcott, P. A., et al. (2012). Molecular subgroups of medulloblastoma: an international meta-analysis of transcriptome, genetic aberrations, and clinical data of WNT. SHH, group 3, and group 4 medulloblastomas. Acta Neuropathol. 123, 473–484. doi: 10.1007/s00401-012-0958-8
Kumar, K. S., Neve, A., Guerreiro Stucklin, A. S., Kuzan-Fischer, C. M., Rushing, E. J., Taylor, M. D., et al. (2018). TGF-β determines the pro-migratory potential of bFGF signaling in medulloblastoma. Cell Rep. 23:3798-3812.e8. doi: 10.1016/j.celrep.2018.05.083
Langfelder, P., Mischel, P. S., and Horvath, S. (2013). When is hub gene selection better than standard meta-analysis? PLoS One 8:e61505. doi: 10.1371/journal.pone.0061505
Larsimont, J. C., Youssef, K. K., Sanchez-Danes, A., Sukumaran, V., Defrance, M., Delatte, B., et al. (2015). Sox9 controls self-renewal of oncogene targeted cells and links tumor initiation and invasion. Cell Stem Cell 17, 60–73. doi: 10.1016/j.stem.2015.05.008
Łastowska, M., Trubicka, J., Niemira, M., Paczkowska-Abdulsalam, M., Karkucińska-Więckowska, A., Kaleta, M., et al. (2018). Medulloblastoma with transitional features between Group 3 and Group 4 is associated with good prognosis. J. Neurooncol. 138, 231–240. doi: 10.1007/s11060-018-2797-2795
Lewis, M. A., Nolan, L. S., Cadge, B. A., Matthews, L. J., Schulte, B. A., Dubno, J. R., et al. (2018). Whole exome sequencing in adult-onset hearing loss reveals a high load of predicted pathogenic variants in known deafness-associated genes and identifies new candidate genes. BMC Med. Genom. 11:77. doi: 10.1186/s12920-018-0395-1
Li, L., Yan, L. H., Manoj, S., Li, Y., and Lu, L. (2017). Central Role of CEMIP in tumorigenesis and its potential as therapeutic target. J. Cancer 8, 2238–2246. doi: 10.7150/jca.19295
Li, Q., Birkbak, N. J., Gyorffy, B., Szallasi, Z., and Eklund, A. C. (2011). Jetset: selecting the optimal microarray probe set to represent a gene. BMC Bioinformatics 12:474. doi: 10.1186/1471-2105-12-474
Liang, G., Fang, X., Yang, Y., and Song, Y. (2018). Silencing of CEMIP suppresses Wnt/β-catenin/Snail signaling transduction and inhibits EMT program of colorectal cancer cells. Acta Histochem. 120, 56–63. doi: 10.1016/j.acthis.2017.11.002
Louis, D. N., Perry, A., Reifenberger, G., von Deimling, A., Figarella-Branger, D., Cavenee, W. K., et al. (2016). The 2016 World Health Organization classification of tumors of the central nervous system: a summary. Acta Neuropathol. 131, 803–820. doi: 10.1007/s00401-016-1545-1
Luo, J., Schumacher, M., Scherer, A., Sanoudou, D., Megherbi, D., Davison, T., et al. (2010). A comparison of batch effect removal methods for enhancement of prediction performance using MAQC-II microarray gene expression data. Pharmacogenom. J. 10, 278–291. doi: 10.1038/tpj.2010.57
Majd, N., and Penas-Prado, M. (2019). Updates on management of adult medulloblastoma. Curr. Treat. Options. Oncol. 20:64. doi: 10.1007/s11864-019-0663-0
Majzner, R. G., Simon, J. S., Grosso, J. F., Martinez, D., Pawel, B. R., Santi, M., et al. (2017). Assessment of programmed death-ligand 1 expression and tumor-associated immune cells in pediatric cancer tissues. Cancer 123, 3807–3815. doi: 10.1002/cncr.30724
Martirosian, V., Chen, T. C., Lin, M., and Neman, J. (2016). Medulloblastoma initiation and spread: where neurodevelopment, microenvironment and cancer cross pathways. J. Neurosci. Res. 94, 1511–1519. doi: 10.1002/jnr.23917
Maximov, V., Chen, Z., Wei, Y., Robinson, M. H., Herting, C. J., Shanmugam, N. S., et al. (2019). Tumour-associated macrophages exhibit anti-tumoural properties in Sonic Hedgehog medulloblastoma. Nat Commun. 10:2410. doi: 10.1038/s41467-019-10458-9
Mayanil, C. S., George, D., Mania-Farnell, B., Bremer, C. L., McLone, D. G., and Bremer, E. G. (2000). Overexpression of murine Pax3 increases NCAM polysialylation in a human medulloblastoma cell line. J. Biol. Chem. 275, 23259–23266. doi: 10.1074/jbc.M002975200
McHeyzer-Williams, L. J., Pelletier, N., Mark, L., Fazilleau, N., and McHeyzer-Williams, M. G. (2009). Follicular helper T cells as cognate regulators of B cell immunity. Curr. Opin. Immunol 21, 266–273. doi: 10.1016/j.coi.2009.05.010
Merve, A., Dubuc, A. M., Zhang, X., Remke, M., Baxter, P. A., Li, X. N., et al. (2014). Polycomb group gene BMI1 controls invasion of medulloblastoma cells and inhibits BMP-regulated cell adhesion. Acta Neuropathol. Commun. 2:10. doi: 10.1186/2051-5960-2-10
Miao, H., Li, D. Q., Mukherjee, A., Guo, H., Petty, A., Cutter, J., et al. (2009). EphA2 mediates ligand-dependent inhibition and ligand-independent promotion of cell migration and invasion via a reciprocal regulatory loop with Akt. Cancer Cell 16, 9–20. doi: 10.1016/j.ccr.2009.04.009
Mills, C. D. (2012). M1 and M2 macrophages: oracles of health and disease. Crit. Rev. Immunol. 32, 463–488. doi: 10.1615/critrevimmunol.v32.i6.10
Morfouace, M., Cheepala, S., Jackson, S., Fukuda, Y., Patel, Y. T., Fatima, S., et al. (2015). ABCG2 transporter expression impacts group 3 medulloblastoma response to chemotherapy. Cancer Res. 75, 3879–3889. doi: 10.1158/0008-5472.CAN-15-0030
Morimoto, Y., Shimada-Sugimoto, M., Otowa, T., Yoshida, S., Kinoshita, A., Mishima, H., et al. (2018). Whole-exome sequencing and gene-based rare variant association tests suggest that PLA2G4E might be a risk gene for panic disorder. Transl. Psychiatr. 8:41. doi: 10.1038/s41398-017-0088-0
Morrison, L. C., McClelland, R., Aiken, C., Bridges, M., Liang, L., Wang, X., et al. (2013). Deconstruction of medulloblastoma cellular heterogeneity reveals differences between the most highly invasive and self-renewing phenotypes. Neoplasia 15, 384–398. doi: 10.1593/neo.13148
Motaln, H., Gruden, K., Hren, M., Schichor, C., Primon, M., Rotter, A., et al. (2012). Human mesenchymal stem cells exploit the immune response mediating chemokines to impact the phenotype of glioblastoma. Cell Transplant. 21, 1529–1545. doi: 10.3727/096368912x640547
Müllner, D. (2013). fastcluster: fast hierarchical, agglomerative clustering routines for r and python. J. Stat. Softw. 53, 1–18.
Murata, D., Mineharu, Y., Arakawa, Y., Liu, B., Tanji, M., Yamaguchi, M., et al. (2018). High programmed cell death 1 ligand-1 expression: association with CD8+ T-cell infiltration and poor prognosis in human medulloblastoma. J. Neurosurg. 128, 710–716. doi: 10.3171/2016.11.JNS16991
Nakada, M., Niska, J. A., Miyamori, H., McDonough, W. S., Wu, J., Sato, H., et al. (2004). The phosphorylation of EphB2 receptor regulates migration and invasion of human glioma cells. Cancer Res. 64, 3179–3185. doi: 10.1158/0008-5472.can-03-3667
Neve, A., Migliavacca, J., Capdeville, C., Schönholzer, M. T., Gries, A., Ma, M., et al. (2019). Crosstalk between SHH and FGFR signaling pathways controls tissue invasion in medulloblastoma. Cancers 11:1985. doi: 10.3390/cancers11121985
Northcott, P. A., Buchhalter, I., Morrissy, A. S., Hovestadt, V., Weischenfeldt, J., Ehrenberger, T., et al. (2017). The whole-genome landscape of medulloblastoma subtypes. Nature 547, 311–317. doi: 10.1038/nature22973
Northcott, P. A., Robinson, G. W., Kratz, C. P., Mabbott, D. J., Pomeroy, S. L., Clifford, S. C., et al. (2019). Medulloblastoma. Nat. Rev. Dis. Primers. 5:11. doi: 10.1038/s41572-019-0063-6
Northcott, P. A., Shih, D. J., Remke, M., Cho, Y. J., Kool, M., Hawkins, C., et al. (2012). Rapid, reliable, and reproducible molecular sub-grouping of clinical medulloblastoma samples. Acta Neuropathol. 123, 615–626. doi: 10.1007/s00401-011-0899-7
Ogura, Y., Parsons, W. H., Kamat, S. S., and Cravatt, B. F. (2016). A calcium-dependent acyltransferase that produces N-acyl phosphatidylethanolamines. Nat. Chem. Biol. 12, 669–671. doi: 10.1038/nchembio.2127
Ojo, D., Rodriguez, D., Wei, F., Bane, A., and Tang, D. (2019). Downregulation of CYB5D2 is associated with breast cancer progression. Sci. Rep. 9:6624. doi: 10.1038/s41598-019-43006-y
Oliver, T. G., Read, T. A., Kessler, J. D., Mehmeti, A., Wells, J. F., Huynh, T. T. T., et al. (2005). Loss of patched and disruption of granule cell development in a pre-neoplastic stage of medulloblastoma. Development 132, 2425–2439. doi: 10.1242/dev.01793
Ostrow, K. L., Park, H. L., Hoque, M. O., Kim, M. S., Liu, J., Argani, P., et al. (2009). Pharmacologic unmasking of epigenetically silenced genes in breast cancer. Clin. Cancer Res. 15, 1184–1191. doi: 10.1158/1078-0432.CCR-08-1304
Ou, C. Y., Poon, V. Y., Maeder, C. I., Watanabe, S., Lehrman, E. K., Fu, A. K., et al. (2010). Two cyclin-dependent kinase pathways are essential for polarized trafficking of presynaptic components. Cell 141, 846–858. doi: 10.1016/j.cell.2010.04.011
Ou, Y., Wu, Q., Wu, C., Liu, X., Song, Y., Zhan, Q., et al. (2017). Migfilin promotes migration and invasion in glioma by driving EGFR and MMP-2 signalings: a positive feedback loop regulation. J. Genet. Genom. 44, 557–565. doi: 10.1016/j.jgg.2017.09.008
Packer, R. J., Rood, B. R., and MacDonald, T. J. (2003). Medulloblastoma: present concepts of stratification into risk groups. Pediatr. Neurosurg. 39, 60–67. doi: 10.1159/000071316
Park, M., Watanabe, S., Poon, V. Y., Ou, C. Y., Jorgensen, E. M., Shen, K., et al. (2011). CYY-1/cyclin Y and CDK-5 differentially regulate synapse elimination and formation for rewiring neural circuits. Neuron 70, 742–757. doi: 10.1016/j.neuron.2011.04.002
Pasquale, E. B. (2008). Eph-ephrin bidirectional signaling in physiology and disease. Cell 133, 38–52. doi: 10.1016/j.cell.2008.03.011
Pham, C. D., Flores, C., Yang, C., Pinheiro, E. M., Yearley, J. H., Sayour, E. J., et al. (2016). Differential Immune microenvironments and response to immune checkpoint blockade among molecular subtypes of murine medulloblastoma. Clin. Cancer Res. 22, 582–595. doi: 10.1158/1078-0432.CCR-15-0713
Phan, N. N., Wang, C. Y., Chen, C. F., Sun, Z., Lai, M. D., and Lin, Y. C. (2017). Voltage-gated calcium channels: novel targets for cancer therapy. Oncol Lett. 14, 2059–2074. doi: 10.3892/ol.2017.6457
Pinto, D., Delaby, E., Merico, D., Barbosa, M., Merikangas, A., Klei, L., et al. (2014). Convergence of genes and cellular pathways dysregulated in autism spectrum disorders. Am. J. Hum. Genet. 94, 677–694. doi: 10.1016/j.ajhg.2014.03.018
Quail, D. F., and Joyce, J. A. (2017). The microenvironmental landscape of brain. Tumors. Cancer Cell. 31, 326–341. doi: 10.1016/j.ccell.2017.02.009
Quintá, H. R., and Galigniana, M. D. (2012). The neuroregenerative mechanism mediated by the Hsp90-binding immunophilin FKBP52 resembles the early steps of neuronal differentiation. Br. J. Pharmacol. 166, 637–649. doi: 10.1111/j.1476-5381.2011.01783.x
Rahmanto, A. S., Swartling, F. J., and Sangfelt, O. (2016). Targeting SOX9 for degradation to inhibit chemoresistance, metastatic spread, and recurrence. Mol. Cell Oncol. 4:e1252871. doi: 10.1080/23723556.2016.1252871
Raleigh, D. R., Choksi, P. K., Krup, A. L., Mayer, W., Santos, N., and Reiter, J. F. (2018). Hedgehog signaling drives medulloblastoma growth via CDK6. J. Clin. Invest. 128, 120–124. doi: 10.1172/JCI92710
Ramaswamy, V., Remke, M., Adamski, J., Bartels, U., Tabori, U., Wang, X., et al. (2016a). Medulloblastoma subgroup-specific outcomes in irradiated children: who are the true high-risk patients? Neuro Oncol. 18, 291–297. doi: 10.1093/neuonc/nou357
Ramaswamy, V., Remke, M., Bouffet, E., Bailey, S., Clifford, S. C., Doz, F., et al. (2016b). Risk stratification of childhood medulloblastoma in the molecular era: the current consensus. Acta Neuropathol. 131, 821–831. doi: 10.1007/s00401-016-1569-6
Ramaswamy, V., and Taylor, M. D. (2019). Bioinformatic strategies for the genomic and epigenomic characterization of brain tumors. Methods Mol. Biol. 1869, 37–56. doi: 10.1007/978-1-4939-8805-1_4
Ritchie, M. E., Phipson, B., Wu, D., Hu, Y., Law, C. W., Shi, W., et al. (2015). limma powers differential expression analyses for RNA-sequencing and microarray studies. Nucleic Acids Res. 43:e47. doi: 10.1093/nar/gkv007
Robinson, G., Parker, M., Kranenburg, T. A., Lu, C., Chen, X., Ding, L., et al. (2012). Novel mutations target distinct subgroups of medulloblastoma. Nature 488, 43–48. doi: 10.1038/nature11213
Roussel, M. F., and Hatten, M. E. (2011). Cerebellum development and medulloblastoma. Curr. Top. Dev. Biol. 94, 235–282. doi: 10.1016/B978-0-12-380916-2.00008-5
Ruan, B., Pong, K., Jow, F., Bowlby, M., Crozier, R. A., Liu, D., et al. (2008). Binding of rapamycin analogs to calcium channels and FKBP52 contributes to their neuroprotective activities. Proc. Natl. Acad. Sci. U.S.A. 105, 33–38. doi: 10.1073/pnas.0710424105
Ryu, C. S., Klein, K., and Zanger, U. M. (2017). Membrane associated progesterone receptors: promiscuous proteins with pleiotropic functions - focus on interactions with Cytochromes P450. Front. Pharmacol. 8:159. doi: 10.3389/fphar.2017.00159
Schwalbe, E. C., Lindsey, J. C., Nakjang, S., Crosier, S., Smith, A. J., Hicks, D., et al. (2019). Novel molecular subgroups for clinical classification and outcome prediction in childhood medulloblastoma: a cohort study. Lancet Oncol. 18, 958–971. doi: 10.1016/S1470-2045(17)30243-7
Shahi, M. H., Afzal, M., Sinha, S., Eberhart, C. G., Rey, J. A., Fan, X., et al. (2010). Regulation of sonic hedgehog-GLI1 downstream target genes PTCH1, Cyclin D2, Plakoglobin, PAX6 and NKX2.2 and their epigenetic status in medulloblastoma and astrocytoma. BMC Cancer 10:614. doi: 10.1186/1471-2407-10-614
Shih, D. J., Northcott, P. A., Remke, M., Korshunov, A., Ramaswamy, V., Kool, M., et al. (2014). Cytogenetic prognostication within medulloblastoma subgroups. J. Clin. Oncol. 32, 886–896. doi: 10.1200/JCO.2013.50.9539
Shim, S., Yuan, J. P., Kim, J. Y., Zeng, W., Huang, G., Milshteyn, A., et al. (2009). Peptidyl-prolyl isomerase FKBP52 controls chemotropic guidance of neuronal growth cones via regulation of TRPC1 channel opening. Neuron 64, 471–483. doi: 10.1016/j.neuron.2009.09.025
Shou, Y., Robinson, D. M., Amakye, D. D., Rose, K. L., Cho, Y. J., Ligon, K. L., et al. (2015). A five-gene hedgehog signature developed as a patient preselection tool for hedgehog inhibitor therapy in medulloblastoma. Clin. Cancer Res. 21, 585–593. doi: 10.1158/1078-0432.CCR-13-1711
Sica, A., Larghi, P., Mancino, A., Rubino, L., Porta, C., Totaro, M. G., et al. (2008). Macrophage polarization in tumour progression. Semin. Cancer Biol. 18, 349–355. doi: 10.1016/j.semcancer.2008.03.004
Sikkema, A. H., den Dunnen, W. F., Hulleman, E., van Vuurden, D. G., Garcia-Manero, G., Yang, H., et al. (2012). EphB2 activity plays a pivotal role in pediatric medulloblastoma cell adhesion and invasion. Neuro Oncol. 14, 1125–1135. doi: 10.1093/neuonc/nos130
Smith-Carpenter, J. E., and Alper, B. J. (2018). Functional requirement for human pitrilysin metallopeptidase 1 arginine 183, mutated in amyloidogenic neuropathy. Protein Sci. 27, 861–873. doi: 10.1002/pro.3380
Sonabend, A. M., Ogden, A. T., Maier, L. M., Anderson, D. E., Canoll, P., Bruce, J. N., et al. (2012). Medulloblasoma: challenges for effective immunotherapy. J. Neurooncol. 108, 1–10. doi: 10.1007/s11060-011-0776-1
Swartling, F. J., Savov, V., Èanèer, M., Bolin, S., Fotaki, G., Dubuc, A., et al. (2014). METASTASIS AND TUMOR RECURRENCE FROM RARE SOX9-POSITIVE CELLS IN MYCN-DRIVEN MEDULLOBLASTOMA. Neuro Oncol. 16(Suppl. 3):iii28. doi: 10.1093/neuonc/nou208.20
Szklarczyk, D., Gable, A. L., Lyon, D., Junge, A., Wyder, S., Huerta-Cepas, J., et al. (2019). STRING v11: protein–protein association networks with increased coverage, supporting functional discovery in genome-wide experimental datasets. Nucleic Acids Res. 47, D607–D613. doi: 10.1093/nar/gky1131
Tamayo, P., Cho, Y. J., Tsherniak, A., Greulich, H., Ambrogio, L., Schouten-van Meeteren, N., et al. (2011). Predicting relapse in patients with medulloblastoma by integrating evidence from clinical and genomic features. J. Clin. Oncol. 29, 1415–1423. doi: 10.1200/JCO.2010.28.1675
Tantawy, M., Elzayat, M. G., Yehia, D., and Taha, H. (2018). Identification of microRNA signature in different pediatric brain tumors. Genet. Mol. Biol. 41, 27–34. doi: 10.1590/1678-4685-GMB-2016-0334
Tatro, E. T., Everall, I. P., Kaul, M., and Achim, C. L. (2009a). Modulation of glucocorticoid receptor nuclear translocation in neurons by immunophilins FKBP51 and FKBP52: implications for major depressive disorder. Brain Res. 1286, 1–12. doi: 10.1016/j.brainres.2009.06.036
Tatro, E. T., Everall, I. P., Masliah, E., Hult, B. J., Lucero, G., Chana, G., et al. (2009b). Differential expression of immunophilins FKBP51 and FKBP52 in the frontal cortex of HIV-infected patients with major depressive disorder. J. Neuroimmun. Pharmacol. 4, 218–226. doi: 10.1007/s11481-009-9146-6
Taylor, M. D., Northcott, P. A., Korshunov, A., Remke, M., Cho, Y. J., Clifford, S. C., et al. (2012). Molecular subgroups of medulloblastoma: the current consensus. Acta Neuropathol. 123, 465–472. doi: 10.1007/s00401-011-0922-z
Therneau, T. M., and Grambsch, P. M. (2000). Modeling Survival Data: Extending the Cox Model. New York, NY: Springer.
Tibshirani, R. (1997). The lasso method for variable selection in the Cox model. Stat. Med. 16, 385–395. doi: 10.1002/(sici)1097-0258(19970228)16:4<385::aid-sim380>3.0.co;2-3
Topalian, S. L., Taube, J. M., Anders, R. A., and Pardoll, D. M. (2016). Mechanism-driven biomarkers to guide immune checkpoint blockade in cancer therapy. Nat. Rev. Cancer 16, 275–287. doi: 10.1038/nrc.2016.36
Vermeulen, J. F., Van Hecke, W., Adriaansen, E. J. M., Jansen, M. K., Bouma, R. G., Villacorta Hidalgo, J., et al. (2017). Prognostic relevance of tumor-infiltrating lymphocytes and immune checkpoints in pediatric medulloblastoma. Oncoimmunology 7:e1398877. doi: 10.1080/2162402X.2017.1398877
Wang, Q., Fang, W. H., Krupinski, J., Kumar, S., Slevin, M., and Kumar, P. (2008). Pax genes in embryogenesis and oncogenesis. J. Cell Mol. Med. 12, 2281–2294. doi: 10.1111/j.1582-4934.2008.00427.x
Waszak, S. M., Northcott, P. A., Buchhalter, I., Robinson, G. W., Sutter, C., Groebner, S., et al. (2018). Spectrum and prevalence of genetic predisposition in medulloblastoma: a retrospective genetic study and prospective validation in a clinical trial cohort. Lancet Oncol. 19, 785–798. doi: 10.1016/S1470-2045(18)30242-0
Xia, H., Zhong, D., Wu, X., Li, J., Yang, Y., Sun, X., et al. (2019). Medulloblastomas in cerebellopontine angle: epidemiology, clinical manifestations, imaging features, molecular analysis and surgical outcome. J. Clin. Neurosci. 67, 93–98. doi: 10.1016/j.jocn.2019.06.013
Xie, Y., Bruce, A., He, L., Wei, F., Tao, L., Tang, D., et al. (2011). CYB5D2 enhances HeLa cells survival of etoposide-induced cytotoxicity. Biochem. Cell Biol. 89, 341–350. doi: 10.1139/O11-004
Xie, Y., Shen, Y. T., Kapoor, A., Ojo, D., Wei, F., De Melo, J., et al. (2016a). CYB5D2 displays tumor suppression activities towards cervical cancer. Biochim. Biophys. Acta 1862, 556–565. doi: 10.1016/j.bbadis.2015.12.013
Xie, Y., Shen, Y. T., Kapoor, A., Ojo, D., Wei, F., De Melo, J., et al. (2016b). Dataset on the effects of CYB5D2 on the distribution of HeLa cervical cancer cell cycle. Data Brief 6, 811–816. doi: 10.1016/j.dib.2016.01.036
Xu, Y., Wang, Z., Wang, J., Li, J., Wang, H., Yue, W., et al. (2010). Lentivirus-mediated knockdown of cyclin Y (CCNY) inhibits glioma cell proliferation. Oncol. Res. 18, 359–364. doi: 10.3727/096504010X12644422320582
Yin, W. C., Satkunendran, T., Mo, R., Morrissy, S., Zhang, X., Huang, E. S., et al. (2019). Dual Regulatory Functions of SUFU and Targetome of GLI2 in SHH subgroup medulloblastoma. Dev. Cell 48, 167.e–183.e. doi: 10.1016/j.devcel.2018.11.015
Yoshida, H., and Hunter, C. A. (2015). The immunobiology of interleukin-27. Annu. Rev. Immunol. 33, 417–443. doi: 10.1146/annurev-immunol-032414-112134
Yoshihara, K., Shahmoradgoli, M., Martínez, E., Vegesna, R., Kim, H., Torres-Garcia, W., et al. (2013). Inferring tumour purity and stromal and immune cell admixture from expression data. Nat Commun. 4:2612. doi: 10.1038/ncomms3612
Yoshino, Y., Ishisaka, M., Tsuruma, K., Shimazawa, M., Yoshida, H., Inoue, S., et al. (2017). Distribution and function of hyaluronan binding protein involved in hyaluronan depolymerization (HYBID. KIAA1199) in the mouse central nervous system. Neuroscience 7, 1–10. doi: 10.1016/j.neuroscience.2017.01.049
Yoshino, Y., Shimazawa, M., Nakamura, S., Inoue, S., Yoshida, H., Shimoda, M., et al. (2018). Targeted deletion of HYBID (hyaluronan binding protein involved in hyaluronan depolymerization/KIAA1199/CEMIP) decreases dendritic spine density in the dentate gyrus through hyaluronan accumulation. Biochem. Biophys. Res. Commun. 503, 1934–1940. doi: 10.1016/j.bbrc.2018.07.138
Yu, G., Wang, L., Han, Y., and He, Q. (2012). clusterProfiler: an R package for comparing biological themes among gene clusters. OMIC 16, 284–287. doi: 10.1089/omi.2011.0118
Zhang, D., Zhao, L., Shen, Q., Lv, Q., Jin, M., Ma, H., et al. (2017). Down-regulation of KIAA1199/CEMIP by miR-216a suppresses tumor invasion and metastasis in colorectal cancer. Int. J. Cancer 140, 2298–2309. doi: 10.1002/ijc.30656
Keywords: medulloblastoma, gene signature, prognosis, risk score model, LASSO
Citation: Li C, Zou H, Xiong Z, Xiong Y, Miyagishima DF, Wanggou S and Li X (2020) Construction and Validation of a 13-Gene Signature for Prognosis Prediction in Medulloblastoma. Front. Genet. 11:429. doi: 10.3389/fgene.2020.00429
Received: 29 November 2019; Accepted: 07 April 2020;
Published: 19 May 2020.
Edited by:
Juan Caballero, Universidad Autónoma de Querétaro, MexicoReviewed by:
Shaoli Das, National Institutes of Health (NIH), United StatesManal Said Fawzy, Suez Canal University, Egypt
Copyright © 2020 Li, Zou, Xiong, Xiong, Miyagishima, Wanggou and Li. This is an open-access article distributed under the terms of the Creative Commons Attribution License (CC BY). The use, distribution or reproduction in other forums is permitted, provided the original author(s) and the copyright owner(s) are credited and that the original publication in this journal is cited, in accordance with accepted academic practice. No use, distribution or reproduction is permitted which does not comply with these terms.
*Correspondence: Xuejun Li, bHhqbmV1cm9AY3N1LmVkdS5jbg==
†These authors have contributed equally to this work