 Maija Suvanto1
 Jonathan Beesley2Carl Blomqvist3Georgia Chenevix-Trench2
 Sofia Khan1,4
 Heli Nevanlinna1*
- 1Department of Obstetrics and Gynecology, University of Helsinki and Helsinki University Hospital, Helsinki, Finland
- 2Department of Genetics and Computational Biology, QIMR Berghofer Medical Research Institute, Brisbane, QL, Australia
- 3Department of Oncology, University of Helsinki and Helsinki University Hospital, Helsinki, Finland
- 4Turku Bioscience Centre, University of Turku and Åbo Akademi University, Turku, Finland
Long non-coding RNAs (lncRNAs) play crucial roles in human physiology, and have been found to be associated with various cancers. Transcribed ultraconserved regions (T-UCRs) are a subgroup of lncRNAs conserved in several species, and are often located in cancer-related regions. Breast cancer is the most common cancer in women worldwide and the leading cause of female cancer deaths. We investigated the association of genetic variants in lncRNA and T-UCR regions with breast cancer risk to uncover candidate loci for further analysis. Our focus was on low-penetrance variants that can be discovered in a large dataset. We selected 565 regions of lncRNAs and T-UCRs that are expressed in breast or breast cancer tissue, or show expression correlation to major breast cancer associated genes. We studied the association of single nucleotide polymorphisms (SNPs) in these regions with breast cancer risk in the 122970 case samples and 105974 controls of the Breast Cancer Association Consortium’s genome-wide data, and also by in silico functional analyses using Integrated Expression Quantitative trait and in silico prediction of GWAS targets (INQUISIT) and expression quantitative trait loci (eQTL) analysis. The eQTL analysis was carried out using the METABRIC dataset and analyses from GTEx and ncRNA eQTL databases. We found putative breast cancer risk variants (p < 1 × 10⁻⁵) targeting the lncRNA GABPB1-AS1 in INQUISIT and eQTL analysis. In addition, putative breast cancer risk associated SNPs (p < 1 × 10⁻⁵) in the region of two T-UCRs, uc.184 and uc.313, located in protein coding genes CPEB4 and TIAL1, respectively, targeted these genes in INQUISIT and in eQTL analysis. Other non-coding regions containing SNPs with the defined p-value and highly significant false discovery rate (FDR) for breast cancer risk association were discovered that may warrant further studies. These results suggest candidate lncRNA loci for further research on breast cancer risk and the molecular mechanisms.
Introduction
About 70–90% of the human genome is transcribed (Guttman et al., 2009; Mercer et al., 2009). The protein coding RNAs account for only a small fraction of all the transcripts, while non-coding RNAs (ncRNA) cover 95% (Dermitzakis et al., 2005; Kapranov et al., 2007; Mattick, 2009). These include long non-coding RNAs (lncRNAs), defined as ncRNAs with over 200 nucleotides. They participate in various biological processes, including differentiation, immune response and metabolism (Kretz et al., 2013; Hung et al., 2014; Wang et al., 2014) as well as in pathogenic processes, such as the development and progression of cancer (Gupta et al., 2010; Yang et al., 2013; Xing et al., 2014). Their expression exhibits cell type specificity and responds to various stimuli, suggesting a rigorous transcriptional regulation (Wang and Chang, 2011).
A curious subclass of lncRNAs are the ultraconserved regions (UCRs). These are stretches of DNA expanding over 200 nucleotides that are absolutely conserved between orthologous regions in human, mouse and rat (Bejerano et al., 2004). There exist 481 such regions spread across the human genome, and 93% of the UCRs are transcribed in at least one normal human tissue (Calin et al., 2007). However, the study of T-UCR expression is complicated: based on annotation compiled by Mestdagh et al. (2010), 38.7% of the 481 T-UCRs are intergenic and 57.4% of the 481 T-UCRs are located in protein coding genes (42.6% intronic, 4.2% exonic, 5% partly exonic, and 5.6% exon containing), and 3.9% of T-UCRs lack an explicit gene-related annotation, because of the host gene splice variants. For these intragenic T-UCRs, it is difficult to define if the expression signal/measurement comes from the T-UCR or from the host gene. Mestdagh et al. (2010) studied this question in neuroblastoma tissue and found 237 T-UCRs to be independently expressed while the expression of the remaining 244 T-UCRs was inseparable from the host gene expression, either because the T-UCR was expressed as a part of the host gene transcript, or because the T-UCR and host gene expressions correlate for some other reasons. Interestingly, many of the T-UCRs are located in cancer-related regions and fragile sites, and their expression is frequently altered in human cancer (Amos et al., 2017; Fabris and Calin, 2017; Terracciano et al., 2017).
Breast cancer is the most common cancer in women worldwide and the leading cause of female cancer deaths (Torre et al., 2015). Breast cancer risk has a strong hereditary aspect, especially genes encoding tumor suppressors, which play a role in DNA damage response and repair pathways, are mutated in hereditary breast cancer (Goldgar et al., 1994; Lichtenstein et al., 2000; Collaborative Group on Hormonal Factors in Breast Cancer, 2001; Nielsen et al., 2016). BRCA1 and BRCA2 genes carry pathogenic variants of high-penetrance that cover approximately 20% of the familial relative risk (Mavaddat et al., 2015). Other variants, the majority of them with moderate or low penetrance, have been found to cover little over 20%, putting the altogether familial relative risk coverage to approximately 44% (Michailidou et al., 2017). Up to the present, nearly 200 low-penetrance susceptibility loci have been identified. While high- and moderate-penetrance variants are often in protein coding regions, low-penetrance variants are typically located in non-coding regions (Ghoussaini et al., 2013; Michailidou et al., 2017; Milne et al., 2017).
Recently, several studies have shown a link between genetic variants in lncRNA genes and breast cancer risk. Cui et al. (2018) found a SNP 2 kb upstream of H19 transcription start site that was associated with breast cancer risk in estrogen receptor (ER)-positive patients in the Chinese population. Wu et al. (2018) studied risk associations among 22977 cases and 105974 controls of European ancestry and found several novel risk-loci that harbored lncRNA genes. Three of these lncRNAs, and four altogether (ANRIL, H19, PVT1, and IGF2-AS), were reported to have disease association based on SNP-association either with breast cancer or prostate cancer risk or survival (Eeles et al., 2009; Turnbull et al., 2010; Meyer et al., 2011; Riaz et al., 2012). In addition, several lncRNAs have been found to be differentially expressed in various breast cancer subtypes (Mathias et al., 2019). While the precise functionality of lncRNAs in breast cancer remains to be elucidated, they play a role in the regulation of intracellular and intercellular signaling (Klinge, 2018).
The Breast Cancer Association Consortium (BCAC) is an international multidisciplinary consortium with a focus on inherited risk of breast cancer1. Their aim is to combine data from many studies to identify genes related to breast cancer risk and, with the world’s largest collection of breast cancer case samples and controls, provide a powerful assessment of risk associated with the studied genes. BCAC has the largest genomic breast cancer dataset worldwide. Several papers describe in detail BCAC and genotyping projects using the BCAC dataset (Michailidou et al., 2013, 2015, 2017).
In this study, we look into the breast cancer risk association of SNPs on lncRNAs expressed in mammary tissue or associated with known breast cancer risk genes, as well as SNPs located at the T-UCRs. We carried this out by analyzing the Breast Cancer Association Consortium’s (BCAC) GWAS, OncoArray, and iCOGs SNP array summary statistics to find SNPs in or near lncRNAs or T-UCRs that associate with breast cancer risk. The loci with GWAS-significant results have been published recently (Michailidou et al., 2017; Milne et al., 2017), and in this study we concentrate on the lncRNA and T-UCR related SNPs with p < 10–5 to uncover other candidate lncRNA loci for further analysis. The functionality of the SNPs of interest was studied with integrated expression quantitative trait and in silico prediction of GWAS targets (INQUISIT; Michailidou et al., 2017) and eQTL analysis. We found putative breast cancer risk variants associated with the expression of lncRNA GA-binding protein transcription factor beta subunit 1 antisense RNA 1 (GABPB1-AS1), cytoplasmic polyadenylation element binging protein 4 (CPEB4) associated with uc.184, and TIA 1 cytotoxic granule associated RNA binding protein like 1 (TIAL1) associated with uc.313.
Materials and Methods
The work flow of the study is presented in Figure 1.
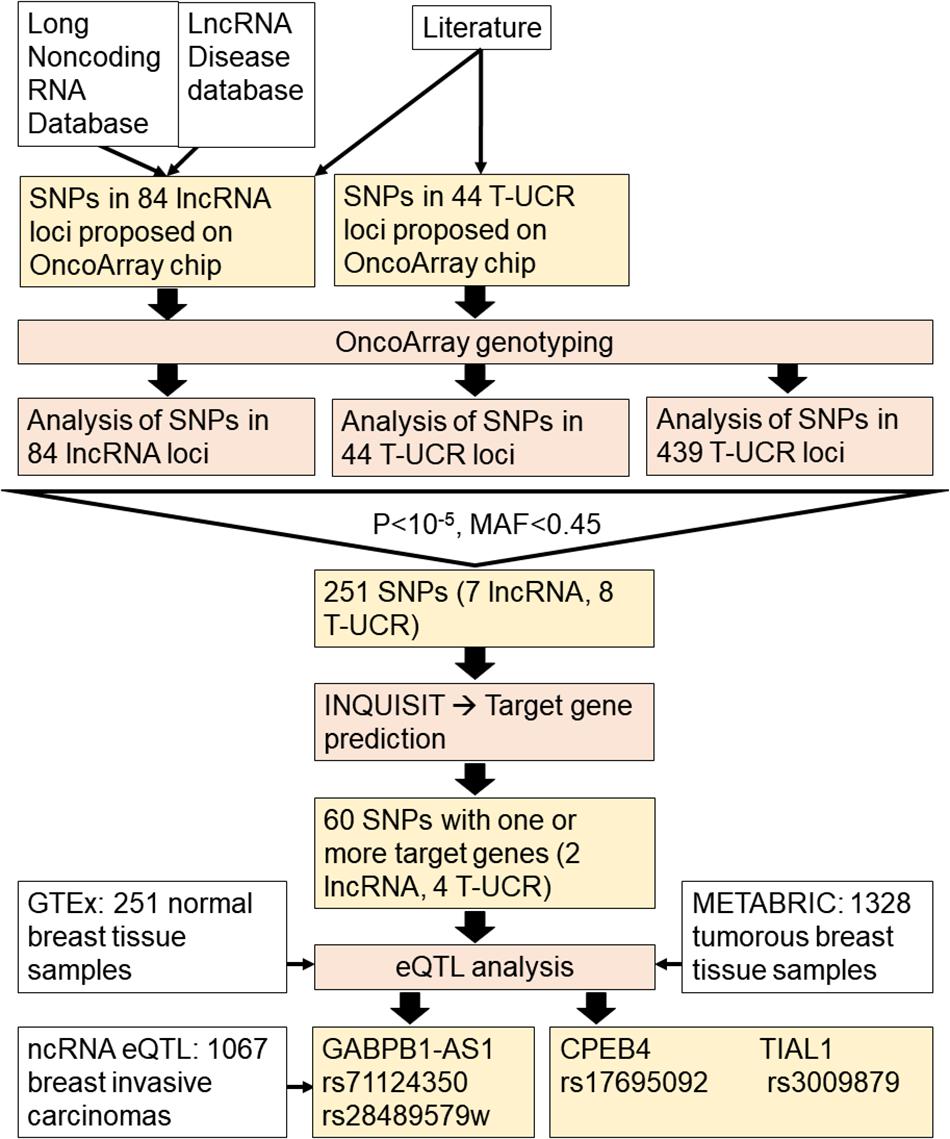
Figure 1. Workflow chart of the study.
Study Population
The analyses were based on summary results of the Breast Cancer Association Consortium (BCAC). The collaborative dataset of the BCAC contained 122970 female breast cancer case samples and 105974 controls of European ethnicity. Of these, 61282 cases and 45494 controls were genotyped using OncoArray (Amos et al., 2017), and 46785 cases and 42892 controls using iCOGs (Michailidou et al., 2013), while 14910 cases and 17588 controls came from 11 other breast cancer GWAS experiments (Michailidou et al., 2015). All participating studies were approved by their appropriate institutional ethics review board and all subjects provided informed consent. All research was performed in accordance with the relevant guidelines and regulations.
Selection of lncRNA Regions for the Study
We selected 565 regions of lncRNAs and T-UCRs. Following a comprehensive search for relevant lncRNAs we selected altogether 84 lncRNA regions with reported polymorphisms based on multiple criteria including tissue specific expression, positive expression correlation with high and moderate penetrance genes, and known disease associations (Supplementary Table S1). 46 lncRNAs had expression above five tags per million (Gibb et al., 2011) in breast tumor tissue. Ten of these, and 25 other lncRNAs, showed positive expression correlation with high and moderate penetrance genes (ten with BRCA1, three with BRCA2, two with ATM, one with CDH1, three with CHEK2, two with PALB2, thirteen with RAD51C, and one with TP53). Several lncRNAs showed positive correlation with multiple of these genes, but here only the strongest correlations are listed (Supplementary Table S1). For the correlation analysis, we used expression data from GENCODE. The expression data as normalized RPKM (reads per kilobase per million mapped reads) values was retrieved from GENCODE database v7 (Derrien et al., 2012). Twenty-two lncRNAs had a reported disease association defined either by higher expression in a tumor tissue compared to a normal tissue or by chromosomal aberrations in lncRNA regions in samples from breast, ovarian or prostate cancer (data retrieved from Long Non-coding RNA Database (Amaral et al., 2011), LncRNADisease database (Chen et al., 2013) and literature in March 2013) (Supplementary Table S2). Three of these lncRNAs, and four altogether (ANRIL, H19, PVT1, and IGF2-AS) were reported to have disease association based on SNP association either with breast cancer or prostate cancer risk or survival (Eeles et al., 2009; Turnbull et al., 2010; Meyer et al., 2011; Riaz et al., 2012). For these 84 lncRNAs we included SNPs located in exons and 50 kb flanking regions, 5′UTRs, and 150 nucleotides upstream from a transcription starting site. The SNPs in the 84 lncRNA regions were genotyped on the OncoArray genotyping chip (Amos et al., 2017). In addition, we selected 44 T-UCR regions that were either highly expressed in normal breast tissue and/or had a known enhancer activity and/or were located at cancer-associated genomic regions (Calin et al., 2007; Scaruffi, 2011) (Supplementary Table S3). SNPs in these T-UCR loci, including 50 bp extended region on both sides, with 1000 genomes European MAF ≥ 0.0013 were selected for genotyping on the OncoArray.
Here, we have included in the analysis all the genotyped SNPs in the 84 lncRNA regions and 44 T-UCR regions, and extended our study to also include the remaining T-UCR regions resulting in an extensive explorative study of all the 481 T-UCR regions in the genome (Bejerano et al., 2004). While Bejerano et al. (2004) reported no evidence that 256 of these 481 ultraconserved regions were transcribed, Calin et al. (2007) found that 93% of these regions were transcribed in at least one normal human tissue. Thus we decided to include all ultraconserved regions in this study alongside the other lncRNAs, as well as to refer to them as T-UCRs.
The regions of interest that were used to gather SNPs from the BCAC results database were defined as the above mentioned 565 lncRNA or T-UCR of interest, and 50 kb flanking it in both directions.
Genotyping
OncoArray contains approximately 533000 markers, while iCOGS holds 211000 (18, 19). Their genotyping and the genotyping of the eleven GWAS in the BCAC has been previously described in detail (Michailidou et al., 2013, 2015, 2017). All samples were imputed using the version 3 (October 2014) release of the 1000 Genomes Project dataset as the reference panel. For iCOGS, OncoArray, and nine of the eleven GWAS, the imputation was carried out with a 2-stage approach using SHAPEIT2 for phasing and IMPUTE v2 for imputation; the two remaining GWAS were imputed separately using MaCH and Minimac (Howie et al., 2009, 2012; Li et al., 2010; O’Connell et al., 2014). The details of the imputation process have been described previously (Michailidou et al., 2017). Summary statistics used in the study were obtained through BCAC. In this study, we looked at associations in 565 specific regions, and used a p-value of p < 10–5 as the limit of interrogation.
Target Gene Prediction
The functionality of the putative breast cancer risk variants was assessed by annotating each variant with publicly available genomic data from breast cells and by using a heuristic scoring system (Integrated Expression Quantitative trait and in silico prediction of GWAS targets, INQUISIT) that combines genomic data from multiple sources, including chromatin interactions, computational enhancer–promoter correlations, transcription factor binding chromatin immunoprecipitation followed by sequencing, gene expression and topologically associated domain boundaries, and which is described in detail by Michailidou et al. (2017). For this study, the target gene predictions were made from annotation in MCF7 and HMEC cells, and the prediction methods were chromatin interaction analysis by paired-end tag sequencing (ChIA-PET), integrated methods for predicting enhancer targets (IM-PET) and analysis of super-enhancers as defined by Hnisz et al. (2013).
Expression Quantitative Trait Loci (eQTL) Analysis
The Genotype-Tissue Expression (GTEx) project’s breast tissue eQTL results (version 7) were used to detect SNP associations with gene expression. The dataset included 251 normal breast tissue samples. The data used for the analyses in this study were downloaded from the GTEx Portal2 on February 13th, 2018 (version 7).
In addition, an eQTL analysis of the Molecular Taxonomy of Breast Cancer International Consortium (METABRIC, Curtis et al., 2012) dataset was carried out. The raw genotype data (Affymetrix SNP 6.0 platform) and normalized mRNA expression data (Illumina HT-12 v3 platform) extracted from matched DNA and RNA specimens of tumorous breast tissue were downloaded from the European Genome-phenome Archive3. The genotype data was processed with Affymetrix Genotyping Console Software following the practices of the Affymetrix SNP 6.0 analysis workflow. The workflow including a quality control step has been previously described (Jamshidi et al., 2015; Khan et al., 2015). After the quality control, the analysis contained 1328 samples with both genotype and expression data. The analysis was carried out using R-package Matrix eQTL with linear regression model (Shabalin, 2012).
The recently published database ncRNA eQTL was queried to validate GABPB1-AS1 eQTL results4 (Li et al., 2019).
Statistical Analysis
The BCAC summary results included a meta-analysis of OncoArray, iCOGS and 11 GWAS analyses, as well as effect size and standard error and p-value for these analyses for all variants. The meta-analysis has been described in detail in Michailidou et al. (2017) and the summary results are available at5. An FDR cut-off of 0.5 was used to evaluate the importance of the findings. FDR was calculated with the Benjamini–Hochberg procedure for all SNPs in the regions of interest using the R 3.5.2 environment (R Core Team, 2013)6.
Statistical analysis of INQUISIT is described in detail in Michailidou et al. (2017).
For the eQTL analysis results, a cut-off of nominal p = 0.05 was used. The eQTL data available at the GTEx Portal included p-values, normalized size effect (NES) and standard error to NES. The R-package Matrix eQTL used to carry out METABRIC eQTL analysis also provided FDR p-values. Those were viewed as additional information for the discussion. ncRNA eQTL statistical information included beta, r, and p-values.
Online Bioinformatics Tools
Linkage disequilibrium between SNPs was checked using Broad Institutes SNP annotation and proxy search (SNAP v2.2; Johnson et al., 2008) and LDlink (v3.7; Machiela and Chanock, 2015). Promoter/enhancer loci were browsed using GeneHancer in GeneCards (7, version 4.7, accessed 4.5.2018, Fishilevich et al., 2017). Gene and SNP positions were checked using the UCSC Genome Browser (8, Kent et al., 2002) and Ensembl genome browser 92 (9, Zerbino et al., 2018).
Results
In this study, we looked into the breast cancer risk association of SNPs in the regions of breast cancer-relevant lncRNAs and of T-UCRs around the genome in a large cohort of European breast cancer patients. We selected altogether 565 lncRNA regions that included 84 lncRNAs with reported polymorphisms based on multiple criteria, including tissue specific expression, co-expression with high and moderate penetrance genes, and known disease associations, and 481 ultraconserved regions. 153 ultraconserved regions including the 44 T-UCRs selected for the OncoArray were either highly expressed in normal breast tissue and/or had a known enhancer activity and/or were located at cancer-associated genomic regions while no such information was available for the rest of the ultraconserved regions. The regions of interest were defined as the transcribed lncRNA/T-UCR and 50 kb up- and downstream genomic sequence. For the sake of brevity and clarity, we numbered the lncRNA regions and refer to those numbers in this article instead of the subject lncRNA of the region. The nomenclature for the ultraconserved regions came from the article by Bejerano et al. (2004). All regions, genes and the rationales for selecting them for this study can be found in Supplementary Table S1 and Supplementary Table S2. Positional annotations follow Human GRCh37/Hg19.
SNPs in Seven lncRNAs and Eight T-UCRs Associated With Breast Cancer Risk
We used BCAC summary statistics on risk results from meta-analysis of OncoArray, iCOGS and 11 separate genome-wide association studies (GWAS). The regions of interest included 5401 genotyped and 349112 imputed SNPs. Results with genome-wide significance level (p < 5 × 10⁻⁸) for five of the lncRNA regions and 18 of the T-UCR regions have previously been published by the BCAC and are listed in Supplementary Table S4. These regions are undergoing further fine mapping studies by the BCAC. Here, a p-value of <10–5 and MAF <0.45 was used as the limit of interrogation, resulting in seven lncRNA regions and eight T-UCRs containing three genotyped and 248 imputed SNPs not previously reported by the BCAC (Tables 1, 2). FDR was calculated for all the SNPs in the regions of interest to evaluate the importance of the findings (Supplementary Table S5). None of the SNPs in the T-UCR regions were directly in the T-UCRs themselves, but in the regions flanking them. This is expected due to the nature of ultraconservation, but makes it difficult to analyze the relationship between the SNP and the T-UCR.
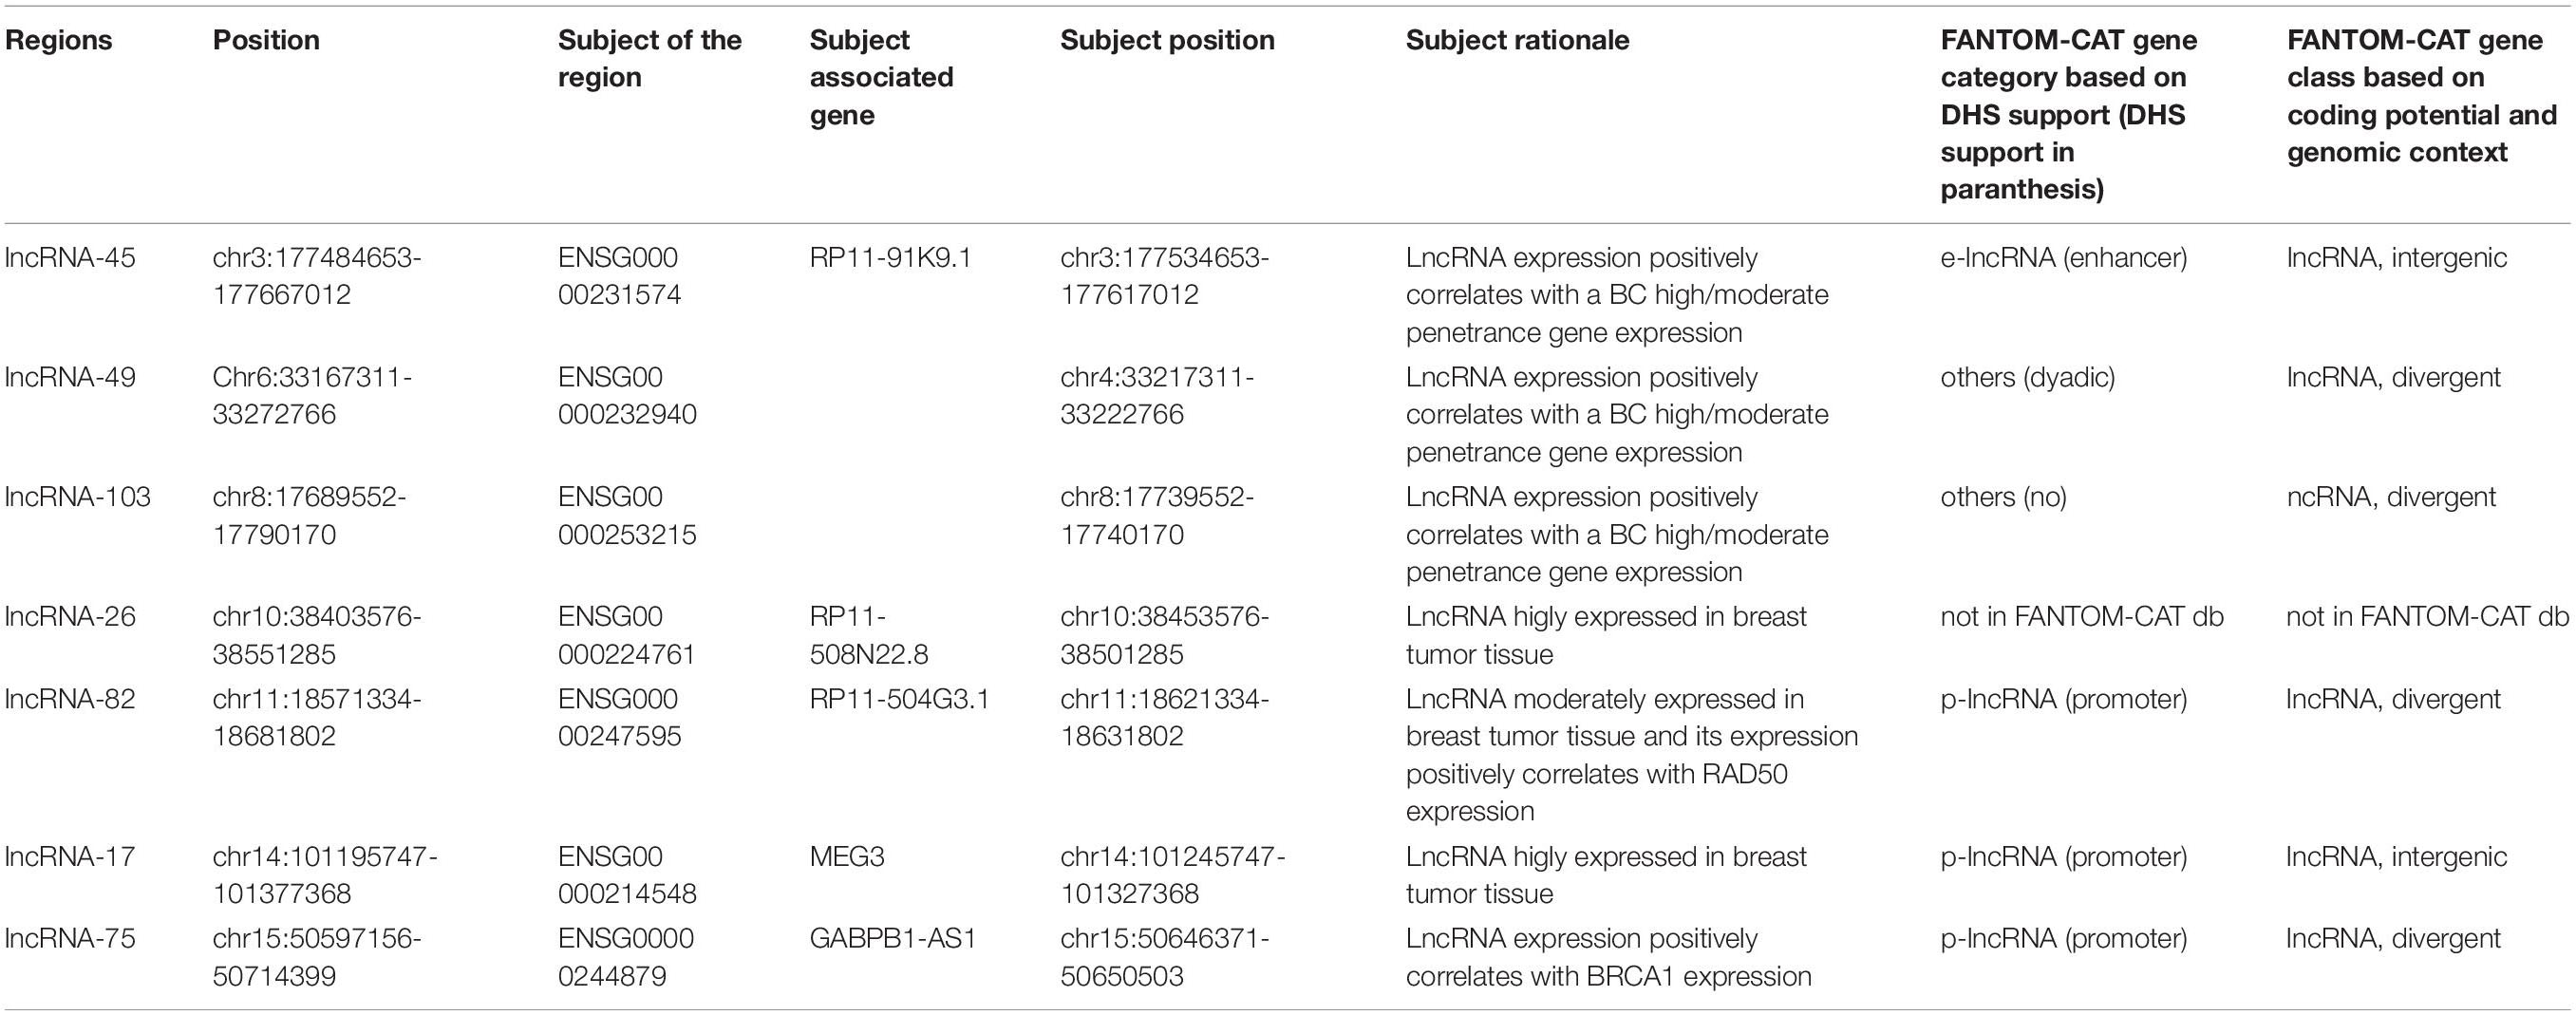
Table 1. All lncRNA regions where SNPs with p < 10–5 were found.
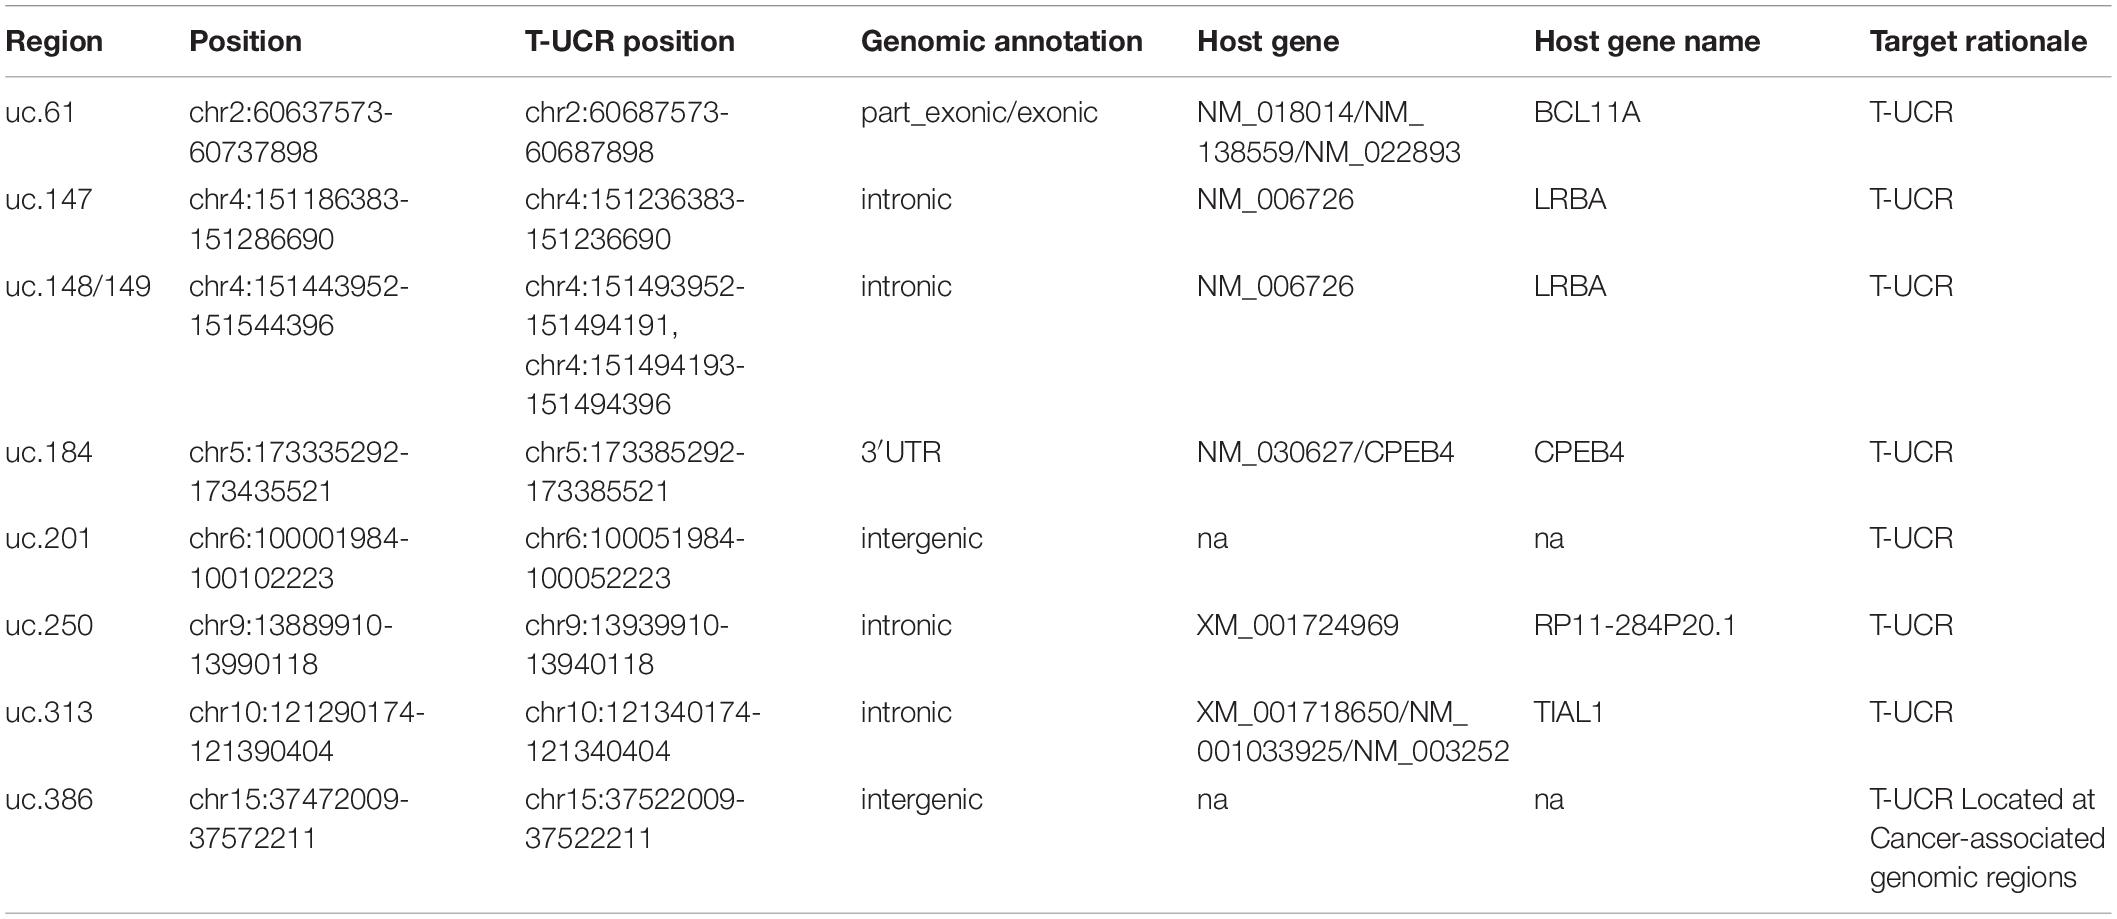
Table 2. All ultraconserved regions where SNPs with p < 10–5 were found.
In addition to the results from the meta-analysis of breast cancer overall, we interrogated the meta-analysis results from ER-negative and ER-positive patient subgroups separately (Table 3). Fourteen SNPs (all imputed) were shared between the overall and ER-negative analyses, all located in the uc.147 region, and 5 SNPs had p < 10–5 in the ER-negative analysis only (all imputed). Nine SNPs were shared between the overall and ER-positive analyses (all imputed) and no SNP gave a p-value under the threshold in ER-positive analysis only. None of the SNPs were shared by all three subgroup analyses.
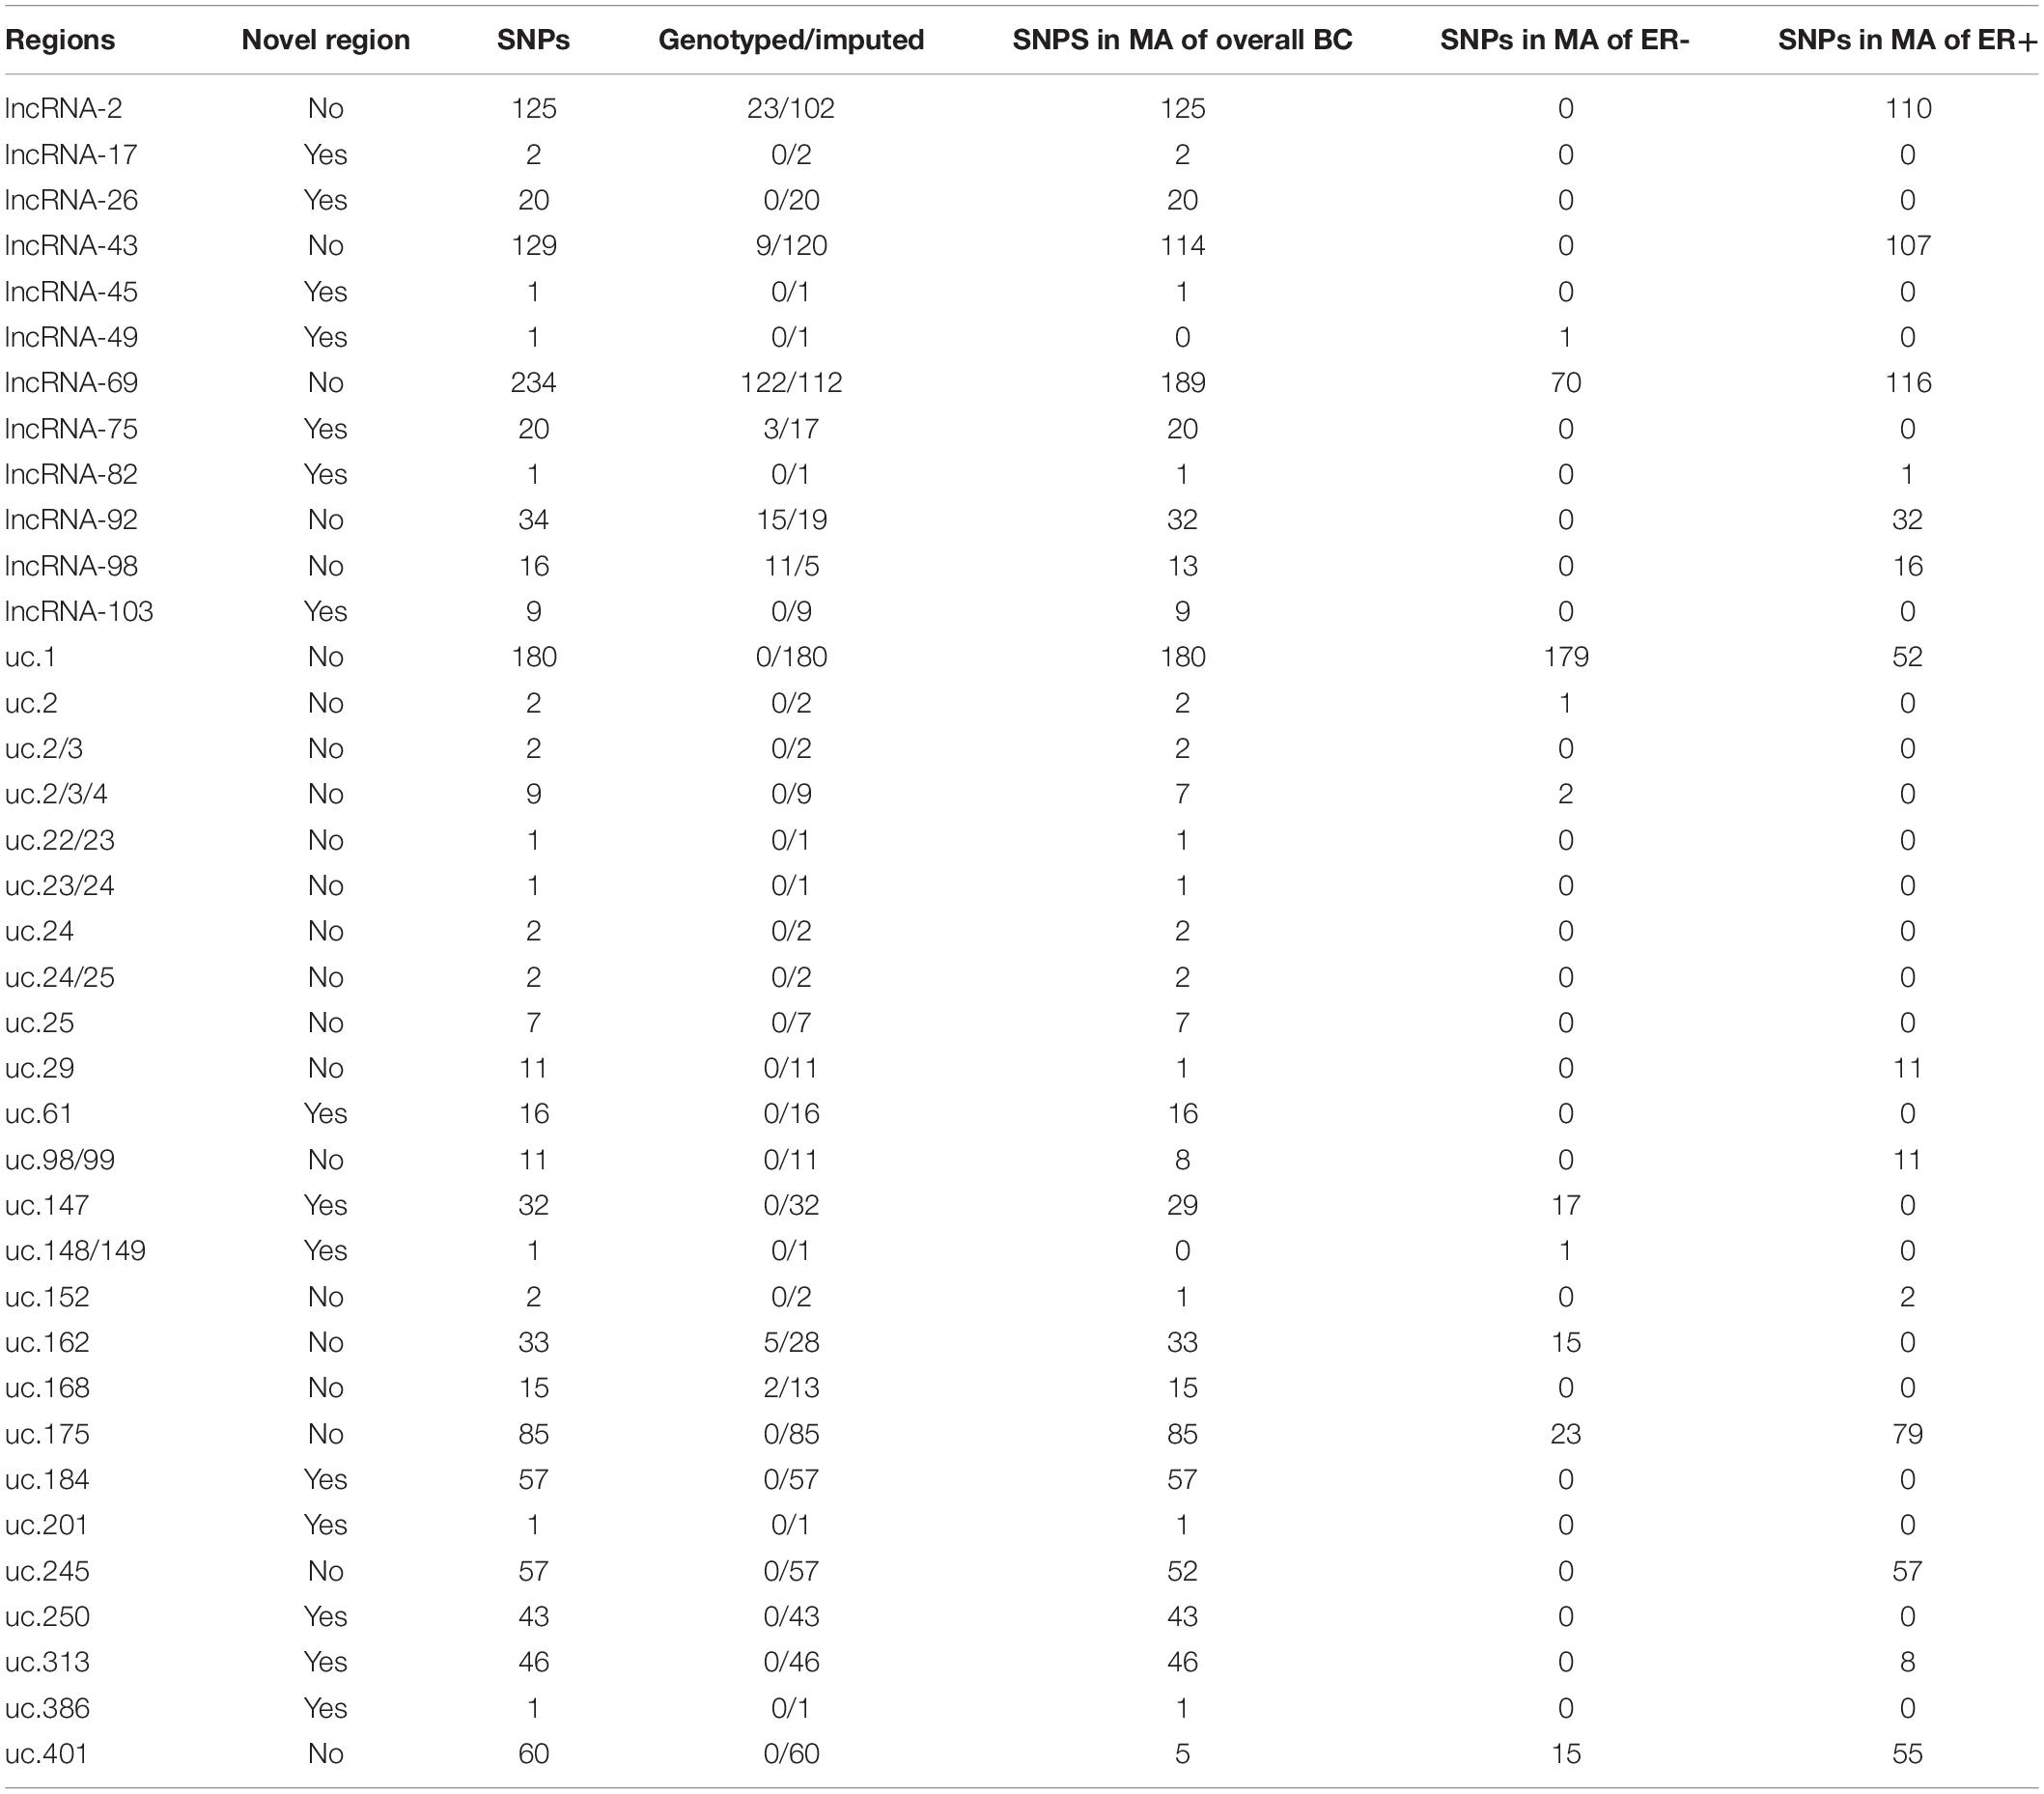
Table 3. Distribution of SNPs with p < 10–5 to regions. BC, breast cancer. MA, meta-analysis.
Integrated Expression Quantitative Trait and in silico Prediction of GWAS Targets (INQUISIT) Predicts Target Genes for 60 SNPs in Two lncRNAs and Four T-UCRs
A heuristic scoring system, INQUISIT (Michailidou et al., 2017), was used to calculate the potential target genes for the 251 SNPs that were associated with breast cancer risk in BCAC analysis (Supplementary Table S6).
For 60 of the 251 SNPs, INQUISIT predicted one or more target genes (Supplementary Table S7). There were 12 genes predicted as targets altogether and each gene had 1-17 SNPs predicting it. The SNPs resided on two lncRNAs regions and on four T-UCRs; the number of SNPs per region ranged from 1-22. The predominant method of prediction was chromatin interaction analysis by paired-end tag sequencing (ChIA-PET) in MCF7. All these SNPs had association (p < 10–5) with overall breast cancer, with FDR <0.005. Four SNPs in uc.313 were also associated with ER-positive breast cancer. It is to be noted that MCF7 is a breast cancer cell line which may cause alteration in its cellular processes and may affect these results.
Overall, the INQUISIT-predicted target genes of the SNPs were not the lncRNA or T-UCR of the SNPs region, but mostly protein-coding genes. The only exception to this was GABPB1-AS1, the subject of the lncRNA-75 region and targeted by three lncRNA-75 SNPs in INQUISIT predictions. Three T-UCRs were located within the gene that the SNPs in their regions targeted by INQUISIT: uc.147 in the intron of LRBA, uc.184 in the 3′UTR of CPEB4 and uc.313 in the intron of TIAL1.
We searched for genes that, in addition to being INQUISIT target genes, show eQTL associations as well (see below). There were three such genes in our data: GABPB1-AS1 (GTEx eQTL analysis), CPEB4 and TIAL1 (METABRIC eQTL analysis) (Table 4). Only in a few cases, the SNP targeting a gene in INQUISIT predictions was the same SNP that associates to the gene in eQTL (Table 5). However, the majority of these SNPs are linked.
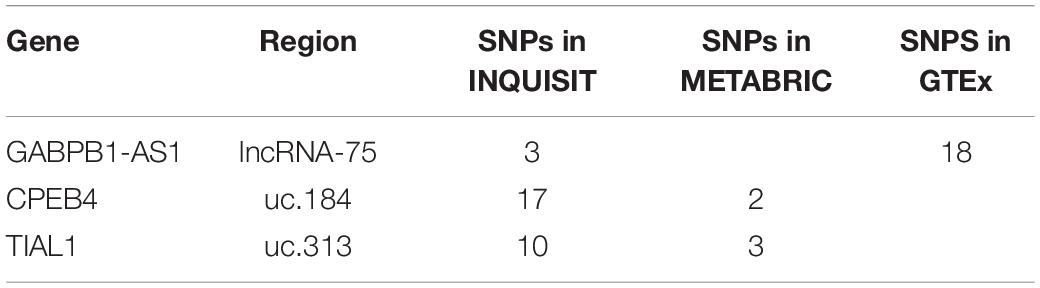
Table 4. Genes that are both INQUISIT predicted target genes and have eQTL associations.
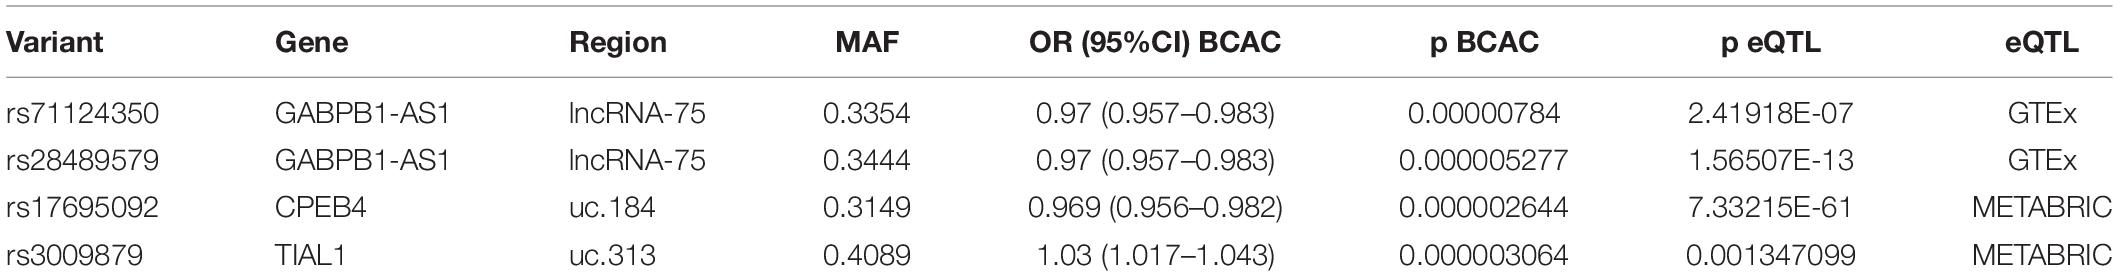
Table 5. SNPs that both have INQUISIT predicted target genes and have eQTL associations.
Three SNPs targeted GABPB1-AS1 of lncRNA-75 region (rs1806845, rs71124350, and rs28489579) (Table 6). All three clustered together approximately 31 kb downstream of the lncRNAs. These SNPs also have additional predicted targets, rs1806845 and rs71124350 target also SLC27A2 and GABPB1 and rs28489579 targets GABPB1 as well. However, none of these other predicted targets show association with p < 0.05 in the eQTL analyses.
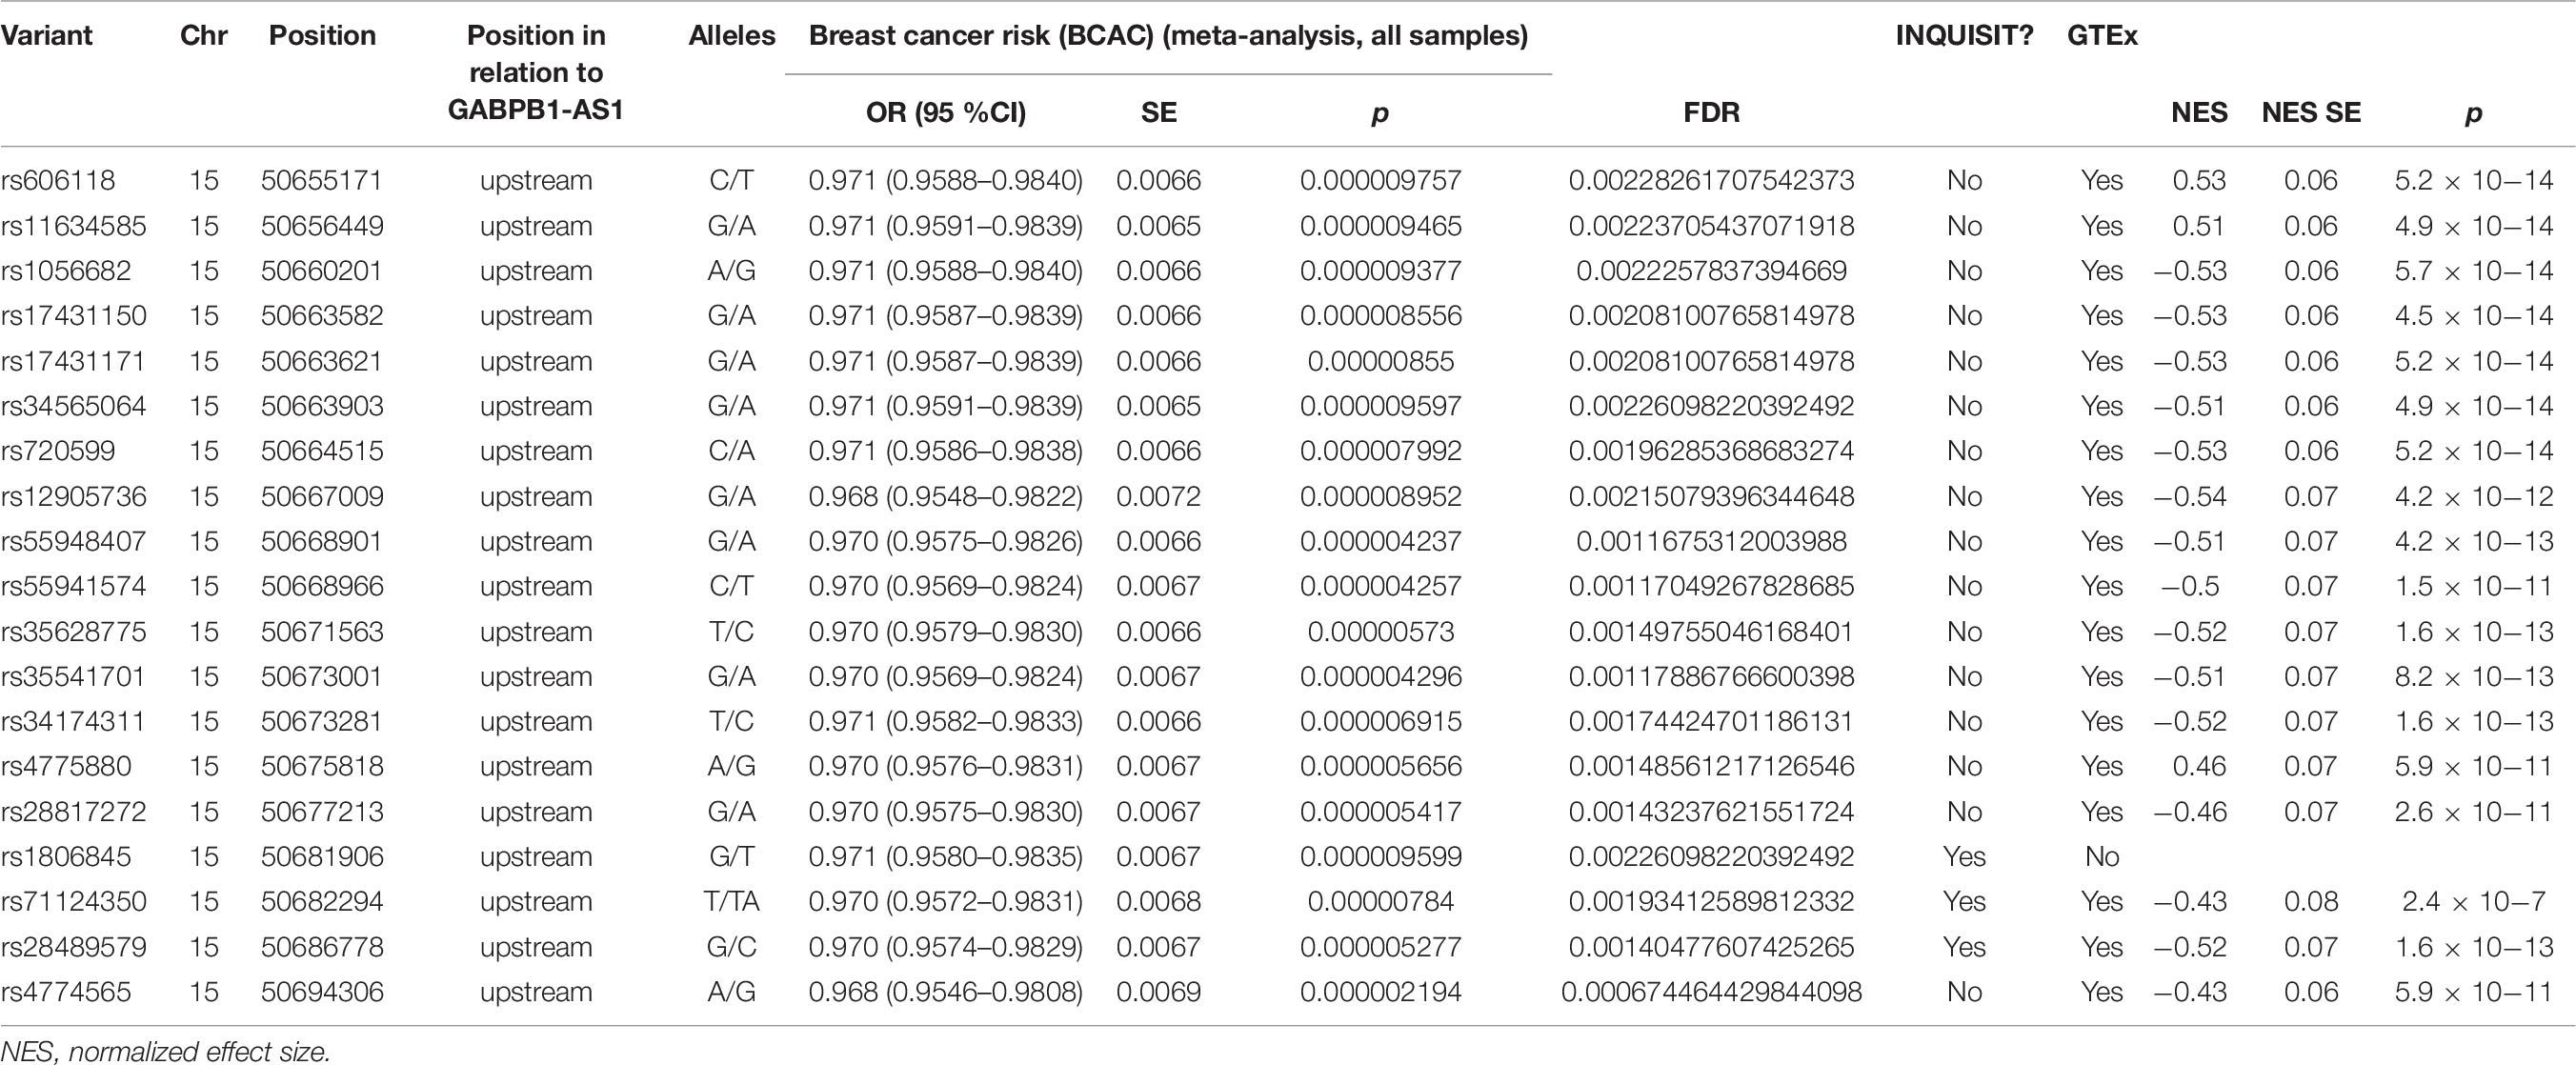
Table 6. Variants with GABPB1-AS1 as INQUISIT predicted target gene and/or GTEx eQTL association.
CPEB4 was the predicted target of seventeen SNPs in the uc.184 region (Table 7). The majority of the SNPs as well as uc.184 itself are located in the 3′UTR of the CPEB4. None of the SNPS overlap with uc.184. Two SNPs targeting CPEB4 also had other predicted targets, C5orf47 (rs17695092) and NGS2 (rs55946741).
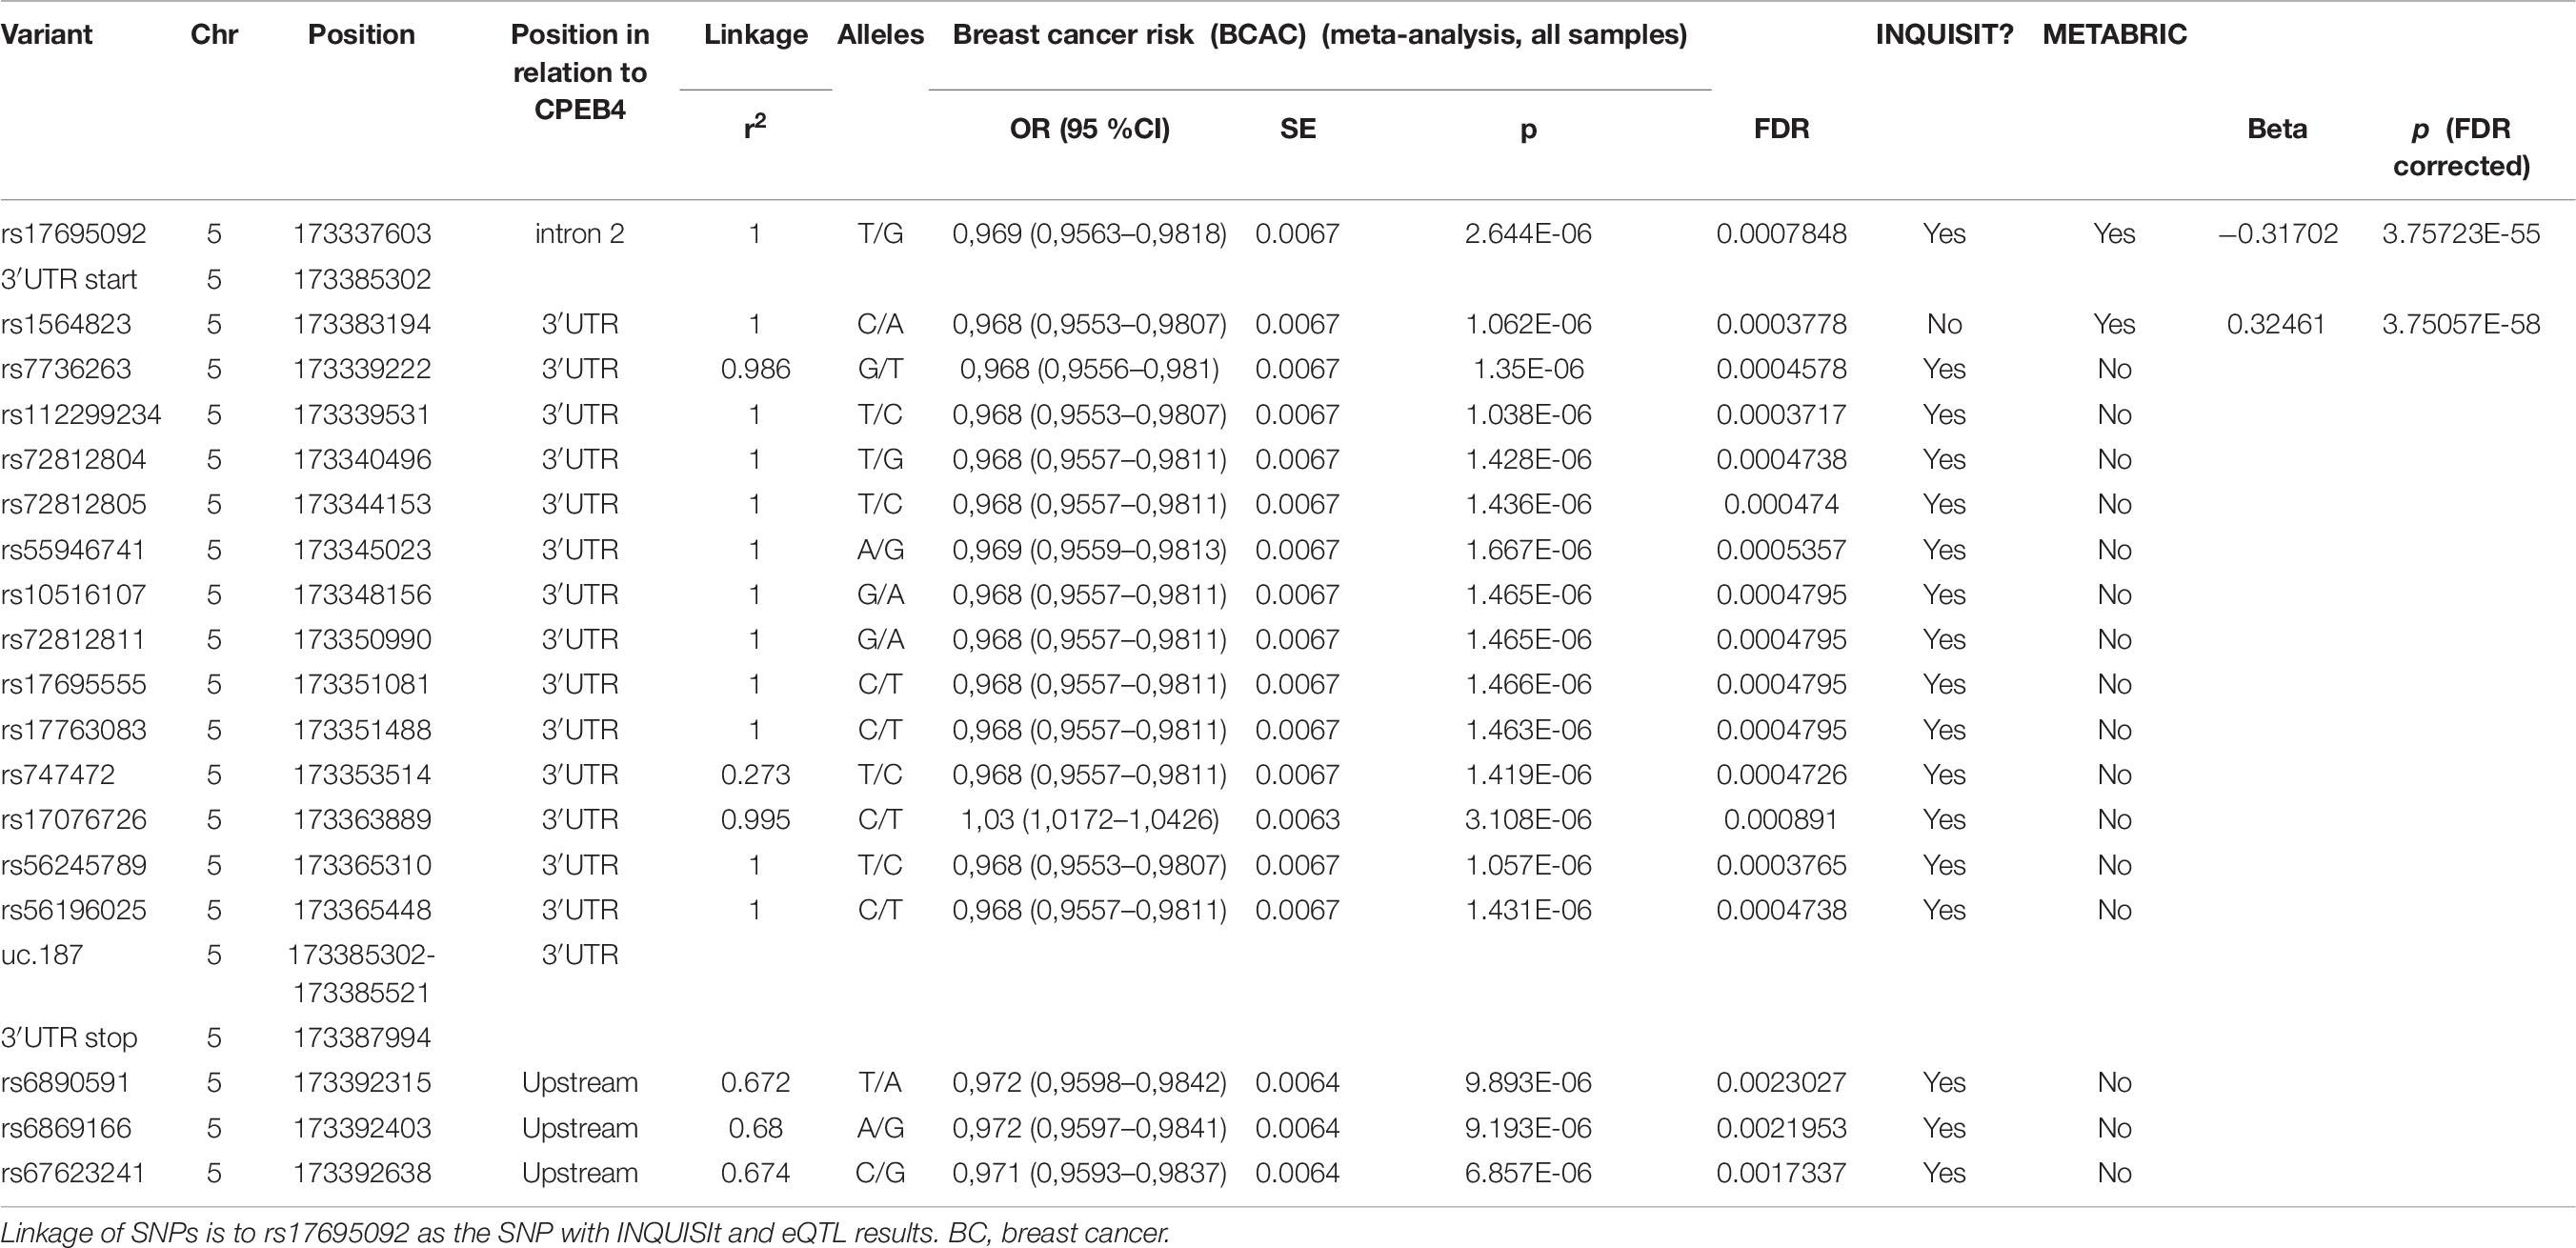
Table 7. Variants with CPEB4 as INQUISIT predicted target gene and/or METABRIC eQTL association.
TIAL1 was targeted by ten SNPs (Table 8). The target T-UCR, uc.313, overlaps none of the SNPs. Three SNPs also target RGS10 (rs2917941, rs3009877, rs75611822).
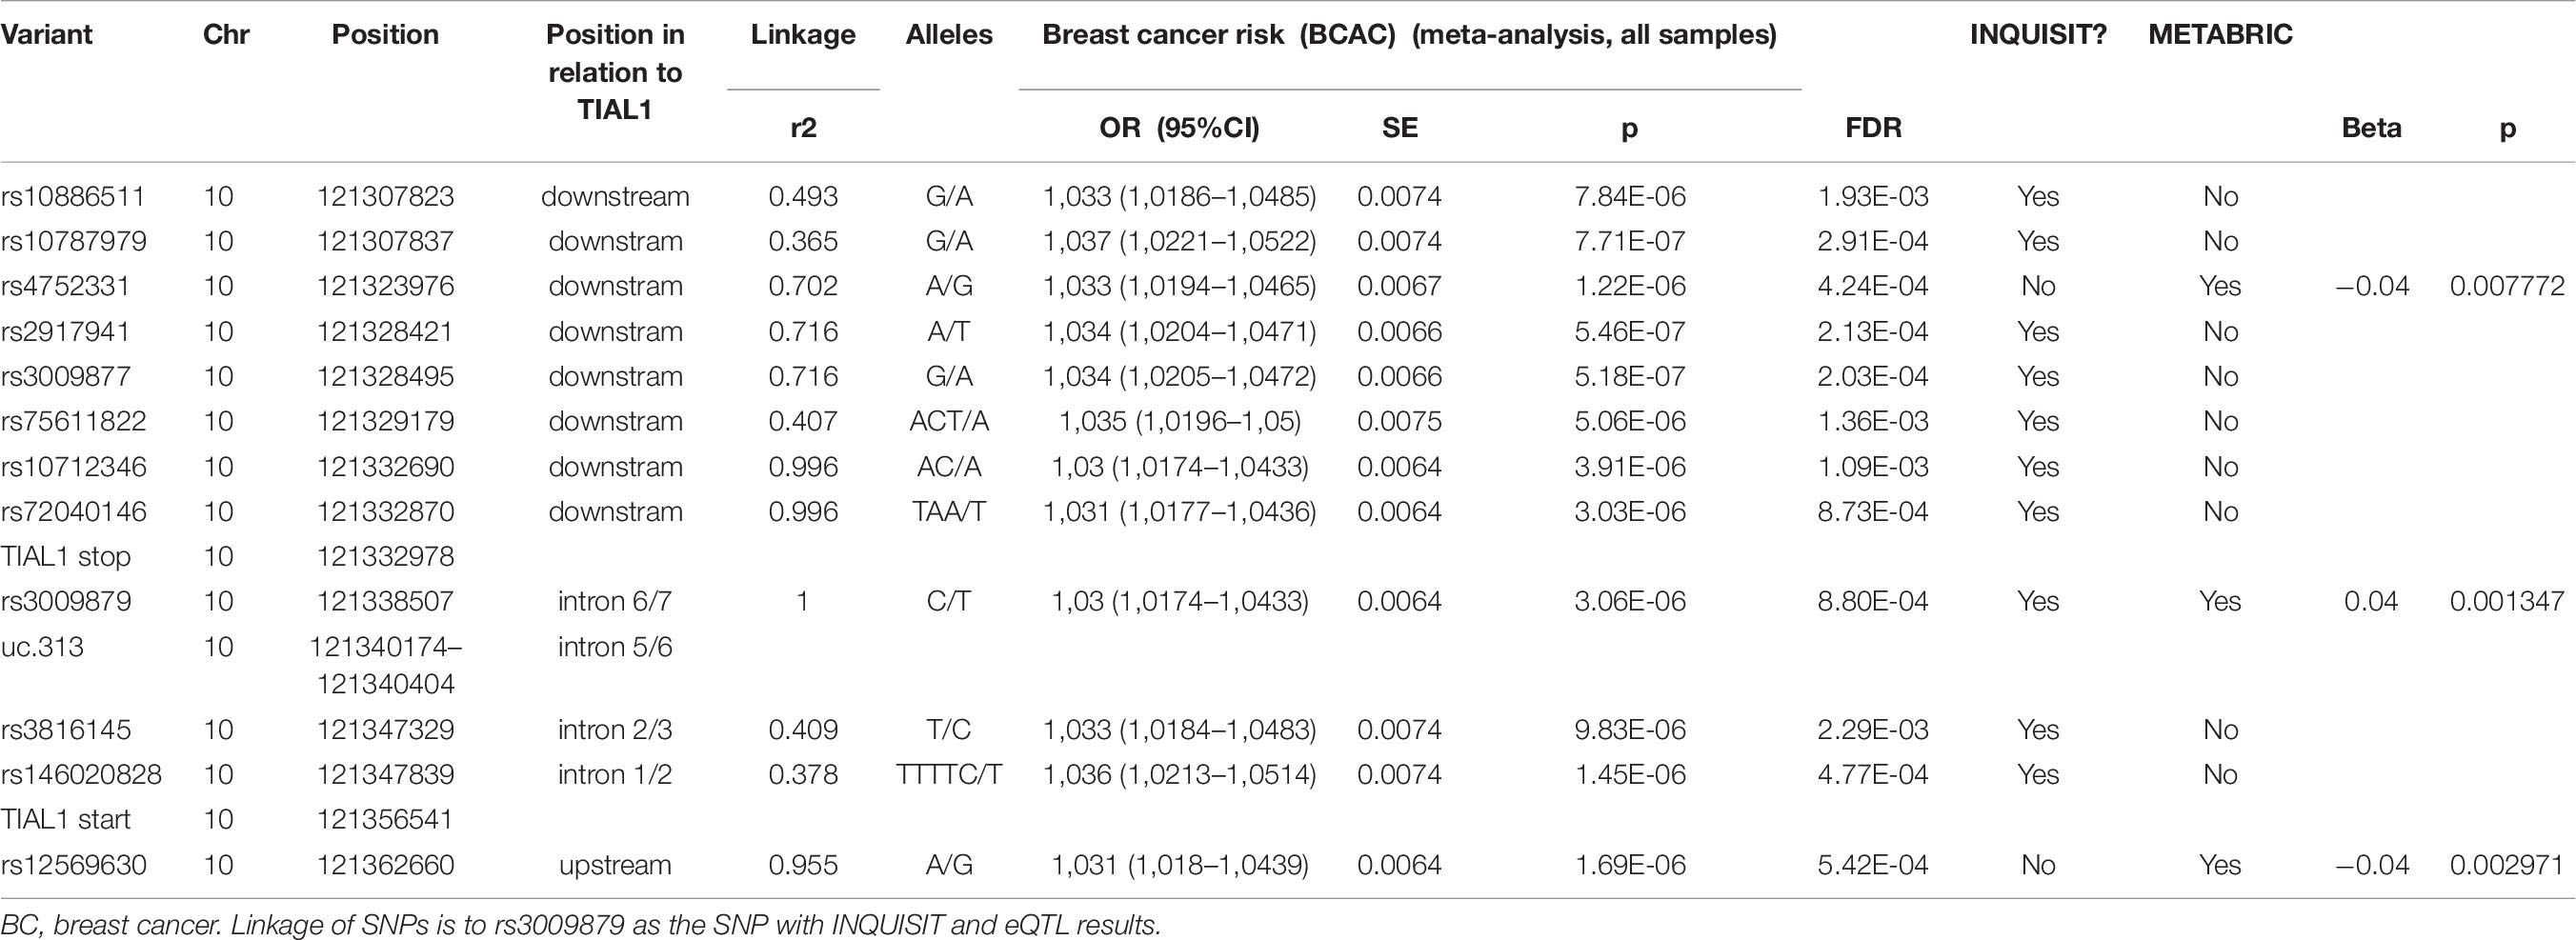
Table 8. Variants with TIAL1 as INQUISIT predicted target gene and/or METABRIC eQTL association.
Two SNPs Targeting GABPB1-AS1 in INQUISIT Also Associate With It in eQTL Analysis of GTEx Dataset
GTEx eQTL association in normal mammary tissue with the limit of p < 0.05 was found for 171 of the 251 SNPs in this study (Supplementary Table S8). All in all, the SNPs had 318 associations with 22 genes. The SNPs were found on seven lncRNA and five T-UCR regions (Supplementary Table S9). Each SNP showed association to 1–4 genes and each gene to 1–48 SNPs. Only one gene, GABPB1-AS1, which was targeted in INQUISIT predictions, also had SNP association in GTEx analysis. GABPB1-AS1 was also the only SNP associated gene that was also the target of a region of interest, lncRNA-75.
GABPB1-AS1 expression associated with 18 SNPs in lncRNA-75 with p-values ranging from 2.45 × 10⁻⁷ to 4.47 × 10⁻¹⁴, and FDR corrected p-values all below 0.05 (Table 6). Curiously, all 36 associations in GTEx data with FDR corrected p < 0.05 involved SNPs located in lncRNA-75, and besides GABPB1-AS1, included only lincRNA AC022087.1 which lies downstream of GABPB1-AS1 in reverse orientation. Two SNPs of the 18 that associate with GBPB1-AS1 in GTEx also target GABPB1-AS1 in the INQUISIT analysis: rs71124350 (p = 2.7 × 10⁻⁷, normalized effect size [NES] = −0.43) and rs28489579 (p = 1.6 × 10⁻¹³, NES = −0.52). The two SNPs are linked with r2 = 0.8996. All SNPs that show association with GABPB1-AS1 expression are downstream of the gene starting from approximately 4.7kb. Rs71124350 lies 31kb and rs28489579 36kb from the gene.
CPEB4 and TIAL1 Associate With SNPs Targeting Them in INQUISIT in eQTL Analysis of METABRIC Dataset
Of the 251 SNPs in this study, 20 had eQTL associations with the limit p < 0.05 in METABRIC (Supplementary Table S10). These SNPs were spread on three lncRNA regions and five T-UCRs (Supplementary Table S9). Even though the vast majority of the found associations were in cis, the specific lncRNAs or T-UCRs of the regions of interest were not associated with any of the SNPs. Altogether, the SNPs had 10322 associations ranging from 352 to 1151 associations per SNP. These associations contain 5858 genomic elements, including genes, pseudogenes, and expressed sequence tags. Each genetic element was associated with 1-17 SNPs. We focused on SNP and region associations with genes that were also INQUISIT-predicted target genes. There were two such genes, CPEB4 and TIAL1.
Two SNPs, rs17695092 and rs1564823 in region uc.184, associated strongly in cis with CPEB4, p = 7.33 × 10–61 (after FDR correction 3.76 × 10–55) and p = 3.66 × 10–64 (after FDR correction 3.75 × 10–58) with beta coefficients of −0.317 and 0.324, respectively (Table 7). These SNPs have the lowest p-values of the METABRIC analysis and they are in strong linkage disequilibrium (r2 = 1.000). Both rs17695092 and rs1564823 as well as the T-UCR uc.184 are located within CPEB4 gene: rs17695092 lies in the intron 2, while rs1564823 and uc.184 are situated in the 3′UTR of the gene.
Three SNPS, rs4752331, rs3009879, and rs12569630 in uc.313, associated in cis with TIAL1 in METABRIC (Table 8). Only rs3009879 was predicted to target TIAL1 by INQUISIT. The three SNPs are linked as r2 between rs3009879 and rs4752331 is 0.681, and between rs3009879 and rs12569630 r2 = 0.967. Rs3009879 is intronic, located in the TIAL1, while rs4752331 and rs12569630 are located 7.3 kb downstream and 6.1 kb upstream of the TIAL1, respectively. However, while the p-values range from 0.0013 to 0.0078, none survives FDR correction (all FDR corrected are p-values >0.9). The beta coefficient for rs4752331 and rs12569630 variants is 0.04, and for rs3009879 – 0.04.
ncRNA eQTL Database Validates GABPB1-AS1 eQTL Association
To validate the GABPB1-AS1 results from the GTEx eQTL analysis, we looked for other eQTL resources. Non-coding RNA eQTL database ncRNA eQTL was queried with the GABPB1-AS1 GTEx eQTL results. The data base did not include the SNPs rs71124350 and rs28489579. However, SNPs in strong linkage disequilibrium with these SNPs of interest (r2 = 0.822 and 0.883, respectively) were found in the ncRNA eQTL database, and their results support the GTEx eQTL results: SNP rs35831049 linked to the SNP of interest rs71124350 (r2 = 0.822) was associated with GABPB1-AS1 with effect r = −0.35 (rs71124350 normalized effect size [NES] = −0.43) and p = 9.29e-32, and SNP rs34565064 linked to rs28489579 (r2 = 0.883) was associated with GABPB1-AS1 with effect r = −0.35 (rs28489579 NES = −0.52 and p = 5.45e-32).
Discussion
In this study, we looked into the connection between lncRNAs and T-UCRs and breast cancer risk. The connection was investigated by identifying putative breast cancer risk SNPs in BCAC data located in or near lncRNAs and T-UCRs, assessing the SNPs’ functional effects using heuristic scoring method INQUISIT that predicts target genes for risk SNPs by combining genomic information from multiple sources, and performing eQTL analysis. These analysis methods are especially suitable for gaining insight into the role of SNPs located in the areas flanking the lncRNAs and T-UCRs and not directly affecting their sequence. All the SNPS found in this study to be associated with breast cancer were flanking SNPSs.
Of the 1303 breast cancer risk associated SNPs in 12 lncRNA-and 26 T-UCR loci in the study, 251 were in loci not previously reported by BCAC (7 lncRNA and 8 T-UCR), and for 60 of these in two lncRNA regions and 4 T-UCR, INQUISIT predicted a target gene. For three of these genes, also an eQTL association was found in METABRIC or GTEx eQTL analysis (Table 4). INQUISIT analysis predicted GABPB1-AS1 as the target for two SNPs, rs71124350, and rs28489579, and the same SNP-gene association was seen in GTEx eQTL analysis of normal mammary tissue (Table 5). Results of a query to the ncRNA eQTL database support the eQTL association of GABPB1-AS1, and SNPS rs71124350 and rs28489579, although the database did not include these specific SNPs but others in strong linkage disequilibrium with them. In eQTL analysis of METABRIC breast cancer tissue data, CPEB4 was found to be associated with SNP rs17695092, and the same SNP had CPEB4 also as an INQUISIT target gene. Similarly, rs3008979 and TIAL1 had METABRIC association and were a SNP-predicted target gene pair, although the p-values for TIAL1 eQTL association did not survive FDR correction. In addition to these loci with functional data available, other candidate regions were identified containing SNPs with the defined p-value and highly significant FDR for breast cancer risk association (Supplementary Table S5).
The two GABPB1-AS1 targeting SNPs, rs71124350 and rs28489579, are linked (r2 = 0.8996) and located near each other. According to a database of human enhancers, between the two SNPs lies a GABPB1-AS1 enhancer site (GeneHancer ID GH15I050390). This site is not a direct enhancer of GABPB1, and concordantly rs71124350 and rs28489579 do not have an eQTL association with GABPB1. As the minor alleles of both rs71124350 and rs28489579 are also associated with a small decrease in breast cancer risk (Table 6), these findings suggest that the decrease in GABPB1-AS1 expression associates with decreased breast cancer risk.
GABPB1-AS1 is an lncRNA located in 15q21.2, partially overlapping GABPB1 read from the opposite stand. There are reports of non-coding RNAs and the protein-coding genes they overlap displaying coordinated expression and function, which can be synergistic or antagonistic (39, 40). Commonly, the role of antisense RNAs is to bind the sense-oriented mRNA, and thus block its translation. There are no reports on how GABPB1-AS1 affects the expression of GABPB1, but they share common promotor/enhancer loci according to GeneHancer: of the 18 promoter/enhancer regions associated with GABPB1-AS1, nine were also associated with GABPB1. GABPB1 is a transcription factor and an activator of BRCA1 expression (Atlas et al., 2000). If we assume the antisense – sense relationship between GABPB1-AS1 and GABPB1 to be an antagonistic one, it would suggest that GABPB1-AS1 downregulates GABPB1, which in turn would lead to repression of BRCA1. This would be consistent with the results of this study: SNPs associated with reduced GABPB1-AS1 are also associated with reduced breast cancer risk, and this effect could be the result of the increased GABPB1 expression leading to increased BRCA1 expression. However, GABPB1-AS1 was selected for this study based on positive correlation between GABPB1-AS1 and BRCA1 expression. It is possible that the regulatory relationships are more complex than seen here, and the correlation between overall expression levels may not imply causation. Further research is required to clarify the functional interactions between these genes, as at this point, we can only speculate on the functional role of GABPB1-AS1in breast cancer predisposition.
For the other two discovered loci, the regions were included as T-UCR harboring loci but the discovered risk SNPs were associated in eQTL and INQUISIT analyses with protein coding genes: rs17695092 in uc.184 with CPEB4, and rs3009879 in uc.313 with TIAL1. Uc.184 and uc.313 are located in CPEB4 and TIAL1, respectively. However, T-UCR expression is challenging to study, as they do not appear in expression databases. This is at least partly due to the difficulty in separating intragenic T-UCR expression from the expression of its host gene. Mestdagh et al. (2010) found uc.184 expression to be inseparable from CPEB4 expression, while uc.313 expression was found to be independent of TIAL1 expression. However, Mestdagh et al. looked at the expressions in neuroblastoma and the situation in breast tissue is unknown. Nevertheless, uc.187 and uc.313 are likely to play a substantial role in the correct function of their host genes, as such conservation is unlikely to remain intact by chance. Uc.184 and uc.313 are located in the 3′UTR and in an intron, respectively, and alterations in these regions often have a major regulatory effect on the function of a gene (Li and Yuan, 2017; Park et al., 2018). The fidelity of these regions may be essential to the correct function of the CPEB4 and TIAL1.
The 3′UTR of the CPEB4 contains 13 of the 17 SNPs that target CPEB4 in INQUISIT prediction and one of the two SNPs with CPEB4 expression association in METABRIC. T-UCR uc.184 is also located there. CPEB4 is a member of a CPEB family of proteins that bind RNA in a sequence-specific manner, contain two RNA recognition motifs, two zinc fingers and a regulatory N-terminal region (Hake and Richter, 1994; Fernandez-Miranda and Mendez, 2012). CPEBs regulate translation by controlling the polyadenylation of their target genes (Mendez and Richter, 2001; Richter, 2007). There are no previous reports of CPEB4 affecting breast cancer risk, but overexpression of CPEB4 is reported in breast cancer, and the overall survival of patients with high expression of CPEB4 is shorter (Sun et al., 2015; Lu et al., 2017). Ectopic CPEB4 expression has been suggested to promote EMT, migration and invasion of breast cancer cells, while silencing the expression of CPEB4 reduces these events (Lu et al., 2017). Our results imply that CPEB4 may also play a role in the breast cancer development as the intronic SNP rs17695092 associates with both reduced CPEB4 expression, and reduced breast cancer risk (Table 7). It is to be noted that the METABRIC dataset consists of breast cancer samples, and the effect is not seen in the eQTL analysis in the GTEx dataset of normal mammary tissue samples. The difference could be due to difference in statistical power, as the METABRIC dataset includes over 1300 breast cancer samples, whereas the GTEx dataset is 251 normal breast cancer tissues. It is notable that the cell line used in the CHiA-PET analysis from which the INQUISIT results for rs17695092 were gathered was MCF7, which is a breast cancer cell line. This requires further research, as does the role of the uc.184 in the 3′UTR of the CPEB4.
Uc.313 is located in the intron 5 or 6 of the TIAL1, depending on the transcript (and in a single transcript, NM_001323964.1, out of the eleven UCSC annotations of the RefSeq RNAs, it partially overlaps exon six). Of the twelve SNPs that target TIAL1 in INQUISIT prediction, or as METABRIC association, the majority are located downstream of the gene, three are in the TIAL1, all intronic, and one is located upstream of the gene (Table 8). The SNP with TIAL1 as both INQUISIT target and METABRIC association, rs3009879, is one of the three intronic variants. Rs3009879 does not appear to overlap any regulatory sequence elements (assessed by using Ensembl genome browser 92 and GeneHancer in GeneCards), but as it does target TIAL1 in INQUISIT, a connection discovered by the CHiA-PET method, it suggests involvement in a chromatin interaction. It is worth noting that in METABRIC eQTL analysis, the significance of rs3009879 association withTIAL1 expression was p = 0.0013, but it did not survive FDR correction. Thus, it is also possible that the eQTL association of this variant withTIAL1 is an artefact.
TIAL1 (also known as TIAR), is a ubiquitously expressed RNA binding protein that contains three N-terminal RNA recognition motifs and a C-terminal glutamine-rich prion-like domain, which is found to aggregate during the formation of cytoplasmic stress granules (Dember et al., 1996; Gilks et al., 2004; Kim et al., 2013). TIAL1 is a negative regulator of BRCA1: it is shown to block translation, and at least in chronic myeloid leukemia cells, reduce the protein expression of BRCA1 which leads to aneuploidy, spindle toxin resistance, and genomic instability (Deutsch et al., 2003; Wolanin et al., 2010; Podszywalow-Bartnicka et al., 2014). If TIAL1 has the same effect on BRCA1 protein expression in breast cancer, it is plausible that SNPs that increase TIAL1 expression also increase breast cancer risk, as is the case with rs3009879 (Supplementary Table S9).
Previously, SNPs with genome-wide significant associations (p < 5 × 10⁻⁸) with breast cancer risk have been reported in several genomic regions containing lncRNAs (Michailidou et al., 2017; Milne et al., 2017). In this study, we aimed to identify additional candidate loci for further studies. We report here putative breast cancer risk SNPs predicted to functionally target GABPB1-AS1 lncRNA, and associating with its expression, as well as SNPs in two genes, CPEB4 and TIAL1, hosting ultraconserved regions, uc.184 and uc.313, respectively. Further research is needed to validate these findings and candidate genes, and elucidate the functional mechanisms involved. In addition, other regions containing SNPs with the defined p-value and highly significant FDR for breast cancer risk association, but currently lacking the functional data, may warrant further studies.
Data Availability Statement
The analyses were based on summary results of the Breast Cancer Association Consortium (BCAC), available online at: http://bcac.ccge.medschl.cam.ac.uk/.
Ethics Statement
All participating BCAC studies were approved by their appropriate institutional ethics review boards for the initial BCAC study. This study uses only publicly available BCAC-summary data, no individual data.
Author Contributions
SK and HN designed the study. MS and SK carried out the data and eQTL analyses, wrote the main manuscript text and prepared the figures and the tables. CB provided clinical expertise and critically reviewed the manuscript. JB and GC-T provided the INQUISIT analysis. All authors contributed to and approved the final manuscript.
Conflict of Interest
The authors declare that the research was conducted in the absence of any commercial or financial relationships that could be construed as a potential conflict of interest.
Funding
The Helsinki Study was funded by the Helsinki University Hospital Research Funding, the Sigrid Jusélius Foundation, and the Cancer Foundation Finland. GC-T and JB were supported by the funding of the National Health and Medical Research Council. BCAC is funded by Cancer Research United Kingdom (C1287/A16563 and C1287/A10118), the European Union’s Horizon 2020 Research and Innovation Programme (grant numbers 634935 and 633784 for BRIDGES and B-CAST, respectively), and by the European Community’s Seventh Framework Programme under grant agreement number 223175 (grant number HEALTH-F2-2009-223175) (COGS). The EU Horizon 2020 Research and Innovation Programme funding source had no role in study design, data collection, data analysis, data interpretation or writing of the report. Genotyping of the OncoArray was funded by the NIH Grant U19 CA148065, and Cancer United Kingdom Grant C1287/A16563, and the PERSPECTIVE project supported by the Government of Canada through Genome Canada and the Canadian Institutes of Health Research (grant GPH-129344) and the Ministère de l’Économie, Science et Innovation du Québec through Génome Québec and the PSRSIIRI-701 grant, and the Quebec Breast Cancer Foundation. Funding for the iCOGS infrastructure came from: the European Community’s Seventh Framework Programme under grant agreement n° 223175 (HEALTH-F2-2009-223175) (COGS), Cancer Research United Kingdom (C1287/A10118, C1287/A10710, C12292/A11174, C1281/A12014, C5047/A8384, C5047/A15007, C5047/A10692, and C8197/A16565), the National Institutes of Health (CA128978) and Post-Cancer GWAS initiative (1U19 CA148537, 1U19 CA148065, and 1U19 CA148112 – the GAME-ON initiative), the Department of Defense (W81XWH-10-1-0341), the Canadian Institutes of Health Research (CIHR) for the CIHR Team in Familial Risks of Breast Cancer, and the Susan G. Komen Foundation for the Cure, the Breast Cancer Research Foundation, and the Ovarian Cancer Research Fund. The DRIVE Consortium was funded by U19 CA148065. Combining the GWAS data was supported in part by the National Institutes of Health (NIH) Cancer Post-Cancer GWAS initiative grant no. 1 U19 CA 148065 (DRIVE, part of the GAME-ON initiative).
Acknowledgments
We thank Joe Dennis for the technical assistance with the BCAC data retrieval, Dr. Kristiina Aittomäki and research nurse Outi Malkavaara for the help with the Helsinki patient data, Taru Muranen for text editing and bioinformatical assistance, and Liisa Pelttari for assistance in data analysis.
Supplementary Material
The Supplementary Material for this article can be found online at: https://www.frontiersin.org/articles/10.3389/fgene.2020.00550/full#supplementary-material
Footnotes
- ^ http://bcac.ccge.medschl.cam.ac.uk/
- ^ https://www.gtexportal.org/home/
- ^ https://ega-archive.org/
- ^ http://ibi.hzau.edu.cn/ncRNA-eQTL/
- ^ http://bcac.ccge.medschl.cam.ac.uk/
- ^ http://www.R-project.org/
- ^ www.genecards.org
- ^ https://genome.ucsc.edu/
- ^ http://www.ensembl.org
References
Amaral, P. P., Clark, M. B., Gascoigne, D. K., Dinger, M. E., and Mattick, J. S. (2011). lncRNAdb: a reference database for long noncoding RNAs. Nucleic Acids Res. 39, D146–D151.
Amos, C. I., Dennis, J., Wang, Z., Byun, J., Schumacher, F. R., Gayther, S. A., et al. (2017). The oncoarray consortium: a network for understanding the genetic architecture of common cancers. Cancer Epidemiol. Biomarkers Prev. 261, 126–135.
Atlas, E., Stramwasser, M., Whiskin, K., and Mueller, C. R. (2000). GA-binding protein alpha/beta is a critical regulator of the BRCA1 promoter. Oncogene 1915, 1933–1940. doi: 10.1038/sj.onc.1203516
Bejerano, G., Pheasant, M., Makunin, I., Stephen, S., Kent, W. J., Mattick, J. S., et al. (2004). Ultraconserved elements in the human genome. Science 304, 1321–1325. doi: 10.1126/science.1098119
Calin, G. A., Liu, C. G., Ferracin, M., Hyslop, T., Spizzo, R., Sevignani, C., et al. (2007). Ultraconserved regions encoding ncRNAs are altered in human leukemias and carcinomas. Cancer Cell 123, 215–229. doi: 10.1016/j.ccr.2007.07.027
Chen, G., Wang, Z., Wang, D., Qiu, C., Liu, M., Chen, X., et al. (2013). LncRNADisease: a database for long-non-coding RNA-associated diseases. Nucleic Acids Res. 41, D983–D986.
Collaborative Group on Hormonal Factors in Breast Cancer (2001). Familial breast cancer: collaborative reanalysis of individual data from 52 epidemiological studies including 58,209 women with breast cancer and 101,986 women without the disease. Lancet 358, 1389–1399. doi: 10.1016/s0140-6736(01)06524-2
Cui, P., Zhao, Y., Chu, X., He, N., Zheng, H., Han, J., et al. (2018). SNP rs2071095 in LincRNA H19 is associated with breast cancer risk. Breast Cancer Res. Treat. 171, 161–171. doi: 10.1007/s10549-018-4814-y
Curtis, C., Shah, S. P., Chin, S. F., Turashvili, G., Rueda, O. M., Dunning, M. J., et al. (2012). The genomic and transcriptomic architecture of 2,000 breast tumours reveals novel subgroups. Nature 486, 346–352. doi: 10.1038/nature10983
Dember, L. M., Kim, N. D., Liu, K. Q., and Anderson, P. (1996). Individual RNA recognition motifs of TIA-1 and TIAR have different RNA binding specificities. J. Biol. Chem. 271, 2783–2788. doi: 10.1074/jbc.271.5.2783
Dermitzakis, E. T., Reymond, A., and Antonarakis, S. E. (2005). Conserved non-genic sequences - an unexpected feature of mammalian genomes. Nat. Rev. Genet. 62, 151–157. doi: 10.1038/nrg1527
Derrien, T., Johnson, R., Bussotti, G., Tanzer, A., Djebali, S., Tilgner, H., et al. (2012). The GENCODE v7 catalog of human long noncoding RNAs: analysis of their gene structure, evolution, and expression. Genome Res. 22, 1775–1789. doi: 10.1101/gr.132159.111
Deutsch, E., Jarrousse, S., Buet, D., Dugray, A., Bonnet, M. L., Vozenin-Brotons, M. C., et al. (2003). Down-regulation of BRCA1 in BCR-ABL-expressing hematopoietic cells. Blood 101, 4583–4588. doi: 10.1182/blood-2002-10-3011
Eeles, R. A., Kote-Jarai, Z., Al Olama, A. A., Giles, G. G., Guy, M., Severi, G., et al. (2009). Identification of seven new prostate cancer susceptibility loci through a genome-wide association study. Nat. Genet. 41, 1116–1121.
Fabris, L., and Calin, G. A. (2017). Understanding the genomic ultraconservations: T-UCRs and Cancer. Int. Rev. Cell. Mol. Biol. 333, 159–172. doi: 10.1016/bs.ircmb.2017.04.004
Fernandez-Miranda, G., and Mendez, R. (2012). The CPEB-family of proteins, translational control in senescence and cancer. Ageing Res. Rev. 114, 460–472. doi: 10.1016/j.arr.2012.03.004
Fishilevich, S., Nudel, R., Rappaport, N., Hadar, R., Plaschkes, I., Iny Stein, T., et al. (2017). GeneHancer: genome-wide integration of enhancers and target genes in GeneCards. Database 2017:bax028. doi: 10.1093/database/bax028
Ghoussaini, M., Pharoah, P. D. P., and Easton, D. F. (2013). Inherited genetic susceptibility to breast cancer: the beginning of the end or the end of the beginning? Am. J. Pathol. 183, 1038–1051.
Gibb, E. A., Vucic, E. A., Enfield, K. S., Stewart, G. L., Lonergan, K. M., Kennett, J. Y., et al. (2011). Human cancer long non-coding RNA transcriptomes. PLoS One 6:e25915. doi: 10.1371/journal.pone.0025915
Gilks, N., Kedersha, N., Ayodele, M., Shen, L., Stoecklin, G., Dember, L. M., et al. (2004). Stress granule assembly is mediated by prion-like aggregation of TIA-1. Mol. Biol. Cell 15, 5383–5398. doi: 10.1091/mbc.e04-08-0715
Goldgar, D. E., Easton, D. F., Cannon-Albright, L. A., and Skolnick, M. H. (1994). Systematic population-based assessment of cancer risk in first-degree relatives of cancer probands. J. Natl. Cancer Inst. 86, 1600–1608. doi: 10.1093/jnci/86.21.1600
Gupta, R. A., Shah, N., Wang, K. C., Kim, J., Horlings, H. M., Wong, D. J., et al. (2010). Long non-coding RNA HOTAIR reprograms chromatin state to promote cancer metastasis. Nature 464, 1071–1076. doi: 10.1038/nature08975
Guttman, M., Amit, I., Garber, M., French, C., Lin, M. F., Feldser, D., et al. (2009). Chromatin signature reveals over a thousand highly conserved large non-coding RNAs in mammals. Nature 458, 223–227. doi: 10.1038/nature07672
Hake, L. E., and Richter, J. D. (1994). CPEB is a specificity factor that mediates cytoplasmic polyadenylation during Xenopus oocyte maturation. Cell 79, 617–627. doi: 10.1016/0092-8674(94)90547-9
Hnisz, D., Abraham, B. J., Lee, T. I., Lau, A., Saint-Andre, V., Sigova, A. A., et al. (2013). Super-enhancers in the control of cell identity and disease. Cell 155, 934–947. doi: 10.1016/j.cell.2013.09.053
Howie, B., Fuchsberger, C., Stephens, M., Marchini, J., and Abecasis, G. R. (2012). Fast and accurate genotype imputation in genome-wide association studies through pre-phasing. Nat. Genet. 44, 955–959. doi: 10.1038/ng.2354
Howie, B. N., Donnelly, P., and Marchini, J. (2009). A flexible and accurate genotype imputation method for the next generation of genome-wide association studies. PLoS Genet. 5:e1000529. doi: 10.1371/journal.pone.01000529
Hung, C. L., Wang, L. Y., Yu, Y. L., Chen, H. W., Srivastava, S., Petrovics, G., et al. (2014). A long noncoding RNA connects c-Myc to tumor metabolism. Proc. Natl. Acad. Sci. U.S.A. 111, 18697–18702. doi: 10.1073/pnas.1415669112
Jamshidi, M., Fagerholm, R., Khan, S., Aittomaki, K., Czene, K., Darabi, H., et al. (2015). SNP-SNP interaction analysis of NF-kappaB signaling pathway on breast cancer survival. Oncotarget 6, 37979–37994.
Johnson, A. D., Handsaker, R. E., Pulit, S. L., Nizzari, M. M., O’Donnell, C. J., and de Bakker, P. I. (2008). SNAP: a web-based tool for identification and annotation of proxy SNPs using HapMap. Bioinformatics 24, 2938–2939. doi: 10.1093/bioinformatics/btn564
Kapranov, P., Cheng, J., Dike, S., Nix, D. A., Duttagupta, R., Willingham, A. T., et al. (2007). RNA maps reveal new RNA classes and a possible function for pervasive transcription. Science 316, 1484–1488. doi: 10.1126/science.1138341
Kent, W. J., Sugnet, C. W., Furey, T. S., Roskin, K. M., Pringle, T. H., Zahler, A. M., et al. (2002). The human genome browser at UCSC. Genome Res. 12, 996–1006. doi: 10.1101/gr.229102
Khan, S., Fagerholm, R., Rafiq, S., Tapper, W., Aittomaki, K., Liu, J., et al. (2015). Polymorphism at 19q13.41 predicts breast cancer survival specifically after endocrine therapy. Clin. Cancer Res. 2118, 4086–4096. doi: 10.1158/1078-0432.ccr-15-0296
Kim, H. S., Headey, S. J., Yoga, Y. M., Scanlon, M. J., Gorospe, M., Wilce, M. C., et al. (2013). Distinct binding properties of TIAR RRMs and linker region. RNA Biol. 104, 579–589. doi: 10.4161/rna.24341
Klinge, C. M. (2018). Non-Coding RNAs in breast cancer: intracellular and intercellular communication. Noncoding RNA 4:40. doi: 10.3390/ncrna4040040
Kretz, M., Siprashvili, Z., Chu, C., Webster, D. E., Zehnder, A., Qu, K., et al. (2013). Control of somatic tissue differentiation by the long non-coding RNA TINCR. Nature 493, 231–235. doi: 10.1038/nature11661
Li, J., Xue, Y., Amin, M. T., Yang, Y., Yang, J., Zhang, W., et al. (2019). ncRNA-eQTL: a database to systematically evaluate the effects of SNPs on non-coding RNA expression across cancer types. Nucleic Acids Res. 48, D956–D963.
Li, Y., Willer, C. J., Ding, J., Scheet, P., and Abecasis, G. R. (2010). MaCH: using sequence and genotype data to estimate haplotypes and unobserved genotypes. Genet. Epidemiol. 34, 816–834. doi: 10.1002/gepi.20533
Li, Y., and Yuan, Y. (2017). Alternative RNA splicing and gastric cancer. Mutat. Res. 773, 263–273. doi: 10.1016/j.mrrev.2016.07.011
Lichtenstein, P., Holm, N. V., Verkasalo, P. K., Iliadou, A., Kaprio, J., Koskenvuo, M., et al. (2000). Environmental and heritable factors in the causation of cancer–analyses of cohorts of twins from Sweden, Denmark, and Finland. Nat. Engl. J. Med. 343, 78–85. doi: 10.1056/nejm200007133430201
Lu, R., Zhou, Z., Yu, W., Xia, Y., and Zhi, X. (2017). CPEB4 promotes cell migration and invasion via upregulating Vimentin expression in breast cancer. Biochem. Biophys. Res. Commun. 489, 135–141. doi: 10.1016/j.bbrc.2017.05.112
Machiela, M. J., and Chanock, S. J. (2015). LDlink: a web-based application for exploring population-specific haplotype structure and linking correlated alleles of possible functional variants. Bioinformatics 31, 3555–3557. doi: 10.1093/bioinformatics/btv402
Mathias, C., Zambalde, E. P., Rask, P., Gradia, D. F., and de Oliveira, J. C. (2019). Long non-coding RNAs differential expression in breast cancer subtypes: what do we know? Clin. Genet. 95, 558–568. doi: 10.1111/cge.13502
Mattick, J. S. (2009). The genetic signatures of noncoding RNAs. PLoS Genet. 5:e1000459. doi: 10.1371/journal.pgen.1000459
Mavaddat, N., Pharoah, P. D., Michailidou, K., Tyrer, J., Brook, M. N., Bolla, M. K., et al. (2015). Prediction of breast cancer risk based on profiling with common genetic variants. J. Natl. Cancer Inst. 107:djv036.
Mendez, R., and Richter, J. D. (2001). Translational control by CPEB: a means to the end. Nat. Rev. Mol. Cell Biol. 2, 521–529. doi: 10.1038/35080081
Mercer, T. R., Dinger, M. E., and Mattick, J. S. (2009). Long non-coding RNAs: insights into functions. Nat. Rev. Genet. 10, 155–159.
Mestdagh, P., Fredlund, E., Pattyn, F., Rihani, A., Van Maerken, T., Vermeulen, J., et al. (2010). An integrative genomics screen uncovers ncRNA T-UCR functions in neuroblastoma tumours. Oncogene 29, 3583–3592. doi: 10.1038/onc.2010.106
Meyer, K. B., Maia, A. T., O’Reilly, M., Ghoussaini, M., Prathalingam, R., Porter-Gill, P., et al. (2011). A functional variant at a prostate cancer predisposition locus at 8q24 is associated with PVT1 expression. PLoS Genet. 7:e1002165. doi: 10.1371/journal.pgen.1002165
Michailidou, K., Beesley, J., Lindstrom, S., Canisius, S., Dennis, J., Lush, M. J., et al. (2015). Genome-wide association analysis of more than 120,000 individuals identifies 15 new susceptibility loci for breast cancer. Nat. Genet. 47, 373–380. doi: 10.1038/ng.3242
Michailidou, K., Hall, P., Gonzalez-Neira, A., Ghoussaini, M., Dennis, J., Milne, R. L., et al. (2013). Large-scale genotyping identifies 41 new loci associated with breast cancer risk. Nat. Genet. 45, 353–361. doi: 10.1038/ng.2563
Michailidou, K., Lindstrom, S., Dennis, J., Beesley, J., Hui, S., Kar, S., et al. (2017). Association analysis identifies 65 new breast cancer risk loci. Nature 551, 92–94. doi: 10.1038/nature24284
Milne, R. L., Kuchenbaecker, K. B., Michailidou, K., Beesley, J., Kar, S., Lindstrom, S., et al. (2017). Identification of ten variants associated with risk of estrogen-receptor-negative breast cancer. Nat. Genet. 49, 1767–1778. doi: 10.1038/ng.3785
Nielsen, F. C., van Overeem Hansen, T., and Sorensen, C. S. (2016). Hereditary breast and ovarian cancer: new genes in confined pathways. Nat. Rev. Cancer 16, 599–612. doi: 10.1038/nrc.2016.72
O’Connell, J., Gurdasani, D., Delaneau, O., Pirastu, N., Ulivi, S., Cocca, M., et al. (2014). A general approach for haplotype phasing across the full spectrum of relatedness. PLoS Genet. 10:e1004234. doi: 10.1371/journal.pgen.1004234
Park, H. J., Ji, P., Kim, S., Xia, Z., Rodriguez, B., Li, L., et al. (2018). 3′ UTR shortening represses tumor-suppressor genes in trans by disrupting ceRNA crosstalk. Nat. Genet. 50, 783–789. doi: 10.1038/s41588-018-0118-8
Podszywalow-Bartnicka, P., Wolczyk, M., Kusio-Kobialka, M., Wolanin, K., Skowronek, K., Nieborowska-Skorska, M., et al. (2014). Downregulation of BRCA1 protein in BCR-ABL1 leukemia cells depends on stress-triggered TIAR-mediated suppression of translation. Cell. Cycle 13, 3727–3741. doi: 10.4161/15384101.2014.965013
R Core Team (2013). R: A Language And Environment For Statistical Computing. Vienna: R Foundation for Statistical Computing.
Riaz, M., Berns, E. M., Sieuwerts, A. M., Ruigrok-Ritstier, K., de Weerd, V., Groenewoud, A., et al. (2012). Correlation of breast cancer susceptibility loci with patient characteristics, metastasis-free survival, and mRNA expression of the nearest genes. Breast Cancer Res. Treat. 133, 843–851. doi: 10.1007/s10549-011-1663-3
Richter, J. D. (2007). CPEB: a life in translation. Trends Biochem. Sci. 32, 279–285. doi: 10.1016/j.tibs.2007.04.004
Scaruffi, P. (2011). The transcribed-ultraconserved regions: a novel class of long noncoding RNAs involved in cancer susceptibility. Sci. World J. 11, 340–352. doi: 10.1100/tsw.2011.35
Shabalin, A. A. (2012). Matrix eQTL: ultra fast eQTL analysis via large matrix operations. Bioinformatics 28, 1353–1358. doi: 10.1093/bioinformatics/bts163
Sun, H. T., Wen, X., Han, T., Liu, Z. H., Li, S. B., Wang, J. G., et al. (2015). Expression of CPEB4 in invasive ductal breast carcinoma and its prognostic significance. Onco Targets Ther. 8, 3499–3506.
Terracciano, D., Terreri, S., de Nigris, F., Costa, V., Calin, G. A., and Cimmino, A. (2017). The role of a new class of long noncoding RNAs transcribed from ultraconserved regions in cancer. Biochim. Biophys. Acta 1868, 449–455. doi: 10.1016/j.bbcan.2017.09.001
Torre, L. A., Bray, F., Siegel, R. L., Ferlay, J., Lortet-Tieulent, J., and Jemal, A. (2015). Global cancer statistics, 2012CA Cancer. J. Clin. 65, 87–108. doi: 10.3322/caac.21262
Turnbull, C., Ahmed, S., Morrison, J., Pernet, D., Renwick, A., Maranian, M., et al. (2010). Genome-wide association study identifies five new breast cancer susceptibility loci. Nat. Genet. 42, 504–507.
Wang, K. C., and Chang, H. Y. (2011). Molecular mechanisms of long noncoding RNAs. Mol. Cell 43, 904–914. doi: 10.1016/j.molcel.2011.08.018
Wang, P., Xue, Y., Han, Y., Lin, L., Wu, C., Xu, S., et al. (2014). The STAT3-binding long noncoding RNA lnc-DC controls human dendritic cell differentiation. Science 344, 310–313. doi: 10.1126/science.1251456
Wolanin, K., Magalska, A., Kusio-Kobialka, M., Podszywalow-Bartnicka, P., Vejda, S., McKenna, S. L., et al. (2010). Expression of oncogenic kinase Bcr-Abl impairs mitotic checkpoint and promotes aberrant divisions and resistance to microtubule-targeting agents. Mol. Cancer Ther. 9, 1328–1338. doi: 10.1158/1535-7163.mct-09-0936
Wu, L., Shi, W., Long, J., Guo, X., Michailidou, K., Beesley, J., et al. (2018). A transcriptome-wide association study of 229,000 women identifies new candidate susceptibility genes for breast cancer. Nat. Genet. 50, 968–978.
Xing, Z., Lin, A., Li, C., Liang, K., Wang, S., Liu, Y., et al. (2014). lncRNA directs cooperative epigenetic regulation downstream of chemokine signals. Cell 159, 1110–1125. doi: 10.1016/j.cell.2014.10.013
Yang, F., Huo, X. S., Yuan, S. X., Zhang, L., Zhou, W. P., Wang, F., et al. (2013). Repression of the long noncoding RNA-LET by histone deacetylase 3 contributes to hypoxia-mediated metastasis. Mol. Cell 49, 1083–1096. doi: 10.1016/j.molcel.2013.01.010
Keywords: breast cancer, lncRNA, ultraconserved region, GABPB1-AS1, breast cancer risk
Citation: Suvanto M, Beesley J, Blomqvist C, Chenevix-Trench G, Khan S and Nevanlinna H (2020) SNPs in lncRNA Regions and Breast Cancer Risk. Front. Genet. 11:550. doi: 10.3389/fgene.2020.00550
Received: 23 December 2019; Accepted: 07 May 2020;
Published: 30 June 2020.
Edited by:
Ashok Sharma, Augusta University, United StatesReviewed by:
Francesco Nicassio, Italian Institute of Technology (IIT), ItalySimranjeet Kaur, Steno Diabetes Center Copenhagen (SDCC), Denmark
Copyright © 2020 Suvanto, Beesley, Blomqvist, Chenevix-Trench, Khan and Nevanlinna. This is an open-access article distributed under the terms of the Creative Commons Attribution License (CC BY). The use, distribution or reproduction in other forums is permitted, provided the original author(s) and the copyright owner(s) are credited and that the original publication in this journal is cited, in accordance with accepted academic practice. No use, distribution or reproduction is permitted which does not comply with these terms.
*Correspondence: Heli Nevanlinna, aGVsaS5uZXZhbmxpbm5hQGh1cy5maQ==