 Fangdong Liu
 Jianbo He
 Wubin Wang
 Guangnan Xing
 Junyi Gai
- 1Soybean Research Institute, Nanjing Agricultural University, Nanjing, China
- 2MARA National Center for Soybean Improvement, Nanjing Agricultural University, Nanjing, China
- 3MARA Key Laboratory of Biology and Genetic Improvement of Soybean (General), Nanjing Agricultural University, Nanjing, China
- 4State Key Laboratory for Crop Genetics and Germplasm Enhancement, Nanjing Agricultural University, Nanjing, China
- 5Jiangsu Collaborative Innovation Center for Modern Crop Production, Nanjing Agricultural University, Nanjing, China
The Chinese soybean germplasm pool (CSGP) comprises annual wild (WA), farmers’ landrace (LR) and released cultivar (RC) populations, and ecoregion subpopulations in WA/LR/RC (ecoregion IV/III/II/I). A representative sample consisted of 1,024 accessions was studied for pubescence color (PC) and flower color (FC). In the evolution from WA (brown PC and mainly purple FC) to LR then to RC, with above wild characteristic changed, while gray PC, and white FC emerged and their frequency increased. Using 36,952 genomic SNPLDB markers with 100,092 haplotypes, the association between markers and bi-phenotypic traits was detected using χ2 association analysis under single locus model and RTM-GWAS procedure under multi-locus model, respectively. Multiple markers co-associated with individual bi-phenotypic trait with the most significant markers containing multiple rather than two haplotypes even for a bi-phenotypic trait. On a marker/locus, each haplotype corresponds to two colors, except one (FC-1-5) out of 11 haplotypes for single color. The major candidate gene was annotated with its alleles identified from the population sequencing data. Similarly, multiple alleles identified and each corresponds to two colors except three (a8/a9/b3) out of 12 alleles for single color. The major haplotypes/alleles in LR and RC were traced to WA ecoregion subpopulations, the WAIV and WAIII genotypes showed genetically more close to the cultivated subpopulations, therefore, WA from Ecoregion IV and III were inferred as the common ancestor for cultivated soybeans. The marker-haplotypes/gene-alleles not exactly coincided with the bi-phenotypic trait has challenged to the traditional Mendelian genetics, which was discussed and to be further studied.
Introduction
Mendelian inheritance started the modern genetics using a pair of pea parents with a pair of relative characteristics (white vs. purple flower). The Mendelian genetics holds one-to-one correspondence relationship between genotype and phenotype. In soybean, since the previous genetic studies on pigmentation traits mainly used bi-parental populations, there were only two types of alleles involved and reported, while sometimes another gene/locus reported using another pair of parents, such as T/t and Td/td for pubescence color (PC), and W1/w1, W3/w3, W4/w4, Wm/wm, and Wp/wp for flower color (FC; Palmer et al., 2004). Therefore, simple Mendelian inheritance was found for the two traits as indicated above.
It is known that cultivated soybean [G. max (L.) Merr.] was domesticated from annual wild soybean (G. soja Sieb. and Zucc.) about 5,000 years ago (Zhou et al., 2015), originally annual wild soybean was with brown PC and purple FC (Zhuang et al., 1996), while in the cultivated soybeans, gray PC and white FC emerged, and with their frequencies increased gradually (Chang, 1990). Therefore, PC and FC were a bi-phenotypic trait in natural populations as indicated above. It is generally understood that anthocyanin accumulation determines PC and FC, flavonoid 3′5′-hydroxylase (F3′5′H), dihydroflavonol-4-reductase (DFR), and flavonoid 3′ hydroxylase (F3′H) play a crucial role in producing anthocyanin (Yang et al., 2010; Sundaramoorthy et al., 2017).
In natural population, the associated markers/loci for PC and FC have been reported, they may be different in positions on chromosomes, but generally similar, for instance, the loci associated with PC and FC were located at 18.5–18.7 Mb in Gm06, and 3.5–4.5 Mb in Gm13, respectively, (Sonah et al., 2015; Wen et al., 2015; Zhou et al., 2015; Han et al., 2016; Fang et al., 2017). However, a 2-haplotype SNP marker does not provide multiple haplotypes for the bi-phenotypic traits, and may not reflect the complex genetic basis of a bi-phenotypic trait in natural populations. To understand the genetic control of these bi-phenotypic traits, markers with multiple haplotypes should be used in association studies.
To find the associated markers for a qualitative trait (frequency data), the χ2 association analysis for individual markers under single-locus model in a contingency table was usually used. He et al. (2017) established a novel restricted two-stage multi-locus multi-allele genome-wide association study (RTM-GWAS) using a genomic marker called SNPLDB (SNP linkage disequilibrium block), characterized with multiple haplotypes to identify multiple alleles under a multiple-locus model for a quantitative or qualitative trait. Here, the tightly linked SNPs on genome are grouped into a SNPLDB which usually with multiple haplotypes due to multiple SNPs or with only two haplotypes if only a single SNP or several completely linked SNPs involved.
The present study aimed at to identify the genetic structure of the two simple but distinguishable bi-phenotypic traits (PC and FC) in soybeans based on associated marker and candidate gene analysis and to explore the evolutionary genetic relationship among the geographic ecoregion subpopulations. A large population composed of 1,024 accessions were collected and studied, as a representative sample in China. Both χ2 association analysis and RTM-GWAS procedure were used in association analysis for mutual checks. We found that a bi-phenotypic trait may be conferred by multiple haplotypes/alleles and one haplotype/allele may express different phenotypes in a germplasm population. It is a challenge for the traditional Mendelian inheritance, and we would report our findings for a public discussion.
Materials and Methods
Plant Materials and Field Experiment
The Chinese soybean germplasm pool (CSGP) is composed of mainly three populations, annual wild population (WA), farmers’ landrace population (LR), and released cultivar population (RC). A representative sample consisted of 1,024 accessions collected from the whole country, including 182 WA, 396 LR, and 446 RC, was provided by the National Center for Soybean Improvement. These accessions have their origination in the four soybean ecoregion subpopulations in China, i.e., I. Northern Single Cropping, Spring Planting Ecoregion; II: Huang-Huai-Hai Double Cropping, Spring and Summer Planting Ecoregion; III: Middle and Lower Changjiang Valley Double Cropping, Spring and Summer Planting Ecoregion; and IV: South and Southwest China Multiple Cropping Multiple Planting Ecoregion (Table 1 and Supplementary Figure S1). Here ecoregion IV is equivalent to the total of IV + V + VI in Wang and Gai’s (2002) ecoregion system for simplicity in the present study, e.g., WAIV: a subpopulation for annual WA from South and Southwest China Multiple Cropping Multiple Planting Ecoregion.
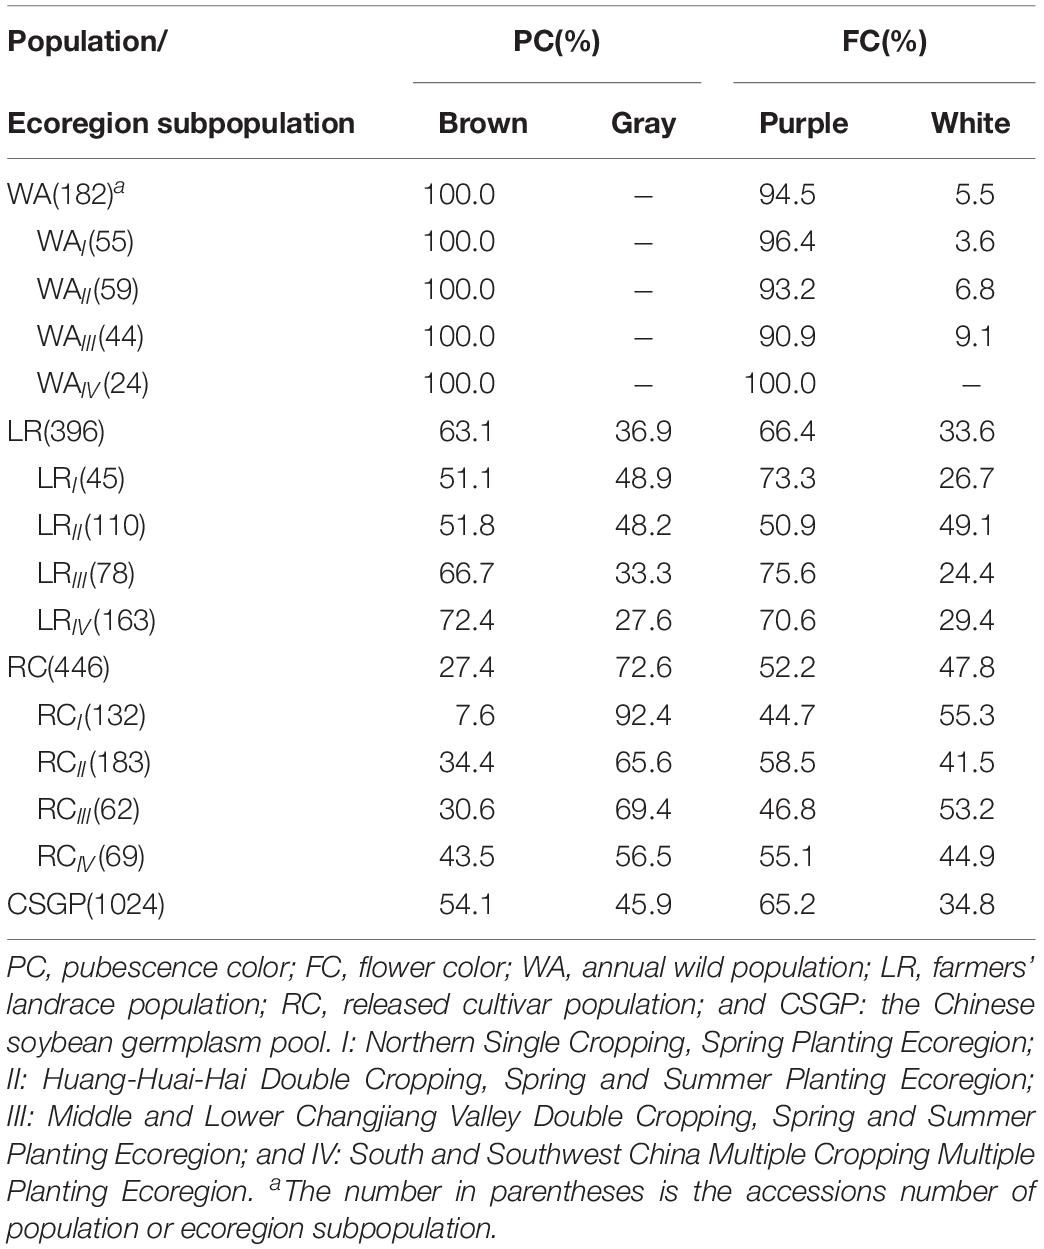
Table 1. The frequency distribution of bi-phenotypic traits in populations as well as ecoregion subpopulations in CSGP.
The accessions were tested at Jiangpu Experimental Station of Nanjing Agricultural University, Nanjing, China (32°07′N, 118°62′E). Bi-phenotypic traits investigated are PC (gray vs. brown) and FC (white vs. purple).
SNP Genotyping and SNPLDB Assembly
The CSGP was genotyped with RAD-seq (restriction site-associated DNA sequencing) at Beijing Genomics Institute (BGI), Shenzhen, China as described in the previous study (He et al., 2017). The resulted SNPs with missing rate > 20%, heterozygous rate > 20%, and minor haplotype/allele frequency < 1% were excluded, and a total of 145,558 high quality SNPs were obtained and used in the present study. Missing genotype were imputed using the software fastPHASE (Paul and Matthew, 2006). Then the SNP(s) within a linkage disequilibrium block were organized into a SNPLDB marker (D′ > 0.70) with haplotypes as its alleles. A single SNP isolated from LD blocks was also treated as a SNPLDB. If the haplotype/allele frequency was less than 1%, the haplotype was replaced with an approximate haplotype with a highest frequency. Finally, a total of 145,558 SNPs and 36,952 SNPLDBs with their 100,092 haplotypes (each SNPLDB with 2–14 haplotypes) were identified in CSGP (refer to Supplementary Data Sheet S1 for the phenotype and genotype data of pubescence color and flower color).
Association Analysis Between SNPLDBs and Bi-Phenotypic Traits as Well as Candidate Genes
The single-locus model χ2 association analysis was conducted for individual SNPLDBs. The associated SNPLDBs with top 10 largest -log10p values were selected. At the same time, RTM-GWAS under multi-locus model (He et al., 2017) was also carried out for mutual checks with the single-locus model χ2 association analysis. The selected SNPLDBs/loci were annotated for their candidate genes, then the annotated genes (version Wm82. a1.v1.1) were retrieved from SoyBase1. The selected SNPLDBs were annotated for their possible candidate genes: at first, the candidate genes in the marker region with a 100-Kb flanking expansion were annotated; to identify the candidate gene from the annotated genes, the χ2 analysis was used to test the association between the SNPs in detected SNPLDBs and SNPs in the annotated genes, the significance level was set as 0.05 for each SNP in the annotated genes (Meng et al., 2016; Li et al., 2017). Based on the identified SNPLDBs and candidate genes, the frequency of marker-haplotypes and gene-alleles were analyzed for the three populations (WA, LR, and RC), and all ecoregion subpopulations (ecoregion IV, III, II, and I).
Results
Phenotypic Frequency Distribution of the Two Bi-Phenotypic Traits in Populations and Ecoregion Subpopulations
Bi-phenotypic traits are significantly changed from WA to LR and then to RC. Brown PC was primitive phenotype, its frequency showed a decrease tendency from WA (100.0%) to LR (63.1%) and then to RC (27.4%), while gray PC showed an increased tendency (Table 1). All WA subpopulations are brown PC; in LR, from LRIV northward to LRI, the brown PC frequency showed a reduced tendency and vice versa for gray PC; in RC, the brown PC frequency was less than gray PC frequency in all subpopulations; brown PC as the primitive phenotype has the highest frequency in LRIV of LR and RCIV in RC, gray PC as a new phenotype increased gradually during the evolution (Table 1).
For FC, there showed purple FC frequency reduced tendency from WA (94.5%) to LR (66.4%) and then to RC (52.2%), and white FC showed an increased tendency (Table 1). In each subpopulation of WA, purple FC was the dominant part, the phenotype in WAIV was purple but white FC already came out starting from WAIII and northward (Table 1). It should be explained here that the primitive FC for WA should be purple only since the most primitive ecoregion WAIV performed only purple FC, it is because the annual wild soybean originated from perennial wild soybean in the low latitudes (north of 24°N, such as south China) and then disseminated to northern latitudes in East Asia (Xu et al., 1987; Hui et al., 1997; Kollipara et al., 1997). Thus WAIV kept the most primitive FC constitution. In all subpopulations of LR, the purple FC frequency was more than white FC frequency; in RC, the purple and white FC frequency was about similar in each subpopulation (Table 1).
It seems that from WA to LR, new phenotype emerged and the bi-phenotypic traits formed. This change was enhanced in RC, while among the ecoregion subpopulations, those southern subpopulations (ecoregion IV of WA and LR) are more primitive in comparison to the northern subpopulations (ecoregion III, II, and I of WA and LR).
Characteristics of Marker-Haplotypes and Corresponding Candidate Gene-Alleles Associated to the Two Bi-Phenotypic Traits in CSGP
The results from association analyses showed that the SNPLDBs associated with the two bi-phenotypic traits were those with multi-haplotypes mostly rather than those with only bi-haplotypes and very few cases of one haplotype corresponding to a single phenotype. According to the probability value (-log10p) of the associated SNPLDBs, the most possible ones were chosen by χ2 association analysis (ten SNPLDBs for each trait; Figures 1A,B and Supplementary Table S1), the most possible locus for PC and FC were PC-1 and FC-1, respectively, and the other associated loci with high significance located closely and associated to PC-1 and FC-1, these closely related loci in fact were co-associated with PC-1 and FC-1, respectively (Supplementary Table S1). On the other hand, among the nine and eight markers identified from RTM-GWAS (Figures 1C,D), the most possible SNPLDBs were PC-r-1 and FC-r-1, with their highest contribution of 25.3% and 69.1% to phenotypic variance, respectively; interestingly, PC-1 and PC-r-1, and FC-1 and FC-r-1 were in fact the same locus, respectively (Supplementary Table S1). It is curious that these most fitted SNPLDBs all contain multiple haplotypes, six haplotypes for PC-1 and five haplotypes for FC-1 (Supplementary Table S1), rather than two haplotypes even the 2-haplotype SNPLDBs closely located around the most fitted multi-haplotype SNPLDBs for the bi-phenotypic traits (Supplementary Tables S2, S3). It indicates that for these bi-phenotypic traits, not necessarily only two haplotypes involved, new haplotypes might happen in the germplasm population in the history.
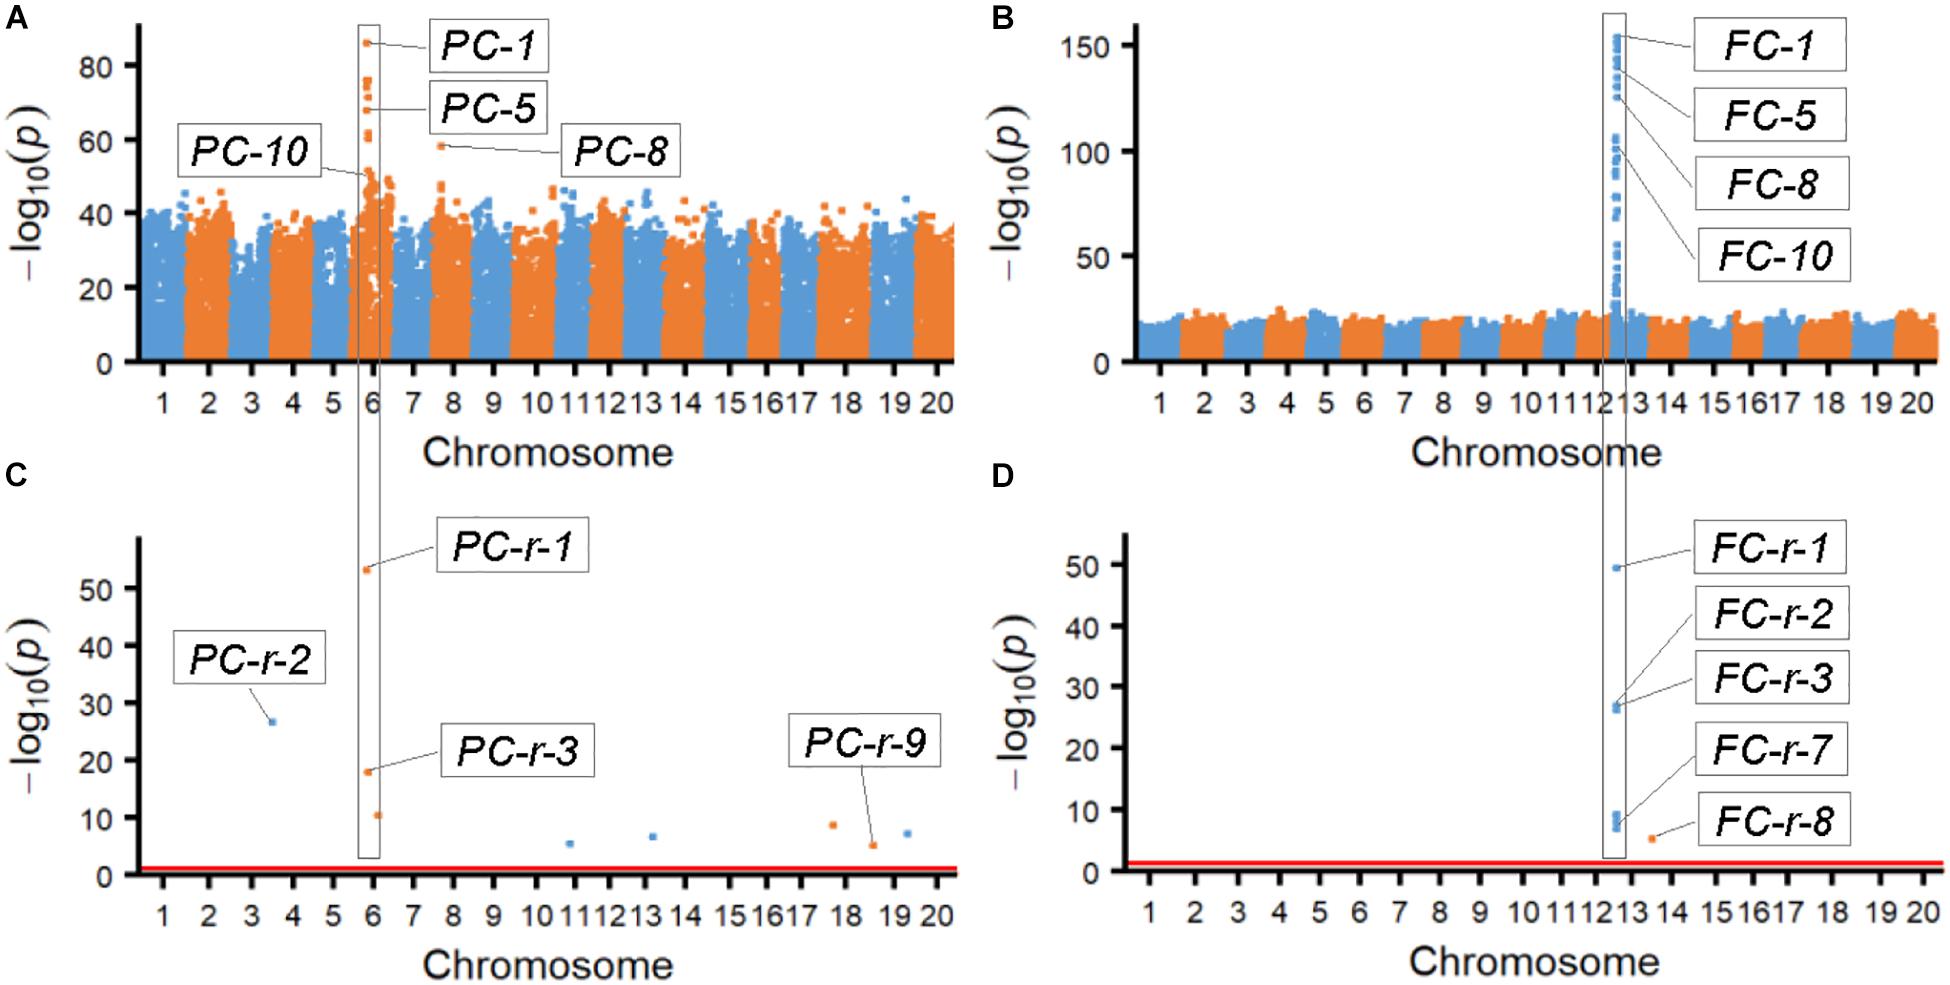
Figure 1. Manhattan figures of the two bi-phenotypic traits obtained from χ2 association analysis and RTM-GWAS procedure. (A) Manhattan map of pubescence color by χ2 association analysis. (B) Manhattan map of flower color by χ2 association analysis. (C) Manhattan map of pubescence color by RTM-GWAS. The p-values of association test in -log10 scale; p-values less than 1e-50 were randomly changed to a value between 1e-50 and 1e-55. (D) Manhattan map of flower color by RTM-GWAS. The p-values of association test in -log10 scale; p-values less than 1e-50 were randomly changed to a value between 1e-50 and 1e-55.
There were six haplotypes on PC-1, but only five haplotypes in WA, all associated with brown PC with PC-1-2 absent which emerged in LR; however, all the six haplotypes associated with both gray and brown PC in LR and RC. Similarly, there were five haplotypes on FC-1, only FC-1-5 associated with a single purple FC but excluded in RC, the other four haplotypes associated with both white and purple FC (Table 2). This result indicates that most haplotypes expressed two phenotypes, a haplotype is not necessarily and completely corresponding to a single phenotype, in contrary, a phenotype is not necessarily and completely corresponding to a single haplotype, thus very few cases (only FC-1-5) of one haplotype corresponding to a single phenotype. This knowledge is completely different from the traditional understanding on Mendelian genetics that phenotypes and haplotypes are one to one corresponded. Since a marker may involve several genes, to know the exact gene-allele vs. phenotype relationship, the candidate gene conferring the bi-phenotypic trait and its alleles should be further examined.
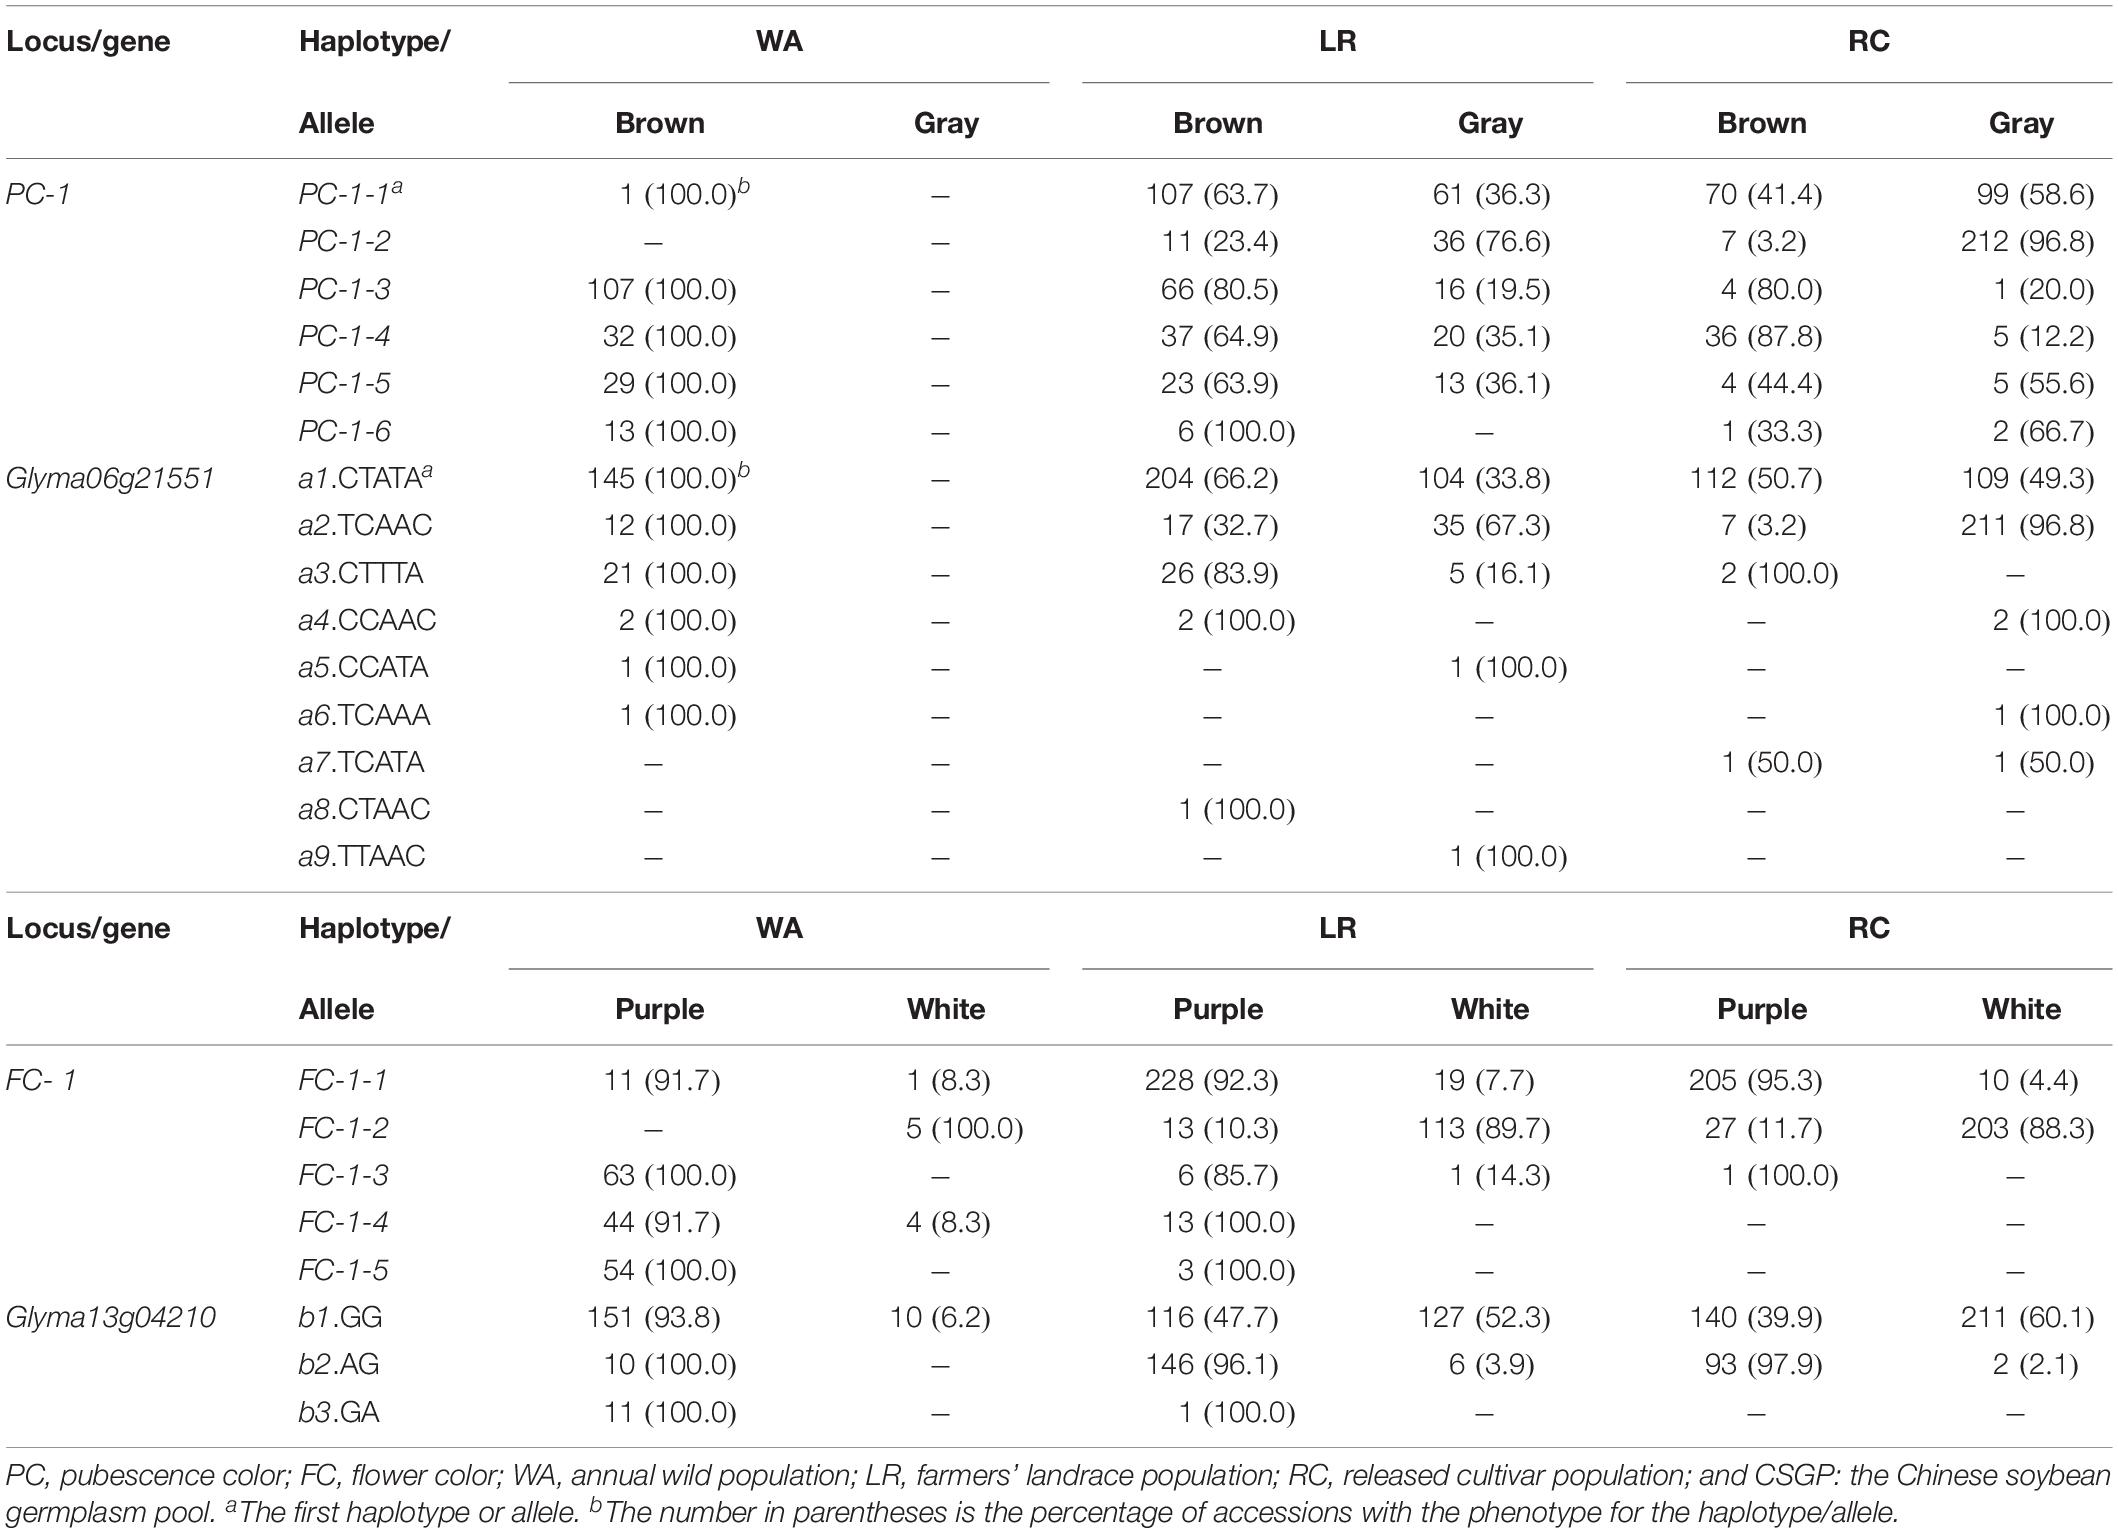
Table 2. Phenotypic frequencies corresponding to the associated marker-haplotypes/gene-alleles for the two bi-phenotypic traits in CSGP (%).
The results from candidate gene-allele analysis showed that the candidate genes associated to the two bi-phenotypic traits were those with multi-alleles mostly rather than those with only bi-alleles and very few cases of one allele corresponding to a single phenotype. To find the candidate genes in or around the associated SNPLDBs (±100 Kb), the genes were annotated based on the soybean genetics and genomics database from G. max (version Wm82.a1.v1.1) in SoyBase1. (i) In PC-1 ± 100 Kb, Glyma06g21551 was recognized as involved in the regulation of PC, and the five SNPs in this gene were tested for their significant association to the PC-1 (p < 0.05) and nine candidate gene alleles were identified in CSGP (Supplementary Table S4). (ii) In FC-1 ± 100 Kb, Glyma13g04210 was recognized as involved in the regulation of FC, two SNPs were included (p < 0.05) and three candidate gene alleles were identified in CSGP (Supplementary Table S4). The identified candidate genes were all with function related to pigmentation, but they were different from the genes identified by Han et al. (2016) and Fang et al. (2017).
Like the associated SNPLDBs, these candidate genes all contains multiple alleles, nine alleles for Glyma06g21551, and three alleles for Glyma13g04210, rather than two alleles. For Glyma06g21551, six of the nine alleles, a1-a6 in WA were with a phenotype of brown PC; a1-a4 in LR and RC were with both brown and gray PC; a7-a9 were new alleles in cultivated soybeans with a8 for brown PC, a9 for gray PC and a7 for both PC colors (Table 2). For Glyma13g04210, b1 was with both purple and white FC in WA, LR and RC, b2 was with purple FC in WA but with both purple and white FC in LR and RC, and b3 was the one with only purple FC (Table 2). Thus, only few cases (a8, a9, and b3) of one allele corresponding to a single color happened in CSGP.
From the above, multiple haplotypes/alleles conferring a same phenotype and one haplotype/allele conferring two phenotypes in a bi-phenotypic trait are popular phenomena in germplasm population. The two bi-phenotypic traits in wild soybeans are brown PC and mainly purple FC. During the process from wild to cultivated soybean, the gray PC and white FC emerged and increased after domestication (Chang, 1990; Zhuang et al., 1996). In the present study, the large sample of 1,024 was analyzed for association between the two bi-phenotypic traits and 36,952 SNPLDBs (each with 2–14 haplotypes, 2-haplotype markers accounting for 74.2%) using both χ2 association analysis and RTM-GWAS, both bi-phenotypic traits fits multiple haplotype markers rather than the 2-haplotype markers even the 2-haplotype markers were many more than multi-haplotype markers, and so was for the candidate gene-alleles (Supplementary Tables S1, S4). Thus we believe multiple haplotypes/alleles in a bi-phenotypic trait is a popular phenomenon.
This phenomenon in fact started with WA in which five haplotypes existed already for PC in the history even with only one phenotype. That means a single color conferred by five haplotypes is an existed fact and that five haplotypes may confer a same phenotype in Mendelian inheritance system, the same situation is for FC. After domestication in LR and RC, a same haplotype associated with two phenotypes is also a popular phenomenon, among the 11 haplotypes, ten associated with two phenotypes, while this phenomenon happened even in WA; it happened not only to the old haplotypes, but also to the new haplotypes, such as PC-1-2 is a new haplotype in LR (Table 2). Among the 11 haplotypes on two loci, only one FC-1-5 confers one phenotype. The similar phenomenon also happened to the gene-alleles on the two pigmentation genes, 11 of the 12 alleles confer two or more phenotypes, a7 for PC is newly emerged allele in RC, a8 and a9 are new alleles in LR, but the latter two alleles conferring only one phenotype in LR compared with WA (Table 2), totally three (a8, a9, and b3) out of the 12 alleles conferred a single phenotype.
Marker-Haplotype and Candidate Gene-Allele Structure Changes of Bi-Phenotypic Traits in the Evolution From WA to LR Then to RC
For PC-1 of WA, five of the six haplotypes existed while PC-1-3 was the major one; in LR, six haplotypes existed, PC-1-2 emerged, and PC-1-1 and PC-1-3 became the major ones; in RC, six haplotypes existed, both PC-1-1 and PC-1-2 are the major ones (Table 3). For FC-1 of WA, five haplotypes existed, FC-1-3, FC-1-4, and FC-1-5 were the major ones; in LR, all five haplotypes exist, but FC-1-1 and FC-1-2 became the major ones; in RC, only three haplotypes existed while FC-1-4 and FC-1-5 were absent (Table 3). Thus from WA to LR, PC-1-2 emerged, PC-1-1, FC-1-1 and FC-1-2 became major ones; from LR to RC, the three major ones in LR continue as the major ones plus the one emerged in LR became also the major ones, but two haplotypes excluded and two haplotypes with frequency even less than 1.0% in RC. That means from WA to LR and RC, their population genetic structure, especially the major haplotypes has changed obviously along with some haplotypes emerged and some excluded due to the domestication and artificial selection.
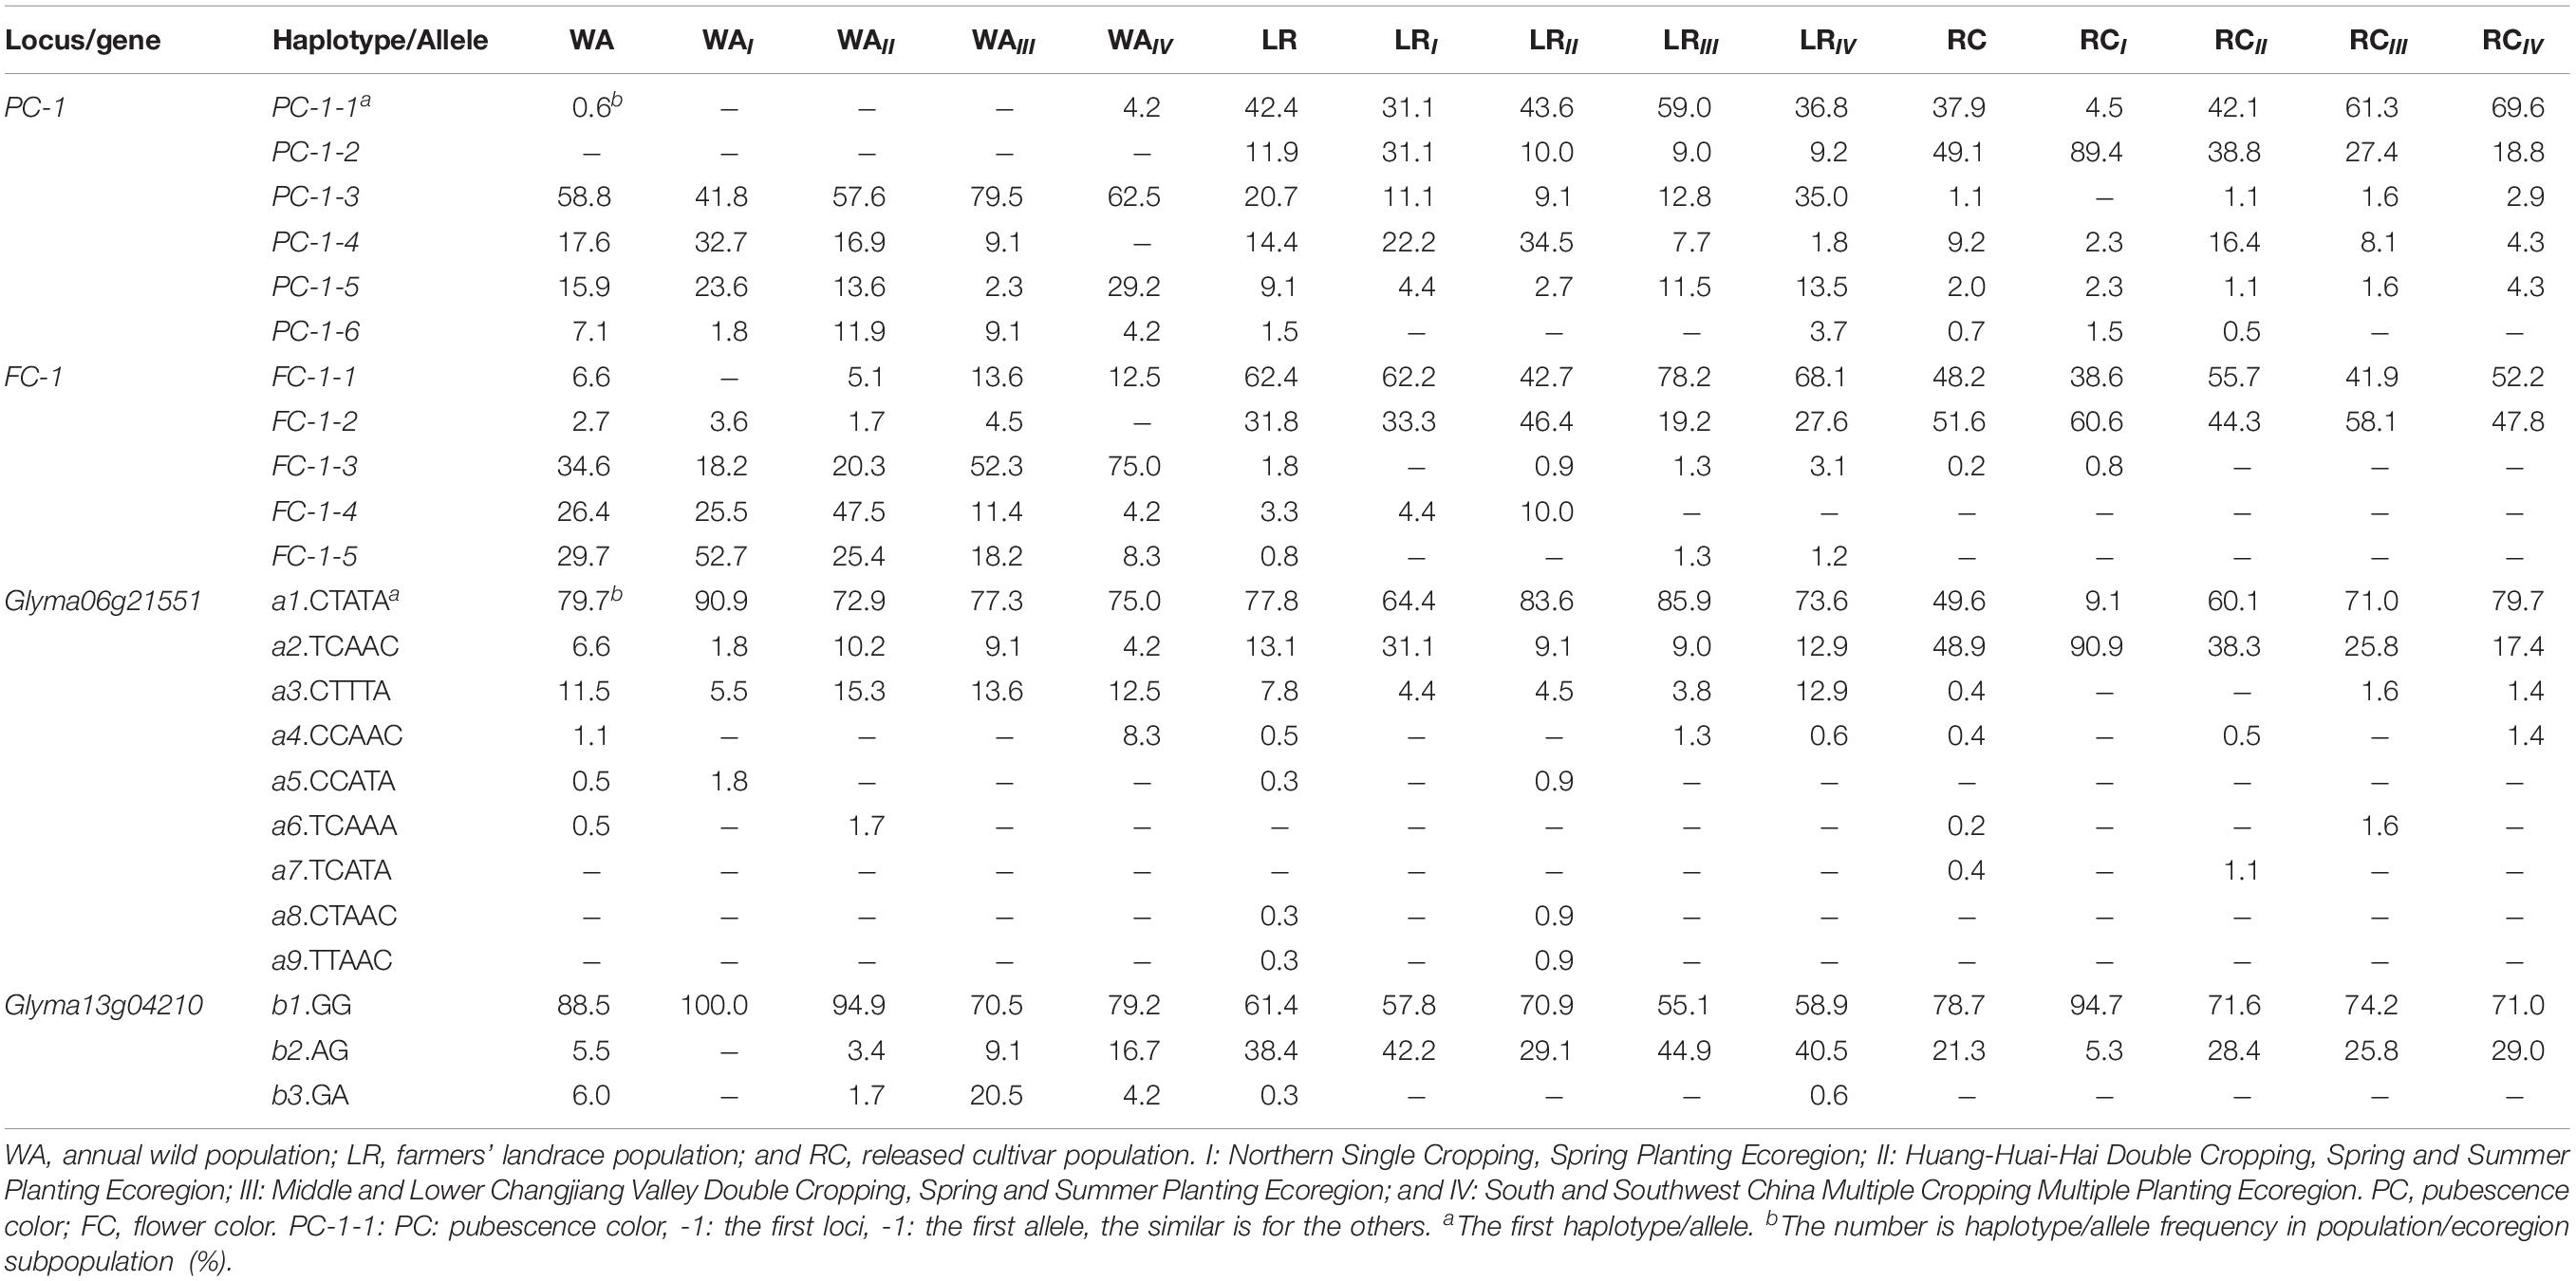
Table 3. Frequency distribution of marker-haplotypes/gene-allele show the evolutionary relationship among populations/ecoregion subpopulations (%).
As for the population genetic structure changes in terms of candidate gene-alleles, the results were similar to those in associated SNPLDBs. For Glyma06g21551 in WA, six of nine alleles existed with a1 as the major allele and a3 as the second major allele; in LR, seven alleles exist, with a1 and a2 as the major and second major alleles, and a8 and a9 newly emerged; in RC, six alleles existed with a1 and a2 as the major alleles, and a5, a8 and a9 excluded (Table 3). For Glyma13g04210 in WA, three alleles existed with b1 as the major allele; in LR, three alleles existed with b2 and b1 as the major ones; in RC, two alleles existed with b2 and b1 also as the major alleles, but b3 absent (Table 3). Thus from WA to LR, a8 and a9 emerged, b2 in addition to b1 became the second major allele, and from LR to RC, a5, a8, a9, and b3 excluded. That means from WA to LR and then to RC, their population genetic structure has changed obviously, some alleles emerged and some alleles excluded due to the domestication and artificial selection but the major alleles concentrated.
The haplotype/allele frequencies varied among populations or ecoregion subpopulations in WA, LR, and RC (Table 3). To trace the haplotypes/alleles back to WA, PC-1-2 was absent in WA, but newly emerged in LR. This judgment was supported by that the binomial probability of its absence in WA in a large sample with 182 accessions due to sampling error is very small (much less than 1.00 × 10⁻⁶). The other four PC-1 haplotypes/alleles can be traced to their wild ancestors. Among the QTL alleles (marker haplotypes), PC-1-1 was from WAIV, FC-1-1 can be traced to one of WAIII, WAIV and WAII, FC-1-2 can be traced to one of WAIII, WAII, and WAI. To trace the candidate gene alleles back to WA, a4 was from WAIV, a5 was from WAI, b2, and b3 can be traced to one of WAIII, WAIV, and WAII (Table 3). To combine the above information, WAIV involves two haplotypes/alleles and three candidate gene alleles traced from, WAIII involves two haplotypes and two candidate gene alleles traced from, WAII involves two haplotypes/alleles and two candidate gene alleles traced from, and WAI involves one haplotype/allele and one candidate gene allele traced from. In addition, the frequency of these haplotypes/alleles and candidate gene alleles in WAIII was higher than that in WAII (Table 3). Thus WAIV and WAIII have more original haplotypes/alleles and candidate gene alleles traced from, therefore, are more likely the wild sources of the cultivated soybeans. This concept supports the southern China origin hypothesis of cultivated soybean as reported by Gai et al. (2000) and Wen et al. (2009).
Discussion
How to understand the association mapping results, are the multi-alleles conferring only two phenotypes exact and reasonable and is an allele conferring two phenotypes exact and reasonable which even with phenotypic ratio varying from allele to allele? These questions are to be answered. As indicated in the above discussion, we believe that both marker-haplotype and candidate gene-allele results are real facts. Thus we have to study further on how to understand and explain the facts. From our experiment, we suppose that in a natural population, mutation might cause multiple allele emergences, each emerged alleles may have phenotype different or similar to the old alleles. As we understand, the color phenotypes roughly were classified into two categories, but may varying in color darkness which might involving multiple alleles, this is one possible reason (Palmer et al., 2004). But the followed question is that what is the mechanism of a same gene-allele conferring two different phenotypes and different alleles have different ratios between the two phenotypes? As we considered, one possible cause might be the DNA sequence variation which was not detected in sequencing process or in other words, the hidden causal variation within a same gene-allele. In our study, we supposed all the haplotypes/alleles were grouped completely from our sequence data without intra-allele variation, but in fact the possibility of hidden causal variation within a SNPLDB-haplotype was not completely excluded because the sequencing depth not solid enough. Therefore, this possibility should be further checked. The other possible reason might be that the gene-allele was modified in their expressions or there might be some epigenetic reasons for the expression of individual alleles which is also to be explored.
Bolondi et al. (2017) reviewed the historical advances in gene concept, they discussed the two faced nature of genes, i.e., DNA phenotype and genotype, the DNA phenotype (the molecular constitution of the DNA and its epigenetic modifications) determines the coding information (the genotype), through gene expression the phenotype is obtained, following outer inputs the DNA genotype may influence the DNA phenotype. Many of the known epigenetic alterations are attributable to structural genetic variation acting, and thus are at least partly guided by DNA sequence (Hirsch et al., 2013). The functional gene state can be affected by physical modifications of a gene (e.g., methylation, epigenetics). This two-sided view of the gene allows to combine the genetic and epigenetic aspects in a unique solution, and may be able to explain the difference and similarity among the alleles on a locus (Hirsch et al., 2013). From the above, the simple inheritance trait might be not as simple as we thought before, especially in a natural population experienced a long term of historical period. It should be further explored for the genetic mechanisms.
Data Availability Statement
The raw data supporting the conclusions of this article will be made available by the authors, without undue reservation, to any qualified researcher.
Author Contributions
JG designed the research. FL performed the experiments. FL, JH, WW, and GX did the lab work. FL and JH analyzed the data. FL, JH, and JG drafted the manuscript.
Funding
This work was supported by the China National Key R&D Program for Crop Breeding (2016YFD0100201, 2016YFD0100304, 2017YFD0100500, and 2017YFD0102002), the Natural Science Foundation of China (31601325 and 31701447), the MOE 111 Project (B08025), Program for Changjiang Scholars and Innovative Research Team in University (PCSIRT_17R55), the MARA CARS-04 program, the Fundamental Research Funds for the Central Universities (KYT201801), and the Jiangsu JCIC-MCP Program. The funders had no role in study design, data collection and analysis, decision to publish, or preparation of the manuscript.
Conflict of Interest
The authors declare that the research was conducted in the absence of any commercial or financial relationships that could be construed as a potential conflict of interest.
Supplementary Material
The Supplementary Material for this article can be found online at: https://www.frontiersin.org/articles/10.3389/fgene.2020.00559/full#supplementary-material
Footnotes
References
Bolondi, A., Caldarelli, F., Felice, F. D., Durano, D., Germani, G., Michetti, L., et al. (2017). What is a gene? A two sided view. Evol. Biol. 44, 1–4. doi: 10.1007/s11692-016-9392-5
Chang, R. Z. (1990). Study on genetic resources of soybean in China: IV. Trait of plant for genetic resources of soybean in different area. China Seed Ind. 32, 10–11. doi: 10.19462/j.cnki.671-895x.1990.04.004
Fang, C., Ma, Y. M., Wu, S. W., Liu, Z., Wang, Z., Yang, R., et al. (2017). Genome-wide association studies dissect the genetic networks underlying agronomical traits in soybean. Genome Biol. 18, 1–13. doi: 10.1186/s13059-017-1289-9
Gai, J. Y., Xu, D. H., Gao, Z., Yoshiya, S., Jun, A., Hirofumi, F., et al. (2000). Studies on the evolutionary relationship among eco-types of G. max and G. soja in China. Acta Agron. Sin. 25, 513–520. doi: 10.3321/j.issn:0496-3490.2000.05.001
Han, Y. P., Zhao, X., Liu, D. Y., Li, Y. H., Lightfoot, D. A., Yang, Z. J., et al. (2016). Domestication footprints anchor genomic regions of agronomic importance in soybeans. New Phytol. 209, 871–884. doi: 10.1111/nph.13626
He, J. B., Meng, S., Zhao, T. J., Xing, G. N., Yang, S. P., Li, Y., et al. (2017). An innovative procedure of genome-wide association analysis fits studies on germplasm population and plant breeding. Theor. Appl. Genet. 130, 2327–2343. doi: 10.1007/s00122-017-2962-9
Hirsch, S., Baumberger, R., and Grossniklaus, U. (2013). Epigenetic variation, inheritance, and selection in plant populations. Cold Spring Harb. Symp. Quant. Biol. 77, 97–104. doi: 10.1101/sqb.2013.77.014605
Hui, D., Chen, S., and Zhuang, B. (1997). Phylogeny of 12 species of genus Glycine Willd. Reconstructed with internal transcribed region in nuclear ribosomal DNA. Sci. China Ser. C 40, 137–144. doi: 10.1007/BF02882041
Kollipara, K. P., Singh, R. J., and Hymowitz, T. (1997). Phylogenetic and genomic relationships in the genus Glycine Willd. based on sequences from the ITS region of nuclear rDNA. Genome 40, 57–68. doi: 10.1139/g97-008
Li, S. G., Cao, Y. C., He, J. B., Zhao, T. J., and Gai, J. Y. (2017). Detecting the QTL-allele system conferring flowering date in a nested association mapping population of soybean using a novel procedure. Theor. Appl. Genet. 130, 2297–2314. doi: 10.1007/s00122-017-2960-y
Meng, S., He, J. B., Zhao, T. J., Xing, G. N., Li, Y., Yang, S. P., et al. (2016). Detecting the QTL-allele system of seed isoflavone content in Chinese soybean landrace population for optimal cross design and gene system exploration. Theor. Appl. Genet. 129, 1557–1576. doi: 10.1007/s00122-016-2724-0
Palmer, R. G., Pfeiffer, T. W., Buss, G. R., and Kilen, T. C. (2004). Soybeans: improvement, production, and uses third edition, chapter 5 qualitative genetics. Agric. Syst. 83, 110–111. doi: 10.1016/s0308-521x(04)00095-2
Paul, S., and Matthew, S. (2006). A fast and flexible statistical model for large-scale population genotype data: applications to inferring missing genotypes and haplotypic phase. Am. J. Hum. Genet. 78, 629–644. doi: 10.1086/502802
Sonah, H., O’Donoughue, L., Cober, E., Rajcan, I., and Belzile, F. (2015). Identification of loci governing eight agronomic traits using a GBS-GWAS approach and validation by QTL mapping in soya bean. Plant Biotechnol. J. 13, 211–221. doi: 10.1111/pbi.12249
Sundaramoorthy, J., Park, G. T., Chang, J. H., Lee, J. D., Kim, J. H., Seo, H. S., et al. (2017). Identification and molecular analysis of four new alleles at the W1 locus associated with flower color in soybean. PLoS One 11:e0159865. doi: 10.1371/journal.pone.0159865
Wang, Y. S., and Gai, J. Y. (2002). Study on the ecological regions of soybean in China II - Ecological environment and representative varieties. J. Appl. Ecol. 13, 71–75. doi: 10.1006/jfls.2001.0409
Wen, Z. X., Boyse, J. F., Song, Q. J., Cregan, P. B., and Wang, D. C. (2015). Genomic consequences of selection and genome-wide association mapping in soybean. BMC Genomics. 16:671. doi: 10.1186/s12864-015-1872-y
Wen, Z. X., Zhao, T. J., Ding, Y. L., and Gai, J. Y. (2009). Genetic diversity, geographic differentiation and evolutionary relationship among ecotypes of Glycine max and G. soja in China. Chinese Sci. Bull. 54, 4393–4403. doi: 10.1007/s11434-009-0696-z
Xu, B., Lu, Q. H., and Zhuang, B. C. (1987). Analysis of ecotypes of wild soybean (G. soja) in China. Sci. Agric. Sin. 20, 29–35.
Yang, K., Jeong, N., Moon, J. K., Lee, Y. H., Lee, S. H., and Kim, H. M. (2010). Genetic analysis of genes controlling natural variation of seed coat and flower colors in soybean. J. Hered. 101, 757–768. doi: 10.1093/jhered/esq078
Zhou, Z. K., Yu, J., Wang, Z., Gou, Z. H., Lyu, J., Li, W. Y., et al. (2015). Resequencing 302 wild and cultivated accessions identifies genes related to domestication and improvement in soybean. Nat. Biotechnol. 33, 408–414. doi: 10.1038/nbt.3096
Keywords: annual wild soybean (G. soja Sieb. and Zucc.), cultivated soybean [G. max (L.) Merr.], bi-phenotypic trait, χ2 association mapping, RTM-GWAS, Mendelian inheritance, marker-haplotype, gene-allele
Citation: Liu F, He J, Wang W, Xing G and Gai J (2020) Bi-Phenotypic Trait May Be Conferred by Multiple Alleles in a Germplasm Population. Front. Genet. 11:559. doi: 10.3389/fgene.2020.00559
Received: 23 January 2020; Accepted: 07 May 2020;
Published: 03 June 2020.
Edited by:
Zhixi Tian, Institute of Genetics and Developmental Biology (CAS), ChinaReviewed by:
Dechun Wang, Michigan State University, United StatesJianghua Chen, Xishuangbanna Tropical Botanical Garden (CAS), China
Copyright © 2020 Liu, He, Wang, Xing and Gai. This is an open-access article distributed under the terms of the Creative Commons Attribution License (CC BY). The use, distribution or reproduction in other forums is permitted, provided the original author(s) and the copyright owner(s) are credited and that the original publication in this journal is cited, in accordance with accepted academic practice. No use, distribution or reproduction is permitted which does not comply with these terms.
*Correspondence: Junyi Gai, c3JpQG5qYXUuZWR1LmNu