 Hongwei Chen1
 Xiuqin Zhao2Laiyuan Zhai1,2Kuitian Shao1Kunwei Jiang1
 Congcong Shen3Kai Chen3Shu Wang1
 Yun Wang1*
 Jianlong Xu2*
- 1Rice Research Institute, Shenyang Agricultural University, Shenyang, China
- 2Institute of Crop Sciences/National Key Facility for Crop Gene Resources and Genetic Improvement, Chinese Academy of Agricultural Sciences, Beijing, China
- 3Shenzhen Branch, Guangdong Laboratory for Lingnan Modern Agriculture, Genome Analysis Laboratory of the Ministry of Agriculture, Agricultural Genomics Institute at Shenzhen, Chinese Academy of Agricultural Sciences, Shenzhen, China
Stomatal density (D) and size (S) are an important adaptive mechanism for abiotic stress tolerance and photosynthesis capacity in rice. However, the genetic base of rice stomata-related traits still remains unclear. We identified quantitative trait loci (QTLs) associated with D and S on abaxial and adaxial leaf surfaces using genome-wide association analysis with 451 diverse accessions in two environments. D and S showed significant differences between indica (xian) and japonica (geng) accessions and significantly negative phenotypic correlations. A total of 64 QTLs influencing eight stomata-related traits were identified using 2,936,762 high-quality single nucleotide polymorphism markers. Twelve QTLs were consistently detected for the same traits in nine chromosomal regions in both environments. In addition, 12 QTL clusters were simultaneously detected for the same stomata-related traits on abaxial and adaxial leaf surfaces in the same environment, probably explaining the genetic bases of significant correlations of the stomata-related traits. We screened 64 candidate genes for the nine consistent QTL regions using haplotype analysis. Among them, LOC_Os01g66120 for qDada1, OsSPCH2 (LOC_Os02g15760) for qDada2.1 and qDaba2.1, LOC_Os02g34320 for qSada2.2, OsFLP (LOC_Os07g43420) or LOC_Os07g43530 for qSaba7.1, and LOC_Os07g41200 for qWada7 and qWaba7 were considered as the most likely candidate genes based on functional annotations. The results systematically dissected the genetic base of stomata-related traits and provide useful information for improving rice yield potential via increasing abiotic stress tolerance and photosynthesis capacity under stressed and non-stressed conditions through deploying the favorable alleles underlying stomata-related traits by marker-assisted selection.
Introduction
Plant stomata are microscopic pores on the epidermis of leaves formed by a pair of specialized guard cells, and some are surrounded by subsidiary cells in certain monocot species such as rice (Bergmann and Sack, 2007). Stomata act as a gateway for the efficient exchange of water vapor and CO2 between plants and the atmosphere. Stomatal size (S) and density (D) are two major factors that improve stomatal conductance and photosynthetic capacity, which are dramatically associated with the grain yield of crops under stressed and non-stressed conditions (Xu and Zhou, 2008; Franks and Beerling, 2009). Plant stomatal density plays an important role in plant responses to environmental conditions, such as elevated CO2 concentration (Xu et al., 2016), salt stress (Wei et al., 2019), drought stress (Zandalinas et al., 2018), and light intensity (Shimazaki et al., 2007). Moreover, many studies have reported that water deficit leads to an increase in D, and a decrease in S (Xu and Zhou, 2008; Buckley et al., 2020), indicating that this might be partially related to enhancing the adaptation of plants to drought.
Differences in D were observed between the abaxial (lower) and adaxial (upper) leaf surfaces. More specifically, the abaxial surface possesses more stomata compared with the adaxial surface (Ishimaru et al., 2001; Laza et al., 2010), and significant positive correlations were identified for stomatal density between both sides (Ishimaru et al., 2001). Generally, xian rice varieties tend to have higher D and smaller S than geng varieties (Laza et al., 2010). Significant negative correlations were also observed between D and S in rice (Ishimaru et al., 2001; Ohsumi et al., 2007; Laza et al., 2010). However, the genetic basis of D and S on adaxial and abaxial leaf surfaces is still poorly understood. Therefore, it is important to study the genetic basis of stomata-related traits to provide useful information for the genetic improvement of rice to enhance rice photosynthetic abilities and stress tolerance.
The use of quantitative trait locus (QTL) mapping has contributed to a better understanding of the genetic basis of many agronomically important traits. Over the last few decades, many researchers have identified QTLs for stomata-related traits, including D and S, using bi-parental populations in rice (Ishimaru et al., 2001; Laza et al., 2010). Notably, several genes controlling stomatal development in Arabidopsis, such as TOO MANY MOUTHS (TMM) (Geisler et al., 2000), STOMATAL DENSITY AND DISTRIBUTION 1 (SDD1) (Von Groll et al., 2002), MITOGEN-ACTIVATED PROTEIN KINASE3 (MPK3) and MPK6 (Wang et al., 2007), STOMAGEN (Kondo et al., 2010), which encode putative receptors, proteases, or kinases, and act primarily by modulating the number and placement of asymmetric divisions in the stomatal cell lineage, respectively. In rice, certain key transcriptional factors (TFs), such as SPEECHLESS (OsSPCH), MUTE (OsMUTE), FAMA (OsFAMA), INDUCER OF CBF EXPRESSION1 (OsICE), FOUR LIPS (OsFLP) regulate the stomatal development stage (Wu et al., 2019). Mohammed et al. (2019) reported overexpressed rice EPIDERMAL PATTERNING FACTOR1 (OsEPF1) produced transgenic plants with reduced stomatal densities, resulting in decreased leaf stomatal conductance and enhanced water use efficiency.
A genome-wide association study (GWAS) is an effective method to dissect the genetic basis of complex traits, such as grain yield, and biotic and abiotic stress tolerances (Zhao et al., 2018; Zhai et al., 2018; Liu et al., 2019). In the present study, we reported the first GWAS to identify QTLs for stomata-related traits in rice using a panel of germplasm resources with a broad genetic diversity. A diverse panel consisting of 451 accessions from the 3000 Rice Genomes Project (3K RGP) (3K RGP, 2014) was used to detect QTLs for stomata-related traits in rice and identify associated candidate genes by GWAS using 4.8M single nucleotide polymorphisms (SNPs) generated using high-throughput re-sequencing. The results will shed new light on the genetic basis of stomata-related traits and provide superior alleles to improve rice stomata-related traits by molecular breeding.
Materials and Methods
Plant Materials
The 451 worldwide accessions, which originated from 60 countries, were collected from 3K RGP (3K RGP, 2014). Based on the known population structure and division of subpopulations (Wang et al., 2018), the panel contained 271 xian accessions (66 xian-1A, 75 xian-1B, 20 xian-2, 1 xian-3, and 109 xian-adm), 145 geng accessions (63 geng -tmp, 6 geng-sbtrp, 53 geng-trp, and 23 geng-adm), 11 aus/boro, 5 basmati/sadri and 19 highly admixture (adm) accessions (Supplementary Table S1).
Phenotypic Investigation
All of these genotypes were grown in Sanya (SY, 18.3° N, 109.3° E) during December 2016–April 2017 and Beijing (BJ, 40.2° N, 116.2° E) during May–October, 2017, and each accession was planted in two rows with 10 individuals in each row at a spacing of 25 cm × 17 cm for two replications. Field management followed the local standard management practices. To minimize flowering time effects on possible experiment error, batch samplings were conducted based on the heading date of each accession. At the full heading stage, eight uniform flag leaves from the main stem of eight plants (one main stem from one plant) in the middle of each plot were collected and kept in formalin-acetic-alcohol (FAA) fixative solution. Leaf impressions were made on the adaxial and abaxial leaf surfaces at the middle part of the flag leaf. The stomatal density (stomata per unit area) on the adaxial leaf surface (Dada, number/mm2) and abaxial leaf surface (Daba, number/mm2) was counted at 500 × magnification and repeated in five impressions from each of leaf using a scanning electron microscope (Hitachi TM3030, Tokyo, Japan). The guard cell length (L) on the adaxial leaf surface (Lada, μm) and abaxial leaf surface (Laba, μm), and guard cell width (W) on the adaxial leaf surface (Wada, μm) and abaxial leaf surface (Waba, μm), were observed and measured at 1200 × magnification and repeated for five replicates. The S values on the adaxial leaf surface (Sada, μm2) and abaxial leaf surface (Saba, μm2) were calculated based on the assumption that stomata are elliptical in shape, with their major axis equal to L and their minor axis equal to W, as follows (Xiong et al., 2018; Zhang et al., 2019):
The average trait value of each accession was used for data analyses.
Genotyping
The 4.8M SNP genotype data of this association panel were selected from the 3K RGP (3K RGP, 2014). SNPs with a missing rate over 20% and a minor allele frequency less than 5% were removed. Heterozygous alleles were also eliminated. Finally, a total of 2,936,762 high quality SNP markers that were evenly distributed on chromosomes were used to carry out the GWAS.
QTL Mapping by GWAS
We performed a GWAS to detect SNPs that were significantly associated with all stomata-related traits using 2,936,762 SNPs and the mean trait values of the 451 accessions from each of the environments. Principal component analysis (PCA) was conducted using the efficient mixed-model association (EMMA) method in the Genome Association and Prediction Integrated Tool (GAPIT) R package (Lipka et al., 2012) to examine the population structure. The K matrix (kinship matrix) was calculated by the EMMAX software based on the Bayesian Network (BN) method using those high quality SNPs. Marker-trait associations were conducted by the model of mixed linear (MLM), PCA+K, implemented in GAPIT. The critical P-value for declaring significant marker-trait association (1.0 × 10⁻⁵) was calculated using GEC software based on the independent effective SNP number (Li et al., 2012).
We realized that the use of a single P-value threshold in GWAS could result in detection of a significant marker-trait associated SNP in one environment but not in another environment. To further examine the extent to which inconsistent associated SNP detection across the two environments (SY and BJ) actually occurred from type II errors, all significant associated SNPs identified under one condition were re-examined using the data from the other condition, with a minimum significance threshold of P < 1.0 × 10–4.5. The test statistics and QTL parameters associated with the QTLs were also reported as long as the QTLs reached the minimum threshold (Xu et al., 2005; Li, 2001). To estimate independently associated regions of identified QTLs, significantly trait-associated SNPs situated in one estimated LD block were defined as the same QTL. Each LD block containing the identified SNPs was evaluated with the R package “LDheatmap” (Hyung et al., 2006) according to the block definition suggested by Yano et al. (2016).
Identification of Candidate Genes
The haplotypes of all the genes located in the candidate regions for QTLs consistently detected in the two environments from the Rice Annotation Project Database1 (Sakai et al., 2013) were conducted according to all available non-synonymous SNPs located inside of these genes in the 451 rice accessions. Haplotypes containing more than 10 rice accessions were used to analyze the significant differences in phenotype. Six representative candidate genes were selected for a comprehensive analysis based on the significance of the haplotype analyses [analysis of variance (ANOVA)], their biochemically related functions, and their expression profiles. Gene expression profiles were downloaded from a rice expression profile database [RiceXPro (version 3.0)]2 (Sato et al., 2013). Two-sided Fisher’s exact tests in R were used to compare haplotype frequencies between xian and geng subpopulations.
Statistical Analysis
Differences in the mean phenotypic values among the haplotypes (containing more than 10 accessions) were evaluated using a one-way ANOVA. Duncan’s multiple mean comparison test was carried out to determine the significance of any differences (5% significance level) using the agricolae package in R. Phenotypic correlation analyses of the eight stomata-traits were computed using the corrplot package in R. Variance components were evaluated using multiple-site analysis with all effects treated as random. We computed heritability across the two environments using the estimated variance components as VG/(VG + VGEI/s +Ve/sr), where VG, VGEI, and Ve are the variances of genotype, genotype-by-environment interaction variance, and residual error, respectively; s is the number of environments; and r is the number of replicates. All analyses were conducted with the PBTools package3 developed by The International Rice Research Institute.
Reults
Phenotypic Variation of Stomata-Related Traits
The rice panel used in this study showed wide variations for all the investigated traits and most traits appeared to be normally distributed (Supplementary Table S1 and Supplementary Figure S1). The 451 accessions presented substantial variations for the tested stomata-related traits in Sanya (SY) and Beijing (BJ). Comparing the D and S values on the abaxial leaf surface with those on the adaxial leaf surface revealed that Daba (average 739.7 number/mm2 and 683 number/mm2 in SY and BJ, respectively) was significantly higher than Dada (average 548.2 number/mm2 and 517.6 number/mm2 in SY and BJ, respectively) (Supplementary Figure S2). In addition, Saba was significantly larger than Sada in BJ, whereas no significant difference was observed between the two sides in SY (Supplementary Figure S2). Based on estimates of variance components for the eight traits, most traits were controlled mainly by VG, whereas VGEI was the main source for Lada and Sada (Supplementary Table S2). The heritability of the eight traits ranged from 0.41 for Lada to 0.69 for Dada (Supplementary Table S2).
Based on the results from 3,010 rice accessions (Wang et al., 2018), 271 accessions were classified into the xian subpopulation, and 145 accessions were classified into the geng subpopulation for further phenotypic analysis in the two subpopulations. Xian varieties exhibited significantly higher D, but significantly smaller L, W, and S than geng varieties on the two sides in the two environments, except Dada and Lada in BJ (Figure 1A).
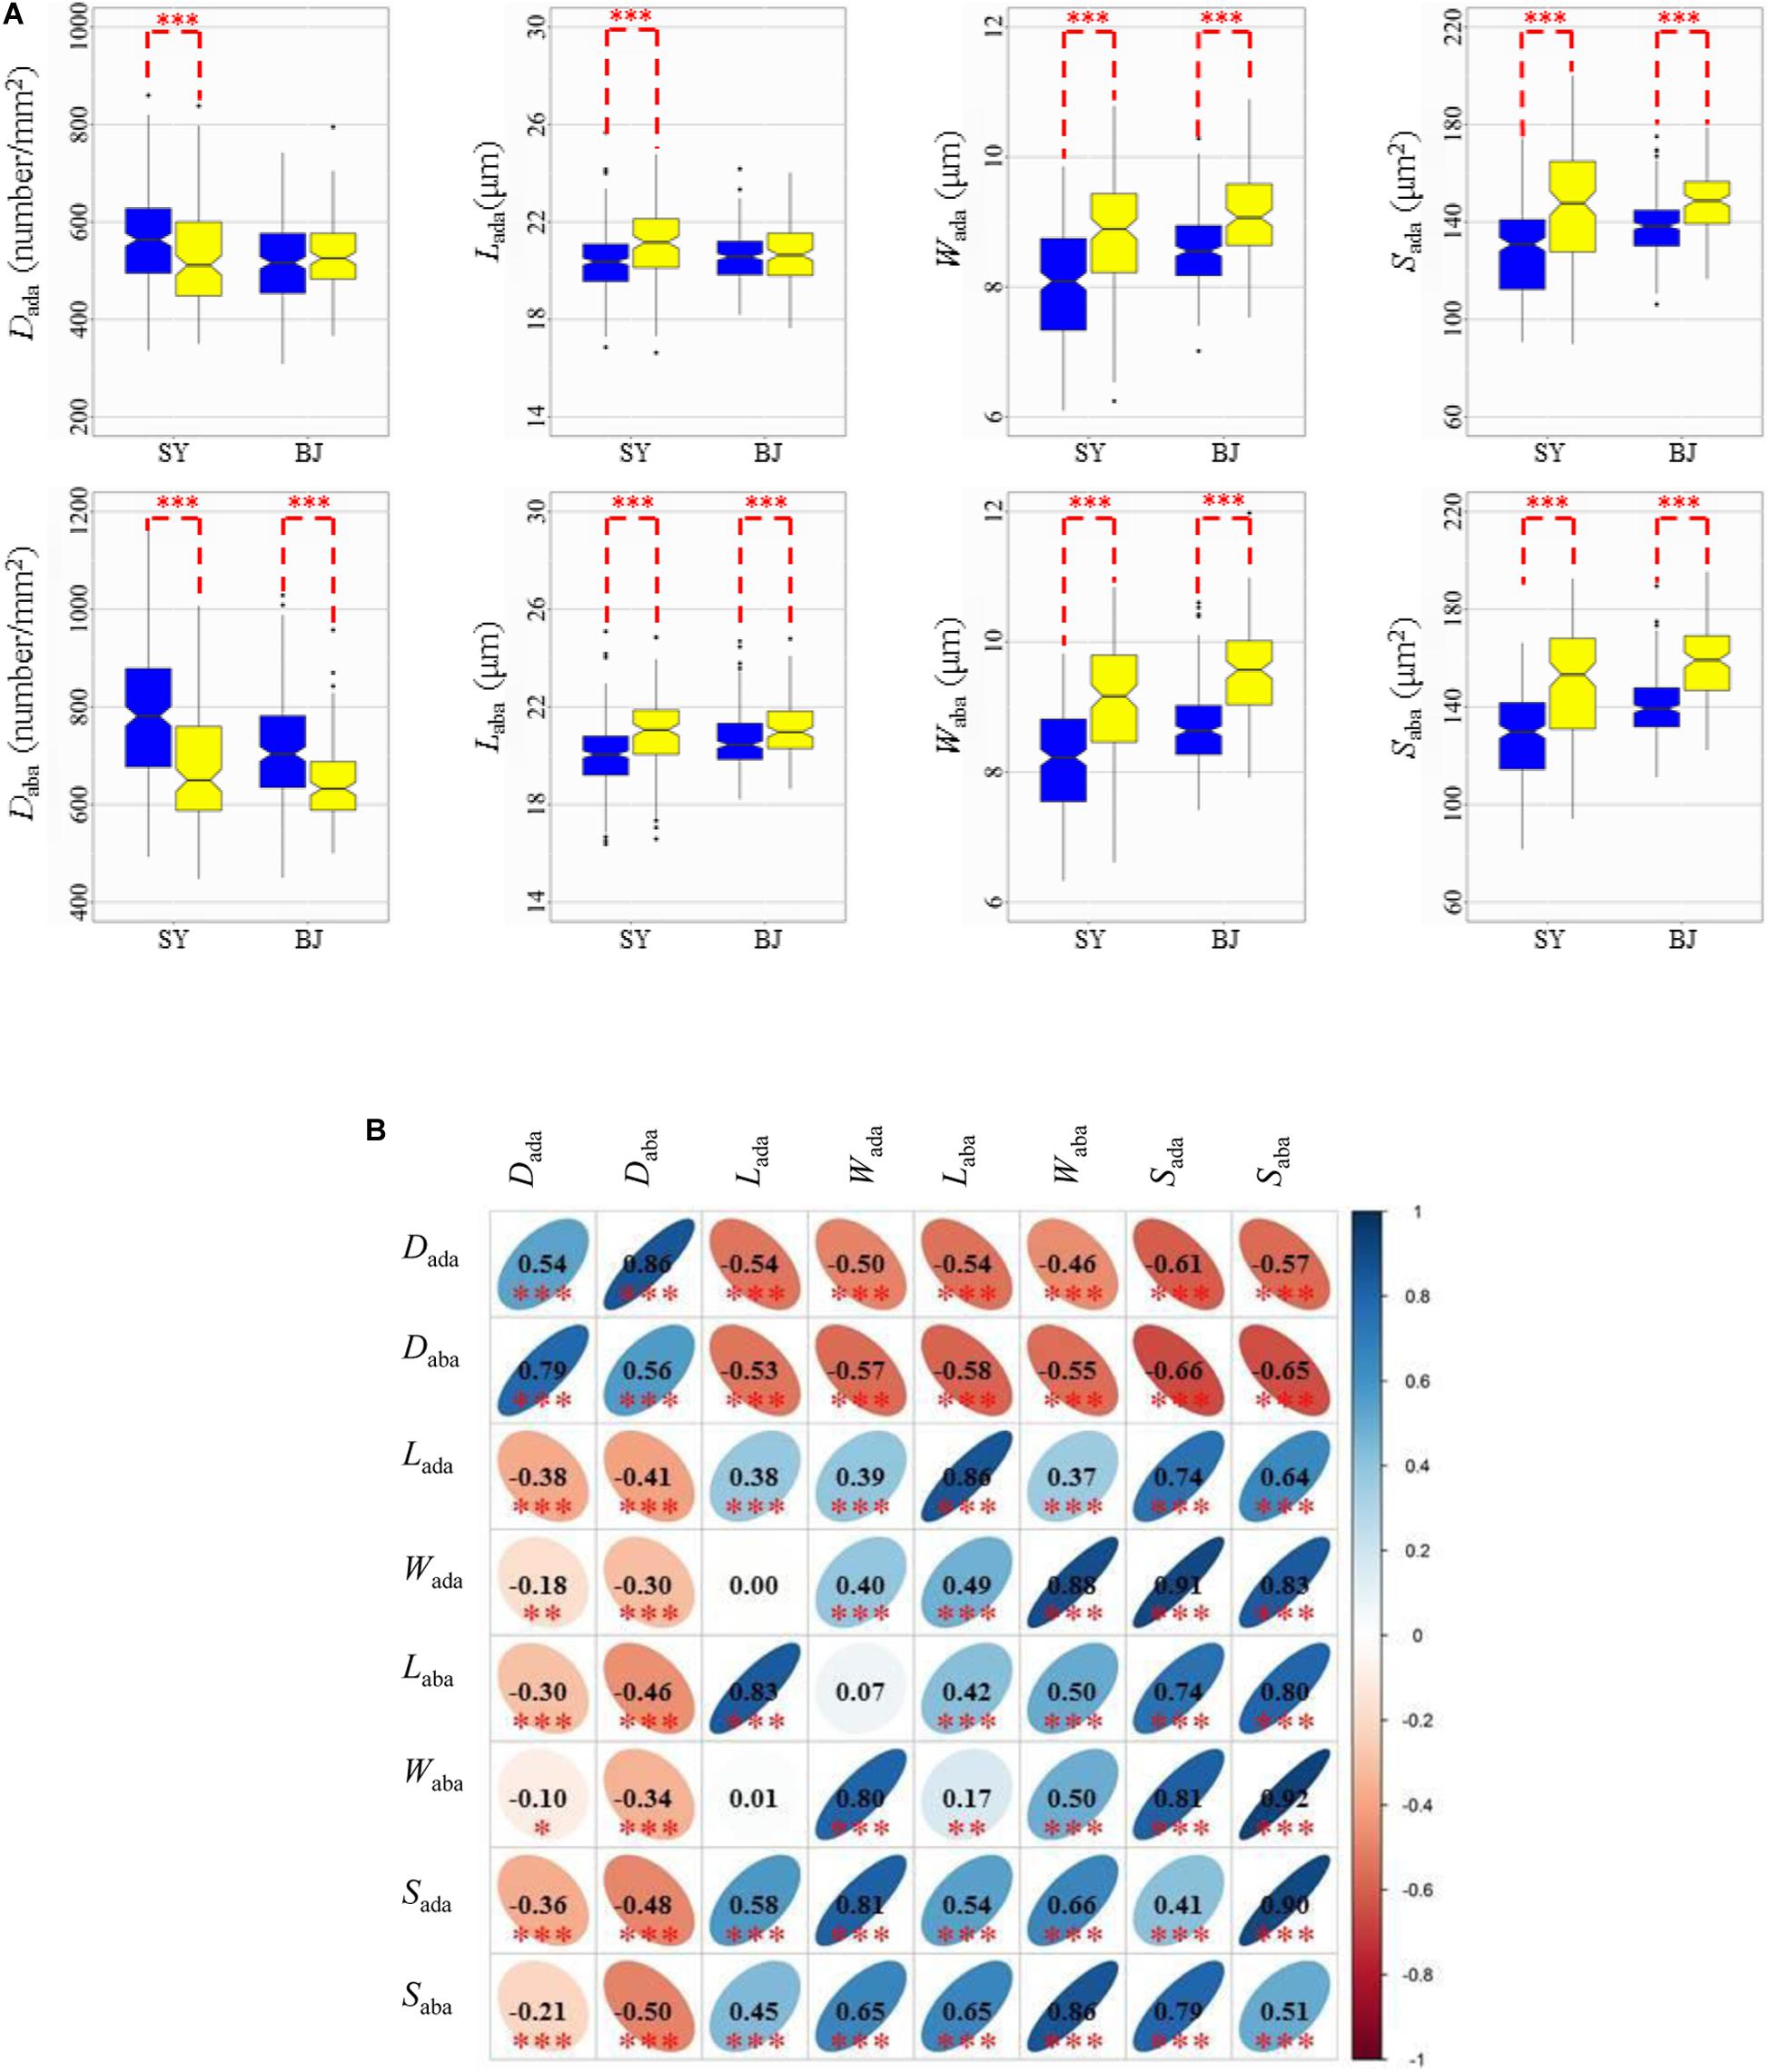
Figure 1. Values and correlations of stomata-related traits in two environments. (A) Box plots of eight stomata-related traits in Sanya (SY) and Beijing (BJ) between xian and geng rice (Oryza sativa L.) panels. Blue and yellow colors indicate xian and geng, respectively. ***Denotes significance of Student’s t-test at P < 0.001. Dada, stomatal density on the adaxial surface; Daba, stomatal density on the abaxial surface; Lada, guard cell length on the adaxial surface; Laba, guard cell length on the abaxial surface; Wada, guard cell width on the adaxial surface; Waba, guard cell width on the abaxial surface; Sada, stomatal size on the adaxial surface; Saba, stomatal size on the abaxial surface. (B) Correlations between the eight tested traits in SY (upper diagonal) and BJ (lower diagonal). The values are correlation coefficients (r) multiplied by 100. The values on the main diagonal are correlations between SY and BJ. The areas and colors of ellipses correspond to absolute values of the corresponding r. Right and left oblique ellipses indicate positive and negative correlations, respectively. Values without glyphs were insignificant at the 0.05 probability level. *, **, *** Indicate significant correlations at P < 0.05, P < 0.01, and P < 0.001, respectively.
In the two environments, the trends of pairwise phenotypic correlations were similar. Phenotypic correlations analysis demonstrated that significantly positive correlations of D and S could be observed between the abaxial and adaxial leaf surfaces. The D value had strong negative correlations with S for the abaxial and adaxial leaf surfaces. As expected, S showed significant positive correlations with its corresponding component traits (L and W) on the two sides of the leaves in the two environments (Figure 1B).
Basic Statistics of Markers
A total of 2,936,762 high density SNPs with minor allele frequencies greater than 5% and missing rates of less than 20% were used in this study. The number of markers per chromosome varied from 168,424 on chromosome 9 to 359,991 on chromosome 1. The size of the chromosomes ranged from 22.9 Mb for chromosome 9 to 43.3 Mb for chromosome 1. The whole genome size was 372.9 Mb, with an average marker spacing of 127.8 bp, which ranged from 108.8 bp on chromosome 10 to 152.2 bp on chromosome 5 (Supplementary Table S3).
Identification of QTLs for Stomata-Related Traits by GWAS
Total of 723 and 570 significant SNPs associated with stomata-related traits on the adaxial and abaxial surfaces were identified on 12 chromosomes, respectively, in SY and BJ (Table 1 and Supplementary Figure S3). Adjacent significantly associated SNPs located in one estimated linkage disequilibrium (LD) block were defined as one QTL. Thus, a total of 64 QTLs were identified for the eight traits in the two environments (Table 1), including 34 QTLs detected only in SY, 18 detected only in BJ, and 12 detected simultaneously in both environments, including five (qDada1, qDada2.1, qDada2.2, qDada4, and qDada6), one (qWada7), two (qSada2.2 and qSada4.2), one (qDaba2.1), one (qWaba7), and two (qSaba4.2 and qSaba7.1) for Dada, Wada, Sada, Daba, Waba, and Saba, respectively.
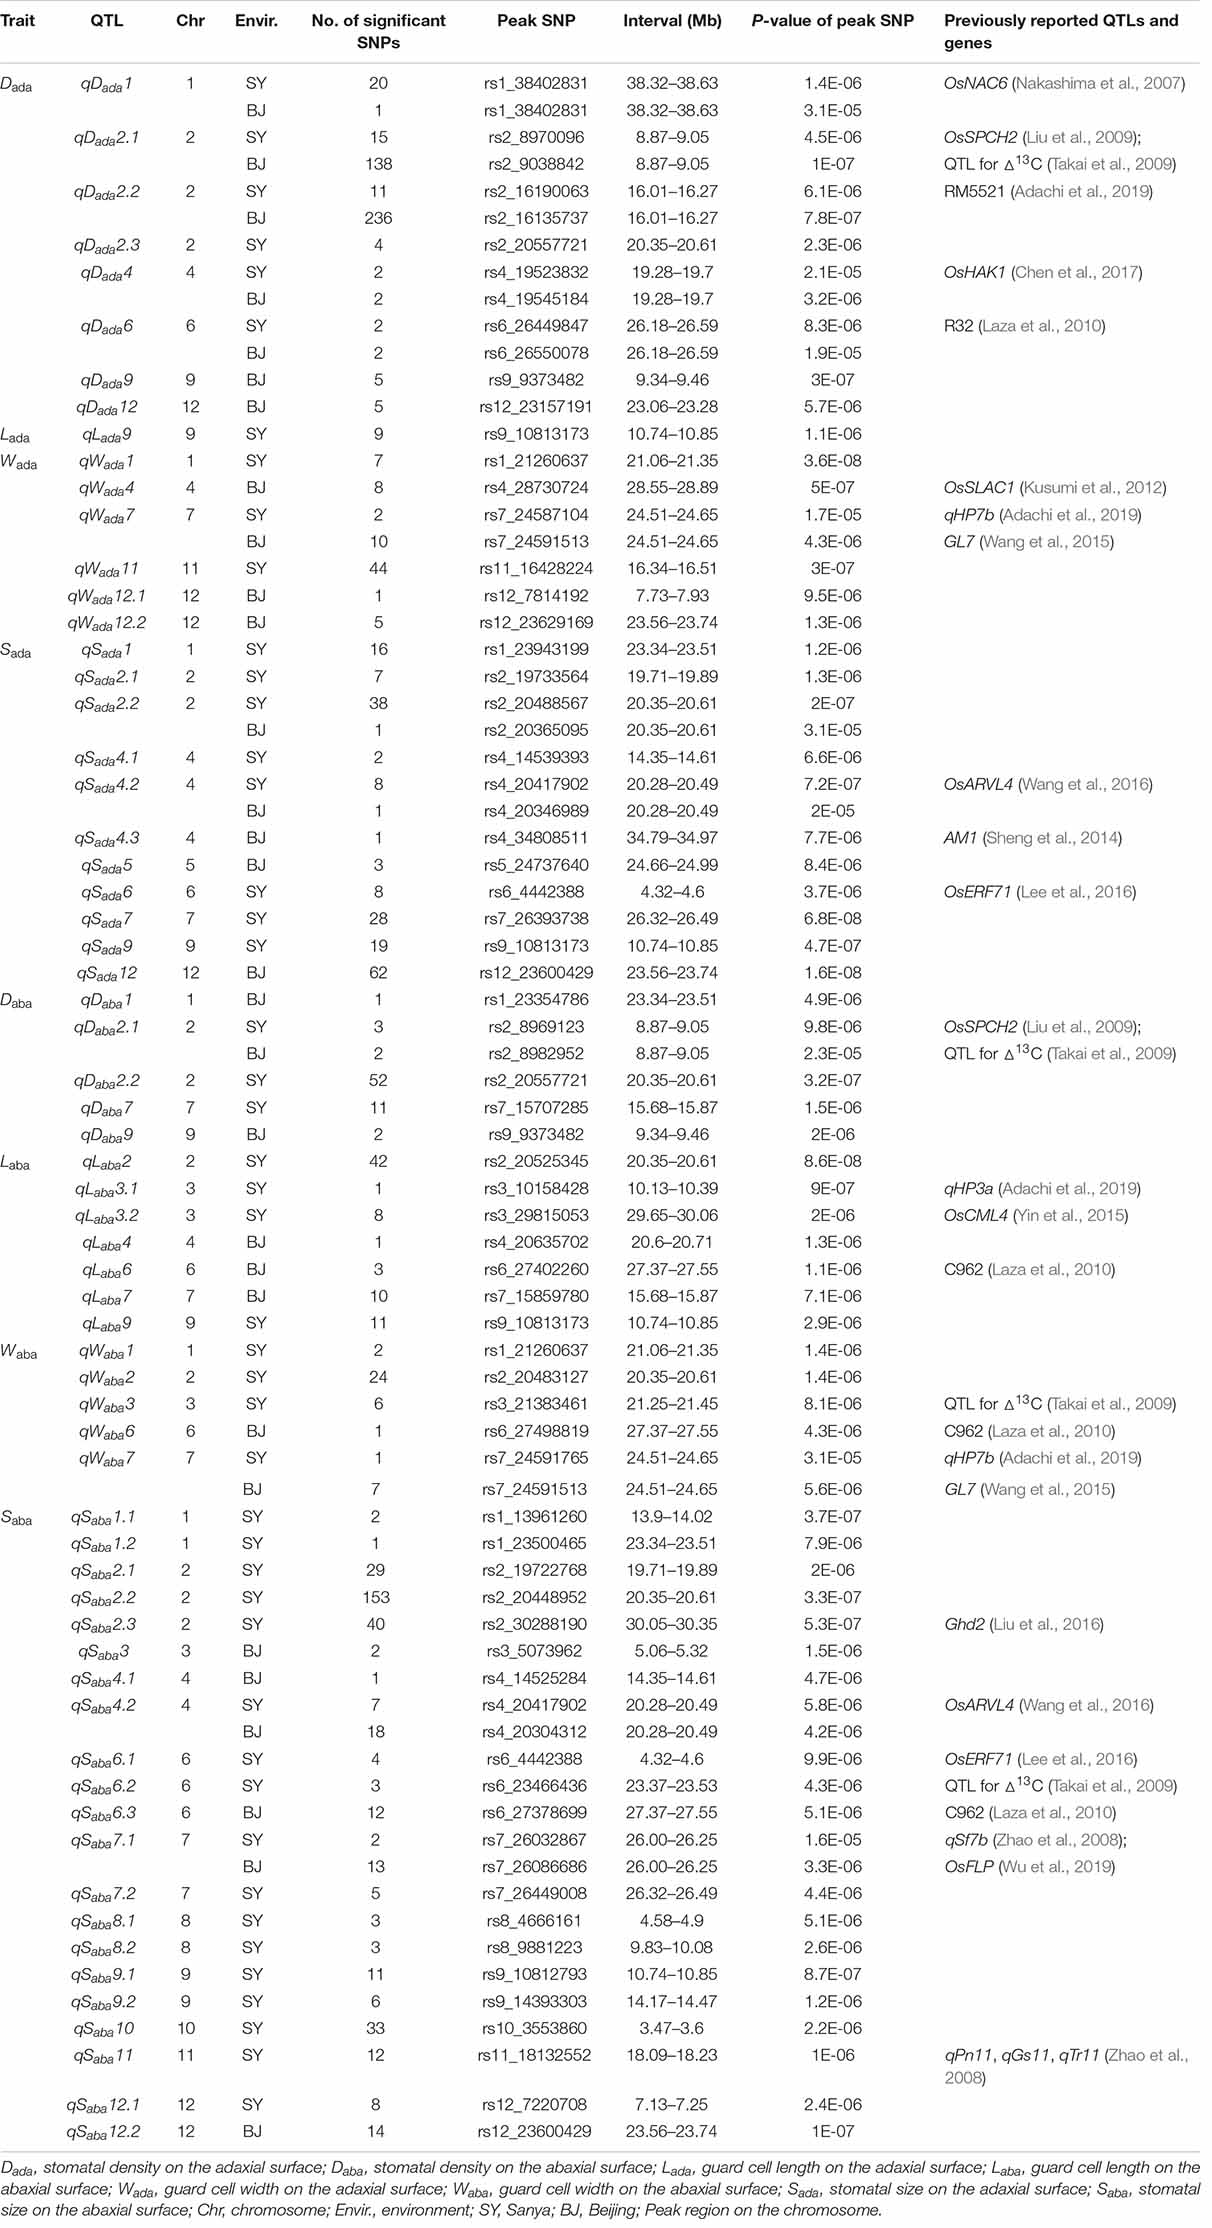
Table 1. QTLs identified for stomata-related traits by GWAS in two environments.
Coincidence of QTLs for Stomata-Related Traits on Adaxial and Abaxial Leaf Surfaces
Comparisons of 26 QTLs affecting stomata-related traits at the adaxial surface with 38 QTLs at the abaxial surface demonstrated that 12 QTL regions were simultaneously detected for the same stomata-related traits at both leaf surfaces in the same environment. These regions included two regions (8.87–9.05 Mb on chromosome 2 harboring qDada2.1 and qDaba2.1, and 9.34–9.46 Mb on chromosome 9 harboring qDada9 and qDaba9) for D, six regions (23.34–23.51 Mb on chromosome 1 harboring qSada1 and qSaba1.2, 19.71–19.89 Mb on chromosome 2 harboring qSada2.1 and qSaba2.1, 20.28–20.49 Mb on chromosome 4 harboring qSada4.2 and qSaba4.2, 4.32–4.60 Mb on chromosome 6 harboring qSada6 and qSaba6.1, 26.32–26.49 Mb on chromosome 7 harboring qSada7 and qSaba7.2, and 23.56–23.74 Mb on chromosome 12 harboring qSada12 and qSaba12.2) for S, two regions (21.06–21.35 Mb on chromosome 1 harboring qWada1 and qWaba1, and 24.51–24.65 Mb on chromosome 7 harboring qWada7 and qWaba7) for W, one region (10.74–10.85 Mb on chromosome 9 harboring qLada9, qLaba9, qSaba9.1, and qSada9) affecting L and S, and one region (20.35–20.61 Mb on chromosome 2 harboring qDada2.3, qDaba2.2, qSada2.2, and qSaba2.2) for D and S (Figure 2), which probably explain the genetic basis of the significant correlations of stomata-related traits at the two leaf surfaces.
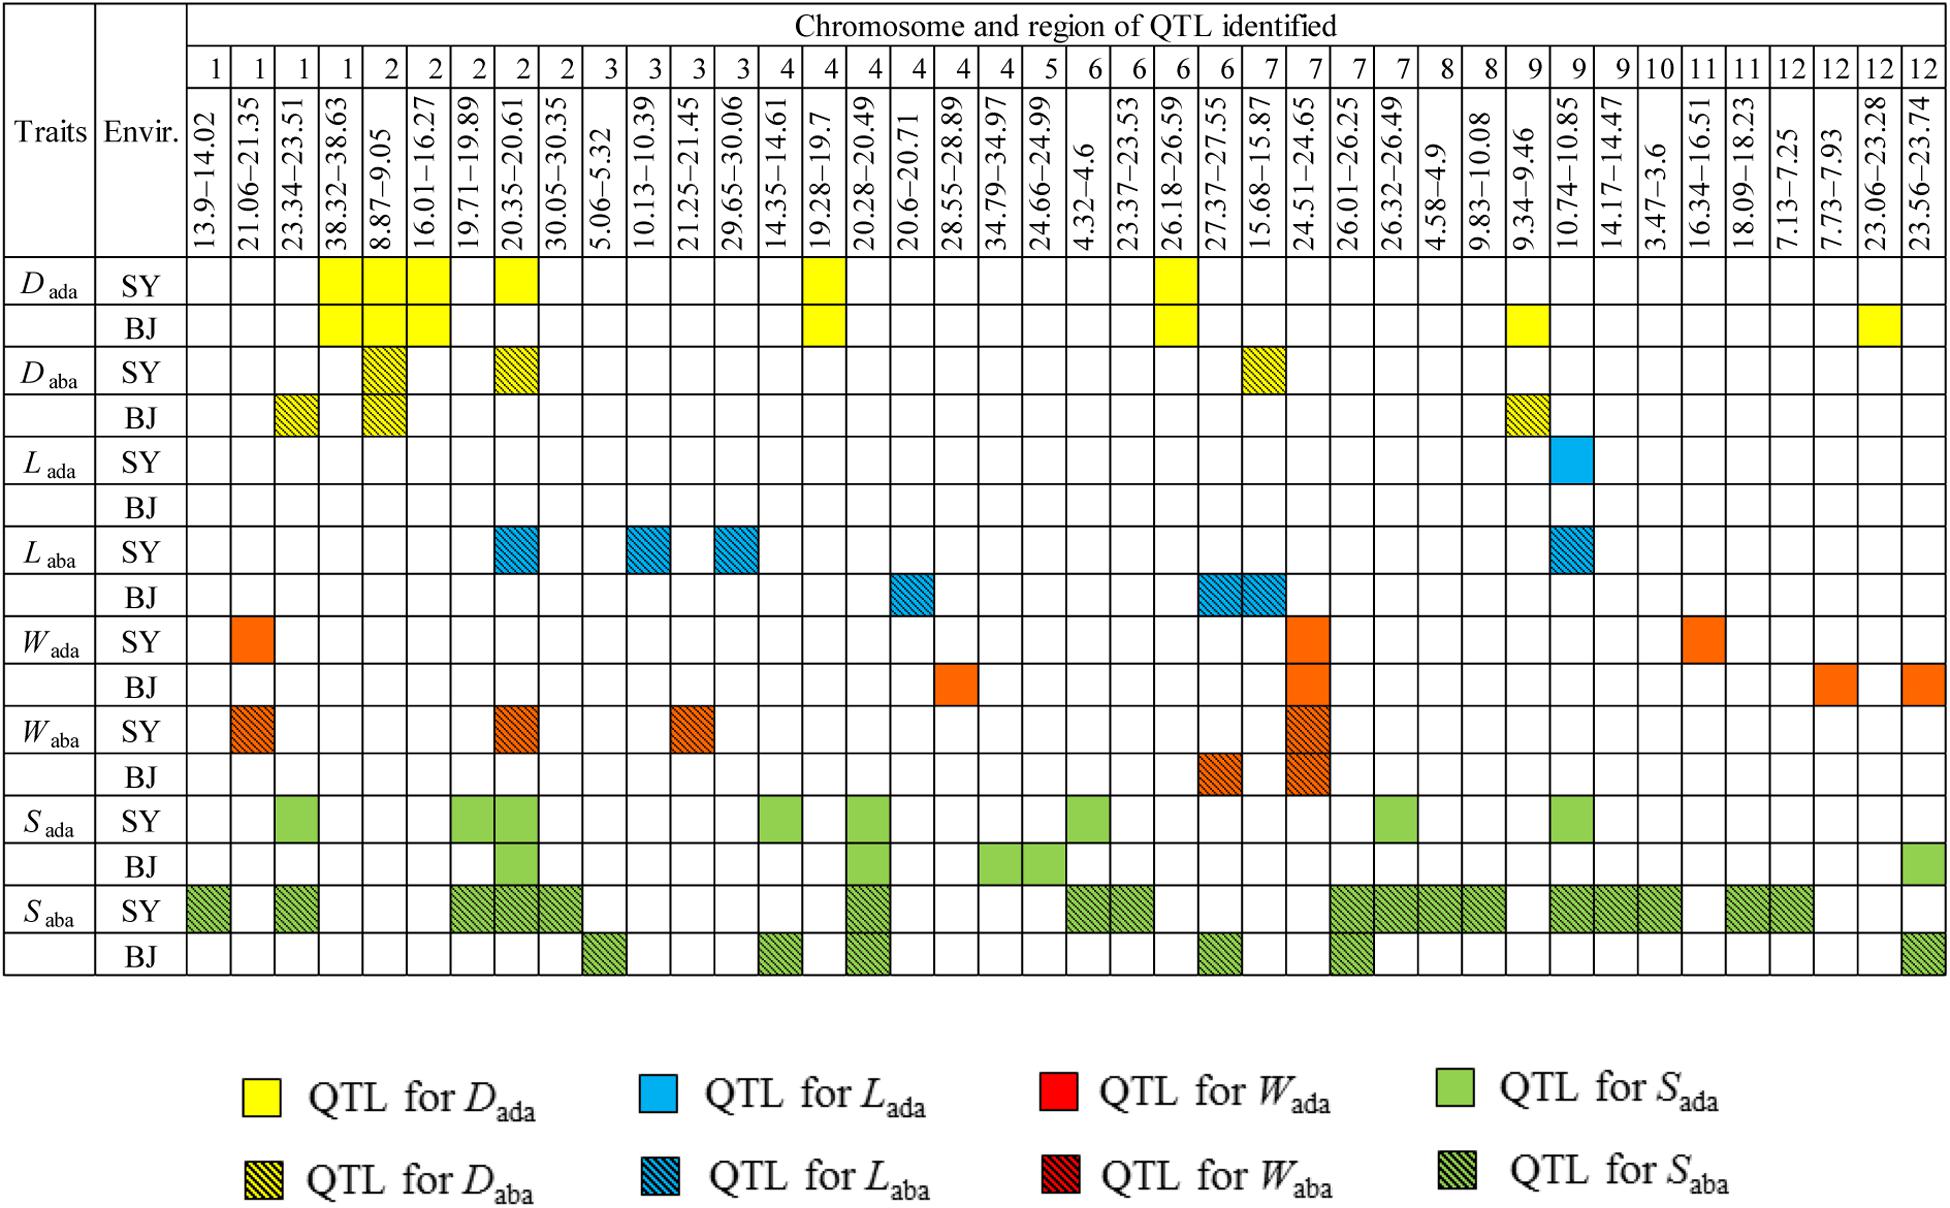
Figure 2. Distribution of quantitative trait loci (QTLs) associated with stomata-related traits on abaxial and adaxial leaf surfaces across the two environments on 12 chromosomes according to physical distance. Dada, stomatal density on the adaxial surface; Daba, stomatal density on the abaxial surface; Lada, guard cell length on the adaxial surface; Laba, guard cell length on the abaxial surface; Wada, guard cell width on the adaxial surface; Waba, guard cell width on the abaxial surface; Sada, stomatal size on the adaxial surface; Saba, stomatal size on the abaxial surface; Envir., environment; SY, Sanya; BJ, Beijing.
Candidate Gene Identification of the Important QTLs
For the eight stomata-related traits, we conducted haplotype analyses to identify candidate genes for the 12 QTLs consistently identified in the nine chromosomal regions across the two environments (Table 1). In addition, considering that the eight stomata-related traits were significantly different between xian and geng in the two environments, except Dada and Lada in BJ (Figure 1), we conducted haplotype analysis of the targeted genes associated with the eight stomata-related traits in whole population, and the xian and geng subpopulations. A total of 315 annotated genes located in the nine chromosomal regions were selected for haplotype analysis according to the Rice Annotation Project Database, and 64 genes were finally considered as candidate genes (Supplementary Table S4).
For Dada and Daba, haplotype analysis revealed 7, 9, 11, 5, and 5 candidate genes for qDada1, qDada2.1/qDaba2.1, qDada2.2, qDada4, and qDada6, respectively (Supplementary Table S4). In the region from 38.32 to 38.63 Mb on chromosome 1 harboring qDada1 (Figure 3A), 45 annotated genes were selected based on the Nipponbare reference genome IRGSP 1.0 for haplotype analysis with all non-synonymous SNPs inside of the gene coding regions in the whole, xian, and geng populations. Highly significant differences in Dada were detected among different haplotypes of the seven candidate genes (LOC_Os01g66120, LOC_Os01g66130, LOC_Os01g66180, LOC_Os01g66230, LOC_Os01g66240, LOC_Os01g66250, and LOC_Os01g66260) (Supplementary Table S4 and Figure 3). Among them, LOC_Os01g66120 is identical to OsNAC6, which is a member of the NAC transcription factor gene family in rice (Table 2; Nakashima et al., 2007). Three haplotypes were found at OsNAC6 and the frequencies of them were significantly associated with the rice subpopulations according to Fisher’s exact tests (Supplementary Table S5). Haplotype (Hap) 1 (CT) exhibited significantly higher Dada than Hap3 (CC) in the whole and xian populations in the two environments (Figures 3B,C). In addition, 87.9% of the accessions with the high-Dada Hap1 (n = 211) and 84.6% of the accessions with the low-Dada Hap3 (n = 33) belonged to the xian subpopulation (Figure 3D). OsNAC6 is relatively highly expressed in specific organs (leaf blade, ovary, embryo, and endosperm) according to a publicly available rice gene expression profile database [RiceXPro (version 3.0)] (Figure 3E). In the region from 8.87 to 9.05 Mb on chromosome 2 harboring qDada2.1 and qDaba2.1 (Figure 4A), highly significant differences in the mean Dada and Daba were detected among different haplotypes of the nine candidate genes (Supplementary Table S4 and Figure 4). Among them, LOC_Os02g15760 is identical to a SPCH transcriptional factor gene OsSPCH2, which regulates the initiation of stomatal lineage, as previously reported (Liu et al., 2009; Wu et al., 2019; Table 2). Haplotype analysis revealed that Hap2 was significantly associated with larger Daba and Daba than Hap3 in the xian population (Figures 4B,C). In contrast, 63.3% of the accessions with the high-Dada Hap2 and 95.1% of the accessions with the low-Dada Hap3 belonged to the xian subpopulation (Figure 4D). The frequency distributions of Hap3 significantly differed between the xian and geng subgroups, whereas the frequency distributions of Hap2 did not significantly differ between the xian and geng subgroups (Supplementary Table S5). In addition, 11, 5, and 5 candidate genes for qDada2.2, qDada4, and qDada6, respectively, were identified with significant differences in the mean Dada among the different haplotypes based on haplotype analysis (Supplementary Table S4).
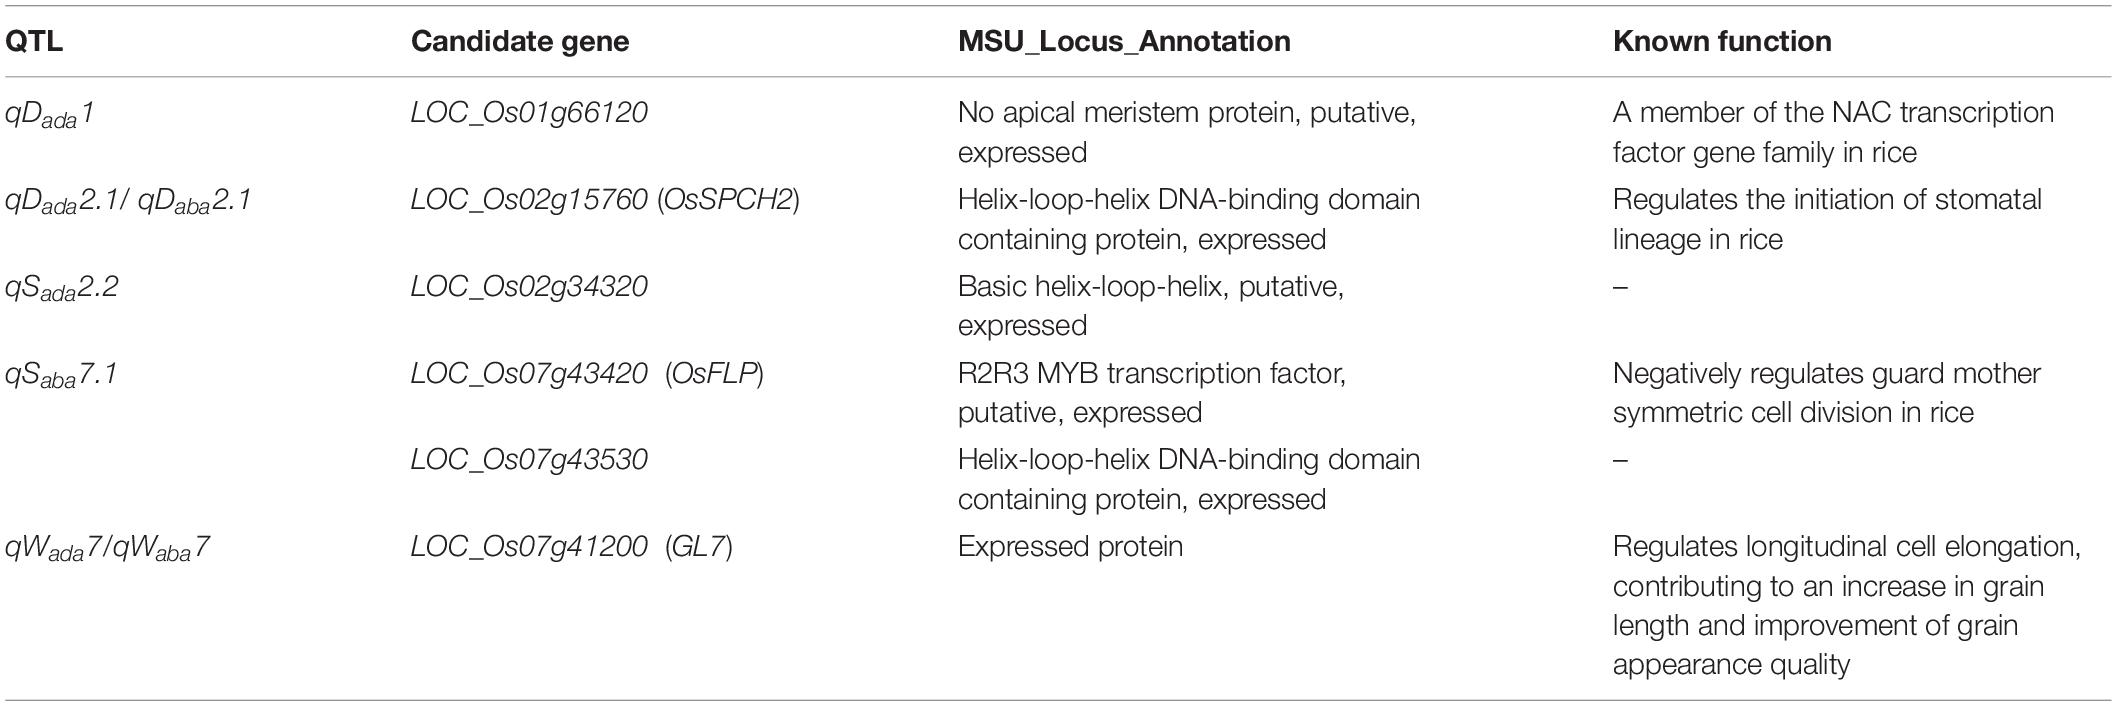
Table 2. List of six the most likely candidate genes for five important quantitative trait loci (QTLs) associated with stomata-related traits.
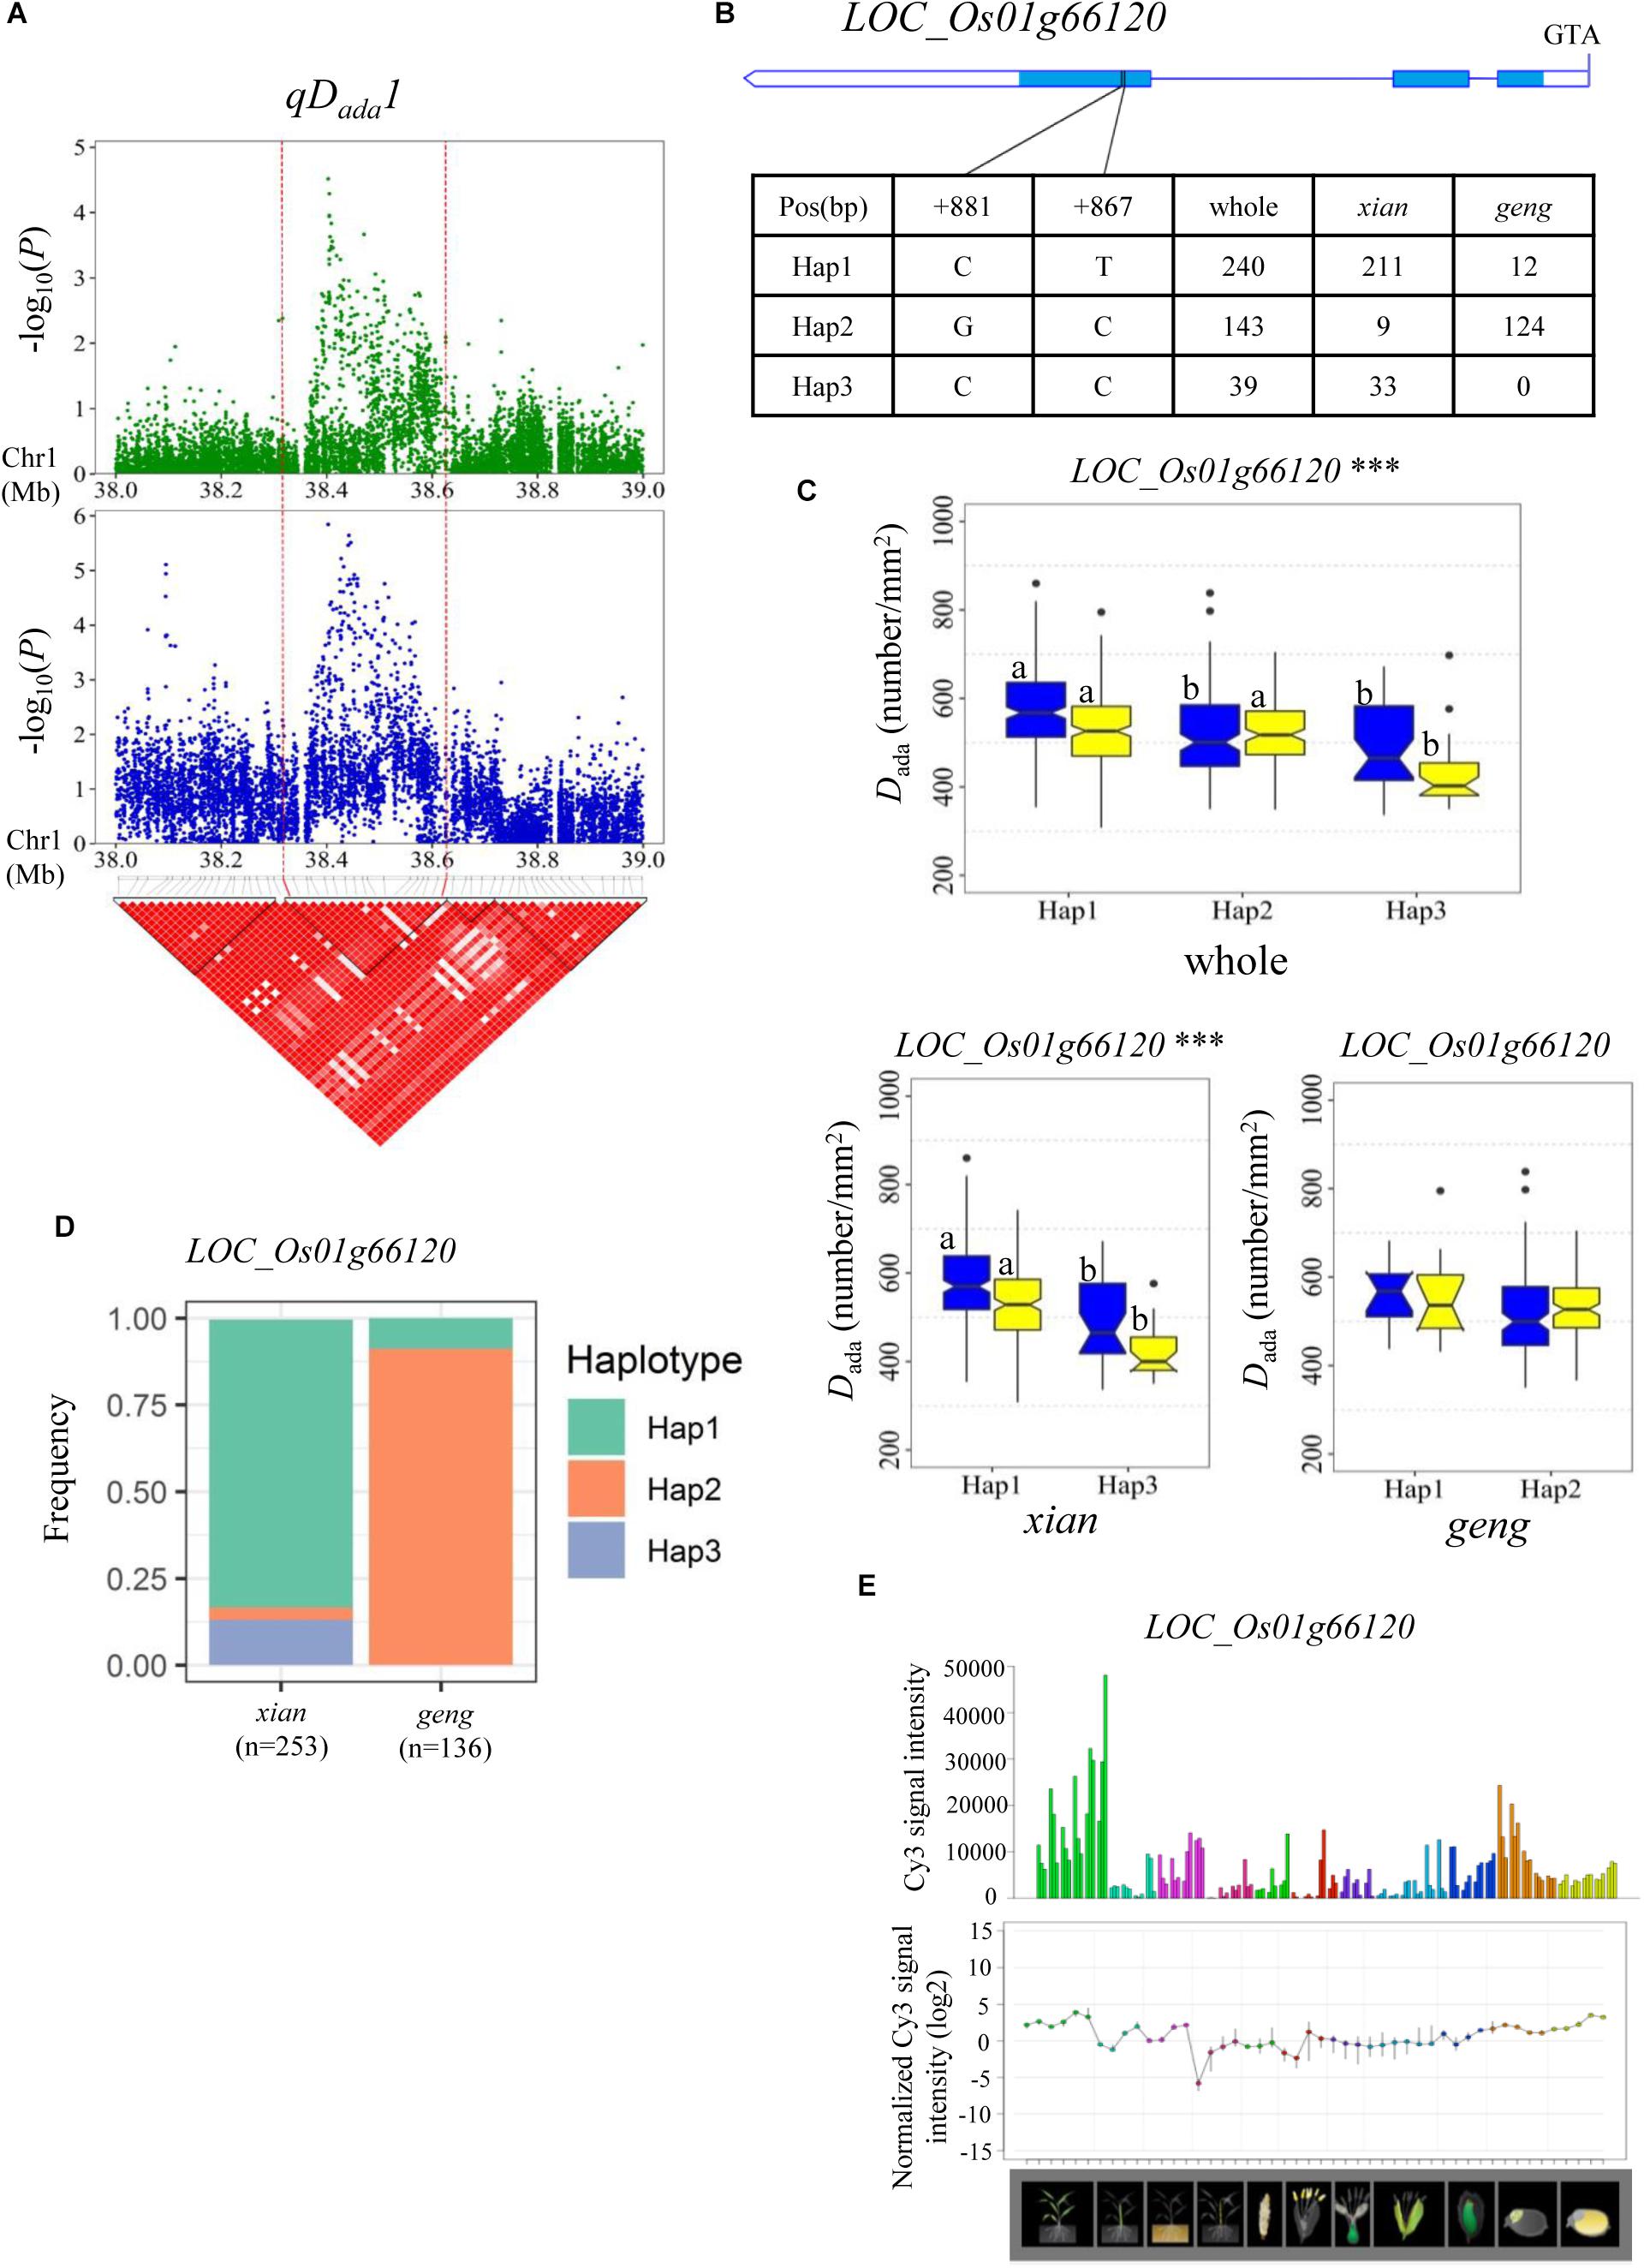
Figure 3. Haplotype analyses of the LOC_Os01g66120 candidate gene for the Dada at qDada1. (A) Linkage disequilibrium (LD) block surrounding the peak on chromosome 1. Dashed lines indicate the candidate region for the peak. (B) Gene structure of LOC_Os01g66120 and DNA polymorphisms in that gene. (C) Boxplots for stomatal density on the adaxial surface (Dada) based on haplotypes for LOC_Os01g66120 using non-synonymous single nucleotide polymorphisms (SNPs) within the coding region in the whole, xian, and geng populations. ***Denotes the significance of ANOVA at P < 0.001. Letters on histograms (a and b) are ranked by Duncan’s test at P < 0.05. Blue and yellow colors indicate Sanya and Beijing, respectively. (D) Frequencies of different haplotypes of the LOC_Os01g66120 in xian and geng subpopulations. (E) Spatio-temporal expression of LOC_Os01g66120 in various Nipponbare tissues throughout the entire growth period in the field [downloaded from RiceXPro (version 3.0)].
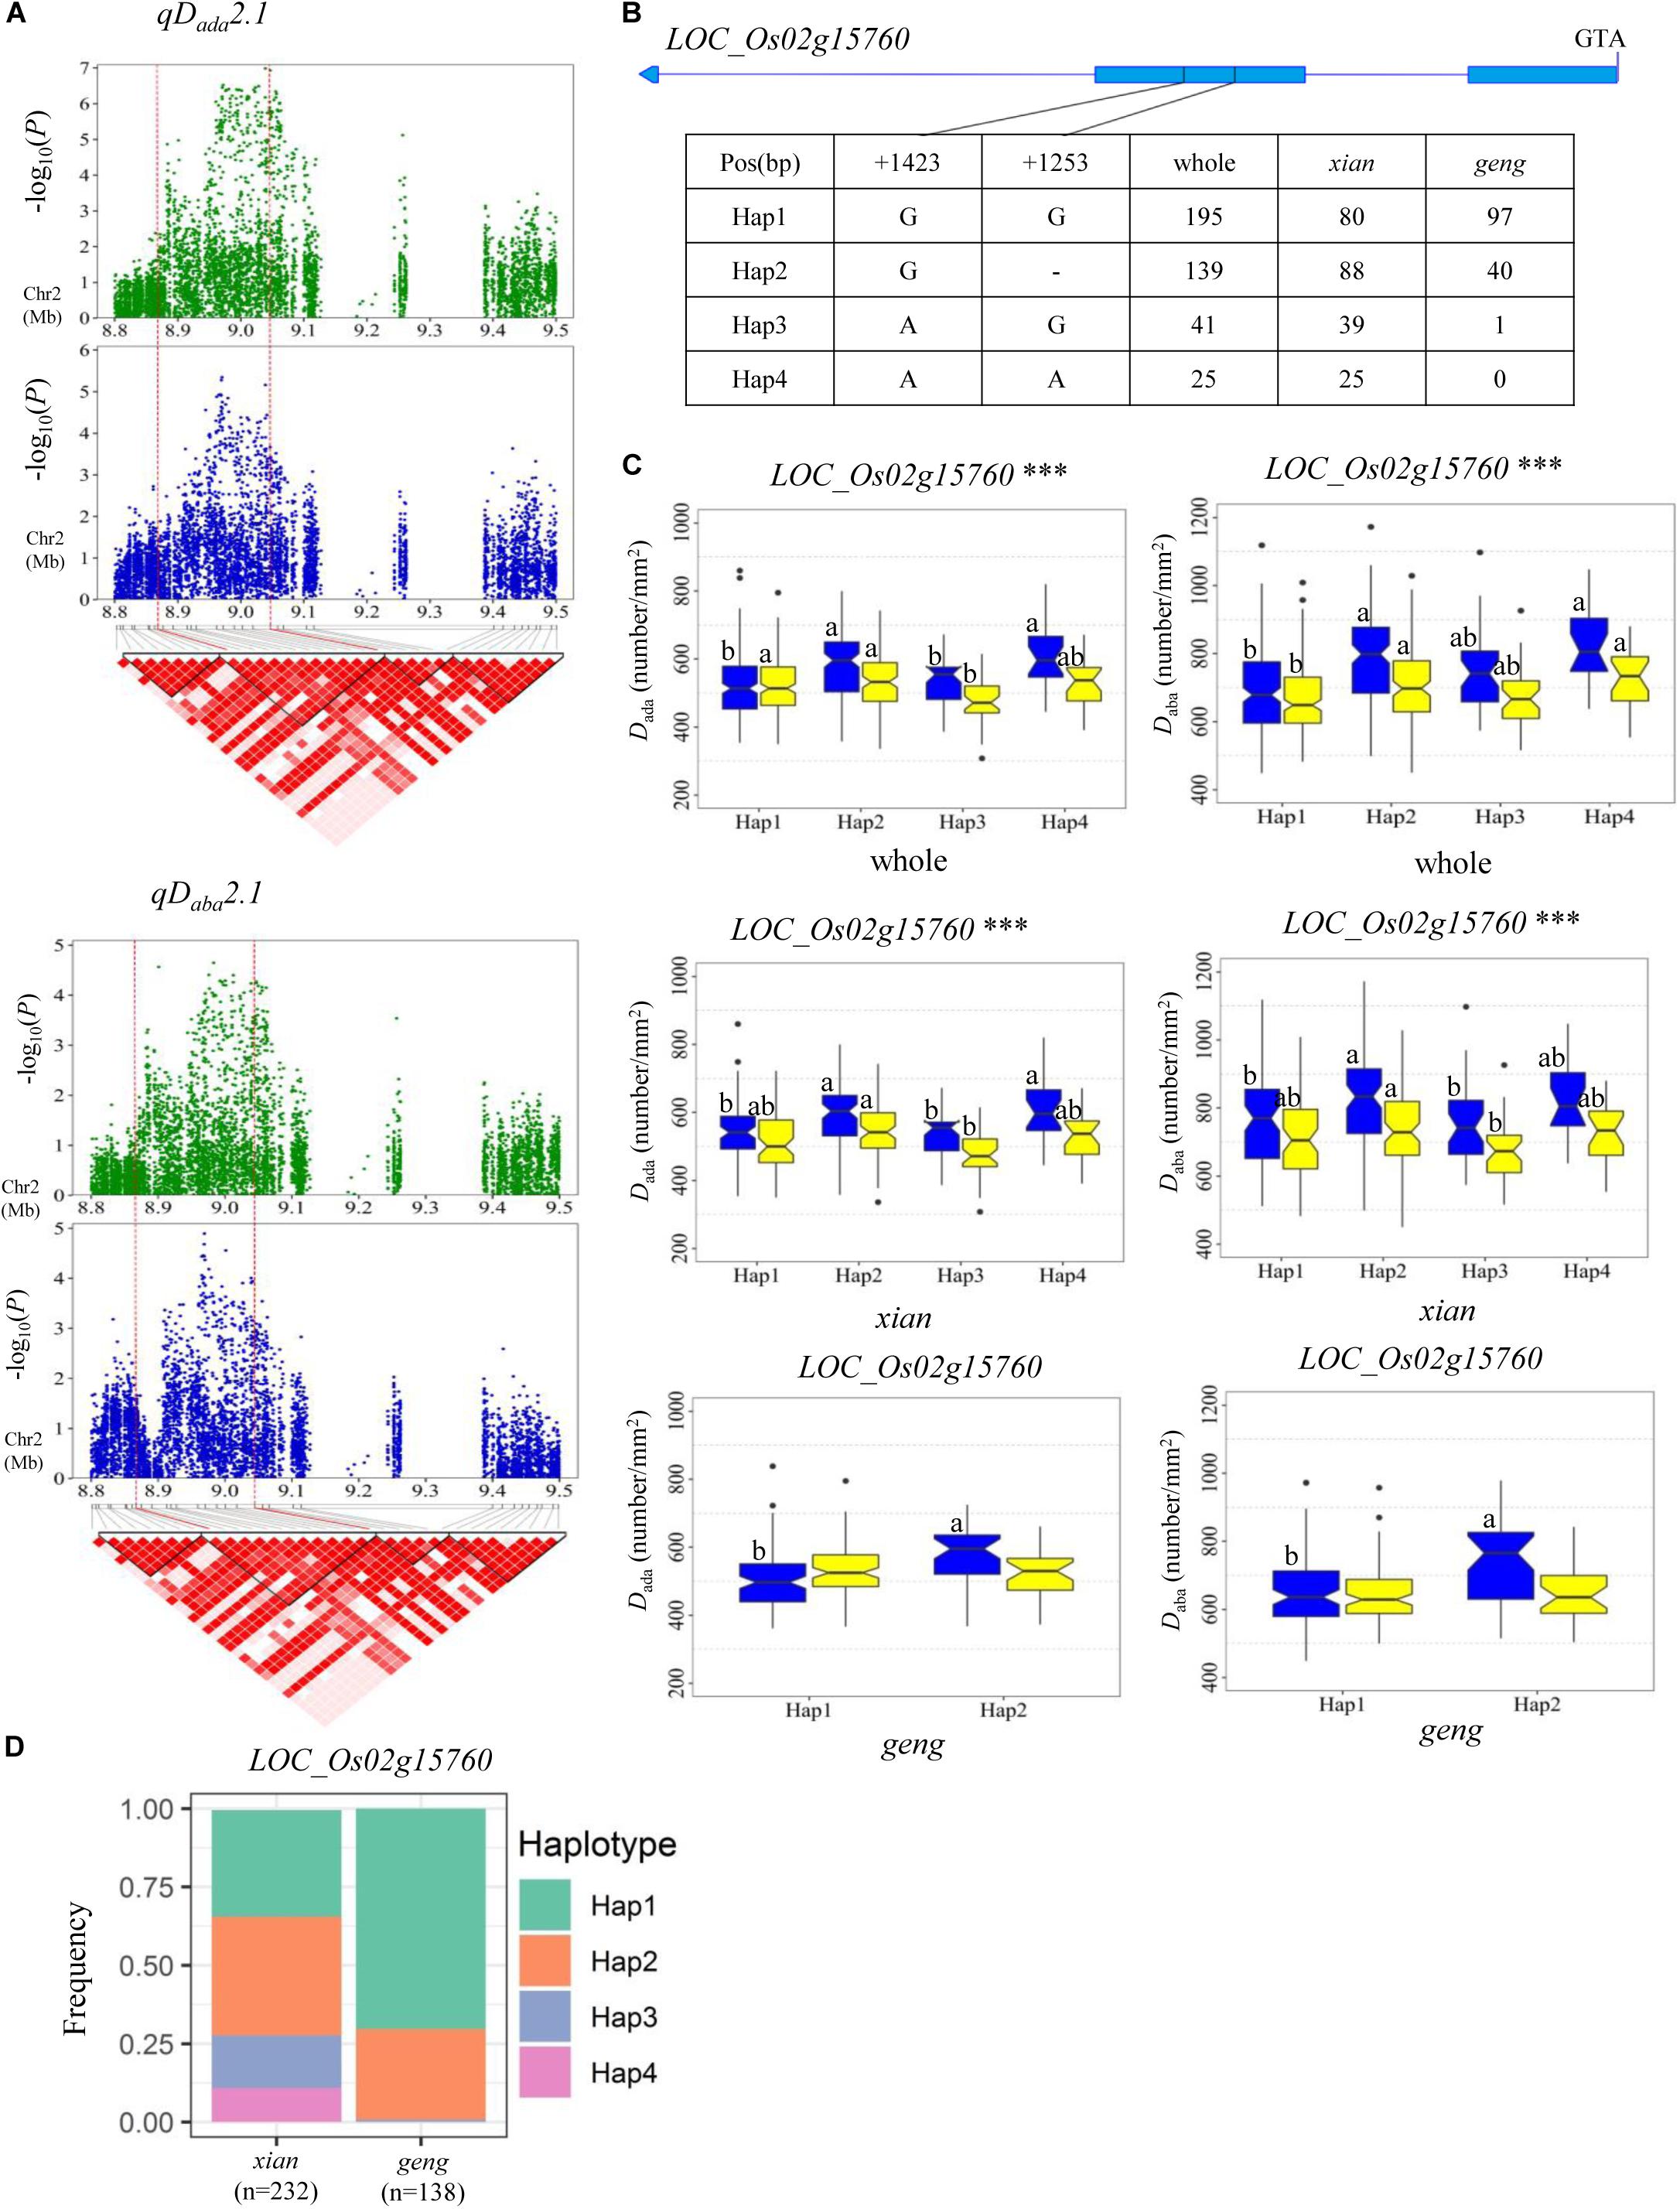
Figure 4. Haplotype analyses for the Dada and Daba of the LOC_Os02g15760 candidate gene at qDada2.1 and qDaba2.1. (A) Linkage disequilibrium (LD) block surrounding the peak on chromosome 2. Dashed lines indicate the candidate region for the peak. (B) Gene structure of LOC_Os02g15760 and DNA polymorphisms in that gene. (C) Boxplots for stomatal density on the adaxial surface (Dada) and the abaxial surface (Daba) based on haplotypes for the LOC_Os02g15760 using non-synonymous SNPs within the coding region in the whole, xian, and geng populations. ***Denotes the significance of ANOVA at P < 0.001. Letters on histograms (a and b) are ranked by Duncan’s test at P < 0.05. Blue and yellow colors indicate Sanya and Beijing, respectively. (D) Frequencies of different haplotypes of LOC_Os02g15760 in xian and geng subpopulations.
For Wada and Waba, a high peak of qWada7 on chromosome 7 was mapped together with the peak of qWaba7. A total of 19 annotated genes were selected from the region of 24.51–24.65 Mb (140 kb) (Figure 5A), and 11 candidate genes were identified with significant differences in the mean Wada and Waba among the different haplotypes (Supplementary Table S4 and Figure 5). Among them, LOC_Os07g41200 is identical to Grain Length on Chromosome 7 (GL7), which regulates longitudinal cell elongation, contributing to an increase in grain length and improvement of grain appearance quality (Wang et al., 2015; Table 2). Hap3 showed significantly larger Wada and Waba values than Hap1 and Hap2 in the whole and xian populations (Figures 5B,C). We determined that 82.3% of the accessions with high-Waba Hap3 belonged to the geng subpopulation, whereas 65.5 and 96.4% with low-Waba Hap1 and Hap2, respectively, belonged to the xian subpopulation (Figure 5D). The frequency distributions of Hap2 and Hap3 significantly differed between the xian and geng subgroups, whereas the frequency distribution of Hap1 did not significantly differ between the two subgroups (Supplementary Table S5). GL7 is relatively highly expressed in some specific organs except leaf blade, embryo, and endosperm according to rice gene expression profile database [RiceXPro (version 3.0)] (Figure 5E).
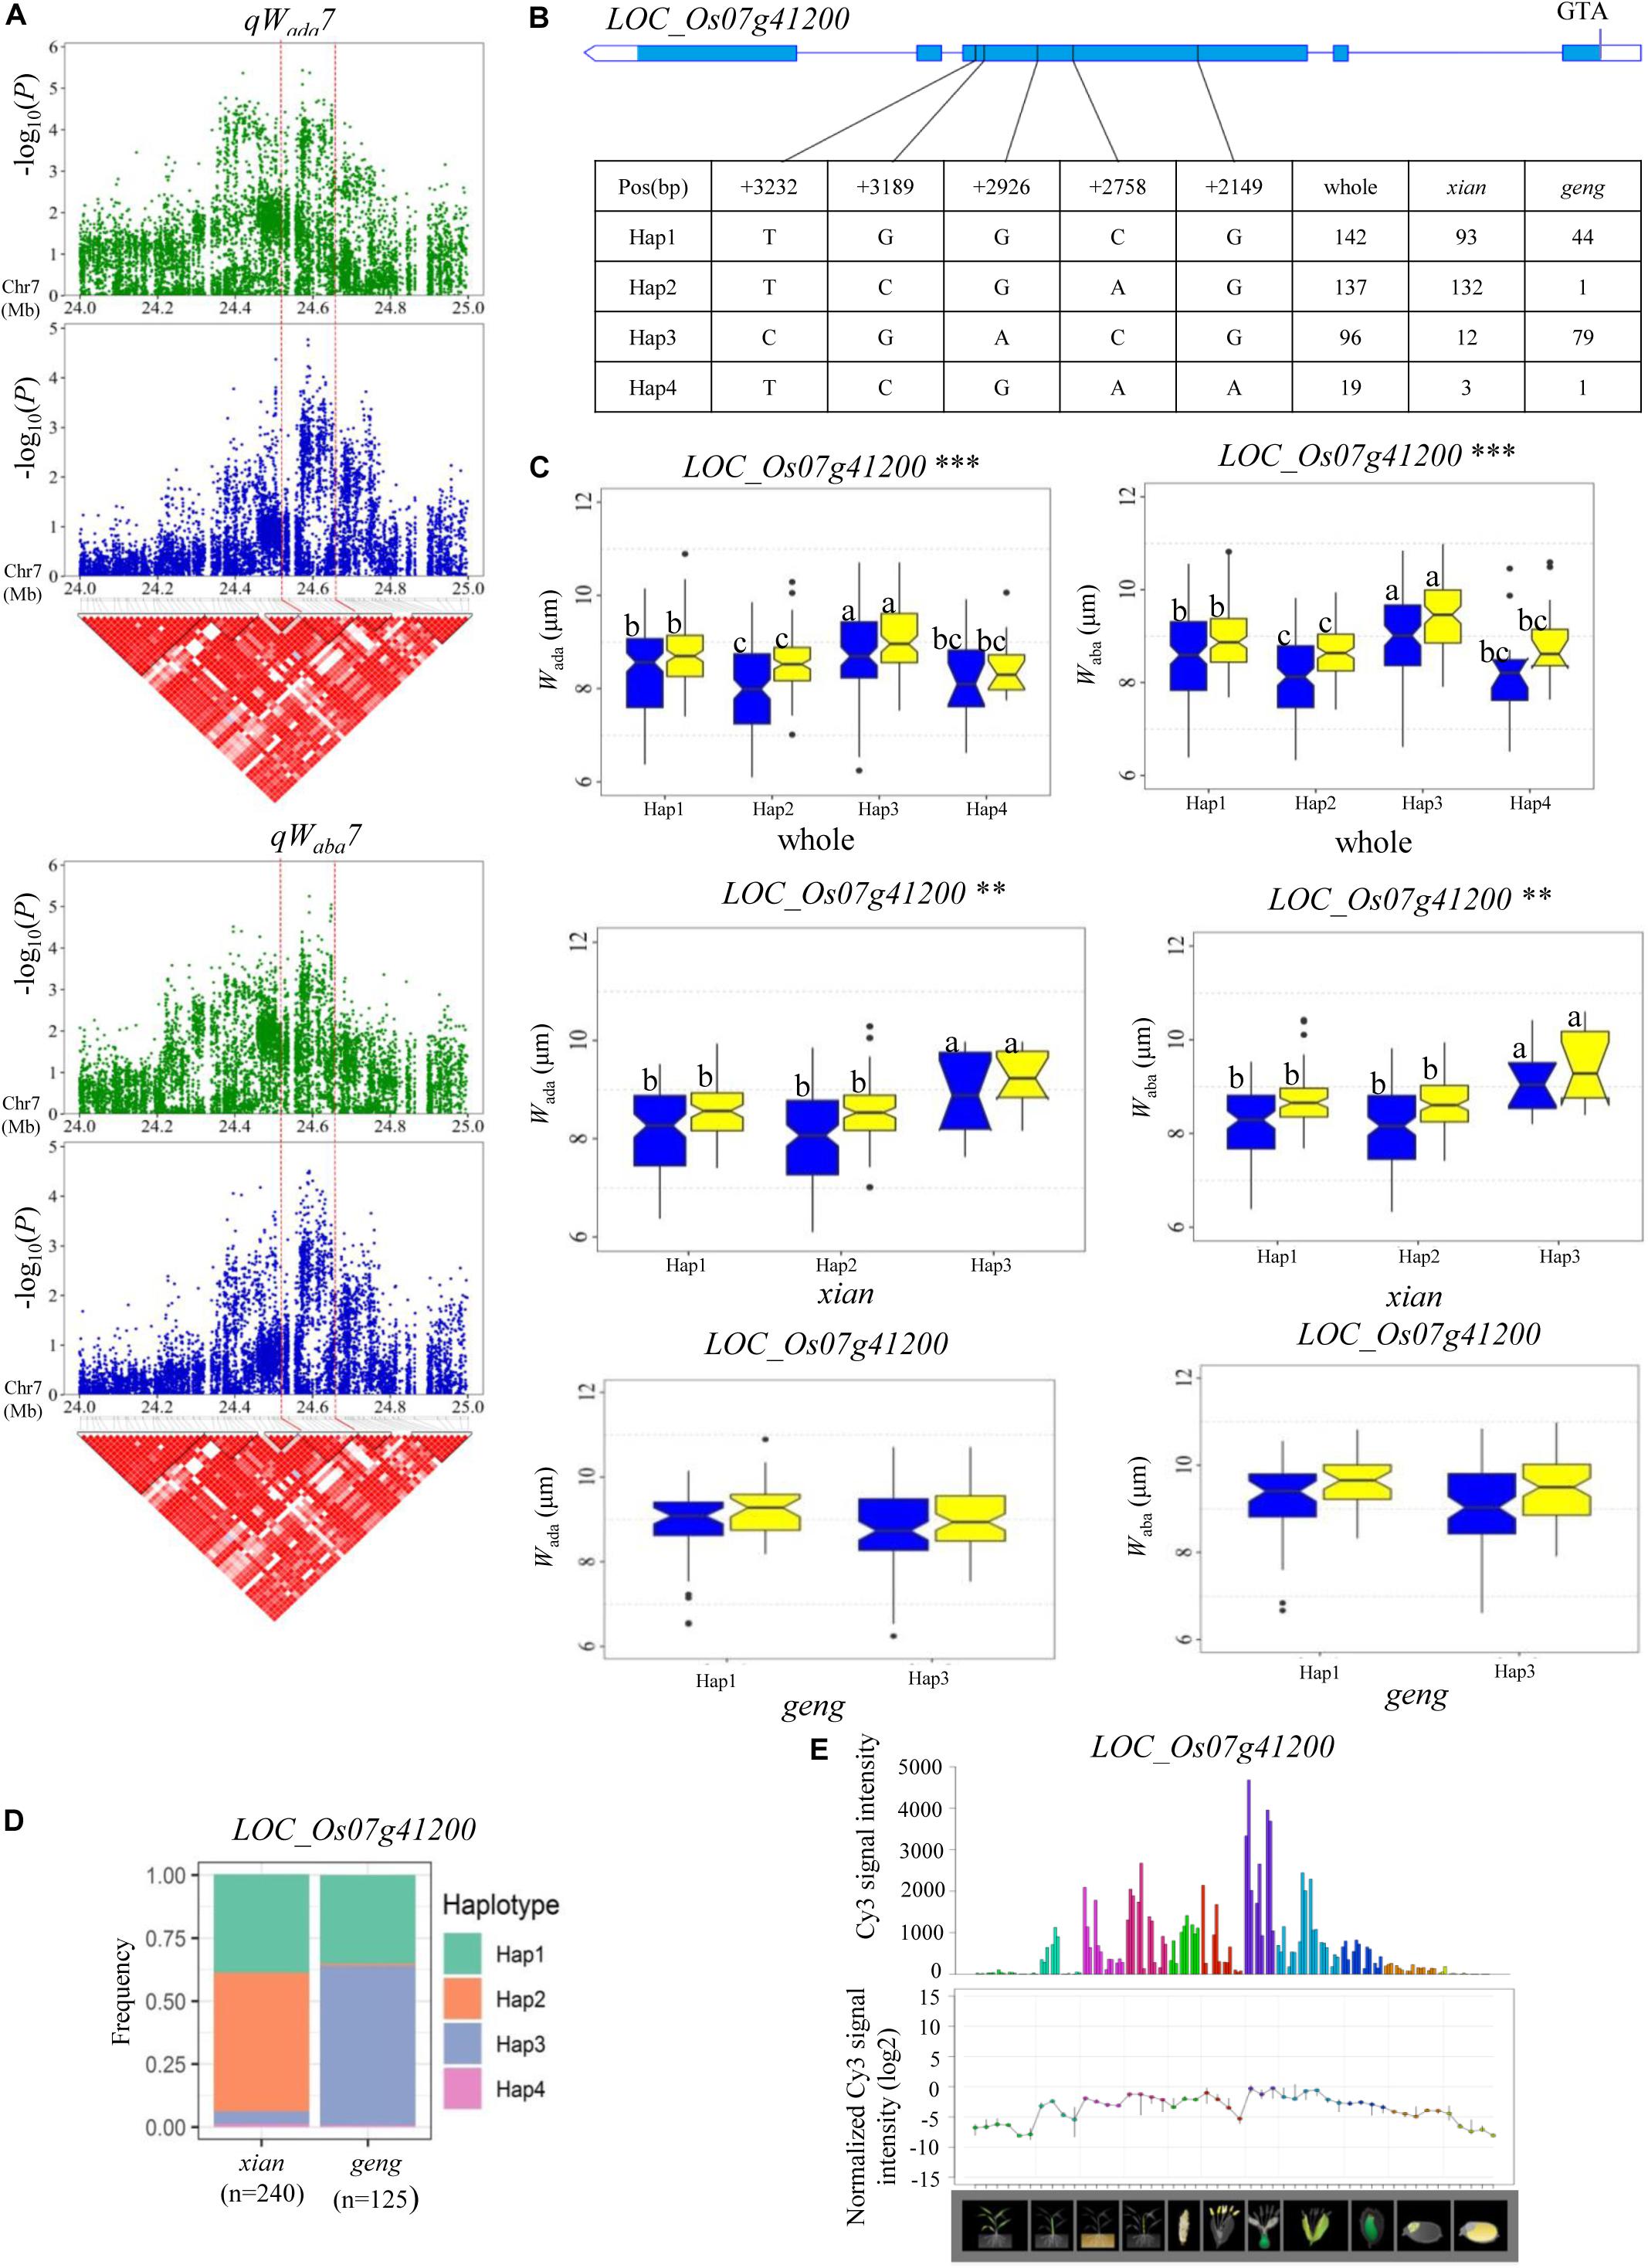
Figure 5. Haplotype analyses for the Wada and Waba of the LOC_Os07g41200 candidate gene at qWada7 and qWaba7. (A) Linkage disequilibrium (LD) block surrounding the peak on chromosome 7. Dashed lines indicate the candidate region for the peak. (B) Gene structure of LOC_Os07g41200 and DNA polymorphisms in that gene. (C) Boxplots for guard cell width on the adaxial surface (Wada) and the abaxial surface (Waba) based on haplotypes for LOC_Os07g41200 using non-synonymous SNPs within the coding region in the whole, xian, and geng populations. ** and ***denotes the significance of ANOVA at P < 0.01 and P < 0.001, respectively. Letters on histograms (a, b, and c) are ranked by Duncan’s test at P < 0.05. Blue and yellow colors indicate Sanya and Beijing, respectively. (D) Frequencies of different haplotypes of LOC_Os07g41200 in xian and geng subpopulations. (E) Spatio-temporal expression of LOC_Os07g41200 in various Nipponbare tissues throughout the entire growth period in the field [downloaded from RiceXPro (version 3.0)].
Regarding Sada and Saba, haplotype analysis revealed that four, eight, and four candidate genes were identified for qSada2.2, qSada4.2/qSaba4.2, and qSaba7.1, respectively (Supplementary Table S4). QSada2.2 was identified in the region of 20.35–20.61 Mb on chromosome 2 (Figure 6A), which contains 33 annotated genes. Four candidate genes (LOC_Os02g34260, LOC_Os02g34270, LOC_Os02g34320, and LOC_Os02g34410) were detected with significant differences in the mean Sada among the different haplotypes (Supplementary Table S4 and Figure 6). Among them, LOC_Os02g34320 encodes a basic helix-loop-helix protein (Table 2). Five haplotypes were detected at LOC_Os02g34320 and the frequency distributions of them significantly differed between the xian and geng subgroups (Supplementary Table S5). Hap2 exhibited a significantly higher Sada value than the other four haplotypes in the whole population (Figures 6B,C). 84.5% of the accessions with the high-Sada Hap2 belonged to the geng subpopulation, 88, 87.1, and 96% of the accessions with the low-Sada Hap1, Hap4 and Hap5, respectively, all belonged to the xian subgroup, and 87.8% of the accessions with the low-Sada Hap3 belonged to the geng subpopulation (Figure 6D). Moreover, Hap2 showed a significantly higher Sada value than Hap3 in the xian population in both environments (Figure 6C).
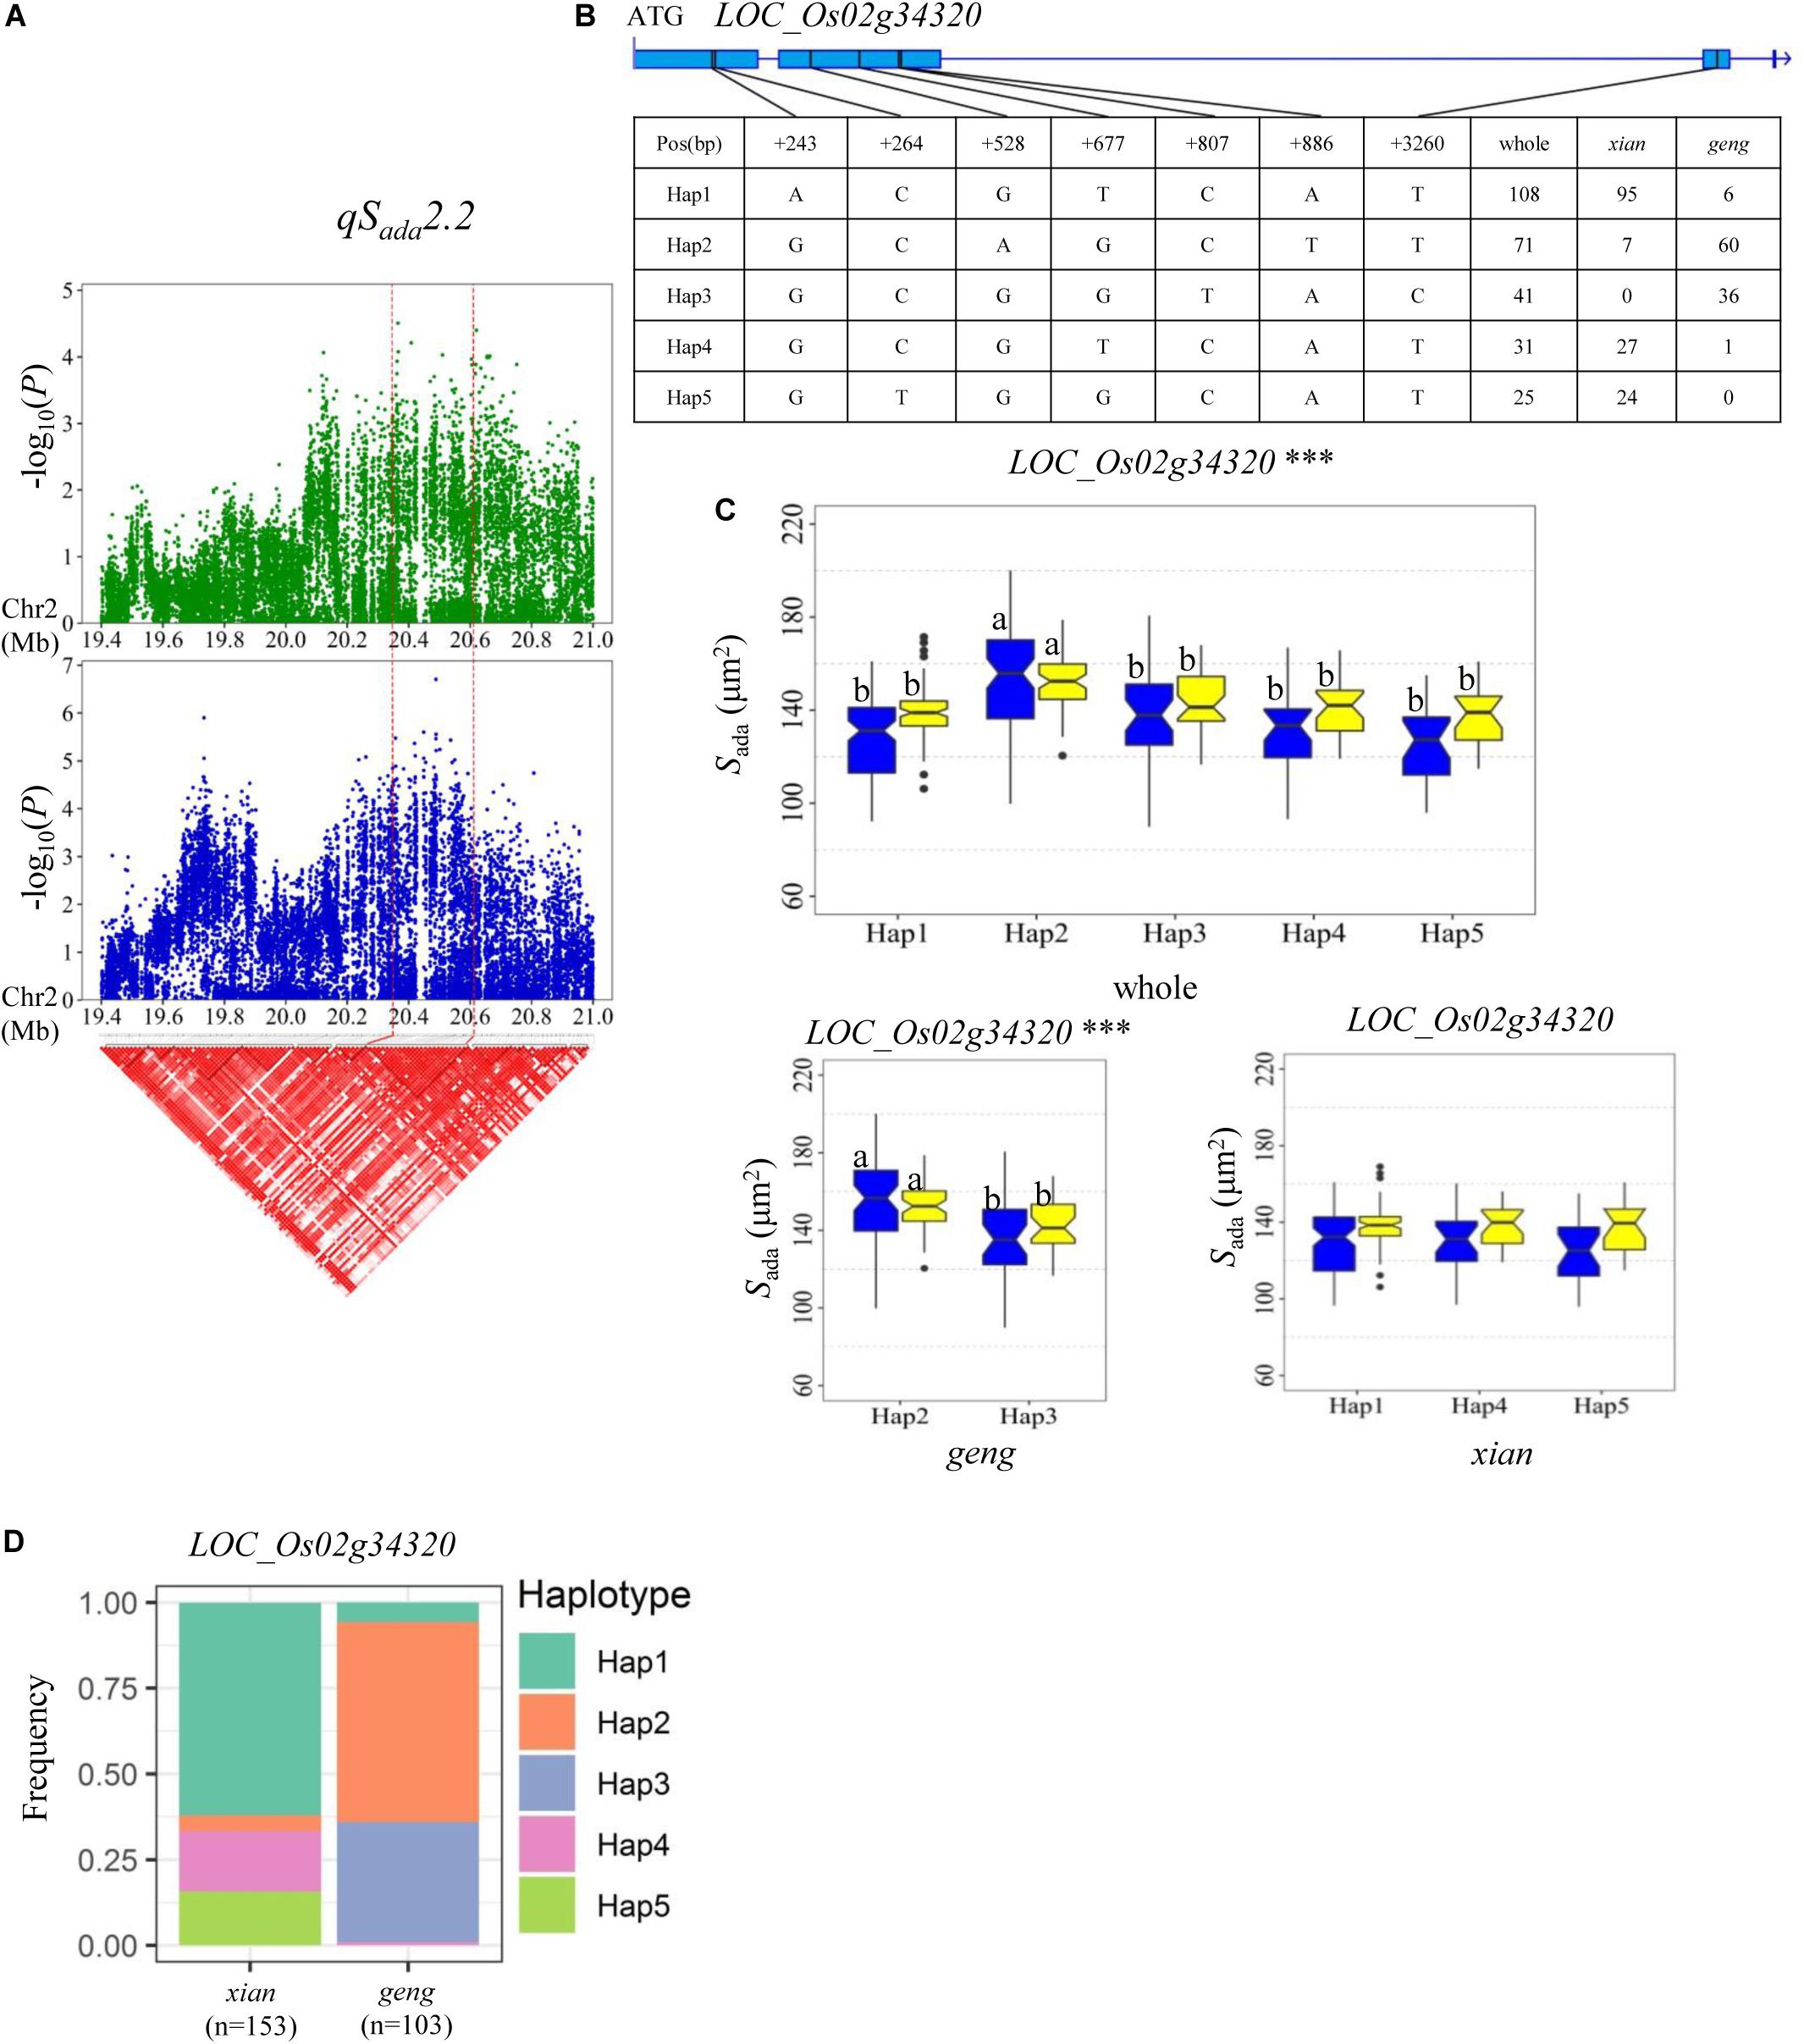
Figure 6. Haplotype analyses for Sada of LOC_Os02g34320 candidate gene at qSada2.2. (A) Linkage disequilibrium (LD) block surrounding the peak on chromosome 2. Dashed lines indicate the candidate region for the peak. (B) Gene structure of LOC_Os02g34320 and DNA polymorphisms in that gene. (C) Boxplots for stomatal size on the adaxial surface (Sada) based on haplotypes for LOC_Os02g34320 using non-synonymous SNPs within the coding region in the whole, xian and geng populations. ***Denotes significance of ANOVA at P < 0.001. Letters on histograms (a and b) are ranked by Duncan’s test at P < 0.05. Blue and yellow colors indicate Sanya and Beijing, respectively. (D) Frequencies of different haplotypes of LOC_Os02g34320 in xian and geng subpopulations.
A QTL cluster (qSada4.2 and qSaba4.2) affecting Sada and Saba was identified in the region of 20.28–20.49 Mb on chromosome 4 in the two environments, containing 28 annotated genes. Among them, eight candidate genes (LOC_Os04g32160, LOC_Os04g32170, LOC_Os04g32200, LOC_Os04g32210, LOC_Os04g32320, LOC_Os04g32380, LOC_Os04g32480, and LOC_Os04g32570) were identified with significant differences in Sada and Saba values among the different haplotypes (Supplementary Table S4). In addition, qSaba7.1 was fine-mapped to the region of 26.00–26.25 Mb on chromosome 7 (Figure 7A) which harbored 39 annotated genes. Highly significant differences in Saba were detected among different haplotypes for four candidate genes (LOC_Os07g43420, LOC_Os07g43510, LOC_Os07g43530, and LOC_Os07g43580) (Supplementary Table S4 and Figure 7). Among them, LOC_Os07g43530 encodes a basic helix-loop-helix protein, while LOC_Os07g43420 is identical to OsFLP, which negatively regulates guard mother symmetric cell division in rice (Wu et al., 2019) (Table 2). Haplotype analysis of LOC_Os07g43420 revealed that Hap1 was significantly associated with a larger Saba value than Hap2 and Hap3 in the whole population (Figure 7B). The frequency distributions of these three haplotypes significantly differed between the xian and geng subgroups (Supplementary Table S5). Moreover, 79.6% of the accessions with the high-Saba Hap1 belonged to the geng subpopulation, whereas 95.4 and 91.9% of the accessions with the low-Saba Hap2 and Hap3, respectively, belonged to the xian subpopulation (Figure 7C). OsFLP is relatively highly expressed in some specific organs except endosperm based on rice gene expression profile database [RiceXPro (version 3.0)] (Figure 7D). For LOC_Os07g43530, Hap2 and Hap3 of LOC_Os07g43530 exhibited a significantly larger Saba value than Hap1 in the whole population (Figure 7E). The frequency distributions of these three haplotypes differed significantly between the rice subgroups (Supplementary Table S5). In contrast, 82.3 and 78.9% of the accessions with the low-Saba Hap2 and Hap3, respectively, belonged to the xian subpopulation, whereas 97.1% of the accessions with the high-Saba Hap1 belonged to the geng subpopulation (Figure 7F). LOC_Os07g43530 is relatively highly expressed in some specific organs except leaf blade according to rice gene expression profile database [RiceXPro (version 3.0)] (Figure 7G).
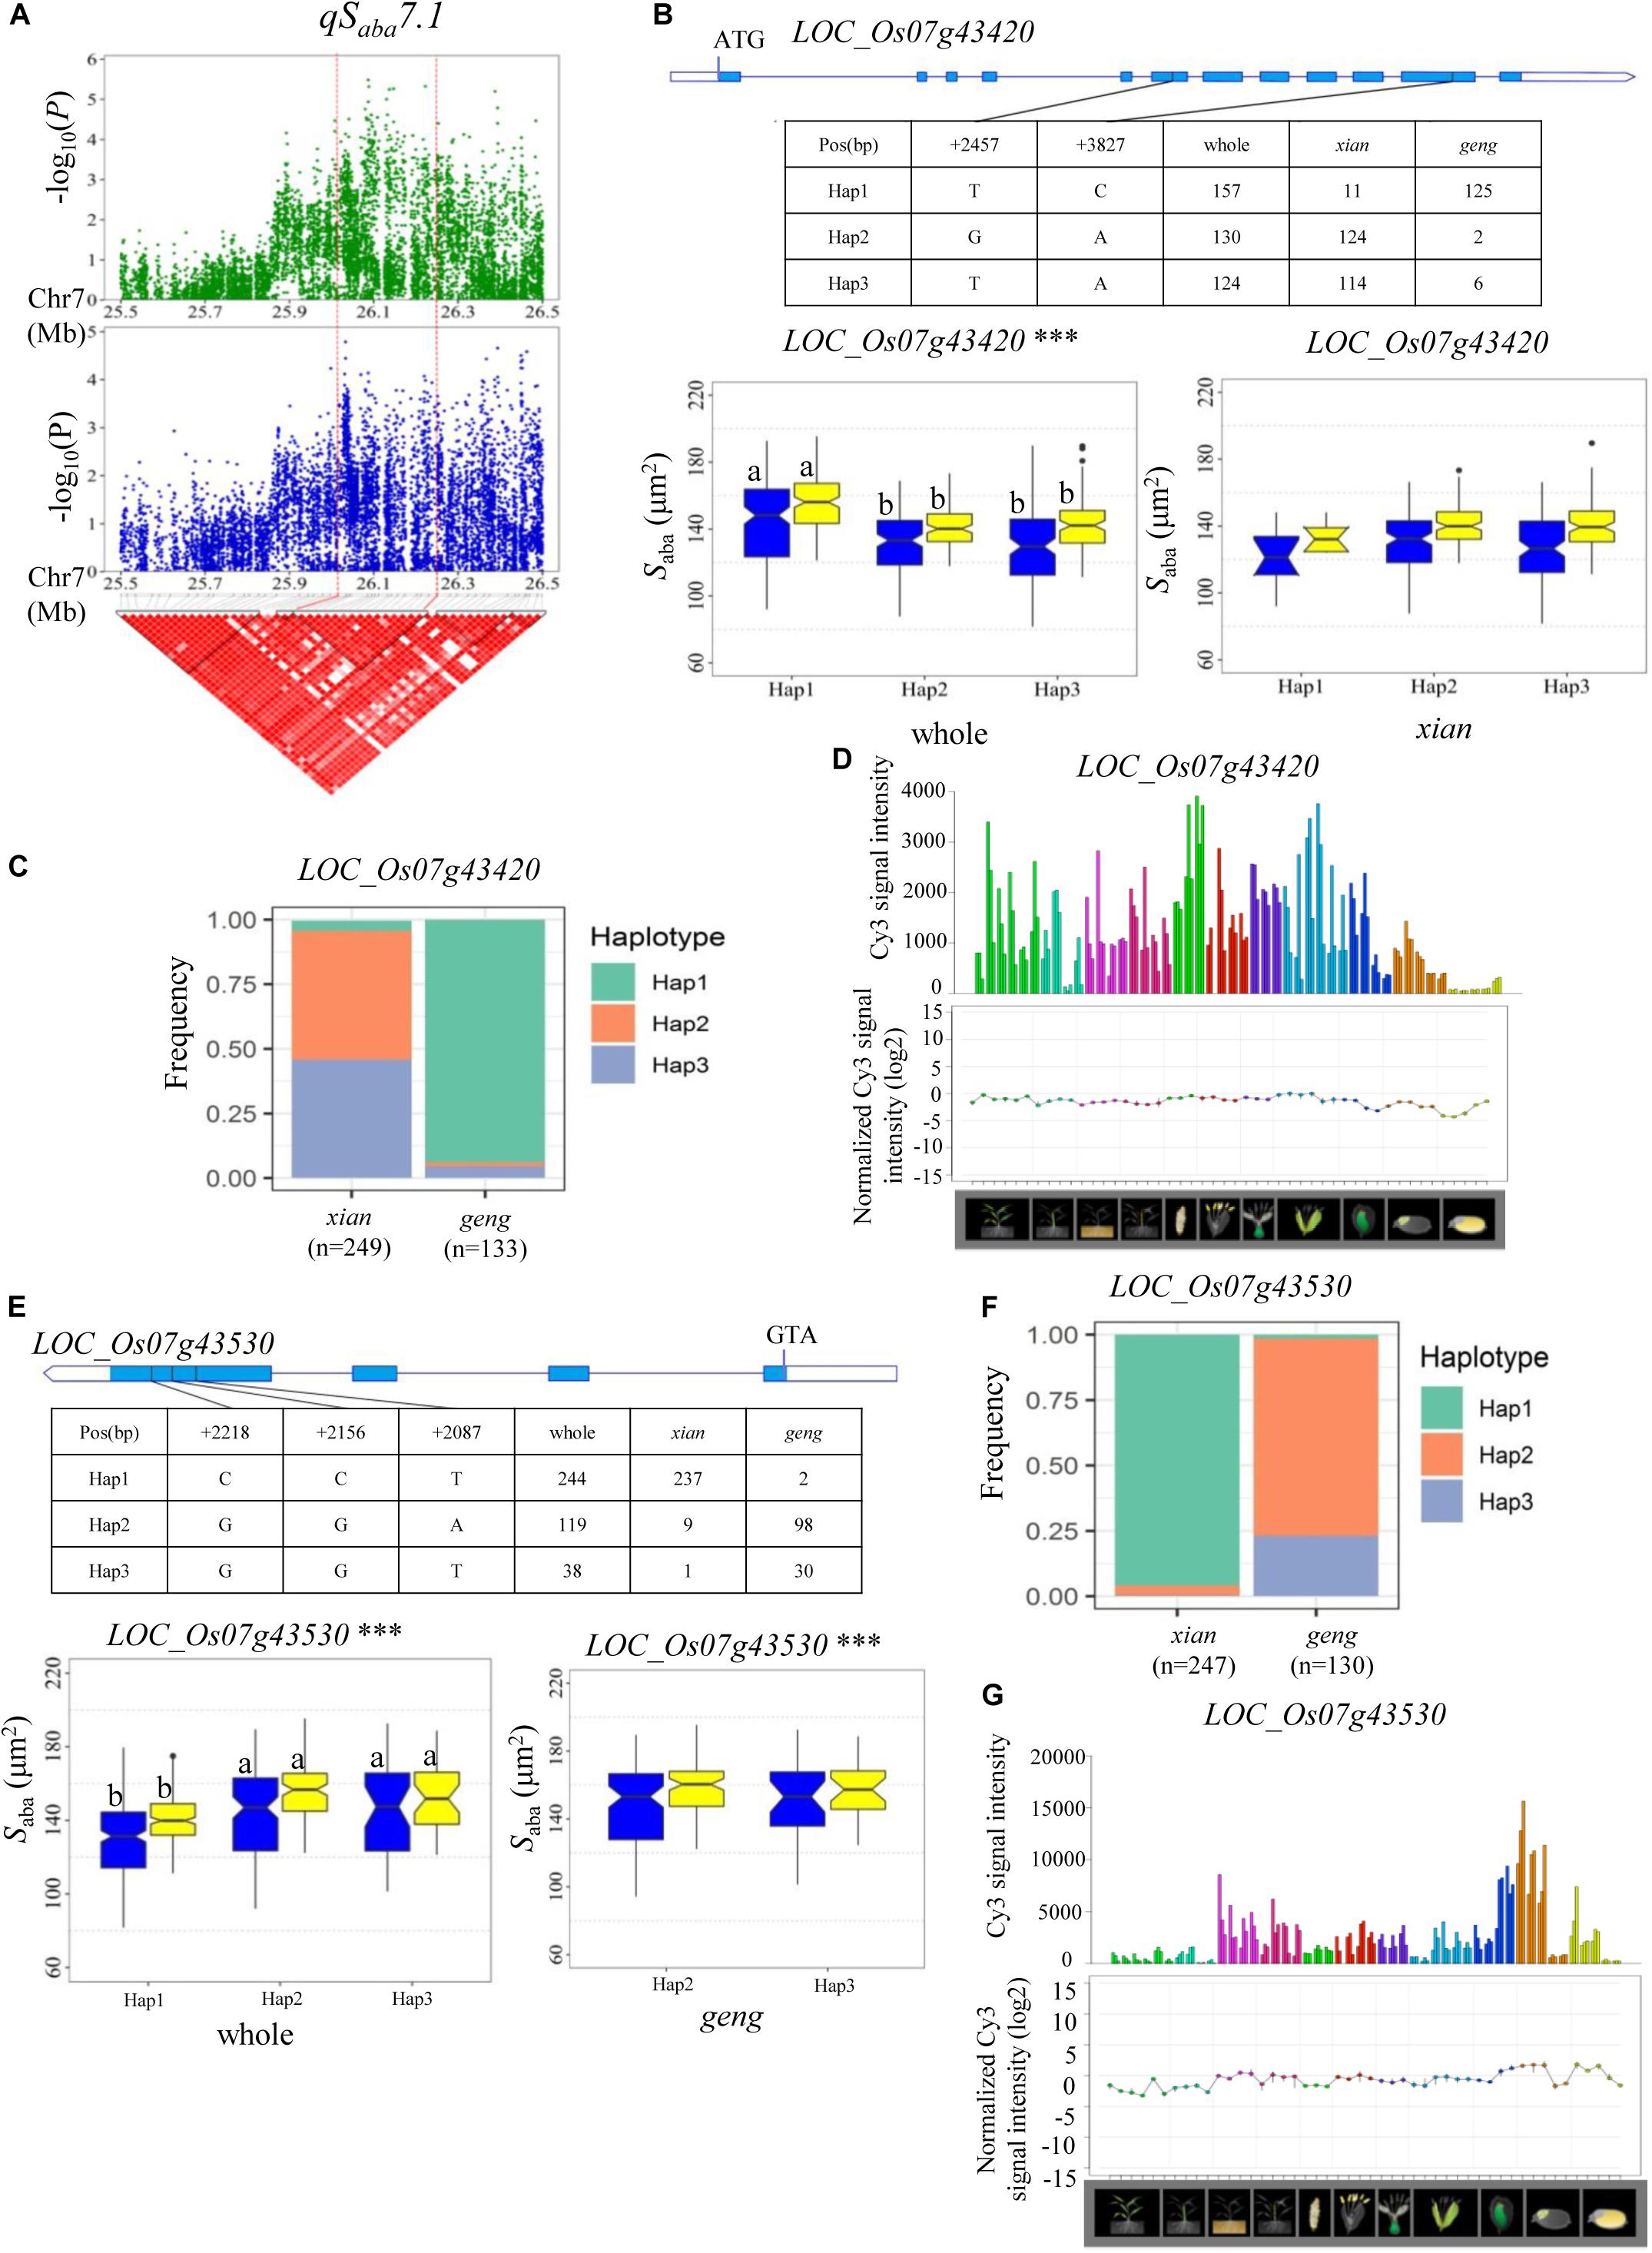
Figure 7. Haplotype analyses for the Saba of the LOC_Os07g43420 and LOC_Os07g43530 candidate genes at qSaba7.1. (A) Linkage disequilibrium (LD) block surrounding the peak on chromosome 7. Dashed lines indicate the candidate region for the peak. (B) Gene structure of LOC_Os07g43420, DNA polymorphisms in the gene, and boxplots for stomatal size on the abaxial leaf surface (Saba) based on haplotypes for LOC_Os07g43420 using non-synonymous SNPs within the coding region in the whole and xian populations. (C) Frequencies of different haplotypes of LOC_Os07g43420 in xian and geng subpopulations. (D) Spatio-temporal expression of LOC_Os07g43420 in various Nipponbare tissues throughout the entire growth period in the field [downloaded from RiceXPro (version 3.0)]. (E) Gene structure of LOC_Os07g43530, DNA polymorphisms in the gene, and boxplots for Saba based on haplotypes for LOC_Os07g43530 using non-synonymous SNPs within the coding region in the whole and geng populations. ***Denotes significance of ANOVA at P < 0.001. Letters on histograms (a and b) are ranked by Duncan’s test at P < 0.05. Blue and yellow colors indicate Sanya and Beijing, respectively. (F) Frequencies of different haplotypes of LOC_Os07g43530 in xian and geng subpopulations. (G) Spatio-temporal expression of LOC_Os07g43530 in various Nipponbare tissues throughout the entire growth period in the field [downloaded from RiceXPro (version 3.0)].
Discussion
Characteristics of Stomata Between Xian and Geng and Their Responses to the Environment
Asian cultivated rice (Oryza sativa L.) is classified into two subspecies, namely xian and geng. There are significant differences in many morphological and physiological traits associated with evolution of xian-geng, resulting in many distinguishing features for the two subspecies of cultivated rice (Morishima and Oka, 1981). Generally, xian varieties tend to have higher D and smaller S values than geng varieties (Laza et al., 2010). In our present study, xian cultivars exhibited significantly higher D and smaller S values than geng cultivars on both the adaxial and abaxial leaf surfaces in two environments, except for Dada in BJ (Figure 1A). In addition, the frequencies of most haplotypes at six representative candidate genes for the stomatal-related traits were significantly associated with the rice subpopulations according to Fisher’s exact tests (Supplementary Table S5), suggesting D and S are related to differentiation of xian and geng and dependent of population structure. Compared with geng varieties, the higher D of xian varieties was significantly associated with high photosynthetic abilities (Weng and Chen, 1988), most probably because smaller and more numerous stomata can potentially improve stomatal conductance (Zhang et al., 2019). The leaf transpiration efficiency is regulated mainly by stomatal movement, but is also affected by stomatal size and density (Nir et al., 2014). Peng et al. (1998) demonstrated that xian cultivars exhibited 25–30% lower transpiration efficiency (ratio of photosynthesis to transpiration) compared with that of the geng cultivars. Therefore, the higher photosynthetic rate of xian cultivars might be mainly attributed to its higher D and lower gas diffusion resistance.
Stomatal density is suggested to be an adaptive mechanism in plants to environmental stresses such as light intensity, water status, and CO2 levels (Kondamudi et al., 2018). In this study, the abaxial surface possessed more stomata than the adaxial surface (Supplementary Figure S2), which was in agreement with previous studies (Ishimaru et al., 2001; Laza et al., 2010). Increases in light intensities produced greater increases in D for the abaxial surface than for the adaxial surface in Arabidopsis (Schlüter et al., 2003). In the present study, 451 rice accessions were grown in May in BJ and December in SY. During the later growth period, the light intensity in SY was stronger than that in BJ. With the increase in light supply during growth from BJ to SY, approximately 64% of the accessions (including about 40% geng and 60% xian accessions) exhibited parallel increases in D and decreases in S on both the adaxial and abaxial leaf surfaces, where the abaxial surface increased by an average of 8.3%, which was markedly higher than the average 5.9% of the adaxial surface (Supplementary Table S1). Specifically, xian accessions, on average, exceeded 10.3 and 9% of Daba and Dada in SY compared with that in BJ, whereas geng accessions showed only 4.7 and 0.5% of Daba and Dada higher values in SY than in BJ, respectively (Supplementary Table S1). The phenomenon might mainly be attributed to different adaptations to the environments, especially the light intensity on stomata between xian and geng. Xian varieties are generally adapted to tropical lowland cultivation with higher light intensity, whereas most geng varieties are adapted to temperate climates (Khush, 1997).
Comparison of QTLs Detected in This Study With Previously Reported QTLs and Cloned Genes
Of the 64 QTLs for stomata-related traits identified in this study, seven were located in the same or adjacent regions containing previously reported QTLs and cloned genes affecting stomata-related traits in rice (Table 1). For example, qDada2.1 for Dada, and qDaba2.1 for Daba in the region 8.87–9.05 Mb on chromosome 2, which was co-located with OsSPCH2 regulating the initiation of stomatal lineage in rice (Liu et al., 2009); qDada6 affecting Dada in the region of 26.18–26.59 Mb on chromosome 6, which harbored a previously reported QTL for Dada identified on chromosome 6 near marker R32 (Laza et al., 2010); qLaba6 for Laba, qWaba6 for Waba, and qSaba6.3 for Saba, located in the region of 27.37–27.55 Mb on chromosome 6, are co-located with a QTL for Saba on chromosome 6 that overlapped marker C962 (Laza et al., 2010); qSaba7.1 affecting Saba was mapped in the region of 26.00–26.25 Mb on chromosome 7, which harbored the previously reported qSf7b for leaf stomata frequency (Zhao et al., 2008) and OsFLP, which negatively regulates guard mother symmetric cell division in rice (Wu et al., 2019).
Many stomata-related traits are associated with photosynthesis and drought stress responsive traits (Franks and Beerling, 2009; Xu et al., 2016; Zandalinas et al., 2018). In this study, 12 and 7 QTLs for stomata-related traits were identified in the same or adjacent regions with previously reported QTLs or cloned genes affecting photosynthesis and drought stress responsive traits, respectively (Table 1). These 12 QTLs included qDada2.1 for Dada and qDaba2.1 for Daba in the region of 8.87–9.05 Mb on chromosome 2, qWaba3 for Waba in the region of 21.25–21.45 Mb on chromosome 3, and qSaba6.2 for Saba in the region of 23.37–23.53 Mb on chromosome 6, which mapped together with three QTLs controlling carbon isotope discrimination, which contributed to stomatal conductance (Takai et al., 2009); qSada4.2 for Sada and qSaba4.2 for Saba in the region of 20.28–20.49 Mb on chromosome 4 mapped together with abaxial rolling and vein-albino leaves 4 (OsARVL4), which influences leaf morphology and the photosynthetic rate (Wang et al., 2016); qWada7 for Wada and qWaba7 for Waba in the region of 24.51–24.65 Mb on chromosome 7, qLaba3.1 for Laba in the region of 10.13–10.39 Mb on chromosome 3, and qDada2.2 for Dada in the region of 16.01–16.27 Mb on chromosome 2 were mapped together with qHP7b, qHP3a, and a QTL near marker RM5521 controlling leaf photosynthesis, respectively (Adachi et al., 2019); qWada4 for Wada in the region of 28.55–28.89 Mb on chromosome 4 mapped together with SLOW ANION CHANNEL-ASSOCIATED 1 (OsSLAC1), which is responsible for increased leaf photosynthesis caused by elevated stomatal conductance in rice (Kusumi et al., 2012); qSaba11 for Saba in the region 18.09–18.23 Mb on chromosome 11 mapped together with a QTL cluster harboring qPn11, qGs11, and qTr11, which affect the net photosynthetic rate, stomata conductance, and the transpiration rate, respectively (Zhao et al., 2008).
Another seven QTLs included qDada1 for Dada in the region of 38.32–38.63 Mb on chromosome 1 and qDada4 for Dada in the region of 19.28–19.7 Mb on chromosome 4 mapped together with OsNAC6 (Nakashima et al., 2007) and a High-affinity potassium transporter OsHAK1 (Chen et al., 2017), which are associated with rice drought tolerance; qSada4.3 for Sada in the region of 34.79–34.97 Mb on chromosome 4 mapped in the adjacent region to Albino midrib 1 (AM1), which is associated with chloroplast development and drought tolerance in rice (Sheng et al., 2014); qSada6 for Sada, and qSaba6.1 for Saba in the region of 4.32–4.6 Mb on chromosome 6 mapped together with a drought-responsive AP2/ERF transcription factor OsERF71, which is associated with root structure and drought resistance of rice (Lee et al., 2016); qSaba2.3 for Saba in the region of 30.05–30.35 Mb on chromosome 2 mapped together with Grain number, plant height, and heading date2 (Ghd2), a CONSTANS-like gene that influences drought sensitivity via regulation of senescence in rice (Liu et al., 2016); and qLaba3.2 for Laba in the region of 29.65–30.06 Mb on chromosome 3 mapped together with a Calmodulin-like gene OsCML4 for drought tolerance through scavenging of reactive oxygen species in rice (Yin et al., 2015). Allelism of the above QTLs for stomata-related traits identified in this study with previously reported QTLs or genes requires further verification via fine mapping and QTL cloning.
Most Likely Candidate Genes for the Important QTLs
GWAS and haplotype analysis of candidate genes revealed 64 candidate genes governing the 12 stable QTLs in nine chromosomal regions that were consistently detected in both environments. Based on the functional annotation of candidate genes, we speculated on the most likely candidate genes of qDada1, qDada2.1/ qDaba2.1, qSaba7.1, qSada2.2, and qWada7/qWaba7.
The region 38.32–38.63 Mb on chromosome 1, harboring qDada1, contains seven candidate genes, including OsNAC6 (LOC_Os01g66120), a member of the NAC transcription factor gene family in rice (Nakashima et al., 2007). Transgenic rice plants overexpressing OsNAC6 showed an improved tolerance to dehydration and high-salt stresses, and exhibited increased tolerance to blast disease (Nakashima et al., 2007). Many previous studies indicated that plant D plays an important role in plant responses to salt (Wei et al., 2019) and drought stress (Zandalinas et al., 2018). Moreover, water deficit leads to an increase in D and a decrease in S (Xu and Zhou, 2008), indicating that this may be partially attributed to improving the adaptation of plants to drought. In the present study, Hap1 (CT) exhibited a significantly higher Dada value than Hap3 (CC) in the whole and xian populations in the two environments (Figure 3C). OsNAC6 is highly expressed in the leaf blade according to a publicly available rice gene expression profile database [RiceXPro (version 3.0)] (Figure 3D). For this reason, OsNAC6 (LOC_Os01g66120) is considered the most likely candidate gene of qDada1.
A QTL cluster (qDada2.1 and qDaba2.1) was identified in the region of 8.87–9.05 Mb on chromosome 2, with the most significant associated SNP (rs2_8970096, P = 1.0 × 10⁻⁷) being detected close (approximately 87 kb downstream) to stomata-related gene OsSPCH2. A previous study demonstrated that OsSPCH2 regulates the initiation of stomatal lineage in rice (Liu et al., 2009; Wu et al., 2019). Compared with the wild-type plant, the stomatal pattern and morphogenesis of knock-out mutants of OsSPCH2 (c-osspch2) were identical to those of the wild-type plants; however, the D value in c-osspch2 was significantly reduced (Wu et al., 2019). In this study, four haplotypes of OsSPCH2 were found, with Hap 2(G-) showing significantly higher Dada and Daba values than those of Hap 3(AG) in the xian subpopulation (Figure 4C). We considered that OsSPCH2 (LOC_Os02g15760) is the most likely candidate gene of qDada2.1 and qDaba2.1.
On chromosome 7, a high peak of qWada7 was mapped together with the peak of qWaba7, containing 11 candidate genes. Among them, Grain Length on Chromosome 7 (GL7, LOC_Os07g41200), encodes a protein homologous to Arabidopsis thaliana LONGIFOLIA proteins, which regulate longitudinal cell elongation, contributing to an increase in grain length and an improvement of grain appearance quality (Wang et al., 2015). Compared with Hap3, Hap1, and Hap 2 both decreased W on the adaxial and abaxial leaf surfaces in the whole and xian populations in the two environments (Figure 5C). This suggested that GL7 probably affects guard cell width in rice. Reverse genetic approaches might be used to confirm whether GL7 is the candidate gene of qWada7 and qWaba7.
For qSada2.2, LOC_Os02g34320, encoding a basic helix_loop_helix transcription factor, is the most likely candidate gene, with significant differences in the Sada value among different haplotypes (Figure 6C). In Arabidopsis, three basic helix_loop_helix transcription factors, SPEECHLESS (SPCH), MUTE and FAMA, are essential for the initiation of stomatal lineage, termination of meristemoid fate, and the transition to guard mother cell identity, respectively (Pillitteri et al., 2007; Wu et al., 2019). Previous work indicated that OsSPCH2 (LOC_Os02g15760), encoding a helix_loop_helix transcription factor, controls the initiation of stomatal files in rice (Wu et al., 2019). In the present study, five haplotypes of LOC_Os02g34320 were detected in the whole population, with Hap 2 being associated with a significantly larger Sada value than the other four haplotypes in both environments (Figure 6C). In addition, Hap 2 had a significantly larger Sada value than Hap3 in the geng subpopulation, suggesting that LOC_Os02g34320 is a likely candidate gene of qSada2.2 that probably affects Sada in rice (Figure 6).
Of the four candidate genes for qSaba7.1, LOC_Os07g43420 (OsFLP), which encodes a functionally redundant R2R3 MYB transcription factor, negatively regulates guard mother symmetric cell division in rice (Wu et al., 2019) and is the most likely candidate gene. In addition, LOC_Os07g43530, a basic helix_loop_helix transcription factor gene, is also a likely candidate gene of qSaba7.1. In this study, no significant difference in the two genes was detected among different haplotypes in the xian/geng subpopulations, or only one prevalent haplotype (contained in more than 10 accessions) was observed in the xian/geng subpopulations, although there were significant differences for Saba between different haplotypes in the whole population (Figures 7B,E). This indicated that xian-geng differentiation probably led to significant phenotypic differences in Saba among different haplotypes. Thus, further study is required to validate whether LOC_Os07g43530 and OsFLP are candidate genes for qSaba7.1 or evolution-related genes of xian and geng. The above promising candidate genes associated with the eight rice stomata-related traits are valuable resources for future functional characterization and marker-assisted breeding to improve rice grain yield under non-stressed and abiotic stressed conditions after functional tests using transformation or CRISPR/Cas9 genome editing.
Application in Rice Breeding for High Yield Potential Under Non-stressed and Abiotic Stressed Conditions
Under well-watered conditions, an increase in D could allow plants to improve stomatal conductance for gas exchange on the leaf surface, thus avoiding photosynthetic limitation by CO2 supply. Positive correlations between stomatal conductance and D have been reported in previous studies (Xu and Zhou, 2008; Zhao et al., 2008). Schlüter et al. (2003) revealed that only an increase in stomatal density without altering any other internal leaf architecture could improve productivity under field conditions in Arabidopsis thaliana. Franks and Beerling (2009) demonstrated that changes toward increased D coupled with reduced S could maintain or improve the total stomatal area (caused by increased D) but could also provide a shorter diffusion path (caused by the smaller stomatal depth), potentially leading to improved maximum stomatal conductance and photosynthesis. In this study, we identified five accessions, including CX28, CX35, CX182, CX276, and CX343 that carry high-D haplotypes of LOC_Os01g66120 at qDada1 and OsSPCH2 at qDada2.1 and qDaba2.1 (Supplementary Table S5), and three accessions CX230, CX341, and CX362 that carry small-S haplotypes of LOC_Os02g34320 at qSada2.2, LOC_Os07g43530 and OsFLP at qSaba7.1 (Supplementary Table S5). Although these candidates are not causal genes, the SNPs in the gene sequences are suitable for marker-assisted selection (MAS) because of the high degree of linkage disequilibrium between them. Thus, after converting these linked SNPs into Kompetitive Allele Specific PCR (KASP) markers, MAS could be carried out to improve stomatal conductance, thus probably increasing photosynthesis by introgressing the high-D alleles (haplotypes) of LOC_Os01g66120 and OsSPCH2, or pyramiding the high-D alleles of the above two genes, and the small-S alleles of LOC_Os02g34320, LOC_Os07g43530 and OsFLP into low-stomatal density varieties.
Rice plants with fewer stomata are better able to maintain stomatal conductance and survive longer than control plants under drought and high temperature (40°C) (Caine et al., 2019). Low-stomatal density rice have achieved equivalent or even increased grain yields, despite a reduced rate of photosynthesis in some stress conditions (Caine et al., 2019). Thus, one strategy for breeding drought tolerant varieties with fewer stomata could be achieved by introgressing the low-D alleles of LOC_Os01g66120 at qDada1 and OsSPCH2 at qDada2.1 and qDaba2.1 into high-stomatal density varieties by MAS. We identified three accessions, including IRIS 313-10211, CX88, and CX123, which carry low-D haplotypes of LOC_Os01g66120 and OsSPCH2 (Supplementary Table S6). Therefore, these three accessions could be used as donor parents in rice breeding for drought tolerance by MAS.
Conclusion
The 451 accessions showed wide variations for the eight stomata-related traits. GWAS identified 64 QTLs for the eight traits, 12 of which were consistently detected in nine chromosome regions in the two environments, and 12 QTL regions controlling the same stomata-related traits were simultaneously detected on adaxial and abaxial leaf surfaces in the same environment. A total of 64 candidate genes for the nine consistent QTL regions were identified and the most likely candidate genes for five loci (qDada1, qDada2.1/qDaba2.1, qSaba7.1, qSada2.2, and qWada7/qWaba7) were inferred based on haplotype analysis and functional annotation. These results will enrich our knowledge of the genetic relationships among stomata-related traits in rice and will provide valuable information to improve rice photosynthesis and stress tolerance by deploying favorable alleles of stomata-related traits by MAS.
Data Availability Statement
The datasets presented in this study can be found in online repositories. The names of the repository/repositories and accession number(s) can be found in the article/Supplementary Material.
Author Contributions
YW and JX designed and supervised the research. HC, LZ, KS, KJ, CS, and KC performed the experiments. HC, LZ, and SW analyzed data. YW and JX wrote the manuscript. XZ edited the manuscript. All authors read and approved the manuscript.
Funding
This work was funded by the National Key R&D Program of China (Grant No. 2017YFD0100100 to KC), the 863 Key Project from the Chinese Ministry of Science & Technology (Grant No. 2014AA10A601 to JX), the National Natural Science Foundation of China (Grant No. 31671602 to YW), and the Agricultural Science and Technology Innovation Program and the Cooperation and Innovation Mission (Grant No. CAAS-ZDXT202001 to JX).
Conflict of Interest
The authors declare that the research was conducted in the absence of any commercial or financial relationships that could be construed as a potential conflict of interest.
Supplementary Material
The Supplementary Material for this article can be found online at: https://www.frontiersin.org/articles/10.3389/fgene.2020.00611/full#supplementary-material
Footnotes
References
Adachi, S., Yamamoto, T., Nakae, T., Yamashita, M., Uchida, M., Karimata, R., et al. (2019). Genetic architecture of leaf photosynthesis in rice revealed by different types of reciprocal mapping populations. J. Exp. Bot. 70, 5131–5144. doi: 10.1093/jxb/erz303
Buckley, C. R., Caine, R. S., and Gray, J. E. (2020). Pores for thought: can genetic manipulation of stomatal density protect future rice yields? Front. Plant Sci. 10:1783. doi: 10.3389/fpls.2019.01783
Caine, R. S., Yin, X., Sloan, J., Harrison, E. L., Mohammed, U., Fulton, T., et al. (2019). Rice with reduced stomatal density conserves water and has improved drought tolerance under future climate conditions. New Phytol. 221, 371–384. doi: 10.1111/nph.15344
Chen, G., Liu, C., Gao, Z., Zhang, Y., Jiang, H., Zhu, L., et al. (2017). OsHAK1, a High-affinity potassium transporter, positively regulates responses to drought stress in rice. Front. Plant Sci. 8:1885. doi: 10.3389/fpls.2019.01885
Franks, P. J., and Beerling, D. J. (2009). Maximum leaf conductance driven by CO2 effects on stomatal size and density over geologictime. Proc. Natl. Acad. Sci. U.S.A. 106, 10343–10347. doi: 10.1073/pnas.0904209106
Geisler, M., Nadeau, J., and Sack, F. D. (2000). Oriented asymmetric divisions that generate the stomatal spacing pattern in Arabidopsis are disrupted by the too many mouths mutation. Plant Cell 12, 2075–2086. doi: 10.1105/tpc.12.11.2075
Hyung, S. J., Sigal, B., Brad, M., and Jinko, G. (2006). LDheatmap: an R function for graphical display of pairwise linkage disequilibria between single nucleotide polymorphisms. J. Stat. Softw. 16, 1–9.
Ishimaru, K., Shirota, K., Higa, M., and Kawamitsu, Y. (2001). Identification of quantitative trait loci for adaxial and abaxial stomatal frequencies in Oryza sativa. Plant Physiol. Biochem. 39, 173–177. doi: 10.1016/s0981-9428(00)01232-8
Khush, G. S. (1997). Origin, dispersal, cultivation, and variation of rice. Plant Mol. Biol. 35, 25–34. doi: 10.1007/978-94-011-5794-0_3
Kondamudi, R., Swamy, K. N., Rao, Y. V., Kiran, T. V., Suman, K., Rao, D. S., et al.. (2018). Gas exchange, carbon balance and stomatal traits in wild and cultivated rice (Oryza sativa L.) genotypes. Acta Physiol. Plant. 38:6. doi: 10.1007/s11738-016-2173-z
Kondo, T., Kajita, R., Miyazaki, A., Hokoyama, M., Nakamura-Miura, T., Mizuno, S., et al. (2010). Stomatal density is controlled by a mesophyll-derived signaling molecule. Plant Cell Physiol. 51, 1–8. doi: 10.1093/pcp/pcp180
Kusumi, K., Hirotsuka, S., Kumamaru, T., and Iba, K. (2012). Increased leaf photosynthesis caused by elevated stomatal conductance in a rice mutant deficient in SLAC1, a guard cell anion channel protein. J. Exp. Bot. 63, 5635–5644. doi: 10.1093/jxb/ers216
Laza, M. R. C., Kondo, M., Ideta, O., Barlaan, E., and Imbe, T. (2010). Quantitative trait loci for stomatal density and size in lowland rice. Euphytica 172, 149–158. doi: 10.1007/s10681-009-0011-8
Lee, D. K., Jung, H., Jang, G., Jeong, J. S., Kim, Y. S., Ha, S. H., et al. (2016). Overexpression of the OsERF71 transcription factor alters rice root structure and drought resistance. Plant Physiol. 172, 575–588. doi: 10.1104/pp.16.00379
Li, M. X., Yeung, J. M., Cherny, S. S., and Sham, P. C. (2012). Evaluating the effective numbers of independent tests and significant p-value thresholds in commercial genotyping arrays and public imputation reference datasets. Hum. Genet. 131, 747–756. doi: 10.1007/s00439-011-1118-2
Li, Z. K. (2001). “QTL mapping in rice: a few critical considerations,” in Rice Genetics IV, eds G. S. Khush, D. S. Brar, and B. Hardy (Los Banos: Science Publishers), 153–172.
Lipka, A. E., Tian, F., Wang, Q., Peiffer, J., Li, M., Bradbury, P. J., et al. (2012). GAPIT: genome association and prediction integrated tool. Bioinformatics 28, 2397–2399. doi: 10.1093/bioinformatics/bts444
Liu, C., Chen, K., Zhao, X., Wang, X., Shen, C., Zhu, Y., et al. (2019). Identification of genes for salt tolerance and yield-related traits in rice plants grown hydroponically and under saline field conditions by genome-wide association study. Rice 12:88.
Liu, J., Shen, J., Xu, Y., Li, X., Xiao, J., and Xiong, L. (2016). Ghd2, a CONSTANS-like gene, confers drought sensitivity through regulation of senescence in rice. J. Exp. Bot. 67, 5785–5798. doi: 10.1093/jxb/erw344
Liu, T., Ohashi-Ito, K., and Bergmann, D. C. (2009). Orthologs of Arabidopsis thaliana stomatal bHLH genes and regulation of stomatal development in grasses. Development 136, 2265–2276. doi: 10.1242/dev.032938
Mohammed, U., Caine, R. S., Atkinson, J. A., Harrison, E. L., Wells, D., Chater, C. C., et al. (2019). Rice plants overexpressing OsEPF1 show reduced stomatal density and increased root cortical aerenchyma formation. Sci. Rep. 9:5584.
Morishima, H., and Oka, H. I. (1981). Phylogenetic differentiation of cultivated rice, XXII. numerical evaluation of the Indica-Japonica differentiation. Jpn. J. Breed. 31, 402–413. doi: 10.1270/jsbbs1951.31.402
Nakashima, K., Tran, L. S., VanNguyen, D., Fujita, M., Maruyama, K., Todaka, D., et al. (2007). Functional analysis of a NAC-type transcription factor OsNAC6 involved in abiotic and biotic stress-responsive gene expression in rice. Plant J. 51, 617–630. doi: 10.1111/j.1365-313x.2007.03168.x
Nir, I., Moshelion, M., and Weiss, D. (2014). The Arabidopsis GIBBERELLIN METHYL TRANSFERASE 1 suppresses gibberellin activity, reduces whole plant transpiration and promotes drought tolerance in transgenic tomato. Plant Cell Environ. 37, 113–123. doi: 10.1111/pce.12135
Ohsumi, A., Kanemura, T., Homma, K., Horie, T., and Shiraiwa, T. (2007). Genotypic variation of stomatal conductance in relation to stomatal density and length in rice (Oryza sativa L.). Plant Prod. Sci. 10, 322–328. doi: 10.1626/pps.10.322
Peng, S., Laza, R. C., Khush, G. S., Sanico, A. L., Visperas, R. M., and Garcia, F. V. (1998). Transpiration efficiencies of indica and improved tropical japonica rice grown under irrigated conditions. Euphytica 103, 103–108.
Pillitteri, L. J., Sloan, D. B., Bogenschutz, N. L., and Torii, K. U. (2007). Termination of asymmetric cell division and differentiation of stomata. Nature 445, 501–505. doi: 10.1038/nature05467
Sakai, H., Lee, S. S., Tanaka, T., Numa, H., Kim, J., Kawahara, Y., et al. (2013). Rice annotation project database (RAP-DB): an integrative and interactive database for rice genomics. Plant Cell Physiol. 54:e6. doi: 10.1093/pcp/pcs183
Sato, Y., Takehisa, H., Kamatsuki, K., Minami, H., Namiki, N., Ikawa, H., et al. (2013). RiceXPro version 3.0: expanding the informatics resource for rice transcriptome. Nucleic. Acids Res. 41, D1206–D1213.
Schlüter, U., Muschak, M., Berger, D., and Altmann, T. (2003). Photosynthetic performance of an Arabidopsis mutant with elevated stomatal density (sdd1-1) under different light regimes. J. Exp. Bot. 54, 867–874. doi: 10.1093/jxb/erg087
Sheng, P., Tan, J., Jin, M., Wu, F., Zhou, K., Ma, W., et al. (2014). Albino midrib 1, encoding a putative potassium efflux antiporter, affects chloroplast development and drought tolerance in rice. Plant Cell Rep. 33, 1581–1594. doi: 10.1007/s00299-014-1639-y
Shimazaki, K., Doy, M., Assmann, S. M., and Kinoshita, T. (2007). Light regulation of stomatal movement. Annu. Rev. Plant Biol. 58, 219–247. doi: 10.1146/annurev.arplant.57.032905.105434
Takai, T., Ohsumi, A., San-oh, Y., Laza, M. R., Kondo, M., Yamamoto, T., et al. (2009). Detection of a quantitative trait locus controlling carbon isotope discrimination and its contribution to stomatal conductance in japonica rice. Theor. Appl. Genet. 118, 1401–1410. doi: 10.1007/s00122-009-0990-9
Von Groll, U., Berger, D., and Altmann, T. (2002). The subtilisin-like serine protease SDD1 mediates cell-to-cell signaling during Arabidopsis stomatal development. Plant Cell 14, 1527–1539. doi: 10.1105/tpc.001016
Wang, H. C., Ngwenyama, N., Liu, Y. D., Walker, J. C., and Zhang, S. Q. (2007). Stomatal development and patterning are regulated by environmentally responsive mitogen-activated protein kinases in Arabidopsis. Plant Cell 19, 63–73. doi: 10.1105/tpc.106.048298
Wang, L., Jing, X. J., Nian, J. Q., Shen, N. W., Lai, K. K., Hu, J., et al. (2016). Characterization and fine mapping of the rice gene OsARVL4 regulating leaf morphology and leaf vein development. Plant Growth Regul. 78, 345–356. doi: 10.1007/s10725-015-0097-z
Wang, W., Mauleon, R., Hu, Z., Chebotarov, D., Tai, S., Wu, Z., et al. (2018). Genomic variation in 3,010 diverse accessions of Asian cultivated rice. Nature 557, 43–49.
Wang, Y., Xiong, G., Hu, J., Jiang, L., Yu, H., Xu, J., et al. (2015). Copy number variation at the GL7 locus contributes to grain size diversity in rice. Nat. Genet. 47, 944–948. doi: 10.1038/ng.3346
Wei, Z., Shi, X., Wei, F., Fan, Z., Mei, L., Tian, B., et al. (2019). The cotton endocycle-involved protein SPO11-3 functions in salt stress via integrating leaf stomatal response, ROS scavenging and root growth. Physiol. Plant 167, 127–141.
Weng, J. H., and Chen, C. Y. (1988). Stomatal frequency associated with an esterase band in rice genotypes. Rice Genet. News 5, 93–95.
Wu, Z., Chen, L., Yu, Q., Zhou, W., Gou, X., Li, J., et al. (2019). Multiple transcriptional factors control stomata development in rice. New Phytol. 223, 220–232. doi: 10.1111/nph.15766
Xiong, D., Douthe, C., and Flexas, J. (2018). Differential coordination of stomatal conductance, mesophyll conductance, and leaf hydraulic conductance in response to changing light across species. Plant Cell Environ. 41, 436–450. doi: 10.1111/pce.13111
Xu, J. L., Lafitte, H. R., Gao, Y. M., Fu, B. Y., Torres, R., and Li, Z. K. (2005). QTLs for drought escape and tolerance identified in a set of random introgression lines of rice. Theor. Appl. Genet. 111, 1642–1650. doi: 10.1007/s00122-005-0099-8
Xu, Z., Jiang, Y., Jia, B., and Zhou, G. (2016). Elevated-CO2 response of stomata and its dependence on environmental factors. Front. Plant Sci. 7:657. doi: 10.3389/fpls.2019.0657
Xu, Z., and Zhou, G. (2008). Responses of leaf stomatal density to water status and its relationship with photosynthesis in a grass. J. Exp. Bot. 59, 3317–3325. doi: 10.1093/jxb/ern185
Yano, K., Yamamoto, E., Aya, K., Takeuchi, H., Lo, P. C., Hu, L., et al. (2016). Genome-wide association study using whole-genome sequencing rapidly identifies new genes influencing agronomic traits in rice. Nat. Genet. 48, 927–934. doi: 10.1038/ng.3596
Yin, X. M., Huang, L. F., Zhang, X., Wang, M. L., Xu, G. Y., and Xia, X. J. (2015). OsCML4 improves drought tolerance through scavenging of reactive oxygen species in rice. J. Plant Biol. 58, 68–73. doi: 10.1007/s12374-014-0349-x
Zandalinas, S. I., Balfagón, D., Arbona, V., and Gómez-Cadenas, A. (2018). Regulation of citrus responses to the combined action of drought and high temperatures depends on the severity of water deprivation. Physiol. Plant 162, 427–438. doi: 10.1111/ppl.12643
Zhai, L., Zheng, T., Wang, X., Wang, Y., Chen, K., Wang, S., et al. (2018). QTL mapping and candidate gene analysis of peduncle vascular bundle related traits in rice by genome-wide association study. Rice 11:13.
Zhang, Q., Peng, S., and Li, Y. (2019). Light-induced stomatal conductance increase rate is related to stomatal size in the Oryza genus. J. Exp. Bot. 70, 5259–5269. doi: 10.1093/jxb/erz267
Zhao, X. Q., Xu, J. L., Zhao, M., Lafitte, R., Zhu, L. H., Fu, B. Y., et al. (2008). QTLs affecting morph-physiological traits related to drought tolerance detected in overlapping introgression lines of rice (Oryza sativa L.). Plant Sci. 174, 618–625. doi: 10.1016/j.plantsci.2008.03.009
Keywords: stomatal density, stomatal size, genome-wide association study, QTL, candidate gene
Citation: Chen H, Zhao X, Zhai L, Shao K, Jiang K, Shen C, Chen K, Wang S, Wang Y and Xu J (2020) Genetic Bases of the Stomata-Related Traits Revealed by a Genome-Wide Association Analysis in Rice (Oryza sativa L.). Front. Genet. 11:611. doi: 10.3389/fgene.2020.00611
Received: 14 April 2020; Accepted: 19 May 2020;
Published: 09 June 2020.
Edited by:
Xusheng Wang, University of North Dakota, United StatesReviewed by:
Mingnan Qu, Partner Institute for Computational Biology, ChinaKiyosumi Hori, National Agriculture and Food Research Organization (NARO), Japan
Copyright © 2020 Chen, Zhao, Zhai, Shao, Jiang, Shen, Chen, Wang, Wang and Xu. This is an open-access article distributed under the terms of the Creative Commons Attribution License (CC BY). The use, distribution or reproduction in other forums is permitted, provided the original author(s) and the copyright owner(s) are credited and that the original publication in this journal is cited, in accordance with accepted academic practice. No use, distribution or reproduction is permitted which does not comply with these terms.
*Correspondence: Yun Wang, d2FuZ3l1bjE5ODFAc3lhdS5lZHUuY24=; Jianlong Xu, eHVqaWFubG9uZ0BjYWFzLmNu; eHVqbGNhYXNAMTI2LmNvbQ==