 Lei Lei
 Lanfen Wang1
 Jing Wu
- 1Institute of Crop Science, Chinese Academy of Agricultural Sciences, Beijing, China
- 2Institute of Vegetables and Flowers, Chinese Academy of Agricultural Sciences, Beijing, China
- 3CAAS-CIAT Joint Laboratory in Advanced Technologies for Sustainable Agriculture, Beijing, China
Seed weight and seed size are the key agronomic traits that determine yield in common bean. To investigate the genetic architecture of four seed traits (100-seed weight, seed length, seed width, and seed height) of common bean in China, marker-trait association analysis of these seed traits was performed in a nationwide population of 395 common bean accessions using 116 polymorphic SSR markers. The four seed traits were evaluated in six trials across three environments. Seed size varied among the environments. Population structure was evaluated based on SSR markers and phaseolin, which divided the accessions into two main subpopulations representing the two known gene pools. Seed weight and seed size had a strong relationship with population clustering. In addition, in a Genome-wide association studies (GWAS), 21 significantly associated markers were identified for the four seed traits with two models, namely, general linear model (GLM) and mixed linear model (MLM). Some markers had pleiotropic effects, i.e., controlled more than one trait. The significant quantitative trait loci identified in this study could be used in marker-assisted breeding to accelerate the genetic improvement of yield in common bean.
Introduction
Common bean (Phaseolus vulgaris L.) is a crop of major societal importance with high levels of nutrients and dietary protein (Welch et al., 2000; Kutoš et al., 2003; Krupa, 2008; Montoya et al., 2010). Common bean is grown worldwide, with production exceeding 26 million tons (Tg), and China is a large producer of common bean, with the sixth highest production (1 Tg) in the world (FAO, 20181). The species originated in two centers of diversity and, through parallel domestication events, formed two gene pools: the Mesoamerican and Andean gene pools (Gepts et al., 1986; Gepts and Debouck, 1991; Mamidi et al., 2011, 2013; Bitocchi et al., 2013; Gaut, 2014; Schmutz et al., 2014; Rendón-Anaya et al., 2017). As a result of the domestication process, the two gene pools show differences in agronomic traits, such as seed size, seed storage protein (phaseolin) type, bracteole shape, and growth habit, among others. Among these traits, seed size is the most obvious differentiator of the two gene pools, with the Mesoamerican gene pool producing medium [25–40 g 100-seed weight (100SW)] and small seeds (<25 g 100SW) and the Andean gene pool producing medium and large seeds (>40 g 100SW) (Singh et al., 1991a, b, c; McClean et al., 2002, 2004; Broughton et al., 2003; Díaz and Blair, 2006). In addition, seed size is related to phaseolin type (Koenig et al., 1990). China, thought to be the secondary center of genetic diversity for common bean, was reported to include materials from the two gene pools, with seeds being mainly small to medium in size but occasionally large (Zhang et al., 2008; Bellucci et al., 2014). However, compared with soybean, rice and maize (Wang et al., 2015; Xu et al., 2015, 2018; Sangiorgio et al., 2016), common bean (especially Chinese common bean germplasm) has been the subject of few studies on the genetic control of seed traits such as seed weight and seed size.
Seed weight and seed size are the key agronomic traits that determine yield in crops (Xu et al., 2018). It has been reported that yield-related traits such as seed weight and size are typical quantitative traits controlled by a complex of genes since the Danish plant scientist Wilhelm Johannsen concluded that seed size in self-fertilizing beans is influenced by a genetic effect (Johannsen, 1911; Sax, 1923; Motto et al., 1978; Vallejos and Chase, 1991). With the construction of a linkage map based on various types of molecular markers (Vallejos et al., 1992; Nodari et al., 1993; Freyre et al., 1998; Beebe et al., 2006; Hanai et al., 2010; Galeano et al., 2011, 2012) and the completion of genome-wide sequencing of typical common bean materials from the two gene pools (Schmutz et al., 2014; Vlasova et al., 2016), a large number of quantitative trait loci (QTLs) for yield-related traits have been identified (González et al., 2017). To date, a total of approximately 200 QTLs related to seed characteristics have been reported (Nodari et al., 1993; Johnson et al., 1996; Koinange et al., 1996; Freyre et al., 1998; Park et al., 2000; Tar’an et al., 2000; Johnson and Gepts, 2002; Beattie et al., 2003; Guzmán-Maldonado et al., 2003; Blair et al., 2006; Pérez-Vega et al., 2010; Wright and Kelly, 2011; Checa and Blair, 2012; Mukeshimana et al., 2014; Yuste-Lisbona et al., 2014; Qi, 2015; Geng et al., 2017). Among these QTLs, more than 100 have been identified for seed weight, seed length (SL), seed width (SWI) and seed height (SH), and these QTLs are distributed on 11 chromosomes of the common bean genome (Supplementary Table S1). It is worth noting that 16 QTLs are related to at least two of these seed traits (Park et al., 2000; Geng et al., 2017). For example, SL and SH appeared to correspond to a QTL for seed weight (Park et al., 2000). In addition, a study also found the “one cause multieffect phenomenon” for seed traits on Chr02, Chr04, Chr06, and Chr07 of common bean (Geng et al., 2017). In addition, seed size QTLs were mapped near the upper end of linkage groups (LGs) 02 and 06, the lower end of LGs 03, 07, 08, and 10, and the center of LGs 06 and 08 (Park et al., 2000; Blair et al., 2006; Pérez-Vega et al., 2010). Therefore, the markers located in the center of LG B8 and near the upper end of LG B6 could be good candidates for assisted selection for traits related to seed size (Pérez-Vega et al., 2010). However, most of the loci for seed weight or size in these studies were identified in a single environment or using a family group for seed phenotype mapping, which may have caused the parental polymorphism level to be low, in which case the accuracy of QTL mapping would have been affected to some extent.
Important goals in the current study were to (1) investigate the diversity and population structure of 395 common bean accessions with wide geographical distributions in China; (2) carry out marker-trait association analysis in six different environments using general linear model (GLM) and mixed linear model (MLM) approaches, associating phenotypic and genotypic data, with the aim of obtaining stable QTLs for seed traits; and (3) obtain significantly associated markers and provide a theoretical reference for marker-assisted selection (MAS) in the breeding of common bean in China.
Materials and Methods
Plant Materials
A total of 395 accessions of common bean were evaluated in this study, including 307 accessions collected from the main production areas of China and 84 accessions introduced from abroad, together with four control genotypes from the Andean and Mesoamerican gene pools. The control genotypes were DRK134 and DRK139, the Andean control genotypes, as well as BAT93 and Turrialba 1, the Mesoamerican controls. The accessions were predominantly landraces; however, the study also included a few modern varieties. All of the materials were selected from the National Crop Gene Bank at the Institute of Crop Science, Chinese Academy of Agriculture Sciences, Beijing, China. The list of accessions and their passport information and source of collection are given in the Supplementary Table S2.
Phenotypic Evaluation
Field trials were conducted in Harbin (HRB, 45°50′ N and 126°51′ E), Heilongjiang Province, and in Bijie (BJ, 27°18′ N and 105°18′ E), Guizhou Province, in 2014 and 2016, for a total of six environments (2014_HRB, 2015_HRB, 2016_HRB, 2014_BJ, 2015_BJ, and 2016_BJ). Twenty individual plants of each accession were cultivated in two consecutive rows at both locations, and the plots were 4.0 m in length, with 0.5 m between rows.
Five plants from twenty individual plants of each accession were selected randomly, and their seeds were phenotyped. Four quantitative seed traits, namely, (1) 100SW, determined by using 100 dry seeds per plot; (2) SL, defined as the longest dimension of the seed; (3) SWI, measured as the distance between the 2 lateral sides of the seed; and (4) SH, measured as the longest distance from one side to the other at the hilum (Yuste-Lisbona et al., 2014). 100SW, SL and SH were measured by an SC-G automatic seed testing system (Hangzhou WSeen Detection Technology Co., Ltd., China), with 5 replicates of 20 seeds each, which were harvested from 5 individual plants; then, the average of the 5 replicates was calculated. Analysis of variance (ANOVA) was carried out with SPSS 19.0. Pearson correlation coefficients of the traits in each environment were calculated in SAS 9.2 (Cary software, North Carolina SAS Institute Inc., 2004) software.
SSR Marker and Phaseolin Evaluation
To ensure an adequate sample size for DNA extraction, 10 seeds were randomly selected from each accession, germinated and grown in a greenhouse in Beijing. The first trifoliate leaves of 3-week-old seedlings were collected for total genomic DNA extraction using a CTAB extraction method (Afanador et al., 1993). DNA quality was evaluated with 1% agarose gels, and then DNA was diluted to 10 ng/μl for use in PCRs. PCR amplifications were carried out on an A-300 Fast Thermal Cycler using 96-well plates with 10 μL final reaction volumes that included 1.5 μL of genomic DNA, 1.0 μL of each simple sequence repeat (SSR) primer (Supplementary Material) at a concentration of 2 pmol/L, 4.5 μL of PCR 2 × Master Mix (Mg2+, dNTP, Taq polymerase; Beijing Qingke Xinye Biotechnology Co., Ltd.) and 3.0 μL of ddH2O. The amplification conditions were as follows: 5 min at 95°C, followed by 35 cycles of 40 s at 95°C, 45 s at 54°C, and 40 s at 72°C and a final extension at 72°C for 10 min. The amplification products were evaluated with silver-stained 8% polyacrylamide gels with 1 × TBE buffer (89 mM Tris, 89 mM boric acid, and 2 mM EDTA). A total of 116 SSR markers distributed over all 11 chromosomes of P. vulgaris were used based on the whole genome sequence (Schmutz et al., 2014; Vlasova et al., 2016).
Phaseolin was extracted from 10 dry seeds of each accession, removing the testa and embryo manually from cotyledons before grinding, following the method of Igrejas et al. (2009). The treated seeds were ground into a fine powder in liquid nitrogen. The dry powder (0.1 g) was weighed and placed into 2 mL centrifuge tubes. A total of 1,000 μL of sample extract (1% (w/v) NaCl, 0.4% (w/v) Tris-base, 0.2% (w/v) Tris–HCl, pH of 8.5) and 10 μL of 5% (v/v) β-mercaptoethanol were added for protein extraction. Samples (3.5 μL) were subjected to one-dimensional sodium dodecyl sulfate-polyacrylamide gel electrophoresis (SDS-PAGE) following the method of Ma and Bliss (1978) modified by Igrejas et al. (2009). Electrophoresis was carried out in a 1-mm-thick, 6.38% stacking gel under 40 mA at loading; thereafter, a 12% gel at 75 mA was used until the separation was complete, requiring approximately 5–7 h. The gels were stained with Coomassie brilliant blue R-250. Phaseolin patterns were evaluated with the following standard panel of 14 phaseolin types: S, Sb, Sd, B, M13, C, CA, T, PA, To, Ko, CH, H, and H1.
Population Diversity and Structure Analyses
PowerMarker v.3.25 was used to evaluate the number of alleles, gene diversity and polymorphism information content (PIC) for each marker, and clusters were analyzed to construct a dendrogram with PowerMarker2 using Nei’s coefficient and the neighbor-joining (NJ) algorithm (Liu and Muse, 2005).
The frequency of each phaseolin type was calculated using Microsoft Office Excel 2016. Two-dimensional principal component analysis (PCA) was performed with GenAlEx 6based on groups of phaseolin types (Peakall and Smouse, 2006).
Population structure and the number of subpopulations (K) were evaluated with STRUCTURE 2.3.4 software (Pritchard et al., 2000; Falush et al., 2007). The assumed number of subpopulations was simulated from k = 1 to k = 10, and the ideal number of subpopulations was assessed with a burn-in period of 10,000 steps and 20,000 Markov chain Monte Carlo repetitions after the burn-in. The most likely number of subpopulations (K) was determined by examining the optimal △K value (Evanno et al., 2005) in STRUCTURE HARVESTER (Earl and vonHoldt, 2012). A graph (bar plot) of the population structure was generated using the R package pophelper 2.2.93. In addition, to further analyze population structure, the relationships between subpopulations were graphed in three dimensions using NTSYSpc 2.1e (Exeter Software, Rohlf, 2000).
Association Study
Association analysis between SSR markers and various seed traits was conducted using TASSEL 2.1 (Bradbury et al., 2007). First, a GLM incorporating population genetic structure was fit, with a Q matrix derived from structure analysis as a covariate (GLM + Q). Second, an MLM incorporating a finer-scale relative kinship matrix (K) and population genetic structure (Q) was fit to perform the association analysis (MLM + Q + K), which had more statistical power than the model including only “Q.” Relatedness was determined by calculating the kinship coefficient matrix (K) in TASSEL. Meanwhile, the heritability of seed traits in six enviroments were calculated by MLM model using the same software program.
Results
Genetic Variability
First, we evaluated the genetic diversity of the common bean accessions with phaseolin markers. Among these accessions, a total of 11 phaseolin patterns were identified: S, Sb, Sd, B, C, CA, CH, H, PA, T, and To (Supplementary Figure 1). The most frequent pattern was Sb (30.9%), followed by T (21.3%), which were the predominant types in the Mesoamerican and Andean gene pools, respectively. Among these eleven types of phaseolin, the S, Sb, Sd, and B types were Mesoamerican types, while C, CA, CH, H, PA, T, and To were Andean types. Therefore, this variation in protein bands could help distinguish the origins of the accessions. The results indicated that 58.2% of all the accessions belonged to the Mesoamerican gene pool while 41.8% belonged to the Andean gene pool.
Then, we explored the polymorphisms of the same accessions based on SSR markers. A total of 116 SSR markers revealed 917 different alleles, with an average number of alleles per locus of 7.9. The number of alleles identified for each SSR marker varied from 2 (CBS69, CBS170, CBS200, CBS306, P9S39, and CBS369) to 27 (CBS88). The gene diversity of individual SSR markers varied from 0.0051 (CBS200) to 0.9098 (CBS206), with an average of 0.5936 per locus.
Population Structure
Population structure is an important covariate used in association analysis to account for differentiation among panel groups and to avoid or minimize type-I errors. It is also important to study population structure in the context of genetic diversity and breeding to examine the genetic composition and relatedness of the individuals within the group. In this article, four methods were used to estimate the number of subgroups. First, PCA based on 116 SSR markers and phaseolin type was performed. Clear subpopulation structure was observed among the individuals, and the two resulting subpopulations corresponded to the Mesoamerican gene pool (M) and the Andean gene pool (And) (Figure 1A). The percentages of genetic diversity explained by the two coordinates of the PCA were 22.7% (PC1) and 4.8% (PC2). Phaseolin types and SSR markers were able to identify the source of the accessions from the two gene pools with almost consistent results. Second, the STRUCTURE software results indicated that the value of Evanno’s △K showed an obvious spike at K = 2. This result suggested that the population could be divided into two subgroups, with a few admixed individuals between these two subgroups (Figure 1A). According to the location of the control genotypes in the group, 54.43% of the accessions were assigned to the Mesoamerican gene pool (Q1 values above 0.75), 5.57% were considered admixed between the two subgroups (Q values from 0.25 to 0.75), and 40.00% were assigned to the Andean gene pool (Q2 values above 0.75) (Figure 1B). Third, a NJ dendrogram based on Nei’s (1972) genetic distance also grouped the 395 accessions into two clusters (Figure 1C). Finally, in the three-dimensional principal coordinate analysis (PCoA) based on SSR markers showing the spatial distribution of the 395 accessions, each dimension explained 34.6% (Dim1), 15.7% (Dim2), or 5.7% (Dim3) of the variation (Figure 1D). The three dimensions together explained 56.0% of the total variation present in the data set. Overall, the consistent results from PCA, STRUCTURE analysis, the NJ tree and PCoA confirmed that there were two subpopulations of Chinese common bean germplasm.
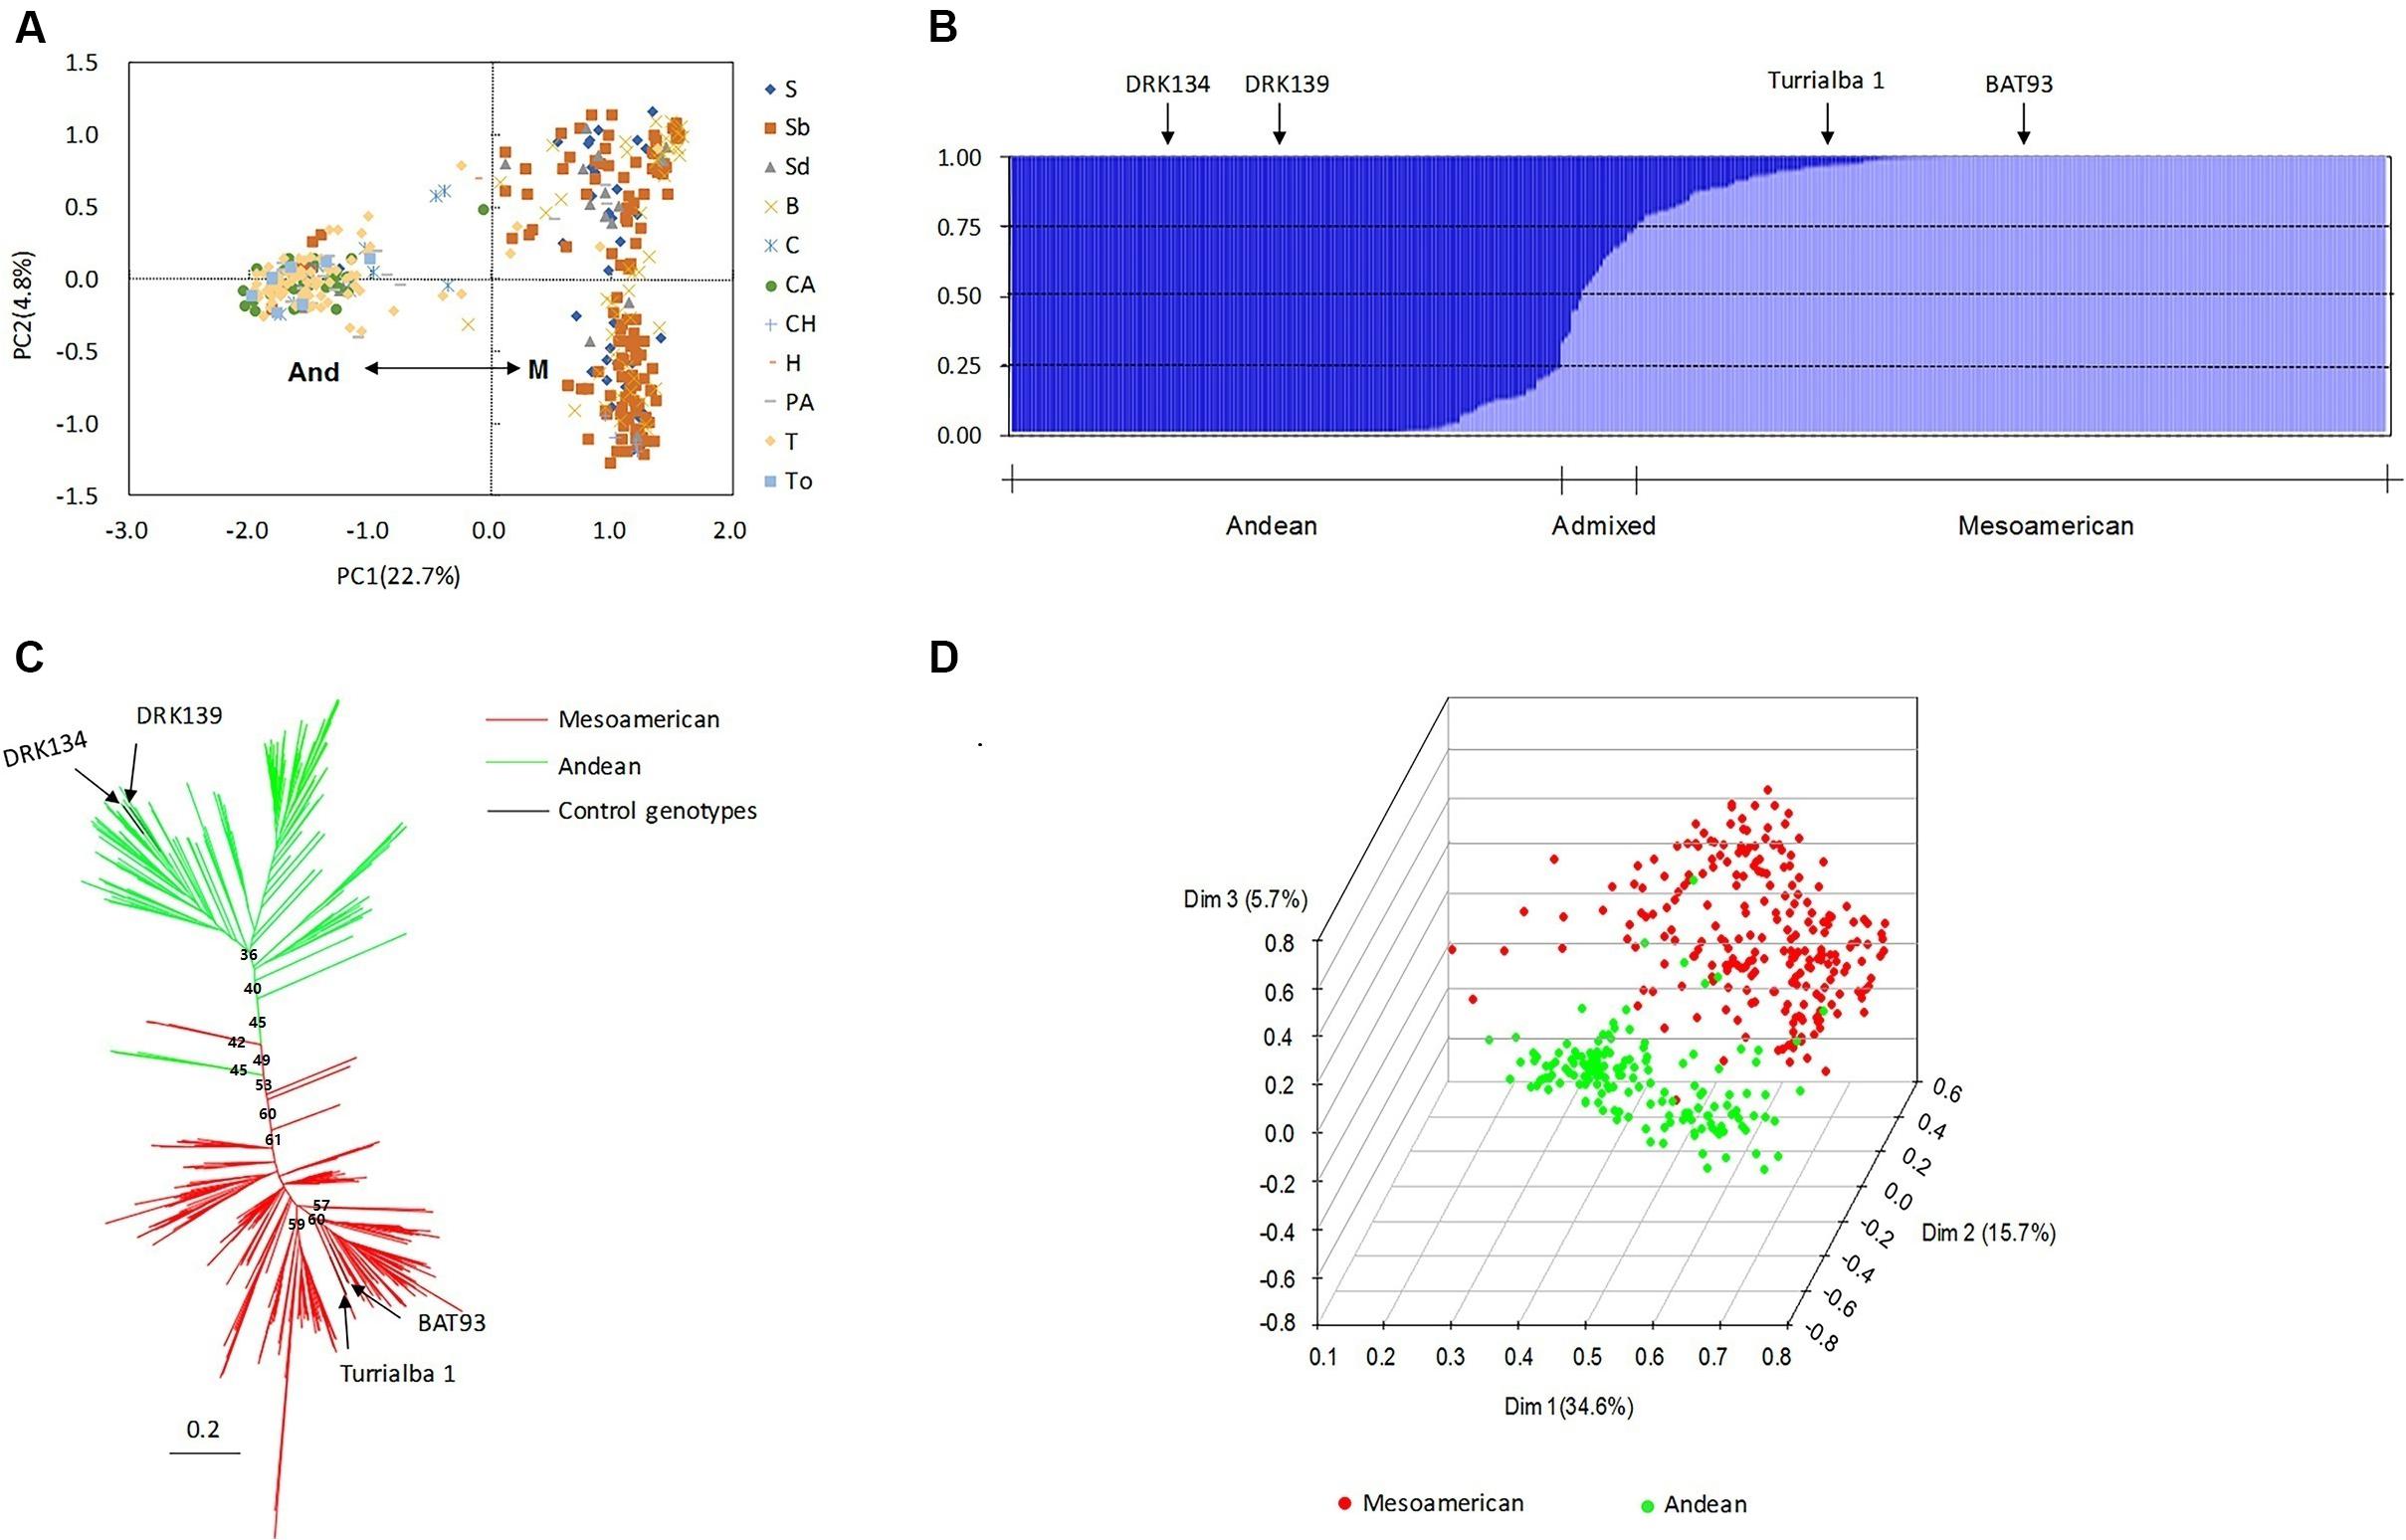
Figure 1. Population structure of 395 accessions. (A) Principal component analysis (PCA) of the accessions based on 116 microsatellite loci and phaseolin. The grouping results obtained with phaseolin were almost the same as those obtained with the simple sequence repeat (SSR) markers. And, Andean gene pool; M, Mesoamerican gene pool. (B) Population structure of the accessions based on STRUCTURE analysis with K = 2. A total of 54.43% of the accessions were assigned to the Mesoamerican gene pool (Q1-values above 0.75), 40.00% were assigned to the Andean gene pool (Q2-values above 0.75), and 5.57% were considered admixed between the two subgroups (Q-values from 0.25 to 0.75). (C) Neighbor-joining (NJ) method for determining population structure with Nei’s (1972) genetic distances based on SSR markers. (D) Three-dimensional principal coordinate analysis (PCoA) based on all 116 microsatellite markers. DRK134 and DRK139 are the Andean control genotypes, and BAT93 and Turrialba 1 are the Mesoamerican controls.
In addition to population structure, the kinship (K) matrix is another important factor for association analysis. The frequency distribution values for relative kinship revealed that the genetic relatedness ranged from 0 to 0.98 (Figure 2), and the average pairwise relative kinship coefficient was 0.323. Pairwise relative kinship values from 0.1 to 0.2 accounted for 29.9% of all kinship coefficients. In addition, kinship values from 0 to 0.5 accounted for more than 80% of all pairwise kinship coefficients. Only 16.957% of the pairwise relative kinship coefficients were greater than 0.5, and only 0.15% of the kinship values were above 0.8. This result suggested that the majority of the 395 accessions were genetically diverse in this study.
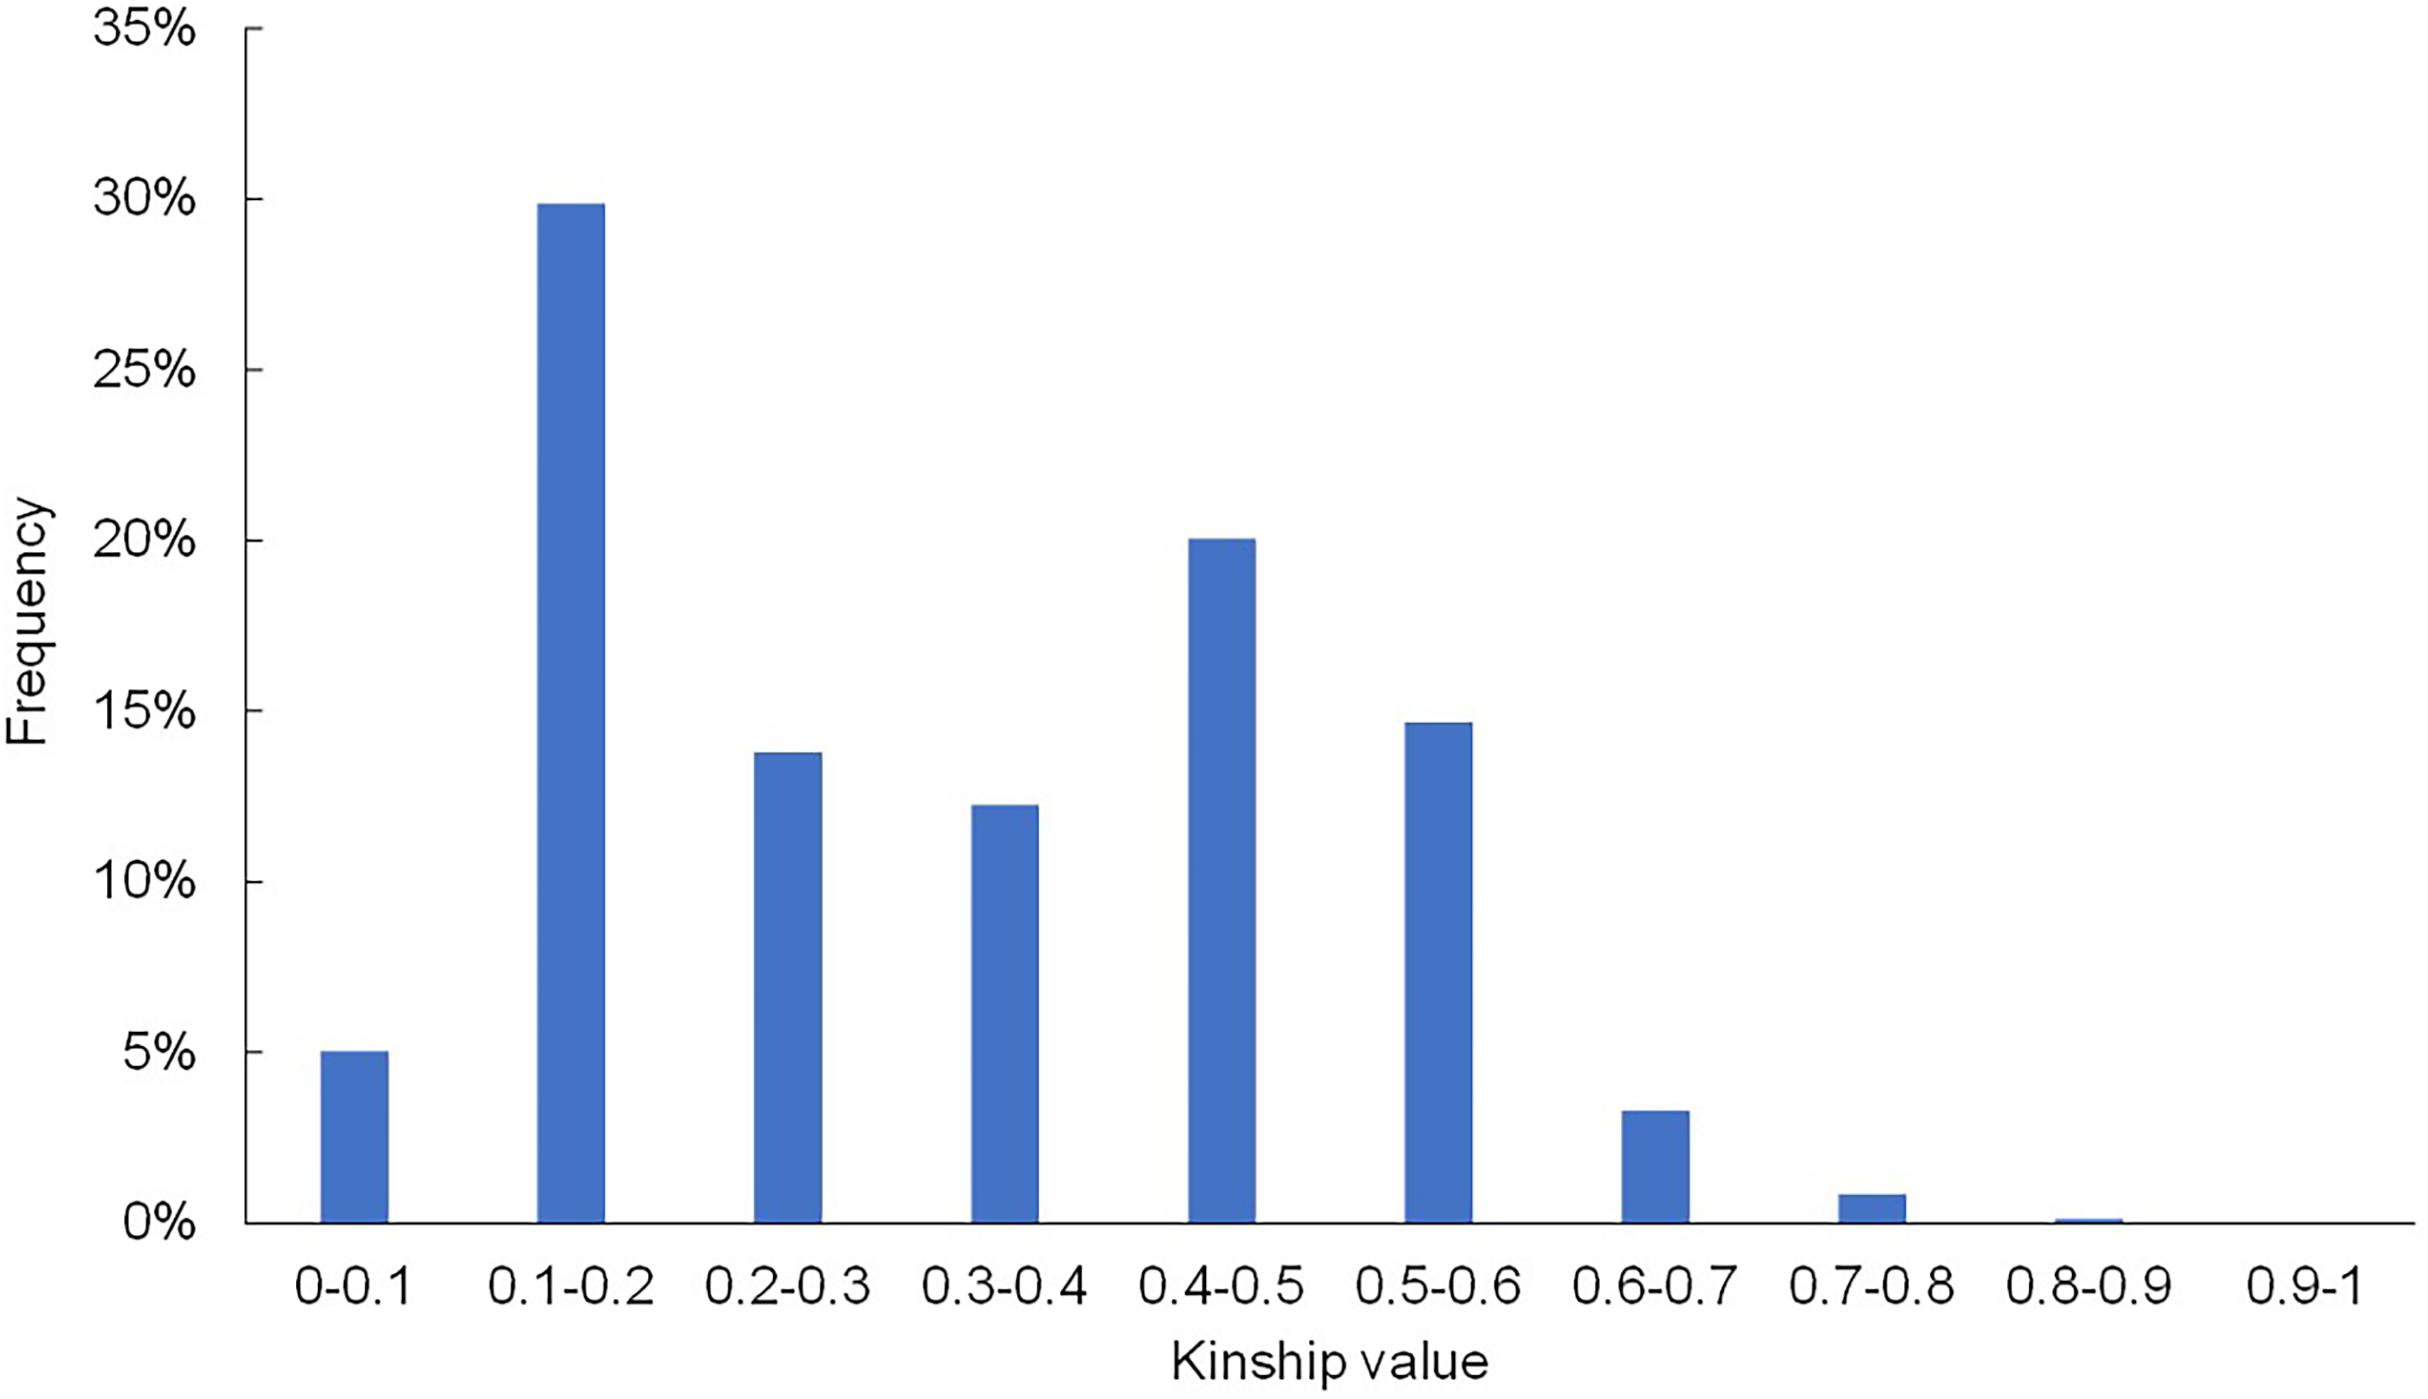
Figure 2. Histogram of the frequency distribution of pairwise relative kinship coefficients. The frequency of kinship values 0–0.5 was greater than 80%, and only 0.15% of the kinship values were above 0.8.
Phenotypic Variability in Seed Traits
Differences in growth environments and years affected the weight and size of common bean seeds. Hundred seed weight, SL, SWI and SH were evaluated in six environments, namely, 2014_HRB, 2014_BJ, 2015_HRB, 2015_BJ, 2016_HRB, and 2016_BJ. Each trait had a high degree of variation (Figure 3), especially SWI (Figure 3I–M).
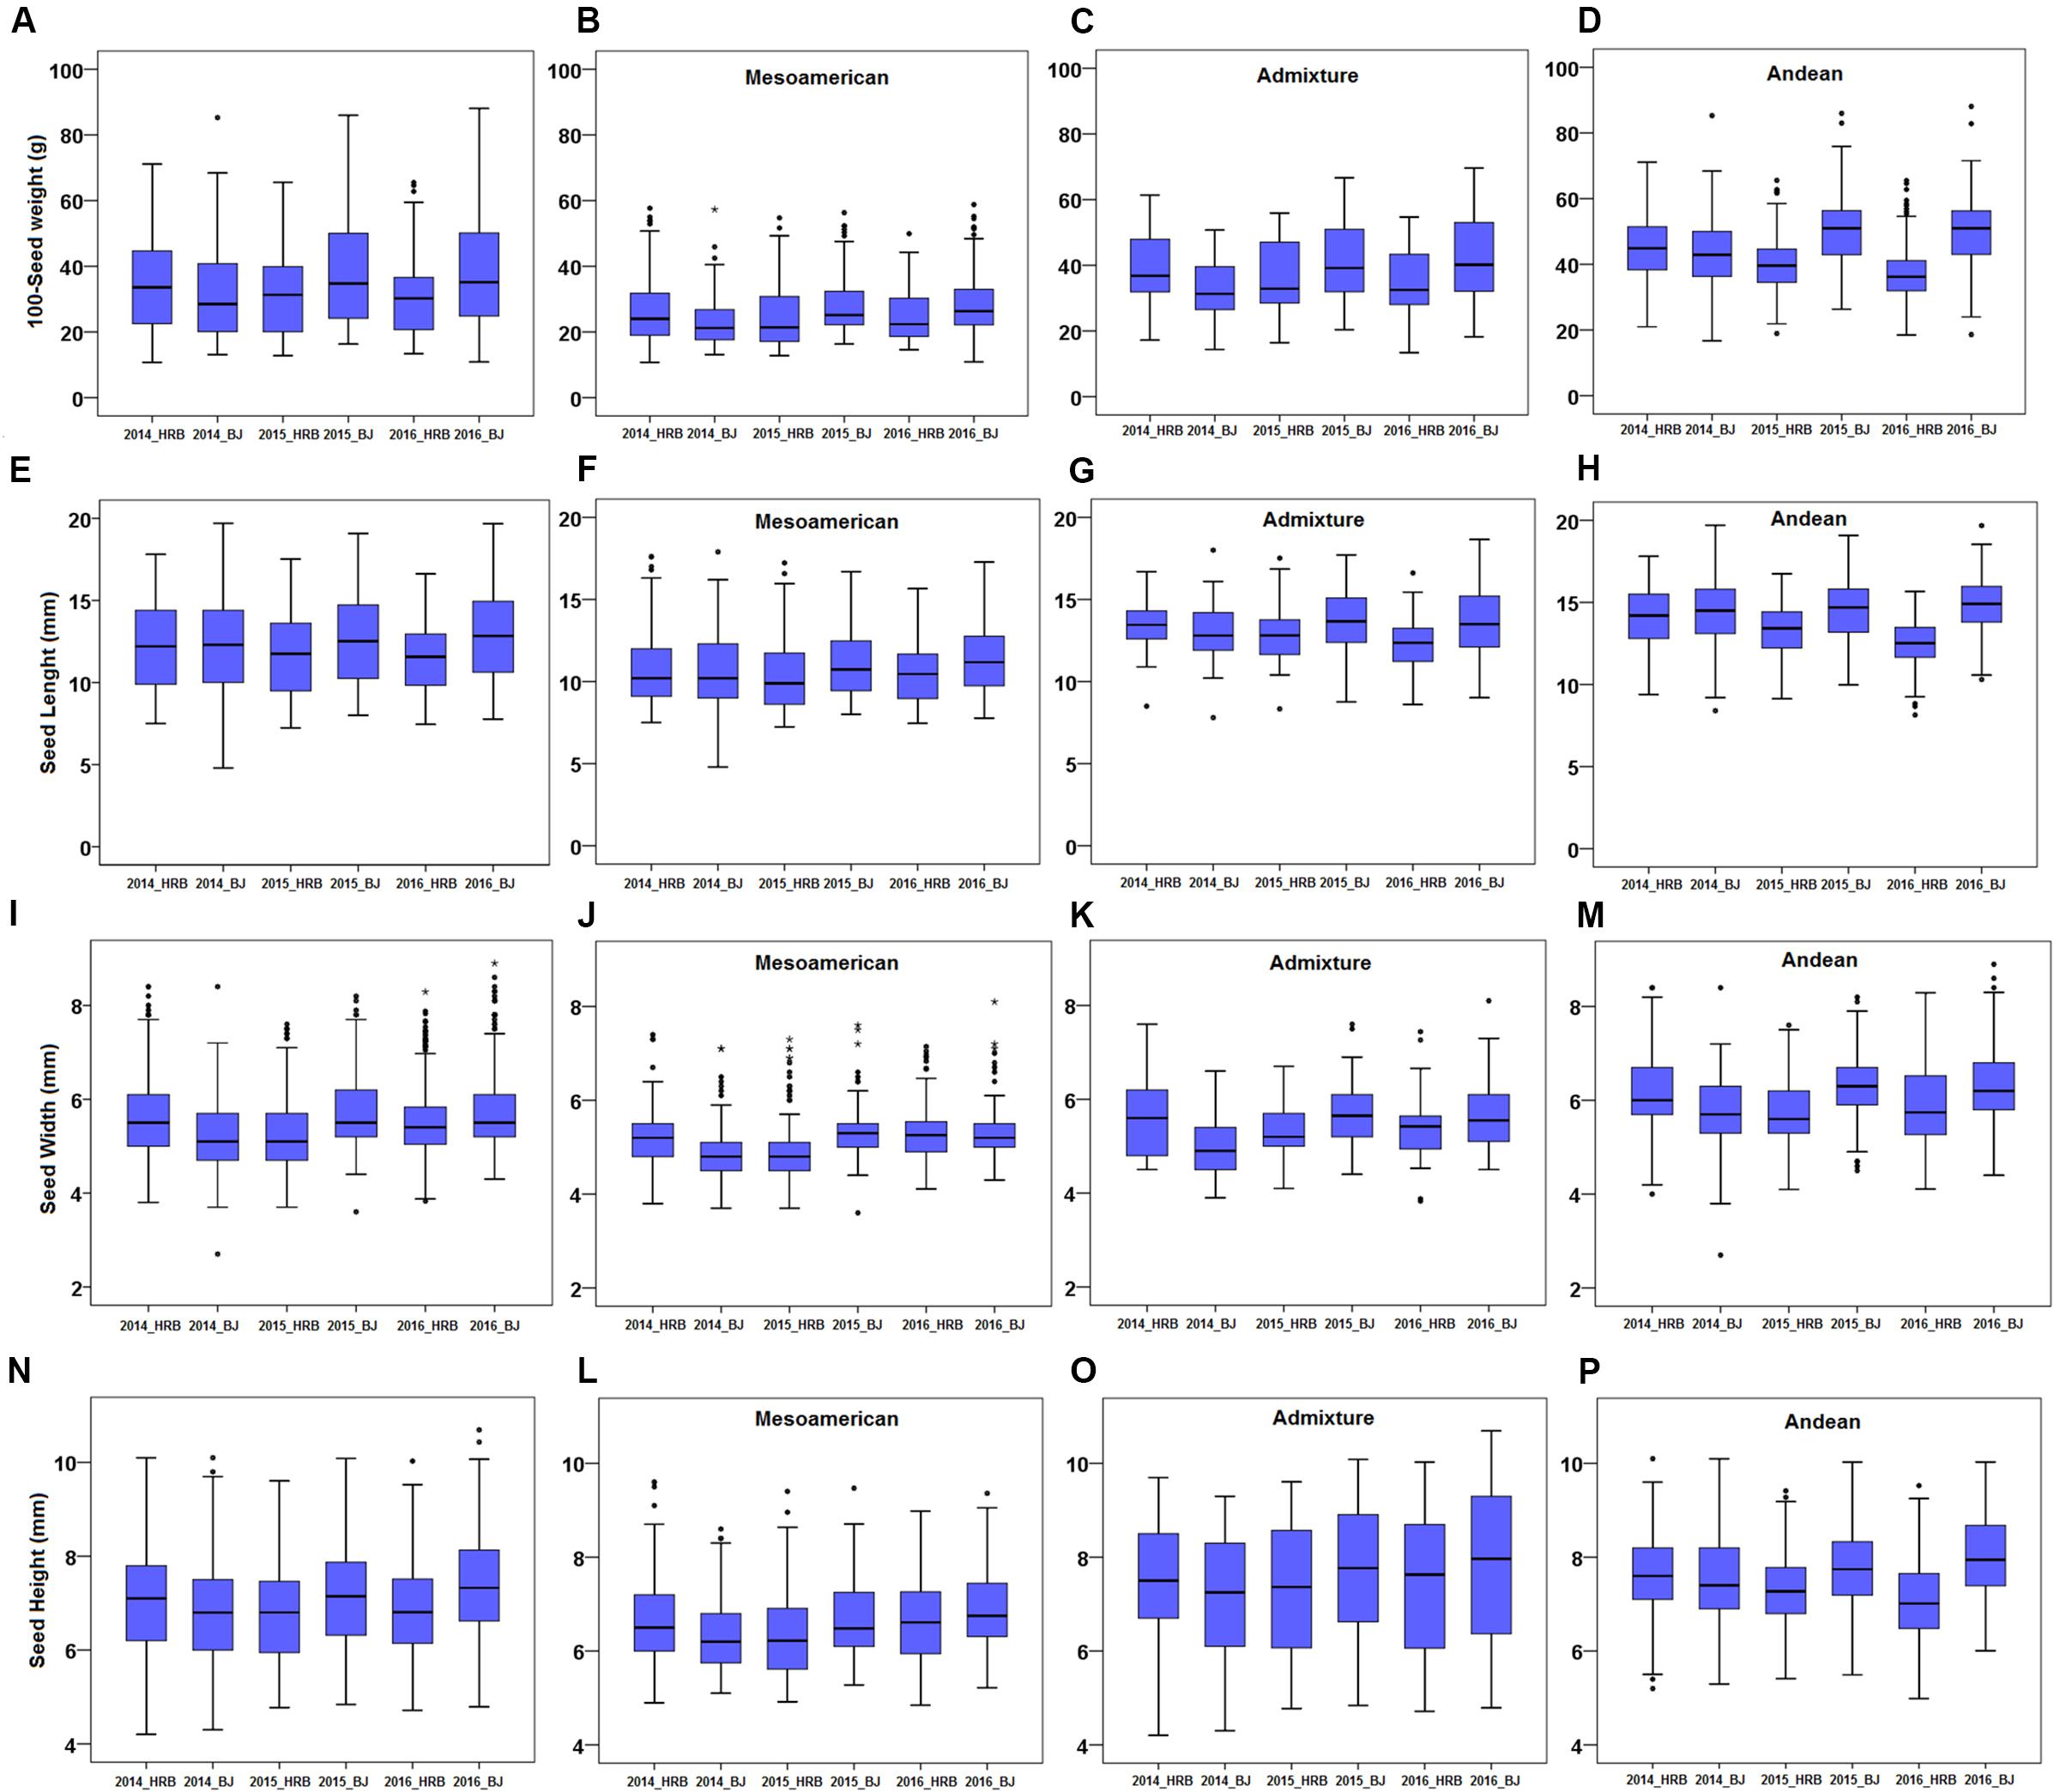
Figure 3. Seed size phenotypes in a common bean population. (A–D) 100-seed weight (100SW) of the population: (A) 100SW of all accessions, (B) 100SW of the Mesoamerican subgroup, (C) 100SW of the admixed lines, and (D) 100SW of the Andean subgroup. (E–H) Seed length (SL) of the population: (E) SL of all accessions, (F) SL of the Mesoamerican subgroup, (G) SL of the admixed lines, and (H) SL of the Andean subgroup. (I–M) Seed width (SW) of the population: (I) SW of all accessions, (J) SW of the Mesoamerican subgroup, (K) SW of the admixed lines, and (M) SW of the Andean subgroup. (N–P) Seed height (SH) of the population: (N) SH of all accessions, (L) SH of the Mesoamerican subgroup, (O) SH of the admixed lines, and (P) SH of the Andean subgroup. Means were used to assess the differences between environments, and the values are reported as means ± SD. Asterisk indicates outliers.
There were significant differences among the environments (Table 1). For the four traits, the differences between years in the same location were smaller than the differences between locations, and there was almost no difference in the same location, such as between 2015_BJ and 2016_BJ or 2015_HRB and 2016_HRB. However, differences between locations were significant. In addition, the heritability of these four traits in each year and environment was analyzed, and the heritability were in the range of 50–70%, so it showed that the environment has a relatively high level of phenotypic plasticity in seed traits. These findings indicated that the environment had a strong impact on traits and the necessity of multipoint phenotypic investigations.
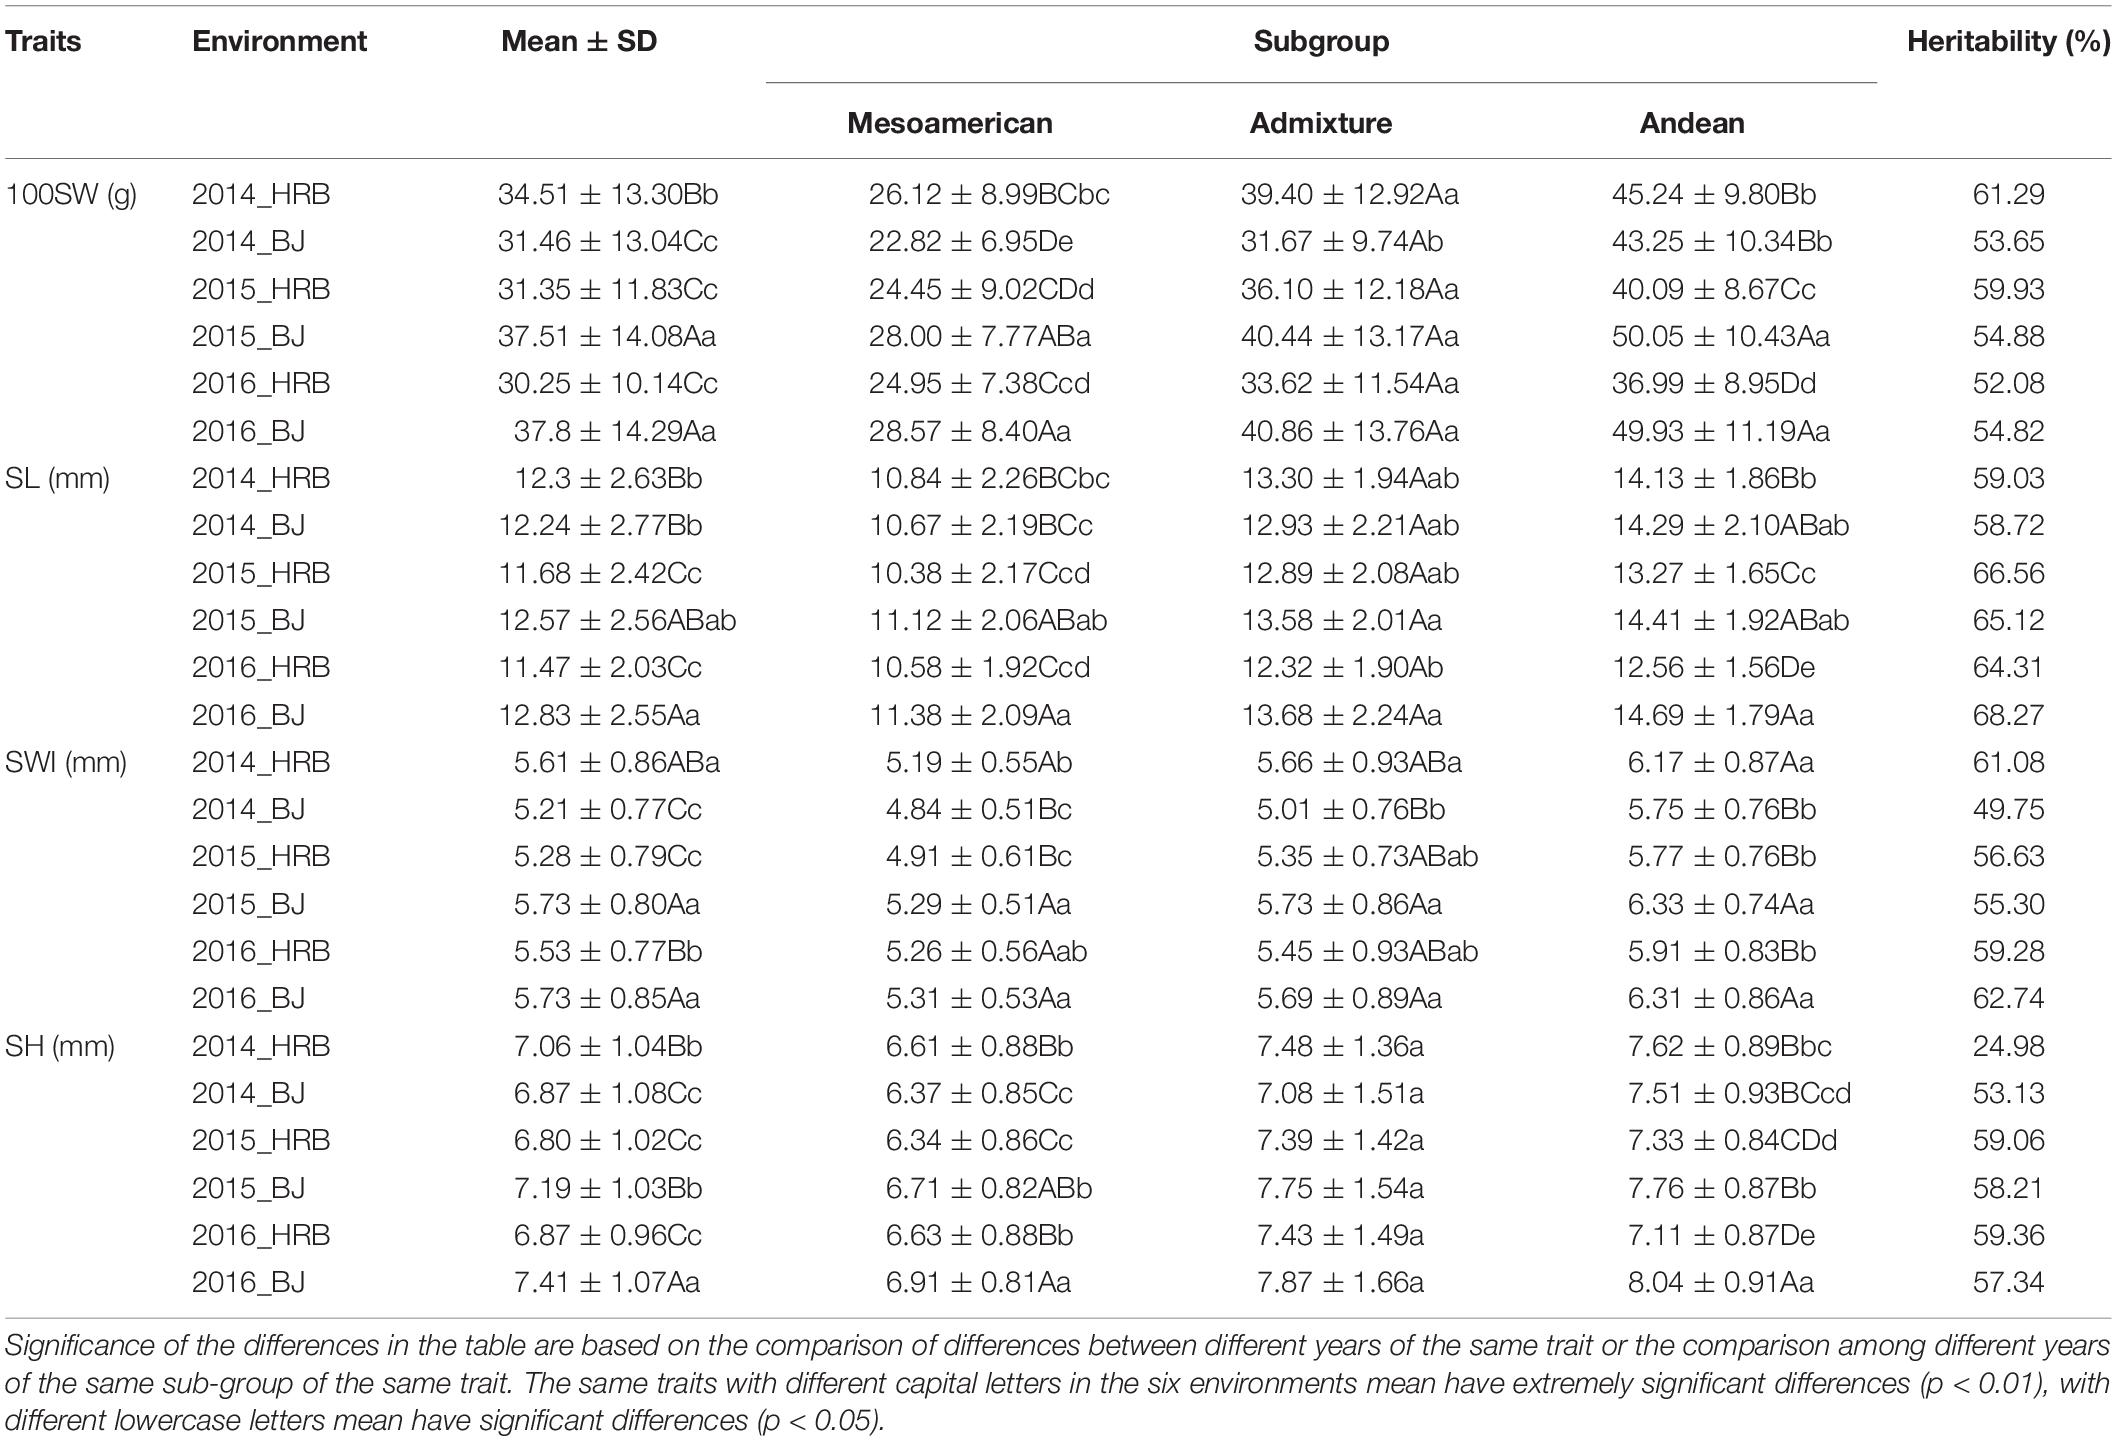
Table 1. ANOVA analysis of trait in different environments.
Furthermore, ANOVA was carried out in different subgroups in the same environment (Table 2). Mesoamerican, admixed and Andean groups were assembled based on the grouping results from STRUCTURE. Among these three subgroups, the Andean group always produced large seeds, while the Mesoamerican group produced small seeds and the admixed group produced medium seeds. These three subgroups showed significant differences, especially the Mesoamerican and Andean subgroups.
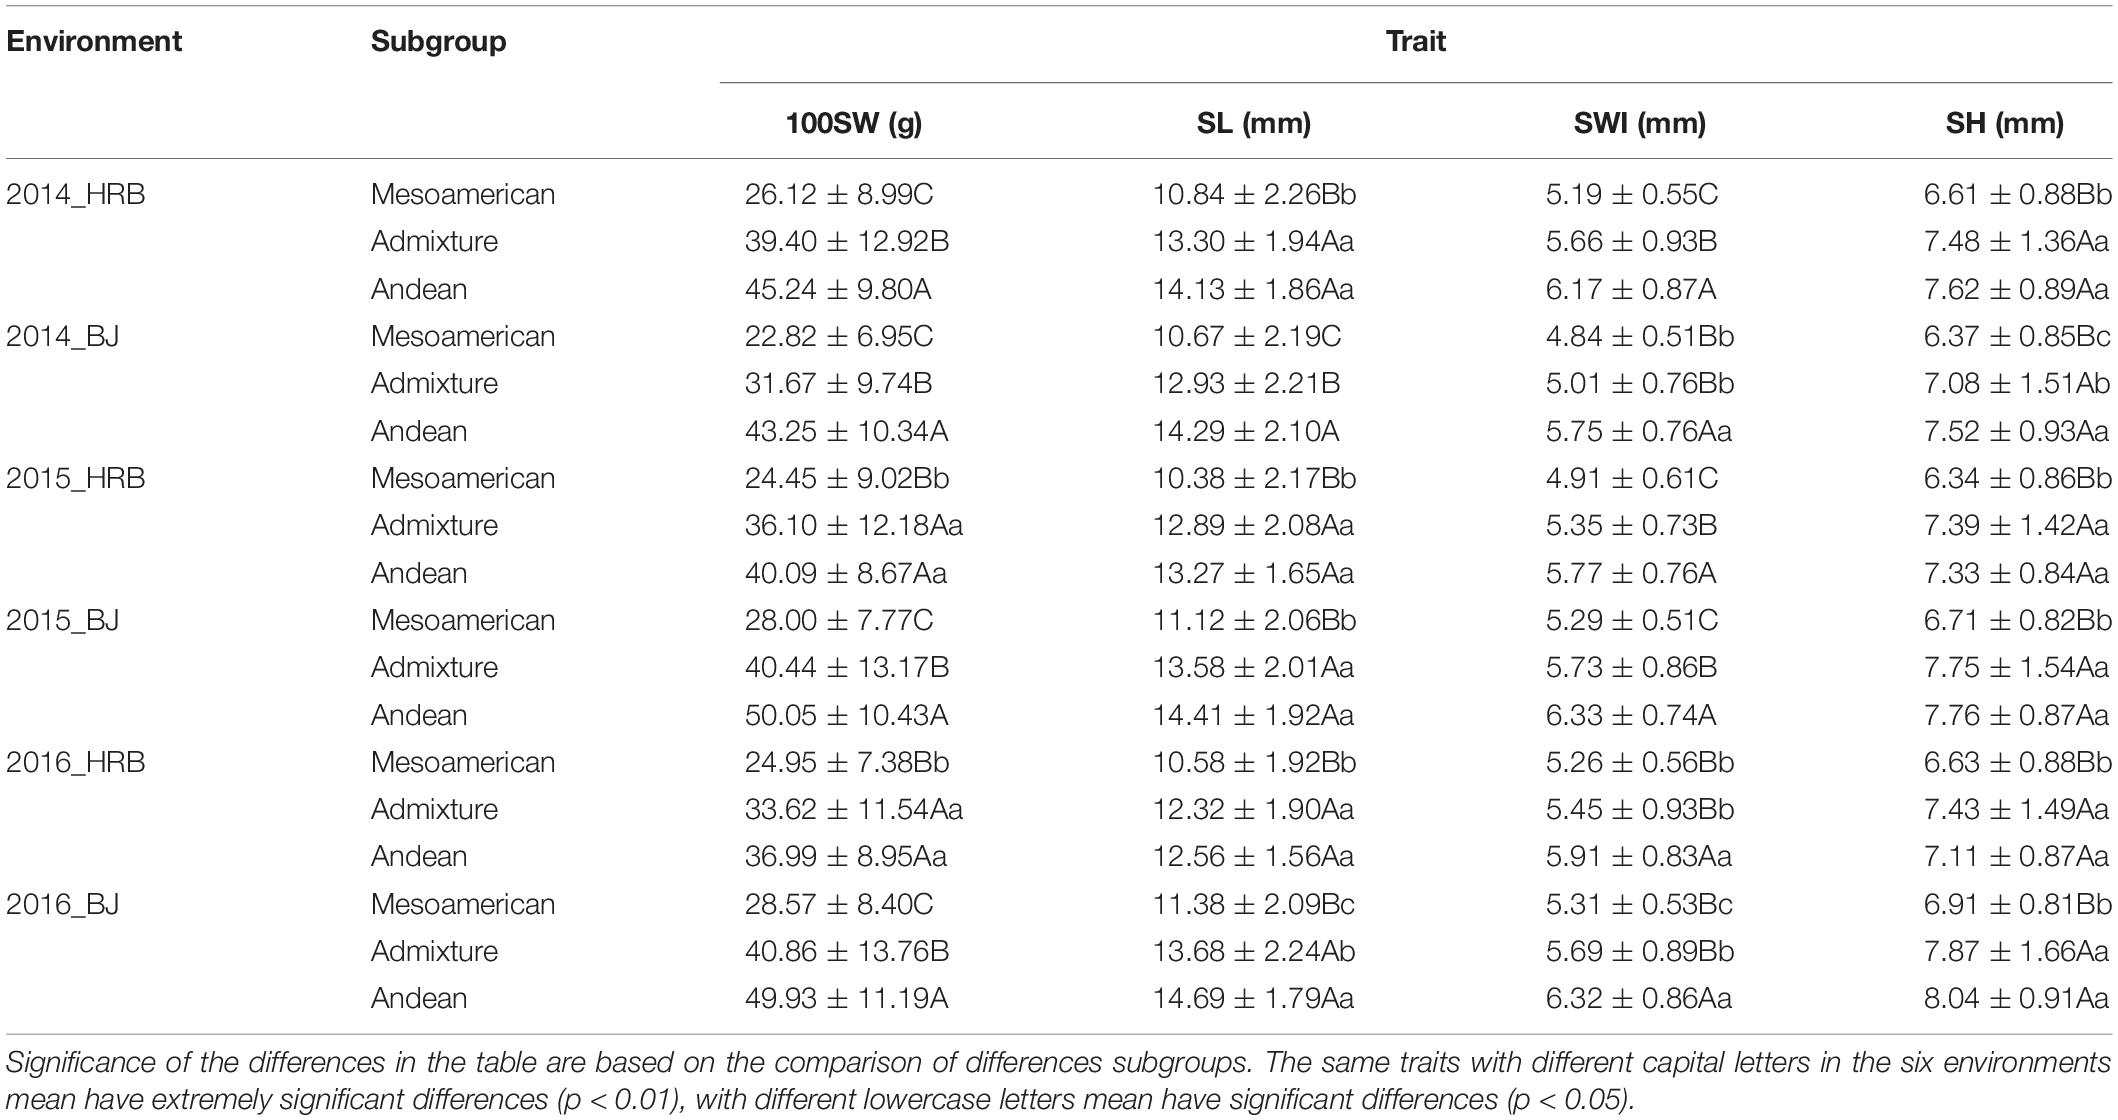
Table 2. ANOVA analysis of trait in different subgroups.
Further exploring the correlation among the traits, we found that 100SW, SL, SWI, and SH were all significantly positively correlated with each other in all six environments (Table 3). Thus, these four seed traits were closely related to each other.
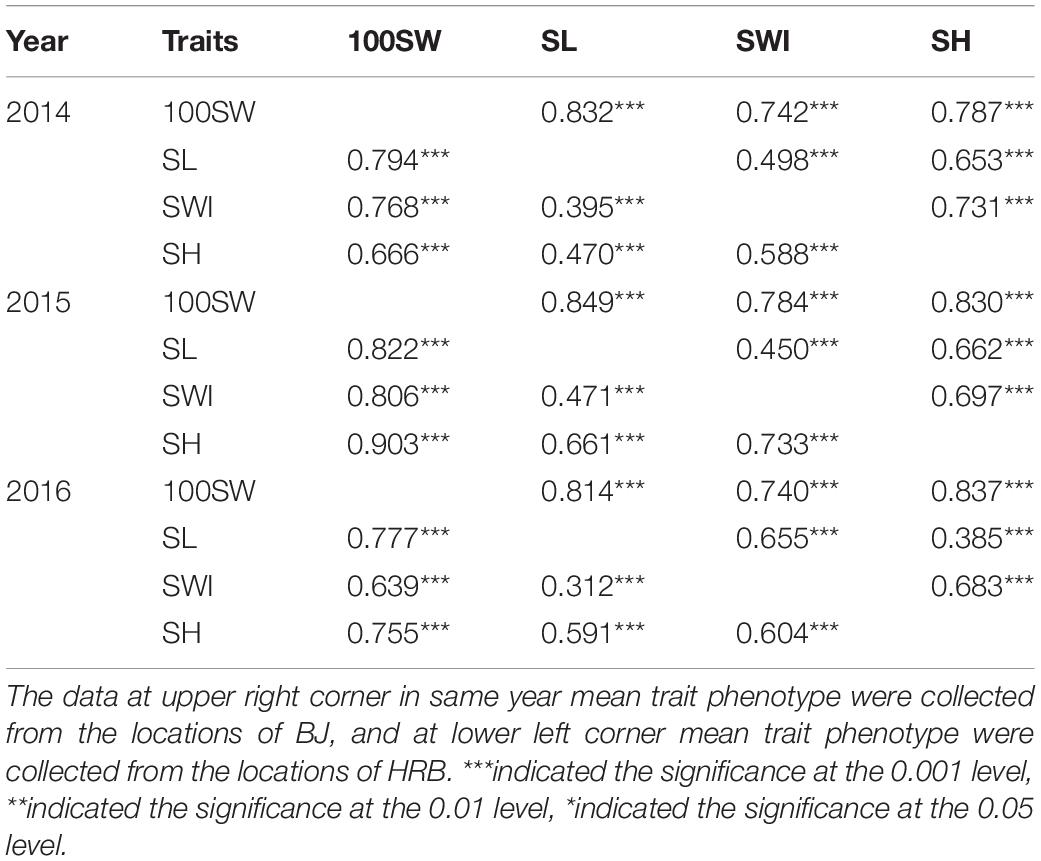
Table 3. Pearson correlation coefficients for seed traits of common bean.
Marker-Trait Association Analysis of Seed Traits
Association analysis Genome-wide association studies (GWAS) was conducted using SSR markers and the phaseolin locus (Phs) with six phenotypic data sets and two models, namely, GLM + Q and MLM + Q + K. A QTL for Phs was identified in LG 07 that spanned a region reported to code for phaseolin seed protein (Nodari et al., 1992; Koinange et al., 1996; Park et al., 2000). Phs has been demonstrated to be significantly associated with 100SW, SWI, and SL (Blair et al., 2009). We were interested in confirming the associations identified in previous studies of QTLs for these traits. All the results met the strict threshold of 4.3 × 10⁻⁴ and had a significance level of 0.05 after Bonferroni correction for both models.
Regarding 100SW, a total of 60 significant SSR markers were detected using the GLM + Q model (Figure 4). Among these markers, 23 were detected in all six environments (Supplementary Table S4). In contrast, only four significant SSR markers were detected with the MLM + Q + K model (Figure 4 and Supplementary Table S5), and these four markers were detected in only a single environment.
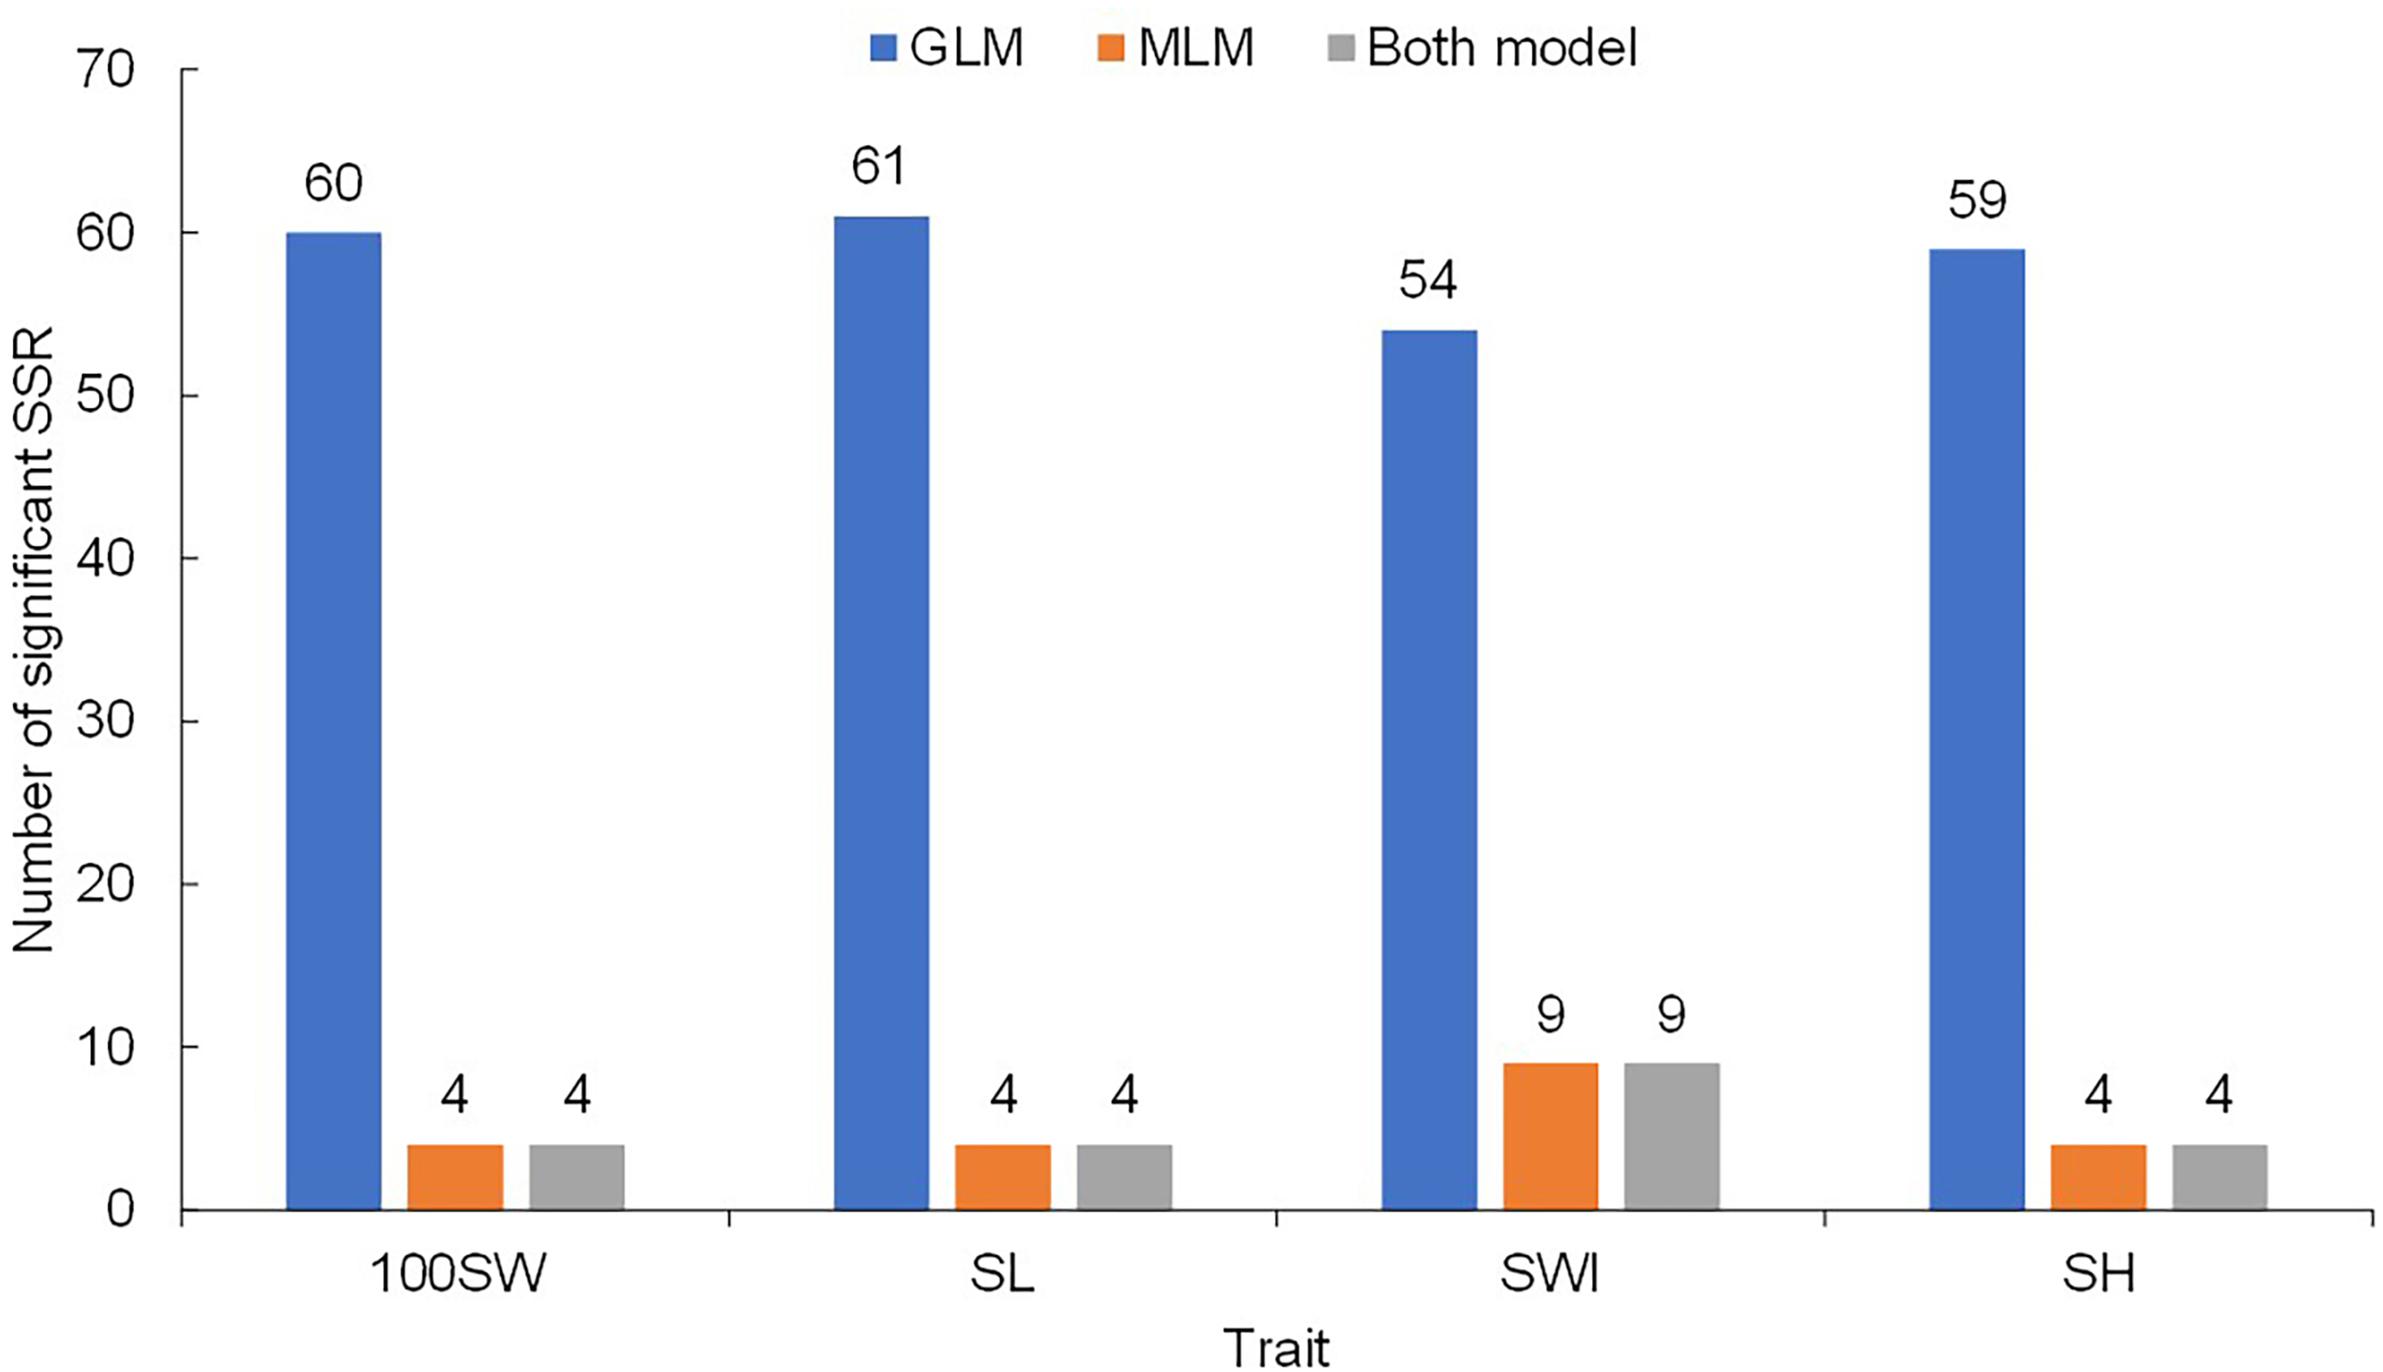
Figure 4. Simple sequence repeat (SSR) markers detected by using different models.
Similarly, 61 significant SSR markers were associated with SL in the GLM + Q model (Figure 4), and 44 markers were detected in all six environments (Supplementary Table S4). However, only four significant markers were detected with the MLM + Q + K model, and all were located on Chr05 (Supplementary Table S5). The markers CBS162 and CBS178 were detected simultaneously in two environments with the MLM + Q + K model.
Similarly, 54 significant markers were associated with SWI based on the GLM + Q model, and 12 significant markers were detected in all six environments (Supplementary Table S4). In addition, under the MLM + Q + K model, 10 significant markers were detected (Supplementary Table S5). Among the 10 markers, CBS149 and CBS345 were simultaneously detected in three environments.
For SH, 59 significant markers were detected with the GLM + Q model, and 31 significant markers were detected in all six environments (Supplementary Table S4). However, only four significant markers were detected with the MLM + Q + K model (Supplementary Table S5), and these four markers were detected in a single environment.
In summary, a total of 20 significant SSR markers were detected for four seed traits with both models (Figure 5). Some markers were simultaneously significantly associated with multiple traits, such as the marker CBS162, which was significantly associated with 100SW and SL; CBS381, which was significantly associated with 100SW and SH; and CBS149, which was significantly associated with SWI and SH. This result once again proved that there were correlations among seed traits or that the traits may have overlapping genetic control regions. Moreover, the Phs was found to be associated with SWI based on the two models used in our study (Supplementary Table S6).
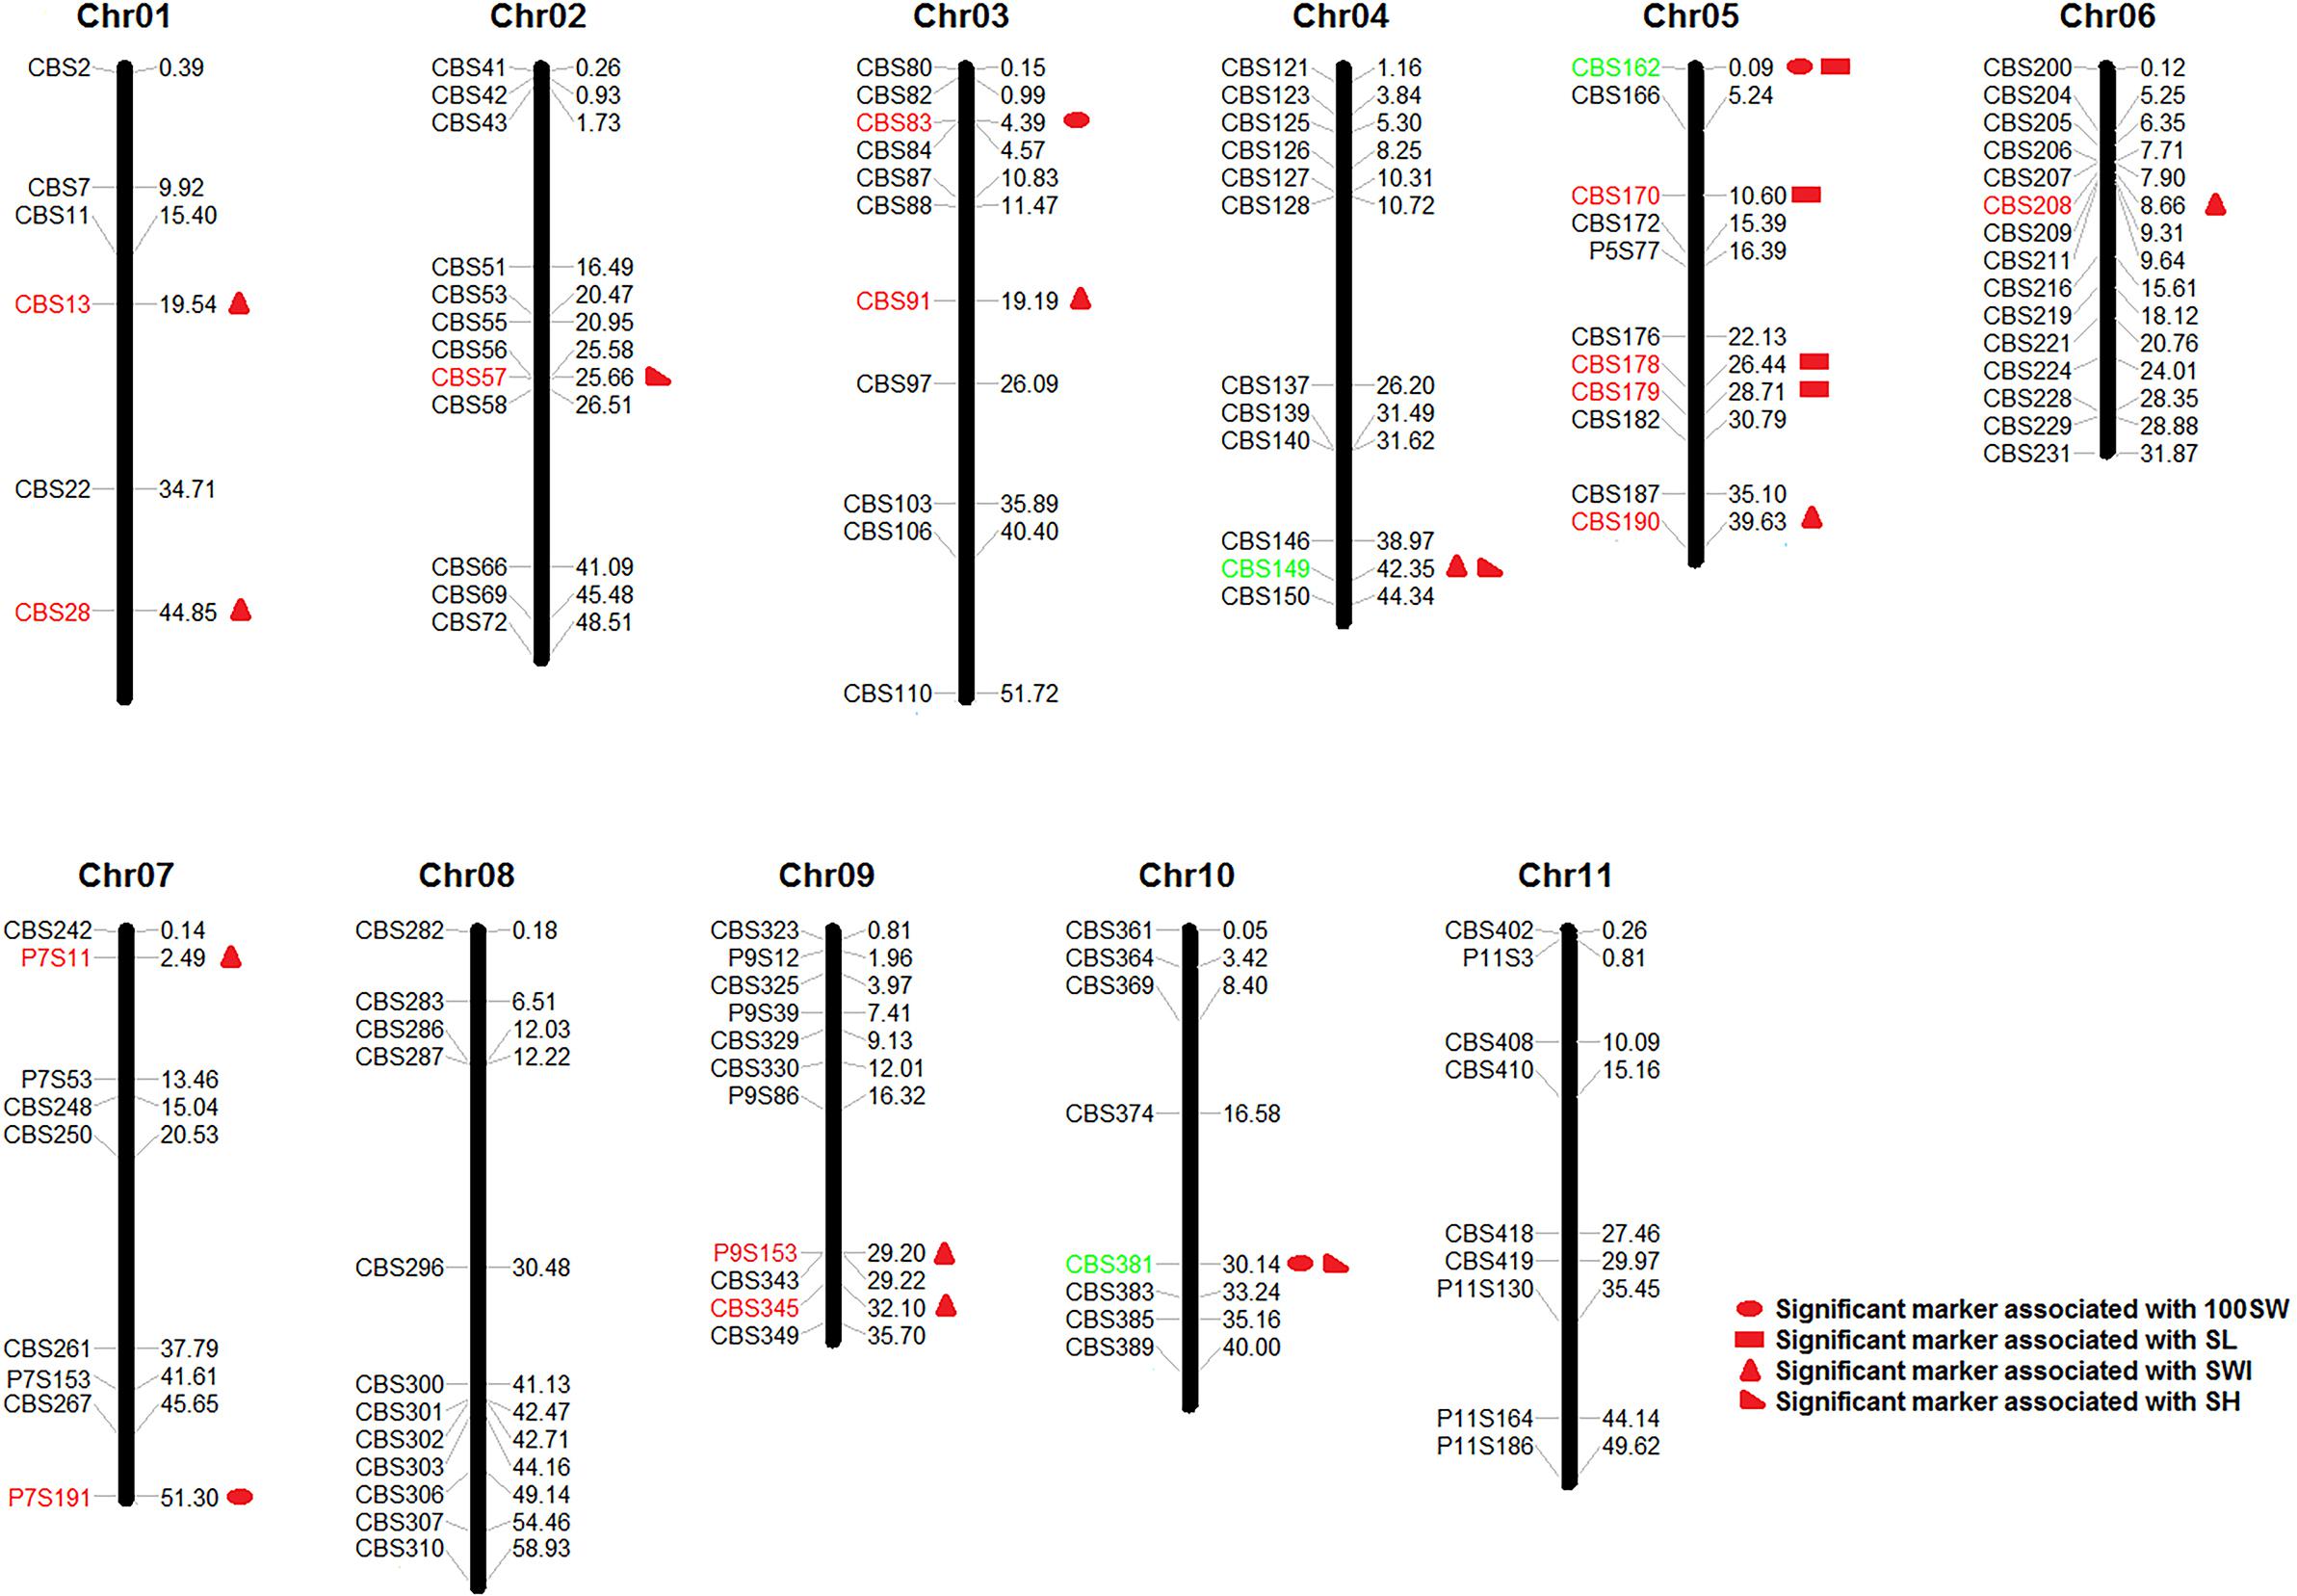
Figure 5. Markers significantly associated with seed traits [100-seed weight (100SW), seed length (SL), seed width (SWI), and seed height (SH)] that were detected with both the GLM + Q model and the MLM + Q + K model. Red markers were significantly associated with a single seed trait, while green markers were significantly associated with multiple seed traits.
Discussion
In this study, we evaluated the genetic diversity of common bean accessions with phaseolin and SSR markers, and phaseolin diversity revealed that the genetic diversity of Chinese common bean was higher than that in other countries or areas (Rodiño et al., 2001, 2006; Blair et al., 2003; Ocampo et al., 2005; Negahi et al., 2014). We even detected several Chinese landraces with phaseolin types such as CH, To, and H, which suggested that the landraces of China have rich variation. Many studies have shown a correlation between phaseolin type and seed weight, seed size, low soil pH, growth habit, precocity and antiparasitic traits (Hartana and Bliss, 1984; Gepts and Bliss, 1986; Koenig et al., 1990; Johnson et al., 1996; Escribano et al., 1998). Therefore, it is very important to identify the phaseolin type of China’s preserved common bean germplasm, which will facilitate yield and insect resistance breeding.
Regarding population structure, Phaseolin and SSR markers from the present study both reveal Chinese common bean germplasms containing two gene pools materials, and the main group of Chinese accessions were of Mesoamerican origin, with fewer of Andean origin. This is different from European countries, where Andean genotypes were more prevalent than Mesoamerican (Raggi et al., 2013; Maras et al., 2015; Caroviæ-Stanko et al., 2017; Pipan and Megliè, 2019). This different distribution of two gene pools genotypes in countries might be related to the time of germplasm introduction, adaptation abilities of germplasm, ecological types, the political regulation within these countries in the past, and consumer preferences. Additionally, distance-based analyses cluster analysis based on microsatellite markers in congruence with the results of phaseolin type analysis up to 88.6% in this study. These results showed that Phaseolin and SSR markers have sufficient power to distinguish between the Mesoamerican and Andean germplasms, and clear about the background of Chinese germplasm. The old and elite common bean landraces of China also has a diverse genetic background based on SSR markers (Supplementary Figure 2). Therefore, it is important to deeply explore the excellent germplasm resources of Chinese common bean and to tap the potential of Chinese common bean to increase yield and improve quality.
In the association analysis, the phaseolin marker Phs was significantly associated with SWI (Supplementary Table S6), which agreed with the result from a previous seed size association study (Blair et al., 2006). For the significant SSR markers, we selected a suitable linkage disequilibrium (LD) decay distance of approximately 100 Kb as the confidence interval for screening target trait candidate genes (Rossi et al., 2009). The marker P7S191, which was significantly associated with 100SW, was located near the QTL SW7′ in a previous study (Geng et al., 2017). We also identified significantly associated markers on Chr03 and Chr10 that a previous study reported as QTLs for 100SW (Nodari et al., 1993; Johnson et al., 1996; Freyre et al., 1998; Park et al., 2000; Guzmán-Maldonado et al., 2003; Blair et al., 2006). The confidence intervals of the two SSR markers CBS178 and CBS179 on Pv05, which were significant for SL, were (24014961, 24215231) and (29909932, 30110144), respectively. Both of these markers were included in the interval of a QTL (20.89–36.47 Mb on Pv05) previously reported for SL based on linkage analysis (Geng et al., 2017). These results are more helpful for confirming QTLs location related to seed traits. Nevertheless, the candidate QTLs for seed traits require further verification with improved accuracy such as SNP analysis due to the limitations of this study. Apart from these, we also found the phenomenon of marker one cause multiple effects among seed traits. There have been similar reports in previous studies on seed size of common bean (Blair et al., 2009; Geng et al., 2017). For example, Blair et al. (2009) reported the marker BM183 significantly associated with seed weight, width and length also in both genepools accessions. For this pleiotropism, how to balance the effect of the seed traits is essential to improve the yield. It is proposed that the ratio between the length, width and height of seed be correlated with genetic markers to obtain a trade-off between the two traits (Geng et al., 2017). Inspired by this, we can further obtain high yields by associated the ratios of seed length/width, length/height, width/height and length × width/height, length × height/width with SSR marker to balance each seed trait.
Conclusion
This study provides a comprehensive picture of genetic diversity and structure of Chinese common bean accessions. Out of 395 accessions, 54.43% were of Mesoamerican origin, 40.00% of Andean, while 5.57% of accessions represented putative hybrids between gene pools. For the most part, the classification of common bean accessions according to phaseolin type analysis was in congruence with the results of distance-based analyses of SSR marker. Based on the population structure, 20 significant SSR markers and 1 significant phaseolin marker were associated with the 4 seed traits by GLM and MLM in this study. Association data of seed traits can be used for common bean breeding, especially in terms of its adaptation to different environments. Thus, by combining and genomic selection, we can effectively select the effective QTL alleles for seed weight and size in breeding populations. The results of this study provide a valuable resource to dissect the role of candidate QTL locus regions of the genome governing seed weight/size in common bean.
Data Availability Statement
The raw data supporting the conclusions of this manuscript will be made available by the authors, without undue reservation, to any qualified researcher.
Author Contributions
All authors contributed to the article and approved the submitted version.
Funding
This work was supported by grants from the National Key R&D Program of China (2018YFD1000700/2018YFD1000704), the Ministry of Agriculture of China [the earmarked fund for the China Agriculture Research System (CARS-08)], the Agricultural Science and Technology Innovation Program of CAAS, and the Fundamental Research Funds for the Chinese Academy of Agricultural Sciences (Y2020GH14-2).
Conflict of Interest
The authors declare that the research was conducted in the absence of any commercial or financial relationships that could be construed as a potential conflict of interest.
Supplementary Material
The Supplementary Material for this article can be found online at: https://www.frontiersin.org/articles/10.3389/fgene.2020.00698/full#supplementary-material
Footnotes
- ^ http://www.fao.org/faostat/en/
- ^ http://www.powermarker.net
- ^ http://royfrancis.github.io/pophelper/
References
Afanador, L. K., Haley, S. D., and Kelly, J. D. (1993). Adoption of a “mini prep” DNA extraction method for RAPD marker analysis in common bean (Phaseolus vulgaris L.). Annu. Rep. Bean Improv. Coop. 36, 10–11.
Beattie, A. D., Larsen, J., Michaels, T. E., and Pauls, K. P. (2003). Mapping quantitative trait loci for a common bean (Phaseolus vulgaris L.) ideotype. Genome 46, 411–422. doi: 10.1139/g03-015
Beebe, S. E., Rojas-Pierce, M., Yan, X., Blair, M. W., Pedraza, F., Munoz, F., et al. (2006). Quantitative trait loci for root architecture traits correlated with phosphorus acquisition in common bean. Crop Sci. 46, 413–423. doi: 10.2135/cropsci2005.0226
Bellucci, E., Nanni, L., Biagetti, E., Bitocchi, E., Giardini, A., Rau, D., et al. (2014). “Common bean origin, evolution and spread from America,” in Phaseolus: A New World Gift to mankind Why Common Beans are so Common?, ed. D. Rubiales (Córdoba: International Legume Society), 12–16.
Bitocchi, E., Bellucci, E., Giardini, A., Rau, D., Rodriguez, M., Biagetti, E., et al. (2013). Molecular analysis of the parallel domestication of the common bean (Phaseolus vulgaris) in Mesoamerica and the Andes. New Phytol. 197, 300–313. doi: 10.1111/j.1469-8137.2012.04377.x
Blair, M. W., Díaz, L. M., Buendía, H. F., and Duque, M. C. (2009). Genetic diversity, seed size associations and population structure of a core collection of common beans (Phaseolus vulgaris L.). Theor. Appl. Gene. 119, 955–972. doi: 10.1007/s00122-009-1064-8
Blair, M. W., Giraldo, M. C., Duran, L., Beaver, J., and Nin, J. C. (2003). Phaseolin characterization of Caribbean common bean germplasm. Annu. Rep. Bean Improv. Coop. 46, 63–64.
Blair, M. W., Iriarte, G., and Beebe, S. (2006). QTL analysis of yield traits in an advanced backcross population derived from a cultivated Andean× wild common bean (Phaseolus vulgaris L.) cross. Theor. Appl. Gene 112, 1149–1163. doi: 10.1007/s00122-006-0217-2
Bradbury, P. J., Zhang, Z., Kroon, D. E., Casstevens, T. M., Ramdoss, Y., and Buckler, E. S. (2007). TASSEL: software for association mapping of complex traits in diverse samples. Bioinformatics 23, 2633–2635. doi: 10.1093/bioinformatics/btm308
Broughton, W. J., Hernandez, G., Blair, M., Beebe, S., Gepts, P., and Vanderleyden, J. (2003). Beans (Phaseolus spp.)–model food legumes. Plant Soil 252, 55–128. doi: 10.1023/A:1024146710611
Caroviæ-Stanko, K., Liber, Z., Vidak, M., Barešiæ, A., Grdiša, M., Lazareviæ, B., et al. (2017). Genetic diversity of croatian common bean landraces. Front. Plant Sci. 8:604. doi: 10.3389/fpls.2017.00604
Checa, O. E., and Blair, M. W. (2012). Inheritance of yield-related traits in climbing beans (Phaseolus vulgaris L.). Crop Sci. 52, 1998–2013. doi: 10.2135/cropsci2011.07.0368
Díaz, L. M., and Blair, M. W. (2006). Race structure within the Mesoamerican gene pool of common bean (Phaseolus vulgaris L.) as determined by microsatellite markers. Theor. Appl. Gene. 114, 143–154. doi: 10.1007/s00122-006-0417-9
Earl, D. A., and vonHoldt, B. M. (2012). STRUCTURE HARVESTER: a website and program for visualizing STRUCTURE output and implementing the Evanno method. Conser. Genet. Resour. 4, 359–361. doi: 10.1007/s12686-011-95487
Escribano, M. R., Santalla, M., Casquero, P. A., and De Ron, A. M. (1998). Patterns of genetic diversity in landraces of common bean (Phaseolus vulgaris L.) from Galicia. Plant Breed. 117, 49–56. doi: 10.1111/j.1439-0523.1998.tb01447.x
Evanno, G., Regnaut, S., and Goudet, J. (2005). Detecting the number of clusters of individuals using the software STRUCTURE: a simulation study. Mol. Ecol. 14, 2611–2620. doi: 10.1111/j.1365-294X.2005.02553.x
Falush, D., Stephens, M., and Pritchard, J. K. (2007). Inference of population structure using multilocus genotype data: dominant markers and null alleles. Mol. Ecol. Notes 7, 574–578. doi: 10.1111/j.14718286.2007.01758.x
Freyre, R., Skroch, P. W., Geffroy, V., Adam-Blondon, A. F., Shirmohamadali, A., Johnson, W. C., et al. (1998). Towards an integrated linkage map of common bean. 4. Development of a core linkage map and alignment of RFLP maps. Theor. Appl. Gene 97, 847–856. doi: 10.1007/s001220050964
Galeano, C. H., Cortés, A. J., Fernández, A. C., Soler, Á, Franco-Herrera, N., Makunde, G., et al. (2012). Gene-based single nucleotide polymorphism markers for genetic and association mapping in common bean. BMC Genet. 13:48. doi: 10.1186/1471-2156-13-48
Galeano, C. H., Fernandez, A. C., Franco-Herrera, N., Cichy, K. A., McClean, P. E., Vanderleyden, J., et al. (2011). Saturation of an intra-gene pool linkage map: towards a unified consensus linkage map for fine mapping and synteny analysis in common bean. PLoS One 6:e28135. doi: 10.1371/journal.pone.0028135
Gaut, B. S. (2014). The complex domestication history of the common bean. Nat. Genet. 46, 663–664. doi: 10.1038/ng.3017
Geng, Q. H., Wang, L. F., Wu, J., and Wang, S. M. (2017). QTL mapping for seed size and shape in common bean. Acta Agron. Sin. 43, 1149–1160.
Gepts, P., and Bliss, F. A. (1986). Phaseolin variability among wild and cultivated common beans (Phaseolus vulgaris) from Colombia. Econ. Bot. 40, 469–478. doi: 10.1007/bf02859660
Gepts, P., and Debouck, D. (1991). “Origin, domestication, and evolution of the common bean (Phaseolus vulgaris L.),” in Common Beans: Research for Crop Improvement, eds A. Schoonhoven and O. Voysest (Colombia: CIAT press), 7–53.
Gepts, P., Osborn, T. C., Rashka, K., and Bliss, F. A. (1986). Phaseolin-protein variability in wild forms and landraces of the common bean (Phaseolus vulgaris): evidence for multiple centers of domestication. Econ. Bot. 40, 451–468. doi: 10.1007/BF02859659
González, A. M., Yuste-Lisbona, F. J., Fernández-Lozano, A., Lozano, R., and Santalla, M. (2017). “Genetic mapping and QTL analysis in common bean,” in The Common Bean Genome, eds S. Pérez de la Vega, M. Santalla, and F. Marsolais (Switzerland: Spring International Publishing AG press), 69–107. doi: 10.1007/978-3-319-63526-2_4
Guzmán-Maldonado, S. H., Martínez, O., Acosta-Gallegos, J. A., Guevara-Lara, F., and Paredes-Lopez, O. (2003). Putative quantitative trait loci for physical and chemical components of common bean. Crop Sci. 43, 1029–1035. doi: 10.2135/cropsci2003.1029
Hanai, L. R., Santini, L., Camargo, L. E. A., Fungaro, M. H. P., Gepts, P., Tsai, S. M., et al. (2010). Extension of the core map of common bean with EST-SSR, RGA, AFLP, and putative functional markers. Mol. Breed. 25, 25–45. doi: 10.1007/s11032-009-9306-7
Hartana, A., and Bliss, F. A. (1984). Genetic variability in seed protein levels associated with two phaseolin protein type in common bean (Phaseolus vulgaris L.). Annu. Rep. Bean Improv. Coop. 27:159.
Igrejas, G., Carnide, V., Pereira, P., Mesquita, F., and Guedes-Pinto, H. (2009). Genetic diversity and phaseolin variation in Portuguese common bean landraces. Plant Genet. Resour. 7, 230–236. doi: 10.1017/s1479262109264124
Johnson, W. C., and Gepts, P. (2002). The role of epistasis in controlling seed yield and other agronomic traits in an Andean×Mesoamerican cross of common bean (Phaseolus vulgaris L.). Euphytica 125, 69–79. doi: 10.1023/A:1015775822132
Johnson, W. C., Menéndez, C., Nodari, R., Koinange, E. M., Magnusson, S., Singh, S. P., et al. (1996). Association of a seed weight factor with the phaseolin seed storage protein locus across genotypes, environments, and genomes in Phaseolus-Vigna spp.: Sax (1923) revisited. J. Agric. Genomics 2, 1–19.
Koenig, R. L., Singh, S. P., and Gepts, P. (1990). Novel phaseolin types in wild and cultivated common bean (Phaseolus vulgaris, Fabaceae). Econ. Bot. 44, 50–60. doi: 10.1007/BF02861066
Koinange, E. M., Singh, S. P., and Gepts, P. (1996). Genetic control of the domestication syndrome in common bean. Crop Sci. 36, 1037–1045. doi: 10.2135/cropsci1996.0011183X003600040037x
Krupa, U. (2008). Main nutritional and antinutritional compounds of bean seeds-a review. Pol. J. Food Nutr. Sci. 58, 149–155. doi: 10.7589/0090355844.3.731
Kutoš, T., Golob, T., Kaè, M., and Plestenjak, A. (2003). Dietary fibre content of dry and processed beans. Food Chem. 80, 231–235. doi: 10.1016/S0308-8146(02)00258-3
Liu, K., and Muse, S. V. (2005). PowerMarker: an integrated analysis environment for genetic marker analysis. Bioinformatics 21, 2128–2129. doi: 10.1093/bioinformatics/bti282
Ma, Y., and Bliss, F. A. (1978). Seed proteins of common bean 1. Crop Sci. 18, 431–437. doi: 10.2135/cropsci1978.0011183X001800030018x
Mamidi, S., Rossi, M., Annam, D., Moghaddam, S., Lee, R., Papa, R., et al. (2011). Investigation of the domestication of common bean (Phaseolus vulgaris) using multilocus sequence data. Funct. Plant Biol. 38, 953–967. doi: 10.1071/FP11124
Mamidi, S., Rossi, M., Moghaddam, S. M., Annam, D., Lee, R., Papa, R., et al. (2013). Demographic factors shaped diversity in the two gene pools of wild common bean Phaseolus vulgaris L. Heredity. 110, 267–276. doi: 10.1038/hdy.2012.82
Maras, M., Pipan, B., Utar-Vozli, J., Todorovi, V., and Megliè, V. (2015). Examination of genetic diversity of common bean from the western Balkans. J. Am. Soc. Hortic. Sci. 140, 308–316. doi: 10.21273/JASHS.140.4.308
McClean, P., Gepts, P., and Kamir, J. (2004). Genomics and genetic diversity in common bean. Legume Crop Genomics 61–82.
McClean, P. E., Lee, R. K., Otto, C., Gepts, P., and Bassett, M. J. (2002). Molecular and phenotypic mapping of genes controlling seed coat pattern and color in common bean (Phaseolus vulgaris L.). J. Hered. 93, 148–152. doi: 10.1093/jhered/93.2.148
Montoya, C. A., Lallès, J. P., Beebe, S., and Leterme, P. (2010). Phaseolin diversity as a possible strategy to improve the nutritional value of common beans (Phaseolus vulgaris). Food Res. Int. 43, 443–449. doi: 10.1016/j.foodres.2009.09.040
Motto, M., Soressi, G. P., and Salamini, F. (1978). Seed size inheritance in a cross between wild and cultivated common beans (Phaseolus vulgaris L.). Genetica 49, 31–36. doi: 10.1007/BF00187811
Mukeshimana, G., Butare, L., Cregan, P. B., Blair, M. W., and Kelly, J. D. (2014). Quantitative trait loci associated with drought tolerance in common bean. Crop Sci. 54, 923–938. doi: 10.2135/cropsci2013.06.0427
Negahi, A. Z. A. M., Bihamta, M. R., and Negahi, Z. A. H. R. A. (2014). Diversity in Iranian and exotic common bean (Phaseolus vulgaris L.) using seed storage protein (Phaseolin). Agric. Commun. 2, 34–40.
Nodari, R. O., Koinange, E. M. K., Kelly, J. D., and Gepts, P. (1992). Towards an integrated linkage map of common bean. Theor. Appl. Gene 84, 186–192. doi: 10.1007/bf00223999
Nodari, R. O., Tsail, S. M., Gilbertson, R. L., and Gepts, P. (1993). Towards an integrated linkage map of common bean 2. Development of an RFLP-based linkage map. Theor. Appl. Gene 85, 513–520. doi: 10.1007/BF00220907
Ocampo, C. H., Martín, J. P., Sánchez-Yélamo, M. D., Ortiz, J. M., and Toro, O. (2005). Tracing the origin of Spanish common bean cultivars using biochemical and molecular markers. Genet. Resour. Crop Evol. 52, 33–40. doi: 10.1007/s10722-005-1931-3
Park, S. O., Coyne, D. P., Jung, G., Skroch, P. W., Arnaud-Santana, E., Steadman, J. R., et al. (2000). Mapping of QTL for seed size and shape traits in common bean. J. Am. Soc. Hortic. Sci. 125, 466–475. doi: 10.21273/JASHS.125.4.466
Peakall, R. O. D., and Smouse, P. E. (2006). GENALEX 6: genetic analysis in Excel. Population genetic software for teaching and research. Mol. Ecol. Notes 6, 288–295. doi: 10.1111/j.1471-8286.2005.01155.x
Pérez-Vega, E., Pañeda, A., Rodríguez-Suárez, C., Campa, A., Giraldez, R., and Ferreira, J. J. (2010). Mapping of QTLs for morpho-agronomic and seed quality traits in a RIL population of common bean (Phaseolus vulgaris L.). Theor. Appl. Gene 120, 1367–1380. doi: 10.1007/s00122-010-1261-5
Pipan, B., and Megliè, V. (2019). Diversification and genetic structure of the western-to-eastern progression of European Phaseolus vulgaris L. germplasm. BMC Plant Biol. 19:442. doi: 10.1186/s12870-019-2051-0
Pritchard, J. K., Stephens, M., Rosenberg, N. A., and Donnelly, P. (2000). Association mapping in structured populations. Am. J. Hum. Genet. 67, 170–181. doi: 10.1086/302959
Qi, Y. (2015). Characterization of a Putative Yield-Related Gene in Common Bean (Phaseolus vulgaris L.). Ph.D.dissertation, The University of Guelph, Canada.
Raggi, L., Tiranti, B., and Negri, V. (2013). Italian common bean landraces: diversity and population structure. Genet. Resour. Crop Evol. 60, 1515–1530. doi: 10.1007/s10722-012-9939-y
Rendón-Anaya, M., Montero-Vargas, J. M., Saburido-Álvarez, S., Vlasova, A., Capella-Gutierrez, S., Ordaz-Ortiz, J. J., et al. (2017). Genomic history of the origin and domestication of common bean unveils its closest sister species. Genome Biol. 18:60. doi: 10.1186/s13059-017-1190-6
Rodiño, A. P., Santalla, M., González, A. M., De Ron, A. M., and Singh, S. P. (2006). Novel genetic variation in common bean from the Iberian Peninsula. Crop Sci. 46, 2540–2546. doi: 10.2135/cropsci2006.02.0104
Rodiño, A. P., Santalla, M., Montero, I., Casquero, P. A., and De Ron, A. M. (2001). Diversity of common bean (Phaseolus vulgaris L.) germplasm from Portugal. Genet. Resour. Crop. Evol. 48, 409–417.
Rossi, M., Bitocchi, E., Bellucci, E., Nanni, L., Rau, D., Attene, G., et al. (2009). Linkage disequilibrium and population structure in wild and domesticated populations of Phaseolus vulgaris L. Evol. Appl. 2, 504–522. doi: 10.1111/j.1752-4571.2009.00082.x
Sangiorgio, S., Carabelli, L., Gabotti, D., Manzotti, P. S., Persico, M., Consonni, G., et al. (2016). A mutational approach for the detection of genetic factors affecting seed size in maize. Plant Reprod. 29, 301–310. doi: 10.1007/s00497-016-0294-6
Sax, K. (1923). The association of size differences with seed-coat pattern and pigmentation in Phaseolus vulgaris. Genetics 8, 552–560. doi: 10.1007/BF02983088
Schmutz, J., McClean, P. E., Mamidi, S., Wu, G. A., Cannon, S. B., Grimwood, J., et al. (2014). A reference genome for common bean and genome-wide analysis of dual domestications. Nat. Genet. 46, 707–713. doi: 10.1038/ng.3008
Singh, S. P., Gepts, P., and Debouck, D. G. (1991a). Races of common bean (Phaseolus vulgaris, Fabaceae). Econ. Bot 45, 379–396. doi: 10.1007/BF02887079
Singh, S. P., Gutierrez, J. A., Molina, A., Urrea, C., and Gepts, P. (1991b). Genetic diversity in cultivated common bean: II. Marker-based analysis of morphological and agronomic traits. Crop Sci. 31, 23–29. doi: 10.2135/cropsci1991.0011183X003100010005x
Singh, S. P., Nodari, R., and Gepts, P. (1991c). Genetic diversity in cultivated common bean: I. Allozymes. Crop Sci. 31, 19–23. doi: 10.2135/cropsci1991.0011183X00310001000-4x
Tar’an, B., Michaels, T. E., and Pauls, K. P. (2000). Genetic mapping of agronomic traits in common bean (Phaseolus vulgaris L.). Annu. Rep. Bean Improv. Coop. 43, 60–61.
Vallejos, C. E., and Chase, C. D. (1991). Linkage between isozyme markers and a locus affecting seed size in Phaseolus vulgaris L. Theor. Appl. Gene 81, 413–419. doi: 10.1007/BF00228685
Vallejos, C. E., Sakiyama, N. S., and Chase, C. D. (1992). A molecular marker-based linkage map of Phaseolus vulgaris L. Genetics 131, 733–740. doi: 10.1002/elps.1150130187
Vlasova, A., Capella-Gutiérrez, S., Rendon-Anaya, M., Hernández-Oñate, M., Minoche, A. E., Erb, I., et al. (2016). Genome and transcriptome analysis of the Mesoamerican common bean and the role of gene duplications in establishing tissue and temporal specialization of genes. Genome Biol. 17, 1–18. doi: 10.1186/s13059-016et-0883-6
Wang, X., Li, Y., Zhang, H., Sun, G., Zhang, W., and Qiu, L. (2015). Evolution and association analysis of GmCYP78A10 gene with seed size/weight and pod number in soybean. Mol. Biol. Rep. 42, 489–496. doi: 10.1007/s11033-014-3792-3
Welch, R. M., House, W. A., Beebe, S., and Cheng, Z. (2000). Genetic selection for enhanced bioavailable levels of iron in bean (Phaseolus vulgaris L.) seeds. J. Agric. Food Chem. 48, 3576–3580. doi: 10.1021/jf0000981
Wright, E. M., and Kelly, J. D. (2011). Mapping QTL for seed yield and canning quality following processing of black bean (Phaseolus vulgaris L.). Euphytica 179, 471–484. doi: 10.1007/s10681-011-0369-2
Xu, C., Liu, Y., Li, Y., Xu, X., Xu, C., Li, X., et al. (2015). Differential expression of GS5 regulates grain size in rice. J. Exp. Bot. 66, 2611–2623. doi: 10.1093/jxb/erv058
Xu, R., Duan, P., Yu, H., Zhou, Z., Zhang, B., Wang, R., et al. (2018). Control of grain size and weight by the OsMKKK10-OsMKK4-OsMAPK6 signaling pathway in rice. Mol. Plant 11, 860–873. doi: 10.1016/j.molp.2018.04.004
Yuste-Lisbona, F. J., González, A. M., Capel, C., García-Alcázar, M., Capel, J., De Ron, A. M., et al. (2014). Genetic analysis of single-locus and epistatic QTLs for seed traits in an adapted×nuña RIL population of common bean (Phaseolus vulgaris L.). Theor. Appl. Gene 127, 897–912. doi: 10.1007/s00122-014-2265-3
Keywords: common bean, population structure, seed weight, seed size, GWAS
Citation: Lei L, Wang L, Wang S and Wu J (2020) Marker-Trait Association Analysis of Seed Traits in Accessions of Common Bean (Phaseolus vulgaris L.) in China. Front. Genet. 11:698. doi: 10.3389/fgene.2020.00698
Received: 20 January 2020; Accepted: 08 June 2020;
Published: 30 June 2020.
Edited by:
Xin Chen, Jiangsu Academy of Agricultural Sciences, ChinaReviewed by:
Andrea Coppi, University of Florence, ItalyPeerasak Srinives, Kasetsart University, Thailand
Copyright © 2020 Lei, Wang, Wang and Wu. This is an open-access article distributed under the terms of the Creative Commons Attribution License (CC BY). The use, distribution or reproduction in other forums is permitted, provided the original author(s) and the copyright owner(s) are credited and that the original publication in this journal is cited, in accordance with accepted academic practice. No use, distribution or reproduction is permitted which does not comply with these terms.
*Correspondence: Jing Wu, d3VqaW5nQGNhYXMuY24=; d2oxMjM0NUAxMjYuY29t