 Jiangjiang Zhang1*†
 Jiangtao Yan1†Siqi Huang1,2Gen Pan1,2Li Chang1,2Jianjun Li1,2Chao Zhang1Huijuan Tang1,2Anguo Chen1,2Dingxiang Peng3Ashok Biswas1Cuiping Zhang1,2Lining Zhao1,2*Defang Li1,2*
- 1Research Team of Genetic Modification of Annual Bast Fiber Crops, Institute of Bast Fiber Crops, Chinese Academy of Agricultural Sciences, Changsha, China
- 2Key Laboratory of Biological and Processing for Bast Fiber Crops, Ministry of Agriculture, Changsha, China
- 3MOA Key Laboratory of Crop Ecophysiology and Farming System in the Middle Reaches of the Yangtze River, College of Plant Science and Technology, Huazhong Agricultural University, Wuhan, China
Cannabis has been used as a source of nutrition, medicine, and fiber. However, lack of genomic simple sequence repeat (SSR) markers had limited the genetic research on Cannabis species. In the present study, 92,409 motifs were identified, and 63,707 complementary SSR primer pairs were developed. The most abundant SSR motifs had six repeat units (36.60%). The most abundant type of motif was dinucleotides (70.90%), followed by trinucleotides, tetranucleotides, and pentanucleotides. We randomly selected 80 pairs of genomic SSR markers, of which 69 (86.25%) were amplified successfully; 59 (73.75%) of these were polymorphic. Genetic diversity and population structure were estimated using the 59 (72 loci) validated polymorphic SSRs and three phenotypic markers. Three hundred ten alleles were identified, and the major allele frequency ranged from 0.26 to 0.85 (average: 0.56), Nei’s genetic diversity ranged from 0.28 to 0.82 (average: 0.56), and the expected heterozygosity ranged from 0.28 to 0.81 (average: 0.56). The polymorphism information content ranged from 0.25 to 0.79 (average: 0.50), the observed number of alleles ranged from 2 to 8 (average: 4.13), and the effective number of alleles ranged from 0.28 to 0.81 (average: 0.5). The Cannabis population did not show mutation-drift equilibrium following analysis via the infinite allele model. A cluster analysis was performed using the unweighted pair group method using arithmetic means based on genetic distances. Population structure analysis was used to divide the germplasms into two subgroups. These results provide guidance for the molecular breeding and further investigation of Cannabis.
Introduction
Cannabis is an erect annual herb that belongs to the family Cannabaceae. Its cultivation, as a source of fiber, was first documented in China and, subsequently, spread throughout the world (Li, 1973; Small and Cronquist, 1976). As one of the oldest plants, Cannabis has been used medicinally for more than 10,000 years in China, and this is documented by Emperor Shen Neng (Schultes et al., 1974); the plant has regained interest and popularity for its potential therapeutic effects. There are many standards to classify Cannabis species. From a utilitarian perspective, Cannabis is classified into four types, namely wild, fiber, oilseed, and psychoactive types. Taxonomically, Cannabis is recognized as hemp and marijuana. Based on the degree of domestication, Cannabis is classified as wild, domesticated, and intermediate types (Chandra et al., 2017). Previous studies demonstrate substantial genetic diversity between marijuana and hemp lines. There are considerable morphological variations between wild and cultivated Cannabis types; furthermore, Cannabis sativa is less variable and relatively more homogenous than Cannabis indica (Lynch et al., 2016). Tools to exploit and dissect the Cannabis genome have been investigated for several decades. Molecular markers have been utilized to the identify sexual phenotypes and chemotype-determining factors and elucidate the genetic diversity of Cannabis species (Mandolino and Carboni, 2004).
Cannabidiol (CBD) and tetrahydrocannabinol (THC) are components in Cannabis, and they have unique effects on mental health (Pate, 1994; Schluttenhofer and Yuan, 2019). Cannabis has become popular in clinical research owing to its nonintoxicating effects. It is also used to treat epilepsy and addiction and to control pain (Teitelbaum, 2019). THC is known for its hallucinogenic qualities, and recently, it has been shown to be effective in the treatment of Alzheimer’s disease (Cao et al., 2014) and glaucoma (Flach et al., 2002). Cannabigerolic acid (CBDA) is the precursor substance to CBD; when heating tissues in vitro, CBDA translates into CBD.
Genetic diversity is usually estimated using DNA sequences (polymorphisms among varieties) and cytological and morphological markers. However, morphological characteristics are often influenced by the environment. Therefore, molecular markers are relatively more stable and popular than morphological markers (Nadeem et al., 2018). Genetic diversity can be used to assess the evolution and conservation of varieties (Ellegren and Galtier, 2016). The events of inbreeding and evolution might alter allele frequency and reduce genetic diversity (Hufbauer et al., 2004). Thus, it is vital to accurately estimate the correlation among different germplasm resources to ensure high-efficiency utilization and management and to maintain adequate genetic variability for breeding several plant varieties (Nderu et al., 2019). Genetic diversity and population structure analysis have been used for the examination of various plant species. An analysis of 1151 ramie germplasms using SSR and phenotypic markers reveals that the genetic diversity of wild germplasms is higher than that of domesticated germplasms. Meanwhile, the population is clustered into two subpopulations (Feng et al., 2018). An analysis of genetic diversity of 50 populations of confectionery sunflower in Iran reveals that these can be subdivided into two subpopulations (Jannatdoust et al., 2016). Further, a population structure analysis of 109 Brazilian common bean accessions shows that these accessions can be divided into two distinct subpopulations (Valentini et al., 2018).
The genetic diversity of different germplasm resources of Cannabis has been estimated using molecular markers as well. A single-hexanucleotide short tandem repeat (STR) named NMI101 was employed to analyze the distribution of 93 processed seeds (Shirley et al., 2013). An analysis of 81 marijuana and 43 hemp samples using single-nucleotide polymorphisms (SNPs) revealed that marijuana and hemp were significantly different at the genome-wide level and that hemp was genetically more similar to the Cannabis indica type than the Cannabis sativa type (Sawler et al., 2015). Expressed sequence tag SSRs (EST-SSRs) were used to assess the genetic diversity of 115 hemp germplasm resources, and they were divided into four groups (Gao et al., 2014). The molecular markers of SSRs are proven to be highly polymorphic, and genomic SSRs are more polymorphic and stable than EST-SSRs (Soler et al., 2017). Several studies focus on the classification of Cannabis, including their population structure and genealogical classification, but the relationship between Chinese and foreign strains is also unclear. For the identification of relatedness between strains, more accurate molecular markers are required to analyze their population diversity.
The aim of our study is to develop abundant markers for Cannabis species to increase the number of Cannabis-related molecular markers available. Here, we identify SSR motifs and developed genomic SSR markers and simultaneously select and validate polymorphisms in these markers to estimate the population structure and genetic diversity of Cannabis germplasm resources using three phenotypic markers.
Materials and Methods
Experimental Materials
A total of 199 Cannabis germplasm resources were collected from 20 regions across China—including Chongqing (1), Guangxi (1), Yunnan (28), Liaoning (3), Guizhou (1), Henan (9), Hebei (1), Shandong (7), Shanxi (7), Heilongjiang (30), Jilin (7), Zhejiang (3), Jiangsu (2), Anhui (4), Xinjiang (3), Gansu (11), Ningxia (3), Qinghai (1), Shaanxi (6), and Inner Mongolia (7)—Germany (1), Hungary (1), Poland (20), Ukraine (9), Kazakhstan (2), Russia (23), Uzbekistan (1), the United States (1), Lithuania (1), and Bosnia and Herzegovina (1). Testing materials were provided by the Research Team of Genetic Modification of Annual Bast Fiber Crops, Institute of Bast Fiber Crops, Chinese Academy of Agricultural Sciences.
In April 2018, all 199 Cannabis germplasm resources were sown in Changsha farm, offered by the Institute of Bast Fiber Crops, Chinese Academy of Agricultural Sciences. In May 2018, fresh top leaves were collected from each female accession and placed in liquid nitrogen canisters, transported to the laboratory, and stored at −80°C until genomic DNA extraction.
Development of SSRs on Whole Genome-Wide Scale
Genomic SSRs were developed based on the whole-genome sequence of Cannabis sativa (Laverty et al., 2019). MIcroSAtellite1 was used to identify SSR motifs (Beier et al., 2017). The motifs were constrained in length to 2–6 bp, which corresponded to dinucleotides (di-), trinucleotides (tri-), tetranucleotides (tetra-), pentanucleotides (penta-), and hexanucleotides (hexa-), respectively. The SSR markers were developed using Primer3 online (Whitehead Institute, Cambridge, MA, United States). The maximum scores were selected for the SSR locus. The general primer picking conditions were as follows: primer size, 18–27 bp with an optimal length of 24 bp; primer melting temperature (Tm), 57–63°C with an optimum temperature of 60°C; product size, 100–200 bp with an optimum length of 150 bp; and primer GC content, 40–60% with an optimum content of 50%.
Validation of SSRs
Genomic DNA was extracted from the leaves using a rapid DNA extraction kit (DP305; Tiangen Biotech Co. Ltd., Beijing, China). The quality and purity of the extracted DNA were assessed by 1% agarose gel electrophoresis. The SSR-PCR reaction system was performed using MastMIX (KT201; Tiangen Biotech Co. Ltd., Beijing, China). The mix contained 250 μM dNTPs, 10 mM Tris-HCl, 50 mM KCl, and 1.5 mM MgCl2. Each total volume of the SSR-PCR mixture was 10 μL, comprising 6.5 μL of MastMIX, 2 μL of double distilled H2O, and 30 ng of template DNA. The PCR amplification was carried out using a Bio-Rad (Hercules, CA, United States) thermal cycler under the following cycling conditions: initial denaturation at 94°C for 5 min, 37 cycles at 94°C for 30 s, 50°C–60°C for 30 s, 72°C for 40 s, and a final extension at 72°C for 10 min. The genotype of each accession was investigated by polyacrylamide gel electrophoresis (PAGE) at 150 V for 2.5 h. The PAGE gel consisted of 10% acrylamide, 10% TBE, and 1.5% ammonium persulfate. The bands were stained with 2 mg/mL silver nitrate for 10 min.
Eight pairs of SSR markers were randomly selected from each chromosome; three pairs of dinucleotide SSRs, two pairs of trinucleotide SSRs, and one pair each of tetra-, penta-, and hexa- SSRs. A total of 80 SSR markers were selected to validate the polymorphism and specificity of 12 different Cannabis varieties.
Morphological Characterization
The contents of CBD, THC, and CBDA in the leaves at the flowering stage were determined by HPLC with the following parameters: solvent, methanol; mobile phase, 0.1% acetic acid and acetonitrile at a volume ratio of 25:75. Isocratic elution was performed with a flow rate of 0.8 mL/min, and the effluent was analyzed at a wavelength of 220 nm. Each sample (10 μL) was injected into an HPLC column for analysis.
Data Nomenclature
In an electropherogram, the same uppercase letter was assigned to identical band types of different germplasms amplified using the same genomic SSR markers. The product of the allele was marked with an uppercase letter with the maximum marked as “A” followed by “B,” “C,” etc.; if only a single band was generated, the germplasm was recorded as homozygous. Different accessions with the same morphological trait were assigned different letters.
Data Analyses
Genetic diversity was estimated using POPGENE version 1.32 (Yeh and Boyle, 1997), and it considered the expected heterozygosity (He), the observed number of alleles (Na), the expected number of alleles (Ne), Nei’s genetic diversity (I), and gene flow (Nm). The polymorphism information content (PIC) and major allele frequency (MAF) of each SSR were calculated using PowerMarker version 3.24 (Falush et al., 2007). The microsatellite bottleneck events were tested using 72 loci with eBOTTLENECK ver. 1.2.02. Three different models, namely the infinite allele model (IAM), stepwise mutation model (SMM), and two-phase model (TPM), were used to ascertain mutation-drift equilibrium (Cornuet and Luikart, 1996). A cluster analysis and genetic consistency assessment of different regions were also performed. A clustering map of different germplasm resources was drawn using MEGA version 7 (Kumar et al., 2016) following the unweighted pair group method with the arithmetic mean based on genetic distances. Population structure was assessed using a mixed model and a correlation model of allele variation frequency using STRUCTURE version 2.3.4 (Falush et al., 2007) and Structure Harvester version 6.0 (Earl and vonHoldt, 2012). The exact number of clusters (K) was evaluated by validating the K-value from 1 to 10 and a burn-in period of 5000 steps with 50,000 Markov chain Monte Carlo (MCMC) replications. The program Structure Harvester2 was run to assess the final K value for the STRUCTURE analysis, which was based on the plot of mean posterior probability [LnP(D)] values and the ad hoc Evanno’s △K statistics (Saha et al., 2019).
Results
Development of the SSRs Based on Genomic Data
A total of 92,409 SSR motifs were detected, and 63,699 (63.70%) pairs of SSR primers were developed. The most abundant SSR motifs were generally detected on chromosome 5 (12,099), whereas chromosome 10 showed the lowest number of SSR motifs (5277). The maximum ratio of SSR primers was 71.49% on chromosome 4, and the minimal ratio was 66.46% on chromosome 10. Chromosome 10 not only produced the lowest number of primers, but also had the lowest ratio; this was expected considering that chromosome 10 is a sex chromosome and contains less genetic information and variation than the other chromosomes (Table 1).
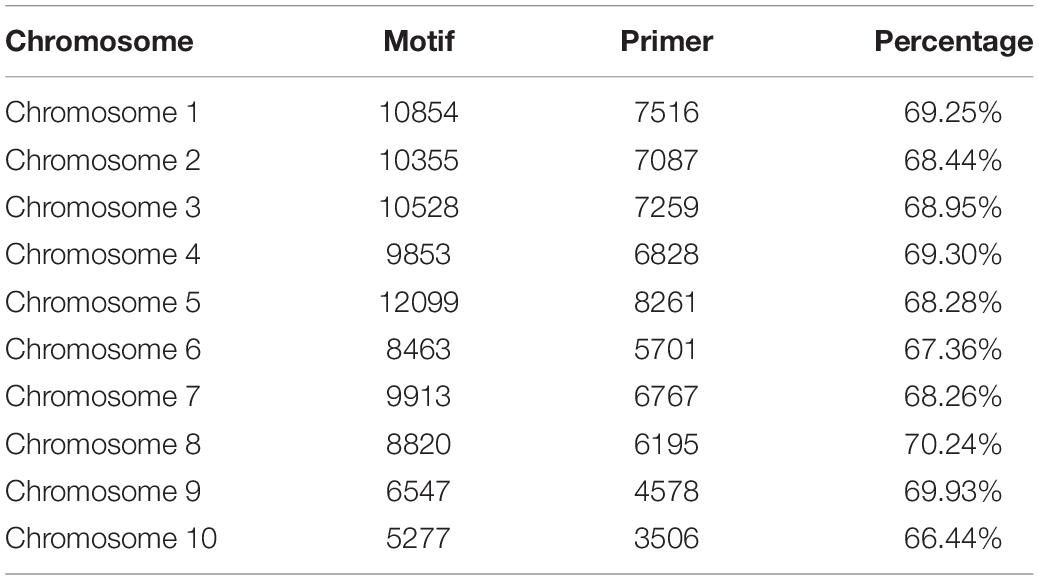
Table 1. Number of motifs and SSR primers.
The dinucleotide SSR motifs were the most abundant type of repeats (82,859), followed by the trinucleotide, tetranucleotide, pentanucleotide, and hexanucleotide SSR motifs. According to the length of the genomic SSRs based on the number of repeat units (Table 2), the most abundant type of repeats was six, accounting for 42,305 (36.60%), followed by seven, five, eight, and nine repeat units. Only 6808 units presented more than 14 repeats (5.89%). The five, six, and seven repeat units accounted for 70.46% of the total repeat units, which could explain the predominant diversity of SSR repeat unit types. The number of primers developed based on each motif type was as follows: dinucleotide, 56,406 (68.07%); trinucleotide, 20,709 (71.94%); tetranucleotide, 1896 (62.10%); pentanucleotide, 356 (66.54%); and hexanucleotide, 289 (83.29%). Interestingly, the hexanucleotide motif type was the least common motif type, but it accounted for the highest percentage of the SSR primers developed, possibly caused by a complex of hexanucleotide type.
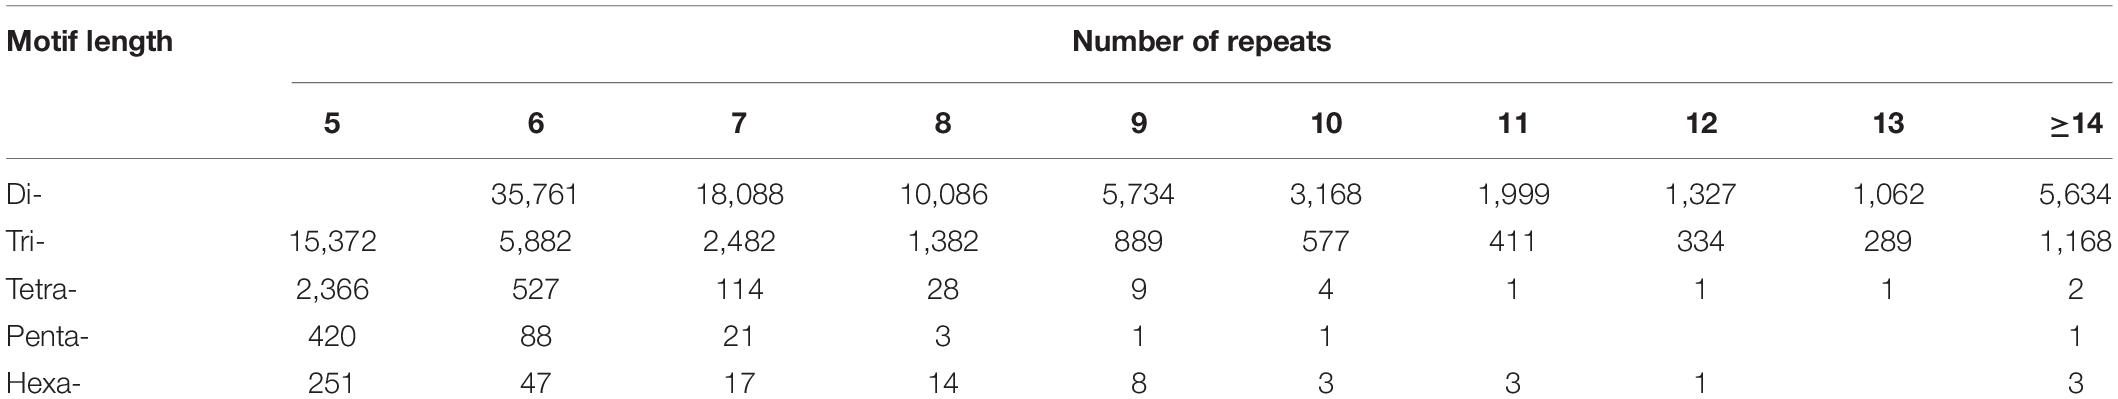
Table 2. Frequency of SSR motifs of genome-SSRs in hemp.
Among the 92,409 SSR motifs, 572 motif types were identified, namely di- (12), tri- (60), tetra- (122), penta- (187), and hexa- (191) types. The number of SSR motifs within each motif sequence type was as follows: di- (6904.9), tri- (496.3), tetra- (25), penta- (2.9), and hexa- (1.8) (Table 3). The di- type was the most abundant, and the hexa- type was the least abundant. The most abundant type of repeat motif was AT/TA, accounting for 48,353 of the repeats (41.84%), followed by CT/AG, GA/TC, and AAT/ATT; the other SSR motifs types (18,522) accounted for 16.03% of the repeats (Figure 1).
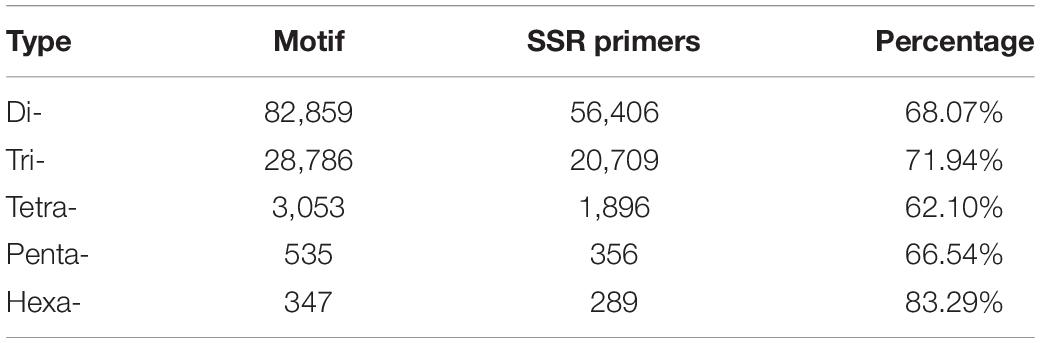
Table 3. Number of SSR motifs.
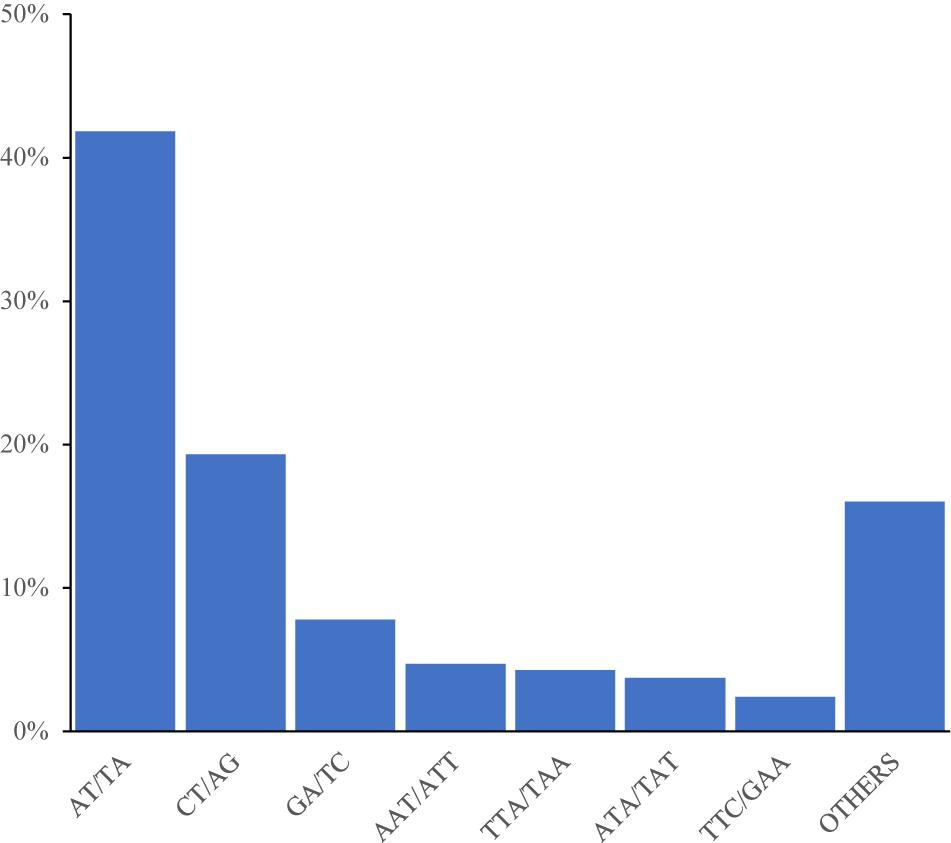
Figure 1. Frequency distribution of cannabis genome-SSRs based on motif numbers.
According to the percentage of SSR primers on the 10 chromosomes, chromosome 5 produced the most abundant primers, and chromosome 10 produced the fewest. The results are consistent with the number of SSR motifs on each chromosome, and the percentages of the SSR primers were consistent with each other. A high number of motifs were associated with a high percentage of SSR primers across all chromosomes.
Genomic SSRs and Phenotypic Markers
Overall Genetic Diversity
Eighty pairs of markers were randomly selected to evaluate the quality of the SSR markers across the 12 Cannabis varieties. A total of 11 pairs of markers from these 80 pairs failed to generate amplicons. Among the 69 pairs (86.25%) that generated amplicons, 59 (73.59%) showed polymorphisms that produced 72 loci. In addition, 13 pairs of primers produced 2 loci, and the remaining 10 markers had no polymorphisms. The 72 loci and the 3 phenotypic markers were then used to analyze the 199 germplasm resources and evaluate their population structure and genetic diversity.
PowerMarker and POPGENE analyses revealed that the Na ranged from 2 to 8 (average: 4.13), PIC ranged from 0.25 to 0.79 (average: 0.50), and I ranged from 0.50 to 1.78 (average: 1.01). The expected heterozygosity ranged from 0.28 to 0.81 (average: 0.56), Ne ranged from 1.38 to 5.32 (average: 2.50), and H ranged from 0.28 to 0.82 (average: 0.56) (Table 4). Considering two germplasm resources as a variety pair, the maximum genetic distance (1.0229) among the 19,701 pairs was observed between varieties 13 and 102, both from Gansu, China. The minimal genetic distance (0.2107) was observed between varieties 90 and 89, from Inner Mongolia and Heilongjiang, China, respectively.
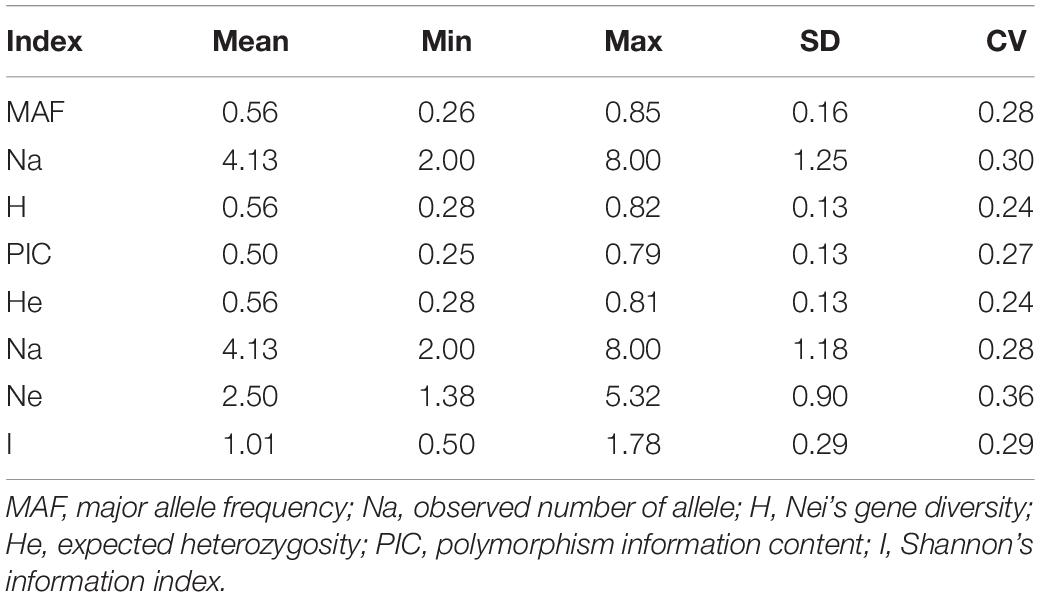
Table 4. Characterization of 72 loci and 3 phenotypes.
Genetic Diversity Among Germplasms From Different Regions
Genetic diversity was also analyzed among 30 local cultivars and 109 wild Cannabis germplasm resources. The results show that the MAF, Na, Ne, I, H, PIC, and He were lower in local cultivars than in wild accessions; that is, the genetic diversity of wild accessions was higher than that of the domesticated accessions. The maximum Na value, 3.96, was recorded in wild accessions, and the minimum value, 3.4667, was recorded in the domesticated accessions. The difference between the maximum and minimum values of the other indexes was not very significant. We also analyzed 135 accessions from China and 64 accessions from abroad. The results show that Na was higher in Chinese accessions, and there were minimal differences in the other indexes between accessions from China and from other countries. In summary, domesticated accessions did not significantly differ from wild germplasms in China. The accessions from China did not significantly differ from foreign accessions although the Chinese accessions harbored more alleles than the foreign accessions.
The germplasms could be divided into nine regions, and the genetic diversity of germplasms among the nine regions was marginal (Table 5). The Na value was the highest for samples from Northeast China (3.79) and the lowest for samples from “other” (2.89). The largest value of MAF was found for samples from other, and the smallest was found for samples from Southwest China. Values of H, He, and PIC for the samples from the nine regions showed no differences; I was greatest in Northeast China and smallest in other; and Ne ranged from 2.18 (others) to 2.43 (Southwest China). In summary, there were no significant differences for the seven indexes among the samples from the nine regions. Samples from the other regions had the largest value of MAF and the lowest Na, H, PIC, I, and Ne.
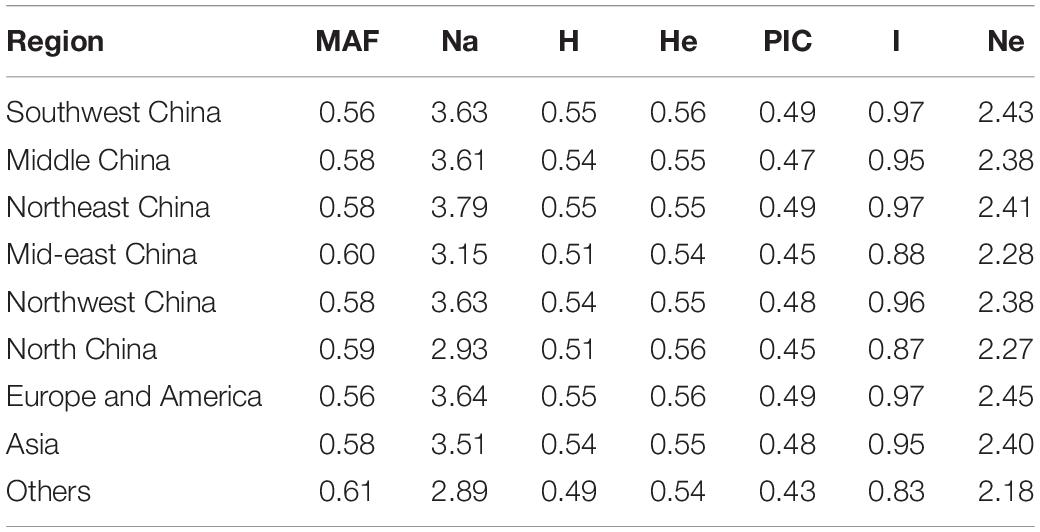
Table 5. Genetic diversity of hemp with different geographic origins.
Genetic Distance and Genetic Consistency
The magnitude of genetic distance reveals the genetic similarity among different groups. The genetic distance of germplasm resources ranged from 0.2107 to 1.0229. The average genetic distance was 0.4792, indicating a relatively low genetic variation among the 199 Cannabis germplasms. The pairwise genetic distances were usually 0.4–0.6 within each population (Figure 2). The percentage of germplasms showing a genetic distance greater than 0.5 was the highest in the case of samples from Northwest China (44%), indicating that the accessions in this region were less related to one another than those from other regions. Samples from mid-eastern China showed the lowest ratio of germplasms with a genetic distance greater than 0.5 (11%); the average ratio of the germplasms from the nine regions that showed a genetic distance greater than 0.5 was 30%. Further, the average ratio of all germplasms that showed a genetic distance greater than 0.5 except those from mid-eastern China were above 20%, indicating that Cannabis accessions from these regions were closely related.
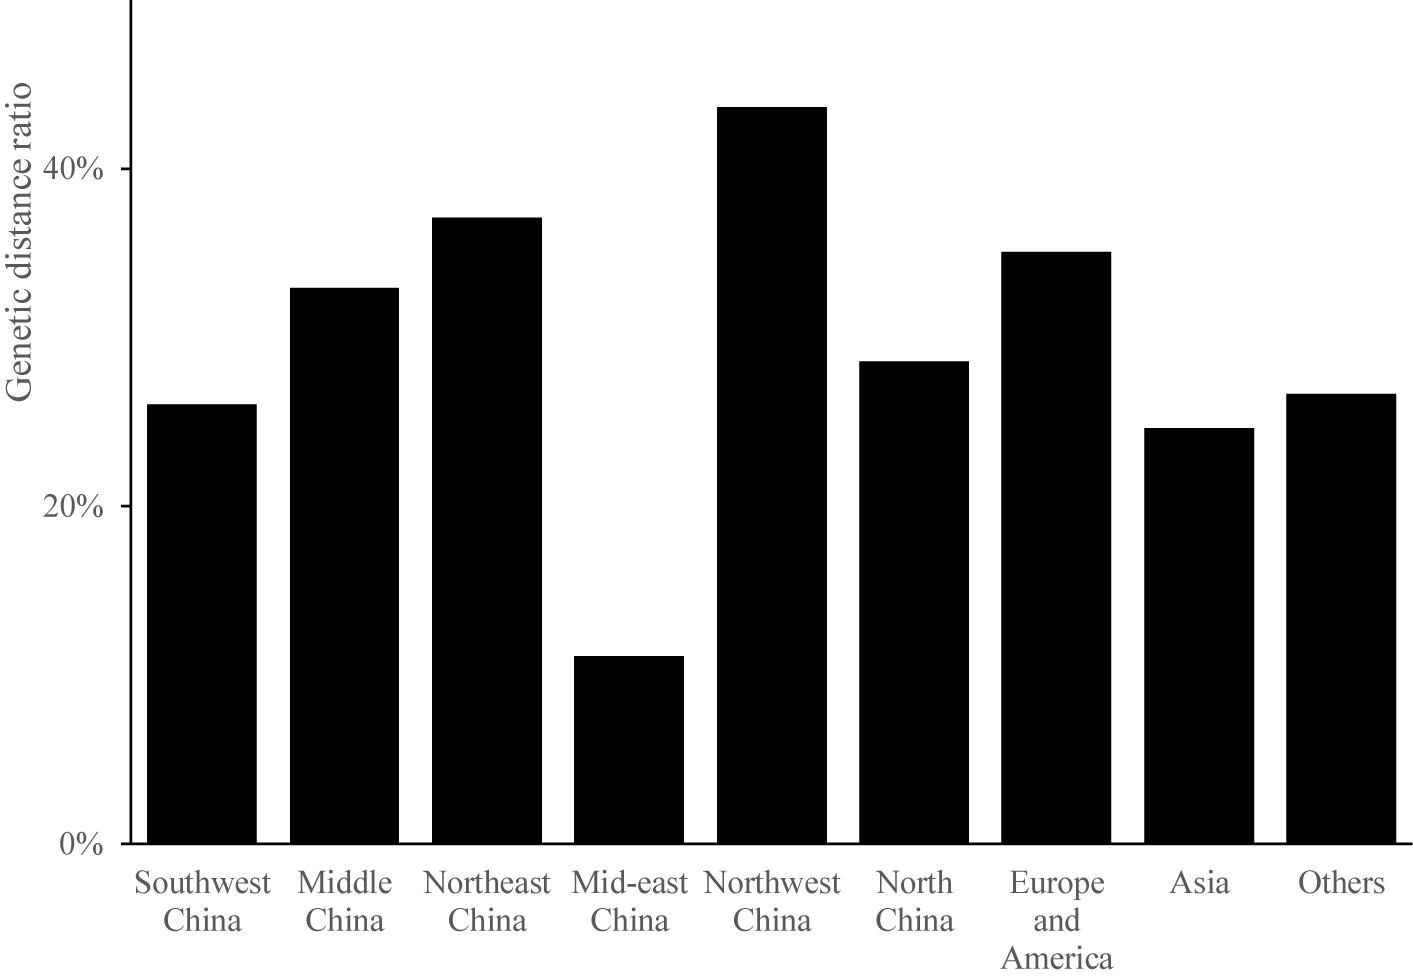
Figure 2. The genetic ratio of each region.
The genetic distance between the samples from the various regions ranged from 0.0199 (between Northwest and Northeast China) to 0.1325 (between North China and other) (Table 6). The average genetic distance was 0.063, suggesting a relatively small genetic variation in accessions among the nine regions. Interestingly, there were two pairs with a genetic distance exceeding 0.100 among the 36 region pairs examined (between samples from North China and other, and between those from mid-eastern China and other). Moreover, the results indicate that samples from the region other did not show close relatedness to the samples from the remaining eight regions. The genetic consistency between the region pairs ranged from 0.8759 (between samples from North China and other) to 0.9803 (between samples from mid-eastern and Northwest China). The genetic consistency between samples from North China and other and between samples from mid-eastern China and other was below 0.900. In summary, genetic distances for all samples were below 0.2, and genetic consistency values were all above 0.8, demonstrating a close relatedness among the germplasms from the nine regions.
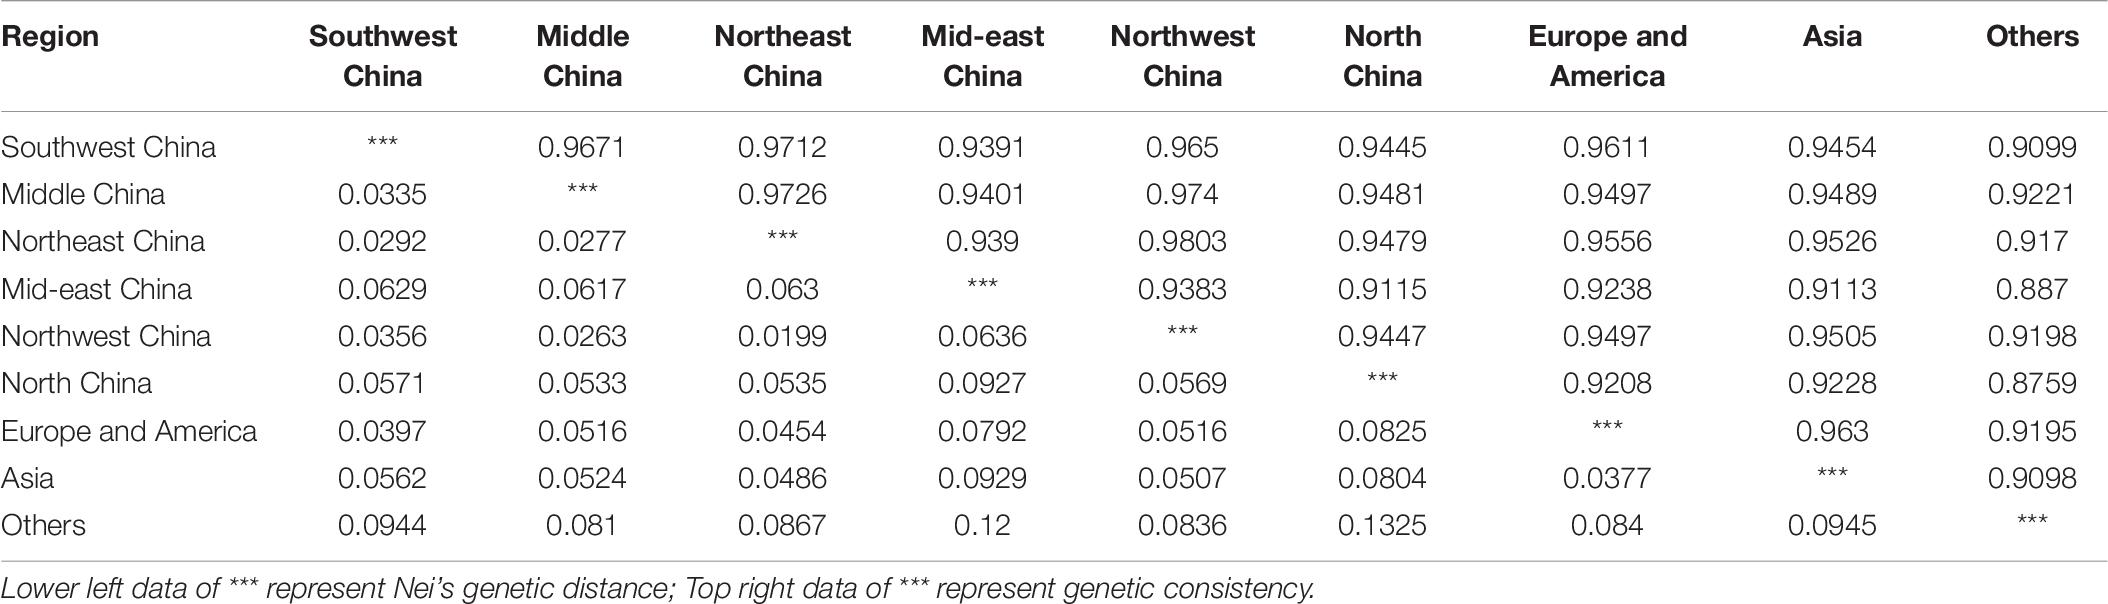
Table 6. Genetic distances and genetic consistency analysis.
The average gene flow among all Cannabis accessions was 5.0974, and the mean fixation index (Fst) was 0.0468. High Nm and low Fst values indicate high levels of migration (Bossart and Pashley Prowell, 1998), which might be responsible for the small degree of variation observed within the 199 germplasm resources.
The Microsatellite Bottleneck Event
A bottleneck signature was detected for samples from all nine populations following their analysis using the IAM and TPM (with SMM = 30%) except for the samples from the region others (P = 0.0970), suggesting that a recent bottleneck event had occurred in all populations. However, all nine populations were found to show mutation-drift equilibrium following analysis using the SMM (Table 7). In the allele frequency distribution test, the samples from the regions mid-eastern China, North China, and other showed a shift in allele frequency distribution, presenting a shifted shape. The other populations showed no shift in allele distribution, maintaining a normal L-shape.
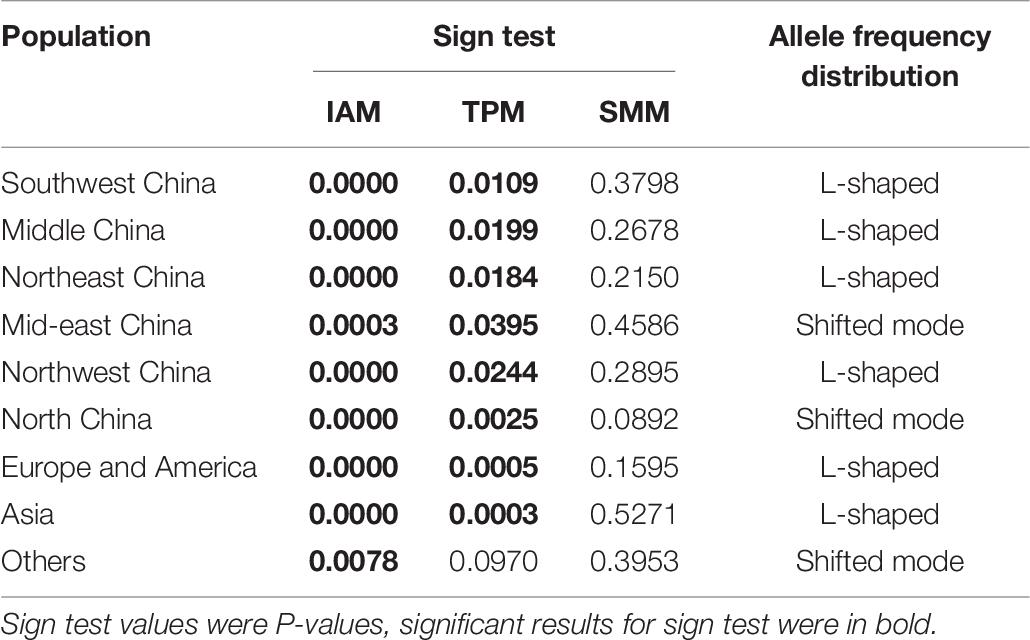
Table 7. Microsatellite bottleneck events.
Cluster Analysis
Germplasm Cluster Analysis
Based on the genetic distances, all germplasm resources analyzed were divided into three classes using PowerMarker (Figure 3). The first class contained 119 germplasm resources, including those from Europe and America (21), Southwest China (22), Northeast China (23), Middle China (14), Northwest China (14), Asia (14), Mid-eastern China (6), North China (4), and other (1). The second class contained 28 germplasm resources from Southwest China (4), Middle China (6), Northeast China (6), Mid-eastern China (1), Northwest China (6), North China (1), Europe and America (1), and Asia (3) (and none from the group other). The third class consisted of 51 germplasm resources from Southwest China (5), Middle China (4), Northeast China (10), Mid-eastern China (3), Northwest China (4), North China (2), Europe and America (10), Asia (8), and others (5). Thus, the majority of germplasm resources from Southwest, Middle, and Mid-eastern China were clustered in the first class, and most of the germplasm resources from the others region were clustered in the third class. Germplasm resources from different regions were clustered into the same class in agreement with the genetic distance and genetic consistency values. The analysis indicates that the Cannabis germplasm resources have a similar genetic background.
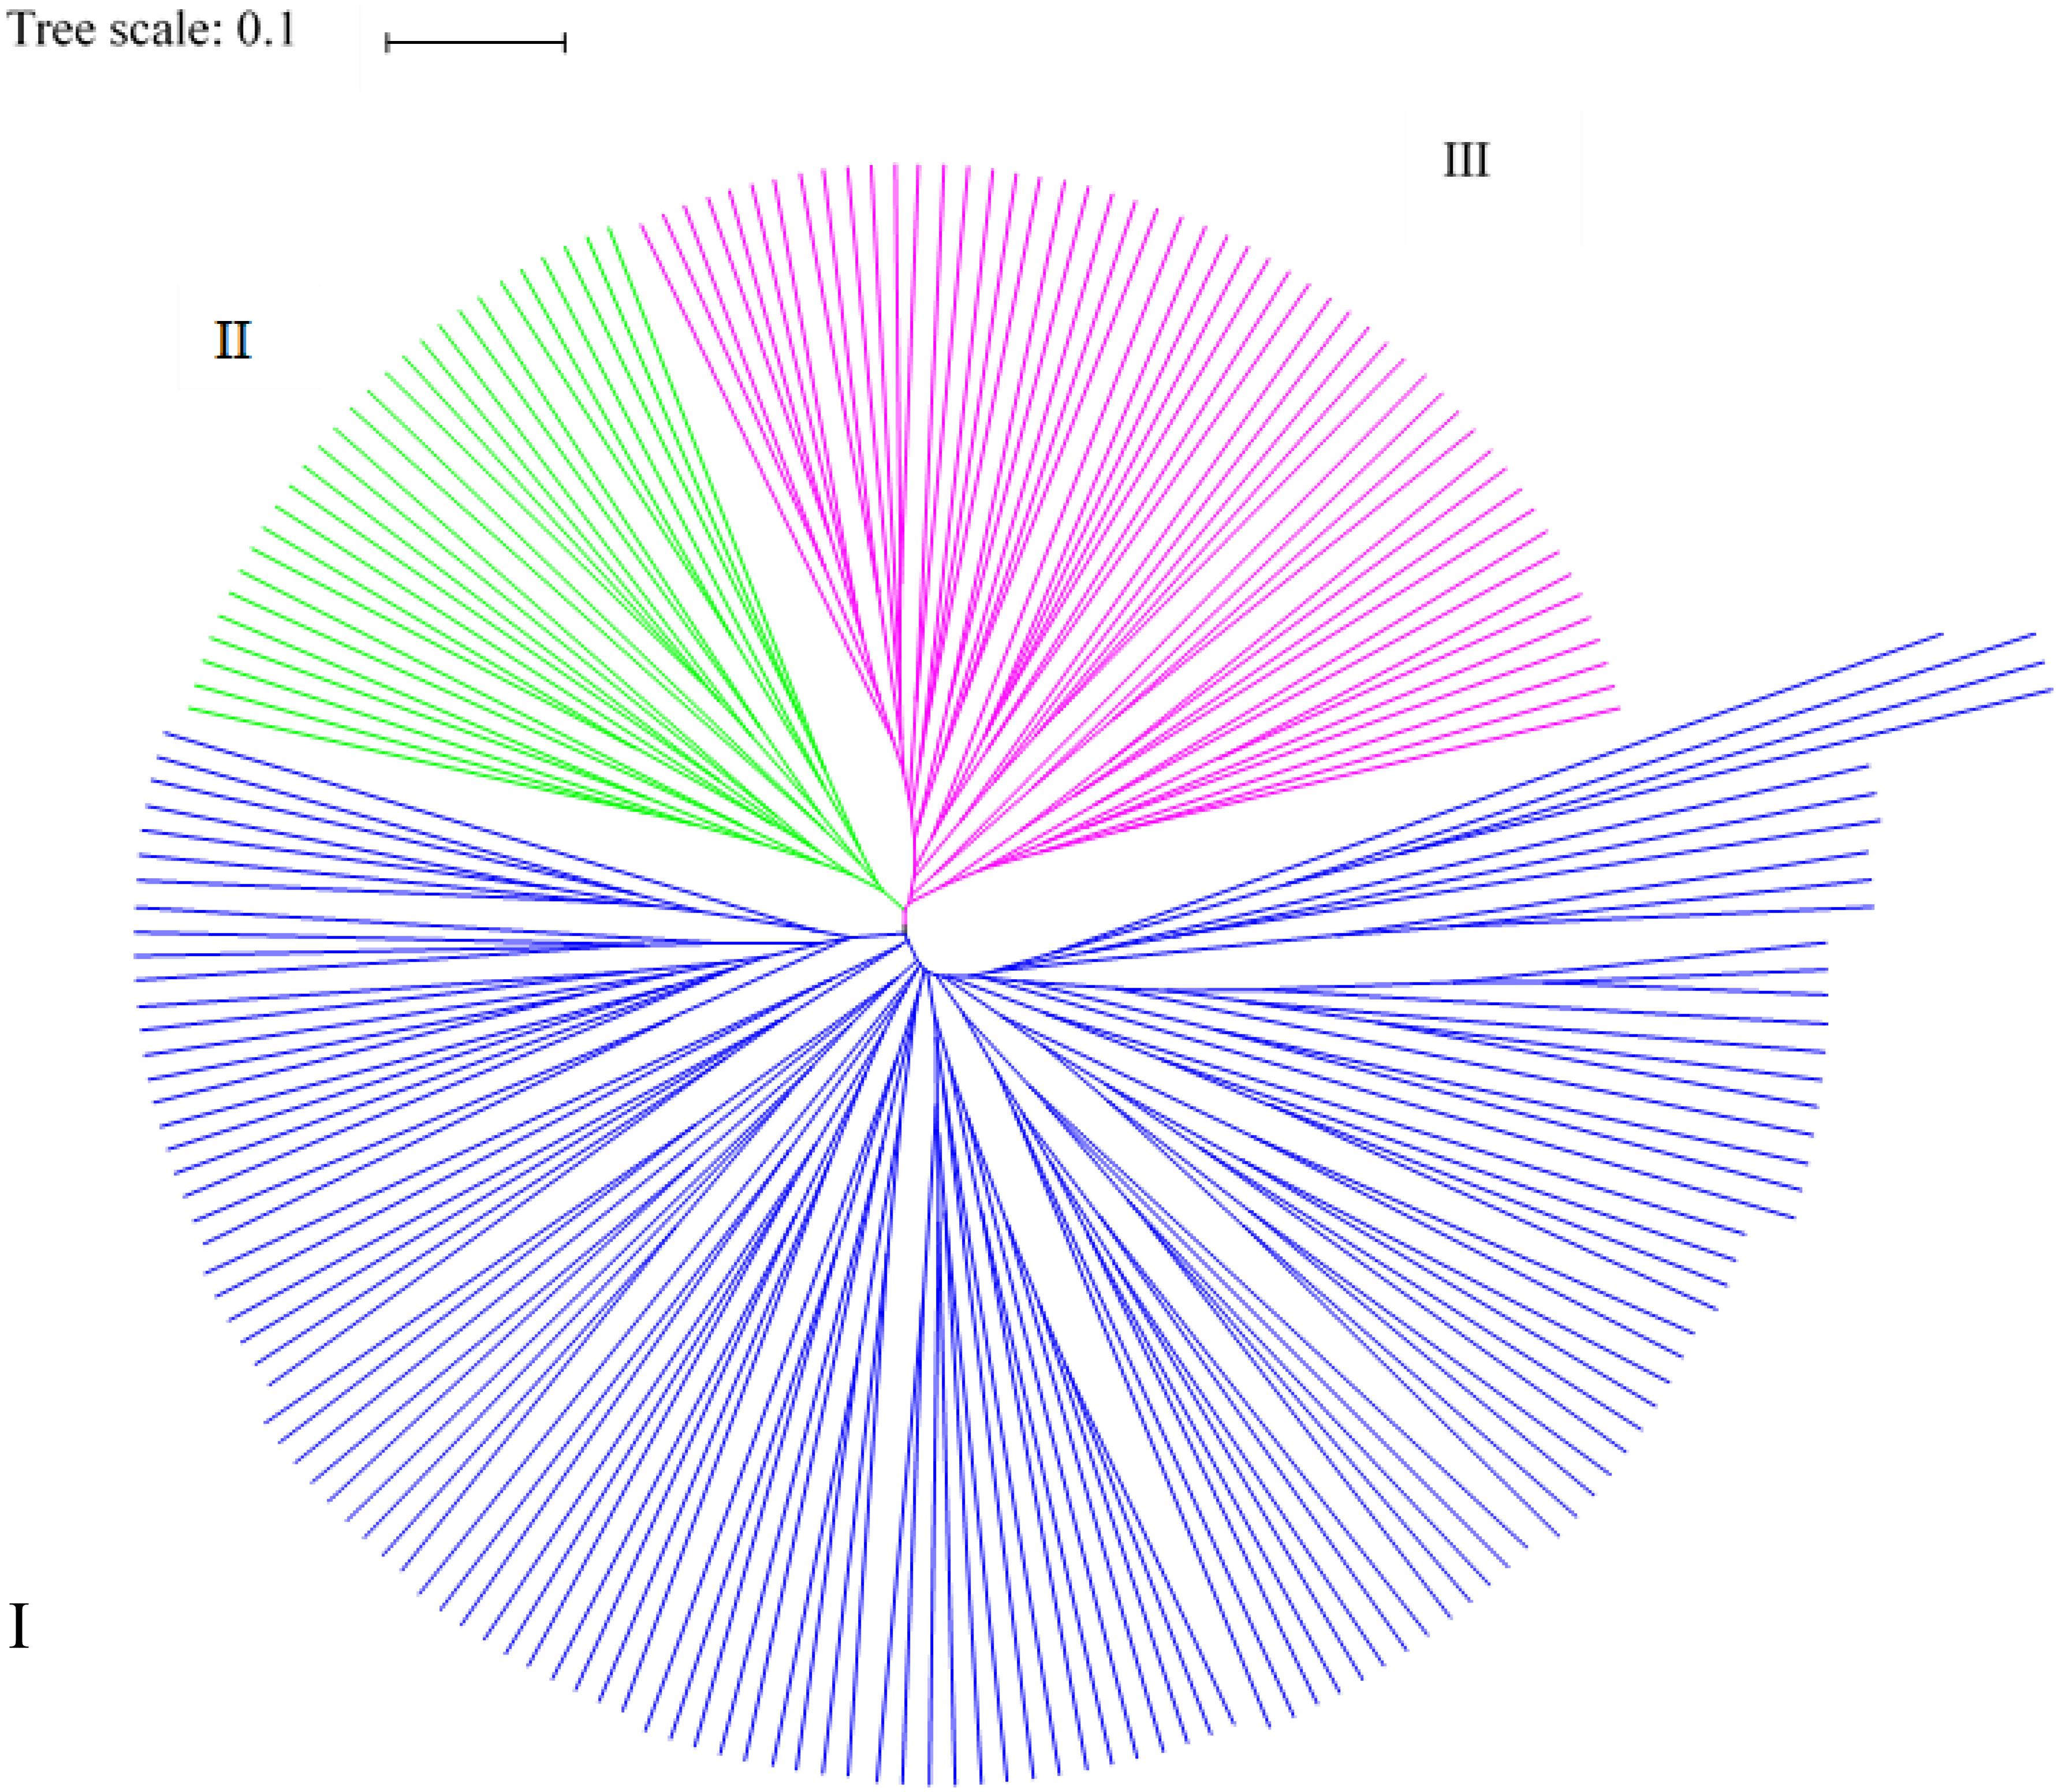
Figure 3. Cluster analysis results for the 199 hemp materials based on SSR and phenotypic markers.
Cluster Analysis of Different Regions
A phylogenetic tree based on Nei’s genetic distance was constructed (Figure 4). Arabic numbers are assigned to the nodes in the clustering map. At node 15, the nine regions are clustered into four groups (from top to bottom). Group I is further divided into four subgroups, namely A, B, C, and D, comprising six regions, whereas Groups II, III, and IV each contain only one region. Furthermore, Europe and America as well as Asia are clustered in Group I, indicating that the samples from the first two regions are closely related to those from almost all Chinese regions. At node 14, the nine regions are separated into five groups; subgroup D is integrated into Group II, and Groups III, IV, and V contain only one region each. At node 12, the nine regions are categorized into five groups (from top to bottom): Group I contains four regions; Group II contains two regions; and Groups III, IV, and V contain one region each. These results reveal that the germplasm resources from China are not clustered within a certain group and that there is no direct correlation between region and affiliation. Subgroup D is categorized into one independent group at nodes 11, 12, and 14. In general, the analysis of region clusters based on genetic distance and diversity indexes reflects the geographical origin of the germplasms.
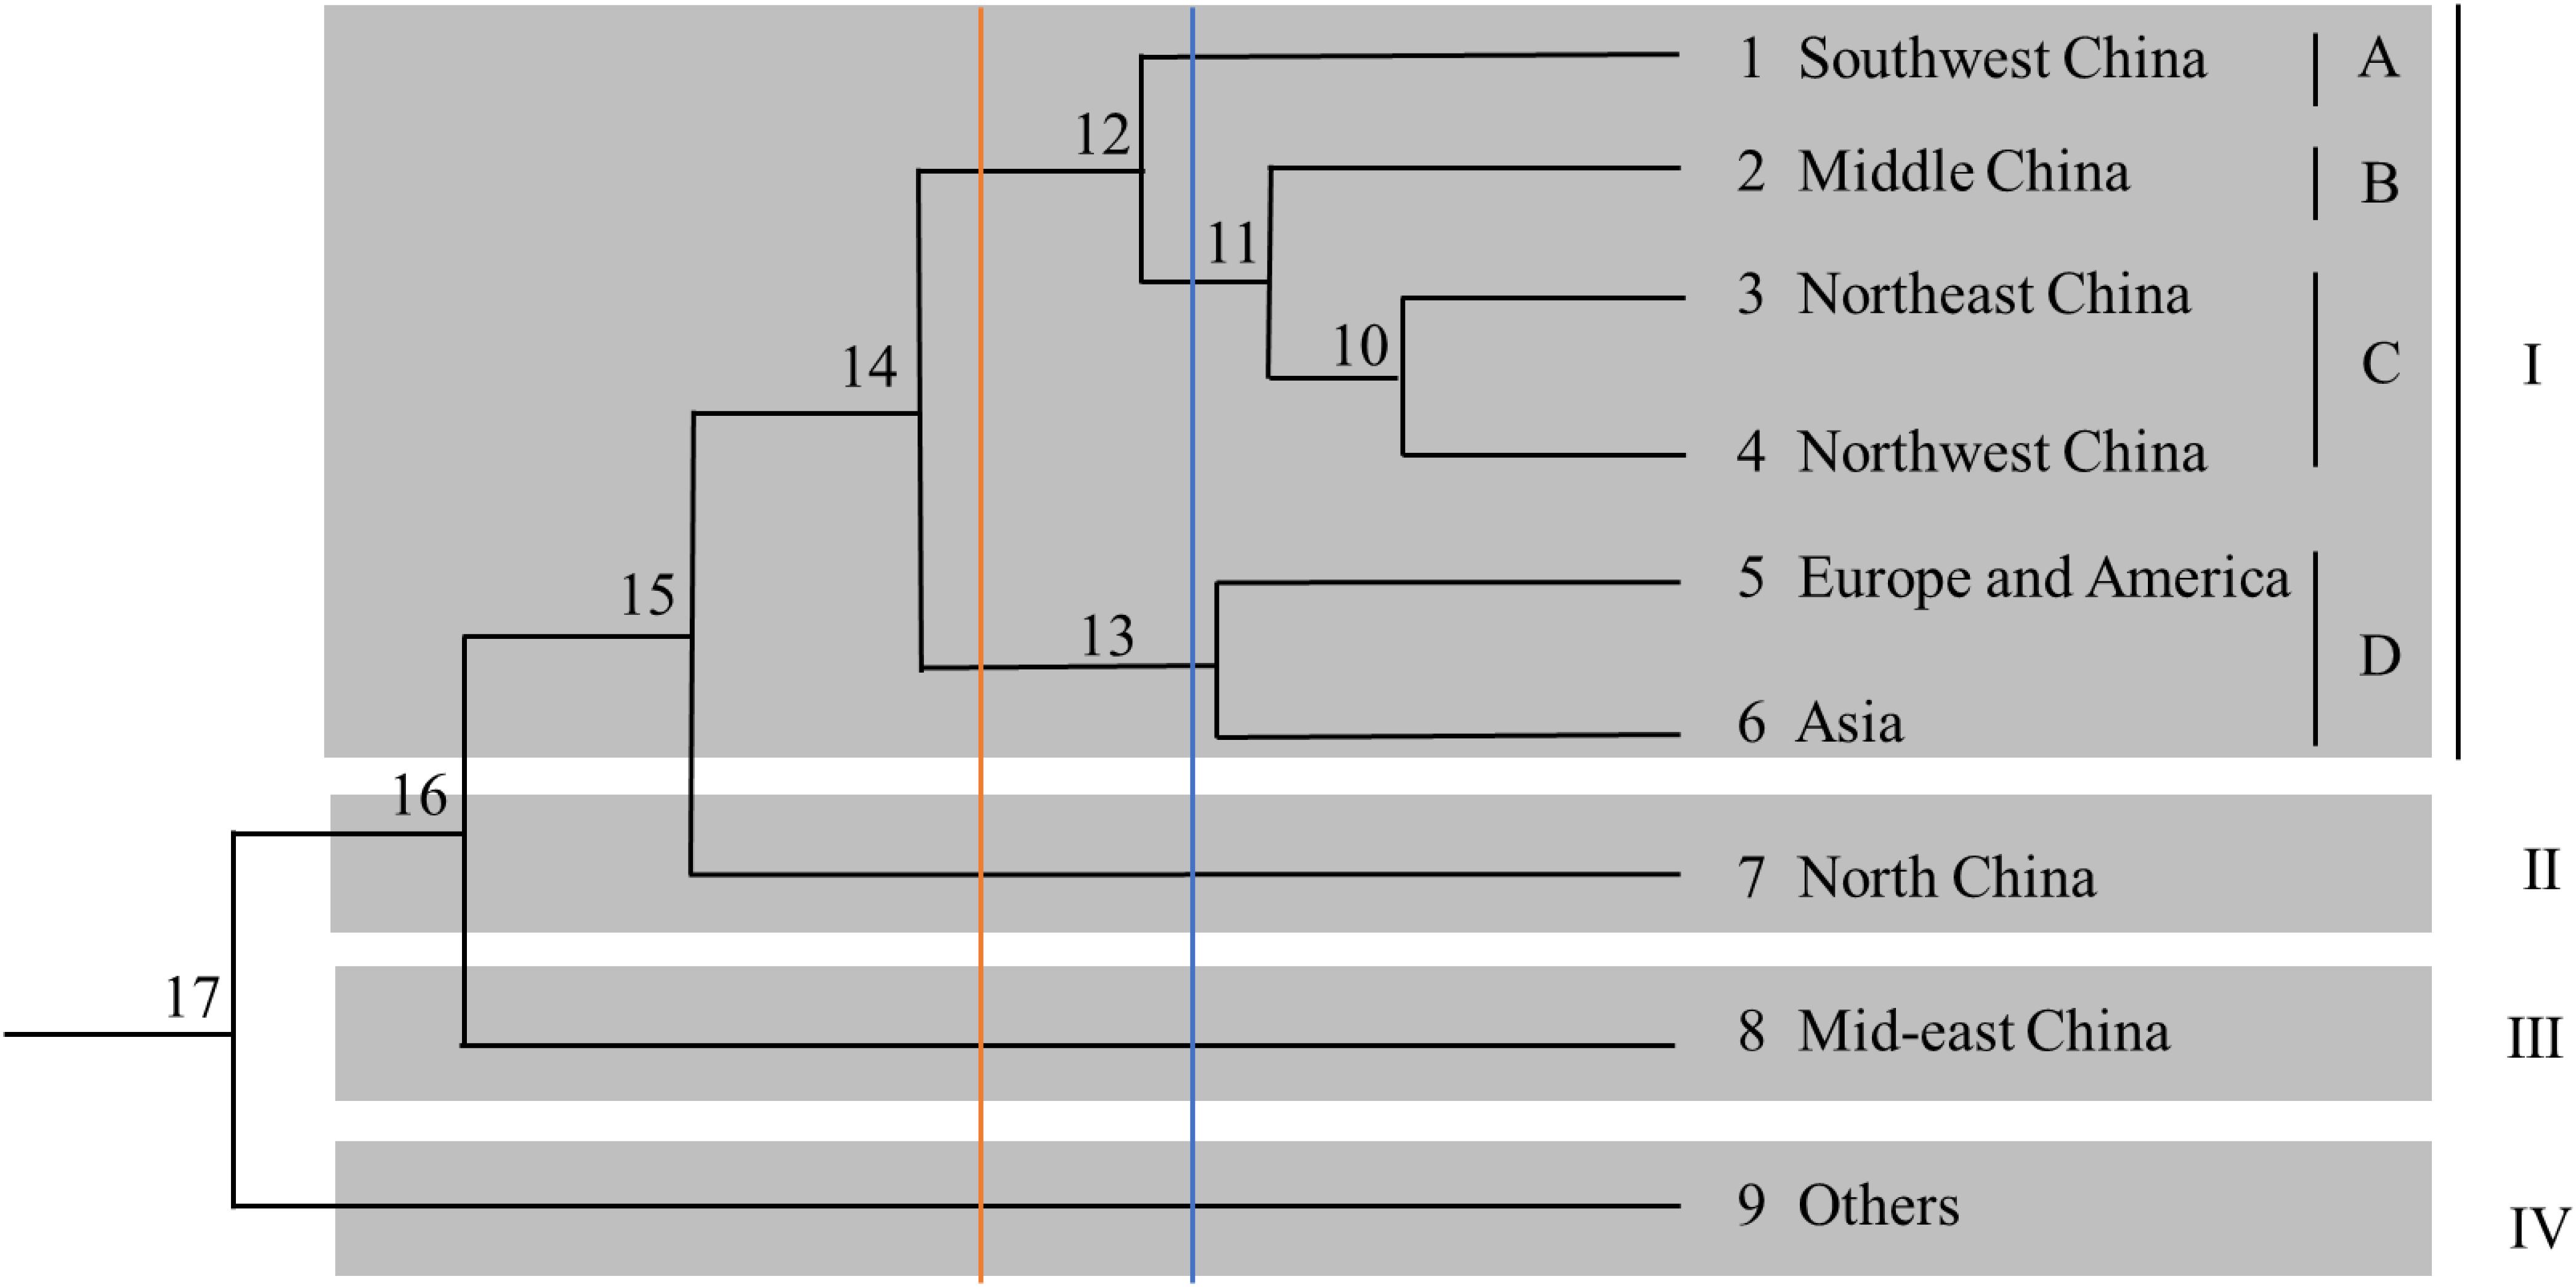
Figure 4. Dendrogram of the cluster analysis for the nine regions.
Population Structure of Cannabis Germplasms
The structure of Cannabis germplasm resource genotypes was analyzed based on the likelihood of data [LnP(D)]. The germplasm resources were randomly integrated into groups (K) to assess the variant frequency of each group, and the individual germplasms were reintegrated into groups based on the estimated frequencies (Evanno et al., 2005). The number of subgroups varies with the LnP(D) values. The curve occurs between K = 1 and K = 2, and all the values are at their maximum when K = 2 (Figure 5), i.e., when the germplasm resources are divided into two subgroups (Figure 6), including 99 and 100 genotypes, which accounts for 49.60% and 50.40% of the germplasm resources, respectively. The first subgroup includes accessions from Southwest China (18), Europe and America (27), Asia (22), and all the germplasms in the set others (6). The second subgroup includes those from Southwest China (13), Middle China (18), Northeast China (28), and Northwest China (24). The structure of each subgroup varies except that accessions from the others region are not included in the second subgroup. The first subgroup is generally composed of accessions from abroad, and the accessions in the second subgroup are all from China. The cluster analysis reveals that the genotypes in both subgroups are variable, but almost all genotypes show the same general trend.
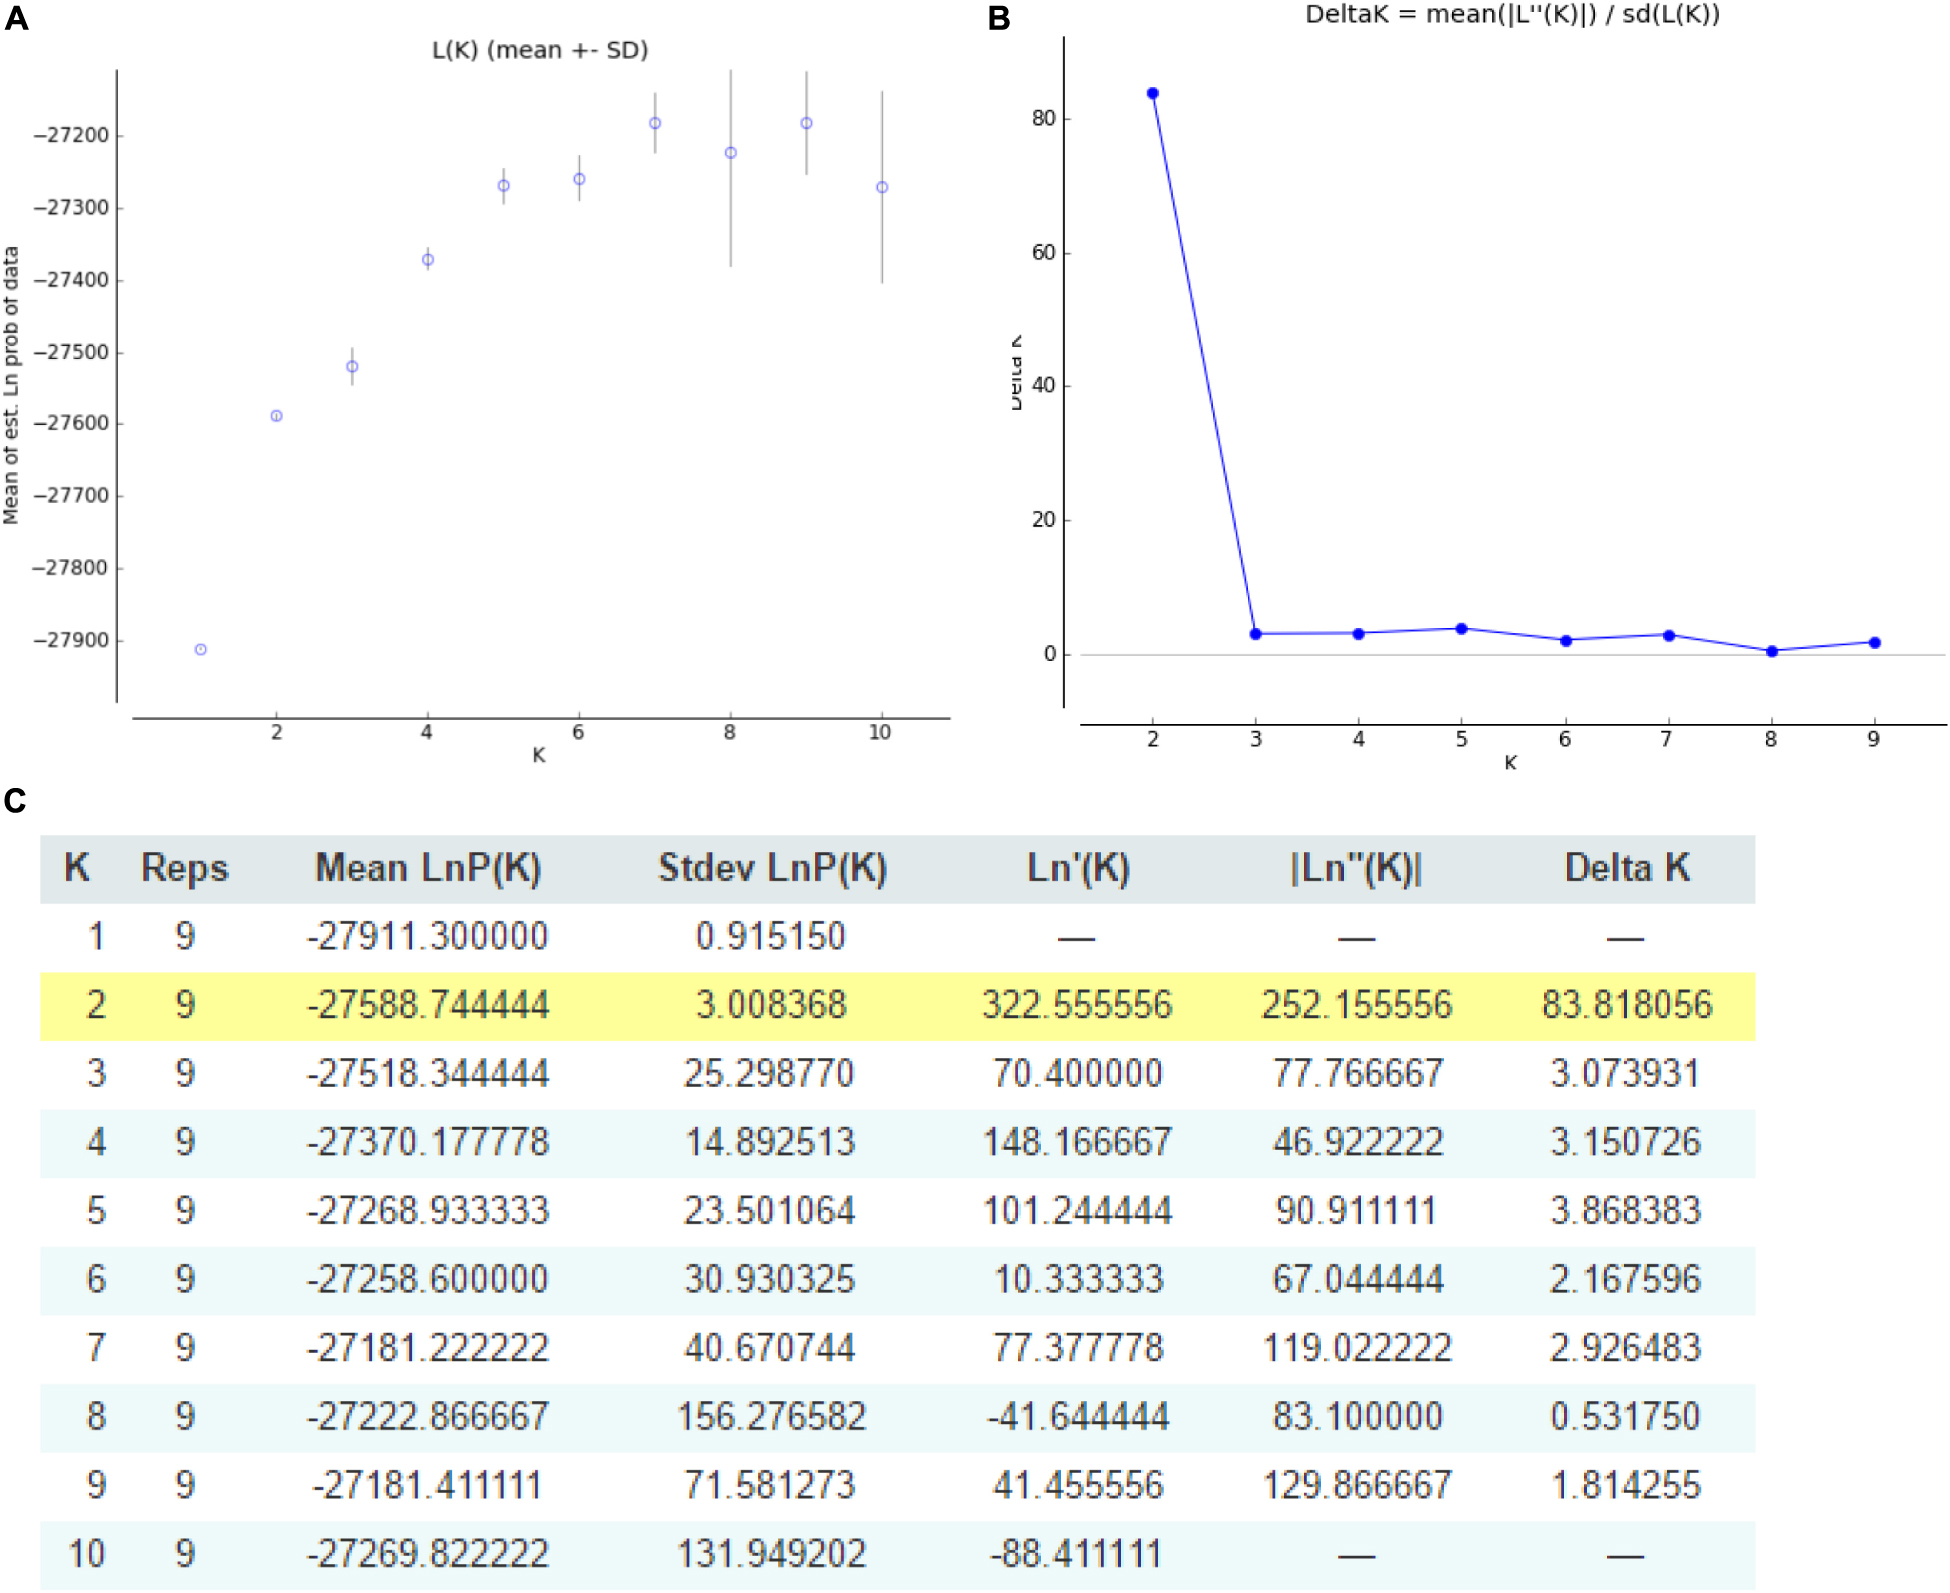
Figure 5. Graphical representation of the population structure. (A) K-values for different numbers of populations assumed (K) in the STRUCTURE analysis. (B) The median and variation of the estimated probability value for each K-value. (C) Evanno table output.
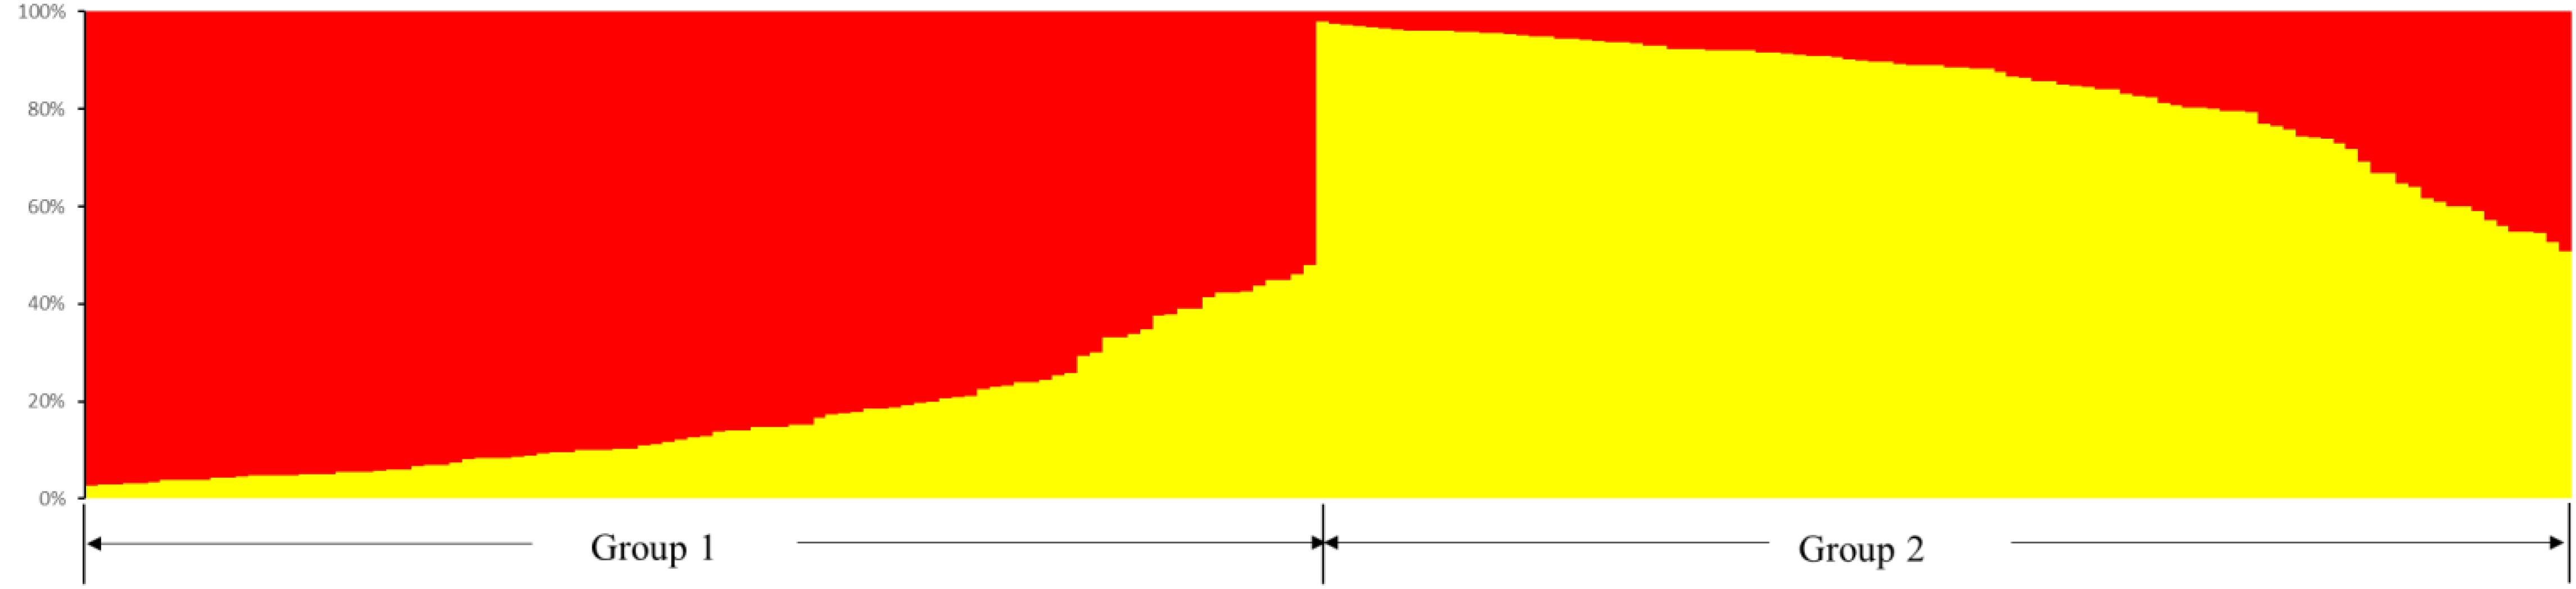
Figure 6. Population structure of the 199 hemp germplasm resources based on the SSR and the phenotypic markers.
Discussion
Various types of molecular markers are used to assess the genetic diversity of Cannabis, such as ribosomal DNA, inter-simple sequence repeats (ISSRs), sequence characterized amplified regions, random amplified polymorphic DNA (RAPD), and amplified fragment length polymorphism (AFLP). In one study, 10 pairs of AFLP primers are validated to identify illicit Cannabis cultivars (Datwyler and Weiblen, 2006). Other studies use RAPD markers to identify prefloral hemp (Shao et al., 2003) and the RAPD marker OPA8 that generates specific 400-bp bands in male but not in female plants (Mandolino et al., 1999). A genetic diversity analysis of 27 Chinese hemp cultivars using ISSR markers reveals that the accessions can be classified into five categories (Zhang et al., 2014).
SSR markers are based on microsatellites and are considered the most efficient and abundant molecular markers with a high ratio of genome coverage. They are highly reproducible and can be used to study codominant inheritance (Chen et al., 2019). Moreover, SSR polymorphisms are employed to identify and characterize germplasm resources in terms of affiliation (Tuler et al., 2015), and the development and characterization of genomic SSRs in hemp are important to enable genetic research and marker-assisted selection. Because SSR markers have a higher number of polymorphisms than other molecular markers, they are popular and ideal for analyzing population structure and genetic diversity and identifying fiber crop varieties (Zhang et al., 2015a, b; Saha et al., 2017, 2019). In previous research, EST-SSR development was conducted, and 4577 potential SSR motifs were identified for Cannabis (Gao et al., 2014).
Genomic SSRs have the advantages of a higher number of polymorphisms and higher stability than EST-SSR markers (Ding et al., 2017). Thus, SSR markers in Cannabis can be valuable in future research. In the present study, 92,409 SSR motifs are detected in the Cannabis genome, from which 63,707 pairs of SSR primers are developed, meaning 63.7% of motifs with developed primers. The most abundant sequence motif is of the dinucleotide type (56,406), and the most abundant repeat motif is AT/TA (41.84%). These results differ from those of previous studies, which report that the trinucleotide AAG/CTT and dinucleotide AG/CT are the most common types in EST-SSR (Alghanim and Almirall, 2003; Gao et al., 2014). The most abundant motifs are detected on chromosome 5, suggesting this chromosome may have abundant genetic information and several potentially modified loci. Among the 80 pairs of genomic SSRs, 59 have validated polymorphisms. This information is valuable for the development of Cannabis fingerprints to aid in cultivar identification. Knowledge of the genetic diversity and population structure of crop germplasm resources could accelerate genetic research and the development of new plant varieties. Thus, the results obtained herein may also aid in conserving and utilizing specific high-quality germplasm resources.
Cannabis shows higher genetic diversity than annual wind-pollinated and gravity-dispersed weedy plants (Lynch et al., 2016). Historically, Cannabis germplasm resources around the world are limited. In the 1970s, because of the hallucinogenic effects of Cannabis, the United States prohibited Cannabis planting, and other countries followed. However, in the 1990s, scientists determined that Cannabis had positive treatment effects on various diseases, and Cannabis farming was accepted worldwide (Chandra et al., 2017). However, the ban on Cannabis farming for several years affected global germplasm resource collection and our knowledge of its genetic structure and diversity.
In a previous study, the genetic diversity and DNA fingerprinting of jute was analyzed by 28 pairs of SSR primers, a total of 184 polymorphic loci were identified, and the DNA fingerprinting of 58 jute accessions was based on SSR markers (Zhang et al., 2015a). The genetic differentiation and population structure of 93 fiber flax accessions were evaluated based on genome-wide regulatory gene-derived SSRs and all accessions separated into two subpopulations: Indian and global (Saha et al., 2019). In the present study, PIC values > 0.5 indicate that the locus is highly informative, 0.25 < PIC < 0.5 represent moderate polymorphisms, and PIC values < 0.25 mean a low rate of polymorphism (Jensen et al., 2011). Because PIC ranges from 0.25 to 0.78 (mean: 0.50), Cannabis germplasm resources are considered to have a high degree of polymorphism. The values are lower than those of the Kenyan common bean (Phaseolus vulgaris L.) (Valentini et al., 2018), Indian garlic (Allium sativum L.) (Kumar et al., 2019), and ramie (Boehmeria nivea L.) (Feng et al., 2018) and higher than those of tea plants (Camellia sinensis L.) (Ori et al., 2017), corn (Zea mays L.) (Zhang et al., 2017), and sesame (Sesamum indicum L.) (Yue et al., 2012). In addition, the PIC values of the domesticated, wild, and Chinese and foreign accessions range from 0.25 to 0.50, indicating that the germplasm resources in these regions have moderate polymorphism, and the results are consistent among the nine populations. The He of the accessions from the nine regions is around 0.55; when combined with the MAF (0.6), this indicates that the alleles are uniformly distributed across the populations. The I is around 0.9, which reveals that Cannabis has a highly stable genetic structure. The values of I, Ne, MAF, He, and H among the 199 germplasm resources from the nine regions range between 0.93 and 1.01, 2.35 and 2.50, 0.58 and 0.56, 0.55 and 0.56, and 0.53 and 0.56, respectively. The observed and effective numbers of alleles differ among the populations except for the samples from the other region; those from the other regions have an uneven distribution of alleles. The accessions show a stable genetic structure and moderate genetic diversity. Compared with the He value of 0.49 and I value of 0.32 reported previously (Gao et al., 2014), the accessions in the present study show high genetic diversity. The similarity between the populations analyzed with regard to genetic diversity is confirmed to be a result of a genetic bottleneck event. Following analysis using the IAM, the nine populations do not show mutation-drift equilibrium, suggesting a substantial erosion of genetic diversity among the populations.
In the present study, the germplasm resources are clustered in three groups, and each group includes samples from most, if not all, of the nine regions. In a previous report, 115 Cannabis accessions are divided into four groups, and the genetic diversity between Northern China and Europe is higher than that between groups containing accessions from China only (Gao et al., 2014). Thus, Cannabis germplasms cannot always be clearly distinguished based on geography although geographic origin could aid in domesticating certain varieties and introducing new ones. LnP(D) varies with the number of subgroups, but there is no obvious inflection point in the curve. The population structure analysis and mathematical model application divide the 199 germplasm resources into two subgroups in a population with a single structure.
Cannabis is believed to have originated in China, central Asia, and the northwest Himalayas (Hillig, 2005). The genetic structure of marijuana and hemp are significantly different (Sawler et al., 2015). Genetic differentiation varies with genetic frequency as well as with genetic drift and heterozygosity. The fixation index expresses the degree of genetic differentiation in the population at four levels: little (0 < Fst < 0.05), moderate (0.05 < Fst < 0.15), large genetic (when 0.15 < Fst < 0.25), and very large genetic differentiation (0.25 < Fst < 1) (Wright, 1965). The 199 germplasm resources show little genetic differentiation with an Fst value of 0.0468. Gene flow is a vital index to detect genetic leakage and assess genetic differentiation. When the gene flow (Nm) is >1, the population is able to efficiently prevent the genetic differentiation caused by genetic drift; otherwise, genetic differentiation is inevitable (Wright, 1965; Golenberg, 1987). Gene flow in the present study is 5.0974, indicating that Cannabis germplasm resources around the world frequently undergo gene exchange, which efficiently reduces the genetic differentiation caused by genetic drift. Accordingly, the genetic distance among the nine regions is low, which is consistent with the results of a previous review (Chandra et al., 2017). However, this genetic distance shows large variation. There is no difference among the cultivars and wild Cannabis varieties in China or between the Chinese and foreign Cannabis germplasms, but this result is not consistent with the findings of previous reports (Lynch et al., 2016). The genetic consistency of the germplasms analyzed herein is higher than 0.9, suggesting that the accessions from all nine regions have a relatively high kinship.
Because CBD and THC are unique to Cannabis, they are used as phenotypic markers in the present study (Piomelli and Russo, 2016). CBD and THC show therapeutic potential for many diseases (Galasso et al., 2016). To classify Cannabis varieties, the most accepted standard is a level of 0.3% for THC and 0.5% for CBD. When the THC content is >0.3% and the CBD content is <0.5%, the Cannabis is considered to be of the drug type; when the THC content is <0.3% and the CBD content is <0.5%, the Cannabis is of the fiber type; and when the THC content is <0.3% and the CBD content is >0.5%, it is considered to be of the medicinal type (Small and Beckstend, 1973; Small and Cronquist, 1976). In the present study, the contents of CBD in the 199 Cannabis accessions ranges from 0.00% to 0.93% (average: 0.15%), and the THC contents range from 0.00% to 0.75% (average: 0.18%). The variable coefficients are large for the CBD and THC contents at 108% and 82.6%, respectively. However, based on their THC and CBD contents, 33 accessions are of the drug type, 135 of the fiber type, 7 of the medicinal type, and 24 have inadequate data for classification.
Overall, the genetic diversity and population structure analyses presented herein provide a basis for the further investigation of Cannabis species by quantitative trait loci mapping, association analysis, and molecular-assisted breeding. Our findings can also further the exchange of Cannabis germplasms among different areas in China and the introduction of new Cannabis varieties from abroad.
Data Availability Statement
All datasets generated for this study are included in the article/Supplementary Material.
Author Contributions
LZ, DL, and DP designed the experiments. SH, JL, and AC provided the research materials. AB and CuZ performed polyacrylamide gel electrophoresis and data analysis. GP, LC, ChZ, and HT measured the contents of CBD, THC, and CBDA. JZ and JY wrote the manuscript.
Funding
This research was mainly supported by the China Agriculture Research System for Bast and Leaf Fiber Crops (CARS-16-E-02); China Agriculture Technology Research System and Agricultural Science and Technology Innovation Program (ASTIP-IBFC03); and National Natural Science Foundation of China (Grant No. 31871674).
Conflict of Interest
The authors declare that the research was conducted in the absence of any commercial or financial relationships that could be construed as a potential conflict of interest.
Supplementary Material
The Supplementary Material for this article can be found online at: https://www.frontiersin.org/articles/10.3389/fgene.2020.00958/full#supplementary-material
Footnotes
References
Alghanim, H. J., and Almirall, J. R. (2003). Development of microsatellite markers in Cannabis sativa for DNA typing and genetic relatedness analyses. Anal. Bioanal. Chem. 376, 1225–1233. doi: 10.1007/s00216-003-1984-0
Beier, S., Thiel, T., Münch, T., Scholz, U., and Mascher, M. (2017). MISA-web: a web server for microsatellite prediction. Bioinformatics 33, 2583–2585. doi: 10.1093/bioinformatics/btx198
Bossart, J. L., and Pashley Prowell, D. (1998). Genetic estimates of population structure and gene flow: limitations, lessons and new directions. Trends Ecol. Evol. 13, 202–206. doi: 10.1016/S0169-5347(97)01284-6
Cao, C., Li, Y., Liu, H., Bai, G., Mayl, J., Lin, X., et al. (2014). The potential therapeutic effects of THC on Alzheimer’s disease. J. Alzheimers Dis. 42, 973–984. doi: 10.3233/JAD-140093
Chandra, S., Lata, H., Khan, I. A., and ElSohly, M. A. (2017). Cannabis sativa L.: Botany and Horticulture. Cham: Springer.
Chen, C., Chen, Y., Huang, W., Jiang, Y., Zhang, H., and Wu, W. (2019). Mining of simple sequence repeats (SSRs) loci and development of novel transferability-across EST-SSR markers from de novo transcriptome assembly of Angelica dahurica. PLoS One 14:e0221040. doi: 10.1371/journal.pone.0221040
Cornuet, J. M., and Luikart, G. (1996). Description and power analysis of two tests for detecting recent population bottlenecks from allele frequency data. Genetics 144, 2001–2014. doi: 10.1093/oxfordjournals.jhered.a111627
Datwyler, S. L., and Weiblen, G. D. (2006). Genetic variation in hemp and marijuana (Cannabis sativa L.) according to amplified fragment length polymorphisms. J. Forensic Sci. 51, 371–375. doi: 10.1111/j.1556-4029.2006.00061.x
Ding, S., Wang, S., He, K., Jiang, M., and Li, F. (2017). Large-scale analysis reveals that the genome features of simple sequence repeats are generally conserved at the family level in insects. BMC Genomics 18:848. doi: 10.1186/s12864-017-4234-0
Earl, D. A., and vonHoldt, B. M. (2012). Structure harvester: a website and program for visualizing STRUCTURE output and implementing the Evanno method. Conserv. Genet. Resour. 4, 359–361. doi: 10.1007/s12686-011-9548-7
Ellegren, H., and Galtier, N. (2016). Determinants of genetic diversity. Nat. Rev. Genet. 17, 422–433. doi: 10.1038/nrg.2016.58
Evanno, G., Regnaut, S., and Goudet, J. (2005). Detecting the number of clusters of individuals using the software structure: a simulation study. Mol. Ecol. 14, 2611–2620. doi: 10.1111/j.1365-294X.2005.02553.x
Falush, D., Stephens, M., and Pritchard, J. K. (2007). Inference of population structure using multilocus genotype data: dominant markers and null alleles. Mol. Ecol. Notes 7, 574–578. doi: 10.1111/j.1471-8286.2007.01758.x
Feng, Y., Ryan, U. M., and Xiao, L. (2018). Genetic diversity and population structure of cryptosporidium. Trends Parasitol. 34, 997–1011. doi: 10.1016/j.pt.2018.07.009
Flach, A. J., Anderson, D. R., Spaeth, G. L., and Cantor, L. B. (2002). Delta-9-tetrahydrocannabinol (THC) in the treatment of end-stage open-angle glaucoma. Trans. Am. Ophthalmol. Soc. 100, 215–224.
Galasso, I., Russo, R., Mapelli, S., Ponzoni, E., Brambilla, I. M., Battelli, G., et al. (2016). Variability in seed traits in a collection of Cannabis sativa L. genotypes. Front. Plant Sci. 7:688. doi: 10.3389/fpls.2016.00688
Gao, C., Xin, P., Cheng, C., Tang, Q., Chen, P., Wang, C., et al. (2014). Diversity analysis in Cannabis sativabased on large-scale development of expressed sequence tag-derived simple sequence repeat markers. PLoS One 9:e110638. doi: 10.1371/journal.pone.0110638
Golenberg, E. M. (1987). Estimation of gene flow and genetic neighborhood size by indirect methods in a selfing annual, Triticum dicoccoides. Evolution 41:1326. doi: 10.2307/2409097
Hillig, K. W. (2005). Genetic evidence for speciation in Cannabis (Cannabaceae). Genet. Resour. Crop Evol. 52, 161–180. doi: 10.1007/s10722-003-4452-y
Hufbauer, R. A., Bogdanowicz, S. M., and Harrison, R. G. (2004). The population genetics of a biological control introduction: mitochondrial DNA and microsatellie variation in native and introduced populations of Aphidus ervi, a parisitoid wasp. Mol. Ecol. 13, 337–348. doi: 10.1046/j.1365-294X.2003.02084.x
Jannatdoust, M., Darvishzadeh, R., Ziaeifard, R., Ebrahimi, M. A., Maleki, H. H., Gholinezhad, E., et al. (2016). Analysis of genetic diversity and population structure of confectionery sunflower (Helianthus annuus L.) native to Iran. J. Crop Sci. Biotechnol. 19, 37–44. doi: 10.1007/s12892-015-0052-6
Jensen, B. D., Touré, F. M., Hamattal, M. A., Touré, F. A., and Nantoumé, A. D. (2011). Watermelons in the sand of Sahara: cultivation and use of indigenous landraces in the Tombouctou Region of Mali. Ethnobot. Res. Appl. 9, 151–162. doi: 10.17348/era.9.0.151-162
Kumar, M., Rakesh Sharma, V., Kumar, V., Sirohi, U., Chaudhary, V., Sharma, S., et al. (2019). Genetic diversity and population structure analysis of Indian garlic (Allium sativum L.) collection using SSR markers. Physiol. Mol. Biol. Plants 25, 377–386. doi: 10.1007/s12298-018-0628-y
Kumar, S., Stecher, G., and Tamura, K. (2016). MEGA7: molecular evolutionary genetics analysis version 7.0 for bigger datasets. Mol. Biol. Evol. 33, 1870–1874. doi: 10.1093/molbev/msw054
Laverty, K. U., Stout, J. M., Sullivan, M. J., Shah, H., Gill, N., Holbrook, L., et al. (2019). A physical and genetic map of Cannabis sativa identifies extensive rearrangements at the THC/CBD acid synthase loci. Genome Res. 29, 146–156. doi: 10.1101/gr.242594.118
Li, H. L. (1973). An archaeological and historical account of Cannabis in China. Econ. Bot. 28, 437–448. doi: 10.1007/BF02862859
Lynch, R. C., Vergara, D., Tittes, S., White, K., Schwartz, C. J., Gibbs, M. J., et al. (2016). Genomic and chemical diversity in Cannabis. CRC. Crit. Rev. Plant Sci. 35, 349–363. doi: 10.1080/07352689.2016.1265363
Mandolino, G., and Carboni, A. (2004). Potential of marker-assisted selection in hemp genetic improvement. Euphytica 140, 107–120. doi: 10.1007/s10681-004-4759-6
Mandolino, G., Carboni, A., Forapani, S., Faeti, V., and Ranalli, P. (1999). Identification of DNA markers linked to the male sex in dioecious hemp (Cannabis sativa L.). Theor. Appl. Genet. 98, 86–92. doi: 10.1007/s001220051043
Nadeem, M. A., Nawaz, M. A., Shahid, M. Q., Doǧan, Y., Comertpay, G., Yıldız, M., et al. (2018). DNA molecular markers in plant breeding: current status and recent advancements in genomic selection and genome editing. Biotechnol. Biotechnol. Equip. 32, 261–285. doi: 10.1080/13102818.2017.1400401
Nderu, D., Kimani, F., Karanja, E., Thiong’o, K., Akinyi, M., Too, E., et al. (2019). Genetic diversity and population structure of Plasmodium falciparum in kenyan–ugandan border areas. Trop. Med. Int. Heal. 24, 647–656. doi: 10.1111/tmi.13223
Ori, F., Ma, J. Q., Gori, M., Lenzi, A., Chen, L., and Giordani, E. (2017). DNA-based diversity of tea plants grown in Italy. Genet. Resour. Crop Evol. 64, 1905–1915. doi: 10.1007/s10722-016-0480-2
Piomelli, D., and Russo, E. B. (2016). The Cannabis sativa versus Cannabis indica debate: an interview with Ethan Russo, MD. Cannabis Cannabinoid Res. 1, 44–46. doi: 10.1089/can.2015.29003.ebr
Saha, D., Rana, R. S., Chakraborty, S., Datta, S., Kumar, A. A., Chakraborty, A. K., et al. (2017). Development of a set of SSR markers for genetic polymorphism detection and interspecific hybrid jute breeding. Crop J. 5, 416–429. doi: 10.1016/j.cj.2017.02.006
Saha, D., Rana, R. S., Das, S., Datta, S., Mitra, J., Cloutier, S. J., et al. (2019). Genome-wide regulatory gene-derived SSRs reveal genetic differentiation and population structure in fiber flax genotypes. J. Appl. Genet. 60, 13–25. doi: 10.1007/s13353-018-0476-z
Sawler, J., Stout, J. M., Gardner, K. M., Hudson, D., Vidmar, J., Butler, L., et al. (2015). The genetic structure of marijuana and hemp. PLoS One 10:e0133292. doi: 10.1371/journal.pone.0133292
Schluttenhofer, C., and Yuan, L. (2019). Hemp hemp hooray for Cannabis research. Science 363, 701–702. doi: 10.1126/science.aaw3537
Schultes, R. E., Klein, W. M., Plowman, T., and Lockwood, T. E. (1974). Cannabis: an example of taxonomic neglect. Harvard Univ. Bot. Museum Leafl. 23, 337–367.
Shao, H., Song, S. J., and Clarke, R. C. (2003). Female-associated dna polymorphisms of hemp (Cannabis sativa l.). J. Ind. Hemp. 8, 5–9. doi: 10.1300/J237v08n01_02
Shirley, N., Allgeier, L., Lanier, T., and Coyle, H. M. (2013). Analysis of the NMI01 marker for a population database of Cannabis seeds. J. Forensic Sci. 58, 176–182. doi: 10.1111/1556-4029.12005
Small, E., and Beckstend, H. D. (1973). Common cannabinoid phenotypes in 350 stocks of Cannabis. Lloydia 36, 144–165.
Small, E., and Cronquist, A. (1976). A practical and natural taxonomy for Cannabis. Taxon 25, 405–435. doi: 10.2307/1220524
Soler, S., Gramazio, P., Figàs, M. R., Vilanova, S., Rosa, E., Llosa, E. R., et al. (2017). Genetic structure of Cannabis sativa var. indica cultivars based on genomic SSR (gSSR) markers: implications for breeding and germplasm management. Ind. Crops Prod. 104, 171–178. doi: 10.1016/j.indcrop.2017.04.043
Teitelbaum, J. (2019). A hemp oil, CBD, and marijuana primer: powerful pain, insomnia, and anxiety-relieving tools! Altern. Ther. Health Med. 25, 21–23.
Tuler, A. C., Carrijo, T. T., Nóia, L. R., Ferreira, A., Peixoto, A. L., and da Silva Ferreira, M. F. (2015). SSR markers: a tool for species identification in Psidium (Myrtaceae). Mol. Biol. Rep. 42, 1501–1513. doi: 10.1007/s11033-015-3927-1
Valentini, G., Gonçalves-Vidigal, M. C., Elias, J. C. F., Moiana, L. D., and Mindo, N. N. A. (2018). Population structure and genetic diversity of common bean accessions from Brazil. Plant Mol. Biol. Rep. 36, 897–906. doi: 10.1007/s11105-018-1129-4
Wright, S. (1965). The interpretation of population structure by f-statistics with special regard to systems of mating. Evolution 19:395. doi: 10.2307/2406450
Yeh, F., and Boyle, T. (1997). Population genetic analysis of co-dominant and dominant markers and quantitative traits. Belgian J. Bot. 129:157.
Yue, W., Wei, L. B., Zhang, T., Li, C., Miao, H. M., and Zhang, H. Y. (2012). Genetic diversity and population structure of germplasm resources in sesame (Sesamum indicum L.) by SSR markers. Acta Agron. Sin. 38, 2286–2296. doi: 10.3724/SP.J.1006.2012.02286
Zhang, L., Cai, R., Yuan, M., Tao, A., Xu, J., Lin, L., et al. (2015a). Genetic diversity and DNA fingerprinting in jute (Corchorus spp.) based on SSR markers. Crop J. 3, 416–422. doi: 10.1016/j.cj.2015.05.005
Zhang, L., Li, Y., Tao, A., Fang, P., and Qi, J. (2015b). Development and characterization of 1,906 EST-SSR markers from unigenes in jute (Corchorus spp.). PLoS One 10:e0140861. doi: 10.1371/journal.pone.0140861
Zhang, L. G., Chang, Y., Zhang, X. F., Guan, F. Z., Yuan, H. M., Yu, Y., et al. (2014). Analysis of the genetic diversity of Chinese native Cannabis sativa cultivars by using ISSR and chromosome markers. Genet. Mol. Res. 13, 10490–10500. doi: 10.4238/2014.December.12.10
Keywords: Cannabis, genetic diversity, population structure, simple sequence repeat, cluster analysis
Citation: Zhang J, Yan J, Huang S, Pan G, Chang L, Li J, Zhang C, Tang H, Chen A, Peng D, Biswas A, Zhang C, Zhao L and Li D (2020) Genetic Diversity and Population Structure of Cannabis Based on the Genome-Wide Development of Simple Sequence Repeat Markers. Front. Genet. 11:958. doi: 10.3389/fgene.2020.00958
Received: 17 March 2020; Accepted: 30 July 2020;
Published: 11 September 2020.
Edited by:
Liwu Zhang, Fujian Agriculture and Forestry University, ChinaReviewed by:
Dipnarayan Saha, Central Research Institute for Jute and Allied Fibres, Indian Council of Agricultural Research, IndiaSalih Kafkas, Çukurova University, Turkey
Copyright © 2020 Zhang, Yan, Huang, Pan, Chang, Li, Zhang, Tang, Chen, Peng, Biswas, Zhang, Zhao and Li. This is an open-access article distributed under the terms of the Creative Commons Attribution License (CC BY). The use, distribution or reproduction in other forums is permitted, provided the original author(s) and the copyright owner(s) are credited and that the original publication in this journal is cited, in accordance with accepted academic practice. No use, distribution or reproduction is permitted which does not comply with these terms.
*Correspondence: Jiangjiang Zhang, emhhbmdqaWFuZ2ppYW5nNkAxNjMuY29t; Lining Zhao, Y3NidHpsbkAxNjMuY29t; Defang Li, Y2hpbmFrZW5hZkAxMjYuY29t
†These authors have contributed equally to this work