 Biao Yang
 Meijing Zhang2†
- 1Department of General Surgery, Changhai Hospital, Second Military Medical University, Shanghai, China
- 2Department of Oncology, Changhai Hospital, Second Military Medical University, Shanghai, China
Purpose: Stomach adenocarcinoma (STAD) is one of the most frequently diagnosed cancer in the world with both high mortality and high metastatic capacity. Therefore, the present study aimed to investigate novel therapeutic targets and prognostic biomarkers that can be used for STAD treatment.
Materials and Methods: We acquired four original gene chip profiles, namely GSE13911, GSE19826, GSE54129, and GSE65801 from the Gene Expression Omnibus (GEO). The datasets included a total of 114 STAD tissues and 110 adjacent normal tissues. The GEO2R online tool and Venn diagram software were used to discriminate differentially expressed genes (DEGs). Gene ontology (GO) and Kyoto Encyclopedia of Gene and Genome (KEGG) enriched pathways were also performed for annotation and visualization with DEGs. The STRING online database was used to identify the functional interactions of DEGs. Subsequently, we selected the most significant DEGs to construct the protein-protein interaction (PPI) network and to reveal the core genes involved. Finally, the Kaplan-Meier Plotter online database and Gene Expression Profiling Interactive Analysis (GEPIA) were used to analyze the prognostic information of the core DEGs.
Results: A total of 114 DEGs (35 upregulated and 79 downregulated) were identified, which were abnormally expressed in the GEO datasets. GO analysis demonstrated that the majority of the upregulated DEGs were significantly enriched in collagen trimer, cell adhesion, and identical protein binding. The downregulated DEGs were involved in extracellular space, digestion, and inward rectifier potassium channel activity. Signaling pathway analysis indicated that upregulated DEGs were mainly enriched in receptor interaction, whereas downregulated DEGs were involved in gastric acid secretion. A total of 80 DEGs were screened into the PPI network complex, and one of the most important modules with a high degree was detected. Furthermore, 10 core genes were identified, namely COL1A1, COL1A2, FN1, COL5A2, BGN, COL6A3, COL12A1, THBS2, CDH11, and SERPINH1. Finally, the results of the prognostic information further demonstrated that all 10 core genes exhibited significantly higher expression in STAD tissues compared with that noted in normal tissues.
Conclusion: The multiple molecular mechanisms of these novel core genes in STAD are worthy of further investigation and may reveal novel therapeutic targets and biomarkers for STAD treatment.
Introduction
Stomach adenocarcinoma (STAD) is one of the common malignant tumors, which accounts for high mortality and high incidence worldwide, notably in East Asia. In China alone, approximately 3,804,000 new cancer cases were diagnosed and 2,296,000 cancer deaths were reported in 2015 (Chen et al., 2018). Among them, the incidence and mortality of STAD ranked third (Bray et al., 2018). Although the gastroscopy and diagnostic techniques have made significant improvements in the treatment options of STAD, the overall survival rate for STAD patients remains unfavorable. According to the latest report, the 5-year survival rate for STAD is estimated to be approximately 10% (Chen et al., 2016). STAD is a complicated and gradual process and several genetic and environmental factors play important roles in its pathogenesis. Some of these risk factors, such as H. pylori infection, diet, smoking, chemical exposure, alcohol consumption, and exercise can also influence the development of STAD (Karimi et al., 2014). Cumulative evidence has shown that genetic factors, such as Glutathione S-transferase M1 (GSTM1)-null phenotypes and variants in the E-cadherin (CDH1), interleukin-17 (IL-17) and interleukin-10 (IL-10) contribute to the development of STAD (Meng et al., 2014; Long et al., 2015; Alvarez-Escola et al., 2019; Gao et al., 2019). Currently, numerous studies have focused on studying the mechanisms of STAD and several considerable improvements have been made in the efficacy of the clinical therapeutic methods. However, the lack of tumor-sensitive biomarkers that can be used early is considered to lead to poor prognosis. Therefore, it is essential to understand the pathogenesis and identification of novel promising prognostic biomarkers for individualized therapies, which can be beneficial in the improvement of life and survival of STAD.
In recent years, gene expression microarray and gene chip detection techniques have increased dramatically and biomedical research is commonly used to screen differentially expressed genes (DEGs) in a given organism and to identify prospective biomarkers for early diagnosis and advanced treatment of tumors (Vogelstein et al., 2013). The Gene Expression Omnibus (GEO) profiles and the Cancer Genome Atlas (TCGA) are public databases that have accumulated a large amount of core chipdata on the association between genes and diseases at the gene level (Petryszak et al., 2014). Therefore, large amounts of gene expression profiles and prognostic biomarkers can in theory be identified for STAD. Significant improvement has been made in the field of bioinformatic research on STAD in recent years (Liu et al., 2018; Pectasides et al., 2018; Chu et al., 2019). Nevertheless, the results are distinct or limited due to independent sample heterogeneity. To overcome these disadvantages, we adopted the methods of integrating bioinformatics with gene chip techniques.
In the present study, we obtained four original gene chip profiles, namely GSE13911, GSE19826, GSE54129, and GSE65801 from GEO. The datasets included a total of 114 STAD tissues and 110 adjacent normal tissues. The GEO2R online tool and Venn diagram software were used to discriminate DEGs. Gene ontology (GO) and Kyoto Encyclopedia of Gene and Genome (KEGG) enriched pathways were also performed for annotation and visualization with DEGs. The STRING online database was used to identify the functional interactions of DEGs. Subsequently, the most significant DEGs were selected to construct the protein-protein interaction (PPI) network and to reveal the core genes. Finally, the prognostic information was assessed for the core DEGs using the Kaplan-Meier Plotter online database and the Gene Expression Profiling Interactive Analysis (GEPIA). Due to its comprehensive analysis, the present study is one of the few to gather multiple databases regarding STAD. In conclusion, it can be deduced that the core DEGs and the enriched pathways in STAD may aid the screening and the identification of novel biomarkers and treatment targets of STAD in the future.
Materials and Methods
Microarray Data Information
The four gene chip profiles GSE13911, GSE19826, GSE54129, and GSE65801 containing information on STAD and adjacent normal tissues (ANT) were obtained from NCBI-GEO. The GSE13911, GSE19826, and GSE54129 were based on the GPL570 platforms, whereas GSE65801 was based on GPL14550. The GSE13911, GSE19826, GSE54129, and GSE65801 contained 38STAD and 31ANT, 12STAD and 15ANT, 111STAD and 21ANT, and 32STAD and 32ANT, respectively.
Data Preprocessing of DEGs
The GEO2R online tools (Davis and Meltzer, 2007) were used to distinguish DEGs between stomach tumors and adjacent normal tissues by the cut-off criteria of adjusted P < 0.05 and |log2FC| > 1.5. Subsequently, the Venn software was used online to identify the original data among the four datasets and to reveal the commonly encountered DEGs.
GO and Pathway Enrichment Analysis
Gene ontology (Ashburner et al., 2000) is a tool used to identify genes and proteins and to reveal the biological property of the chip database. KEGG (Kanehisa and Goto, 2000) is a collection of databases dealing with genomes and biological pathways. GO and KEGG analyses were used by the DAVID (Huang da et al., 2009), an online bioinformatic resource that can afford tools for several gene functions, such as DEG enrichment. The cut-off criterion was P < 0.05.
PPI Network and Module Analysis
Initially, the search Tool for the Retrieval of Interacting Genes (STRING1) (Szklarczyk et al., 2015) was used to evaluate the PPI information. Secondly, Cytoscape (Shannon et al., 2003) was used to construct the potential association between these candidate DEGs. Finally, the Molecular Complex Detection (MCODE) software was used to screen the modules of the PPI network according to degree cutoff = 2, Depth = 100, k-core = 2, and node score cutoff = 0.2.
Core Gene Analysis
The Kaplan-Meier Plotter online database was used to assess the overall survival of the core genes. GEPIA (Tang et al., 2017) was used to determine the expression levels related to the core genes. GEPIA is an online tool that can achieve characteristic functionalities based on TCGA and GTEx data. The hazard ratio (HR) with 95% confidence intervals and log-rank P value were computed and plotted.
Results
Identification of DEGs in STAD
The overall design of this study is illustrated in Figure 1A. 4 gene expression array datasets were obtained from the GEO database as follows: GSE13911, GSE19826, GSE54129, and GSE65801, respectively (Table 1). Following screening of the data with GEO2R online tools with the cut-off criterion of adjusted P < 0.05 and |log2FC| > 1.5, 1,294, 899, 2,419, and 1,734 DEGs were screened from the four expression profile data, respectively. The volcano plot of the DEGs depending on FCs was displayed in Supplementary Figure 1. Finally, the commonly expressed 114 DEGs, including 35 upregulated and 79 downregulated genes were identified in the STAD tissues compared with the non-tumor samples via the Venn diagram software in the four datasets (Table 2 and Figures 1B,C).
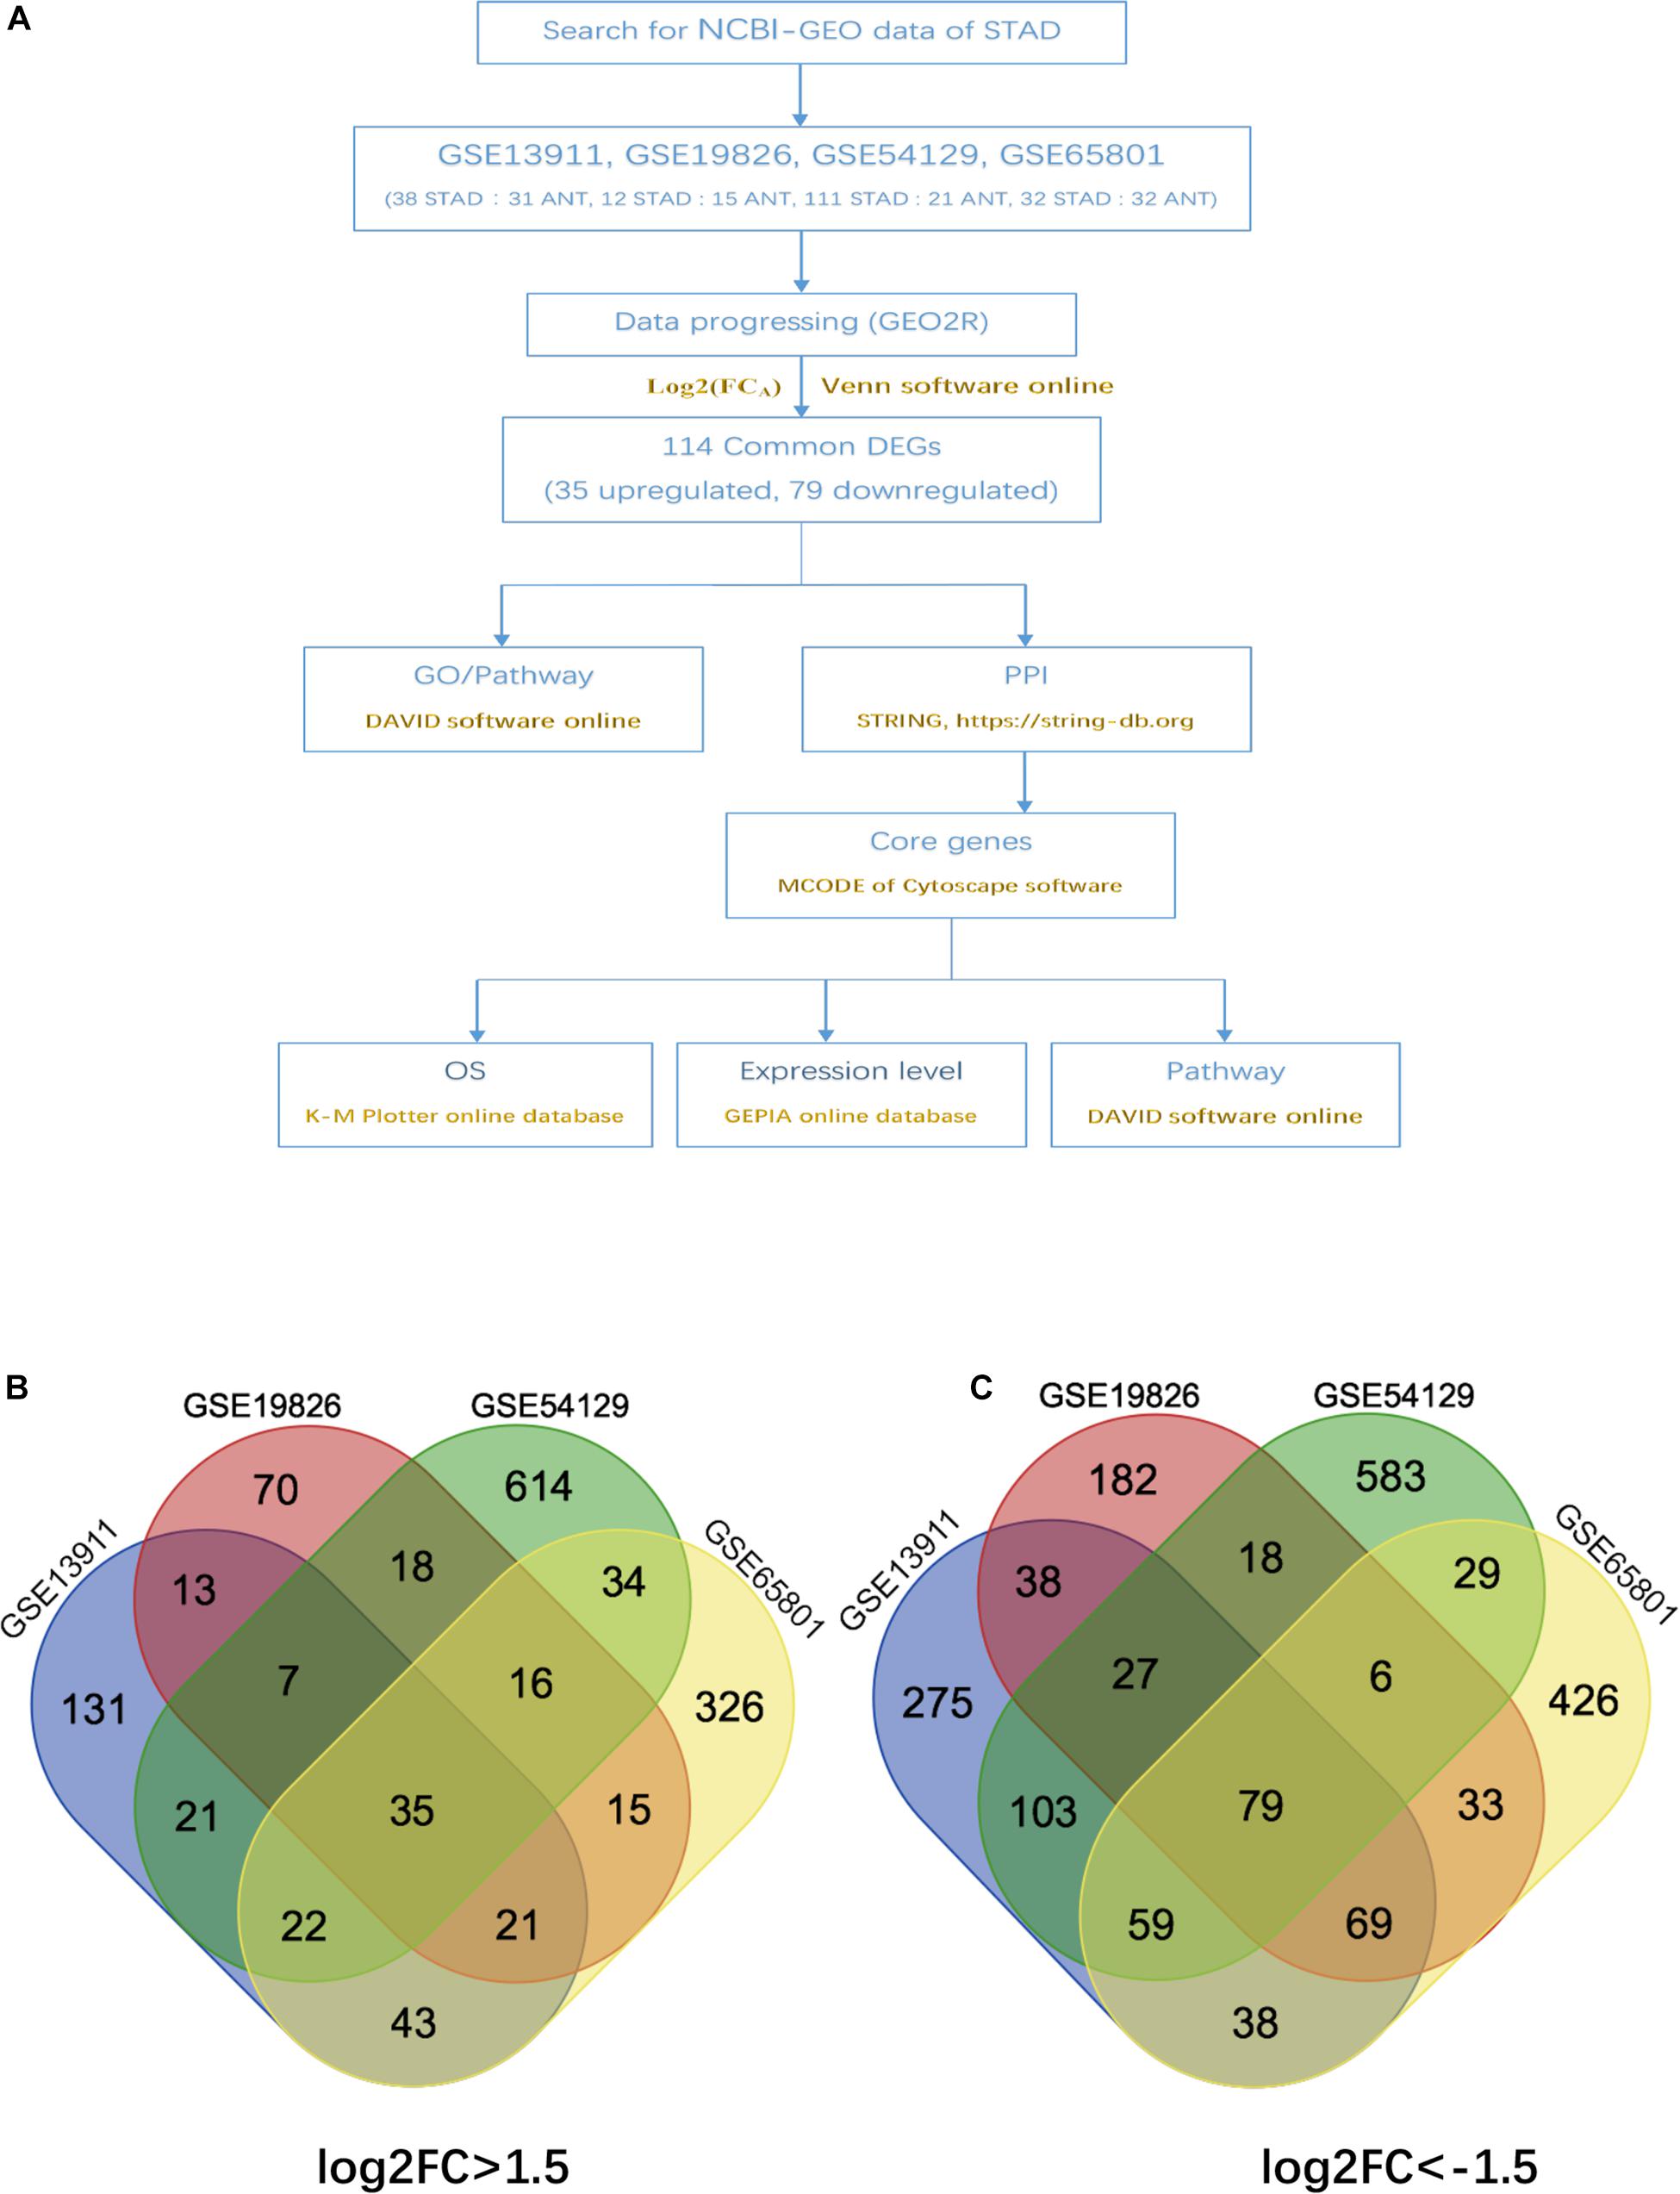
Figure 1. Authentication of 114 common DEGs in the four datasets (GSE13911, GSE19826, GSE54129, and GSE65801) through venn diagrams software (available online at: http://bioinformatics.psb.ugent.be/webtools/venn/). Different color meant different datasets. (A) Overall diagram of the study. (B) 35 DEGs were up-regulated in the four datasets (log2FC > 1.5). (C) 79 DEGs were down-regulated in the four datasets (log2FC > –1.5).
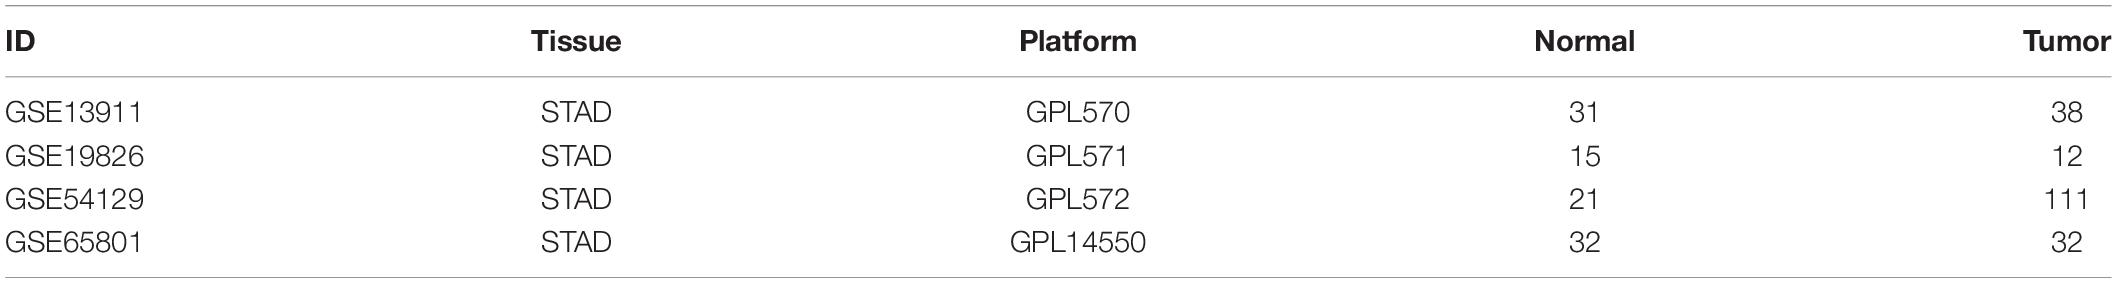
Table 1. The detailed information of the four GEO datasets.
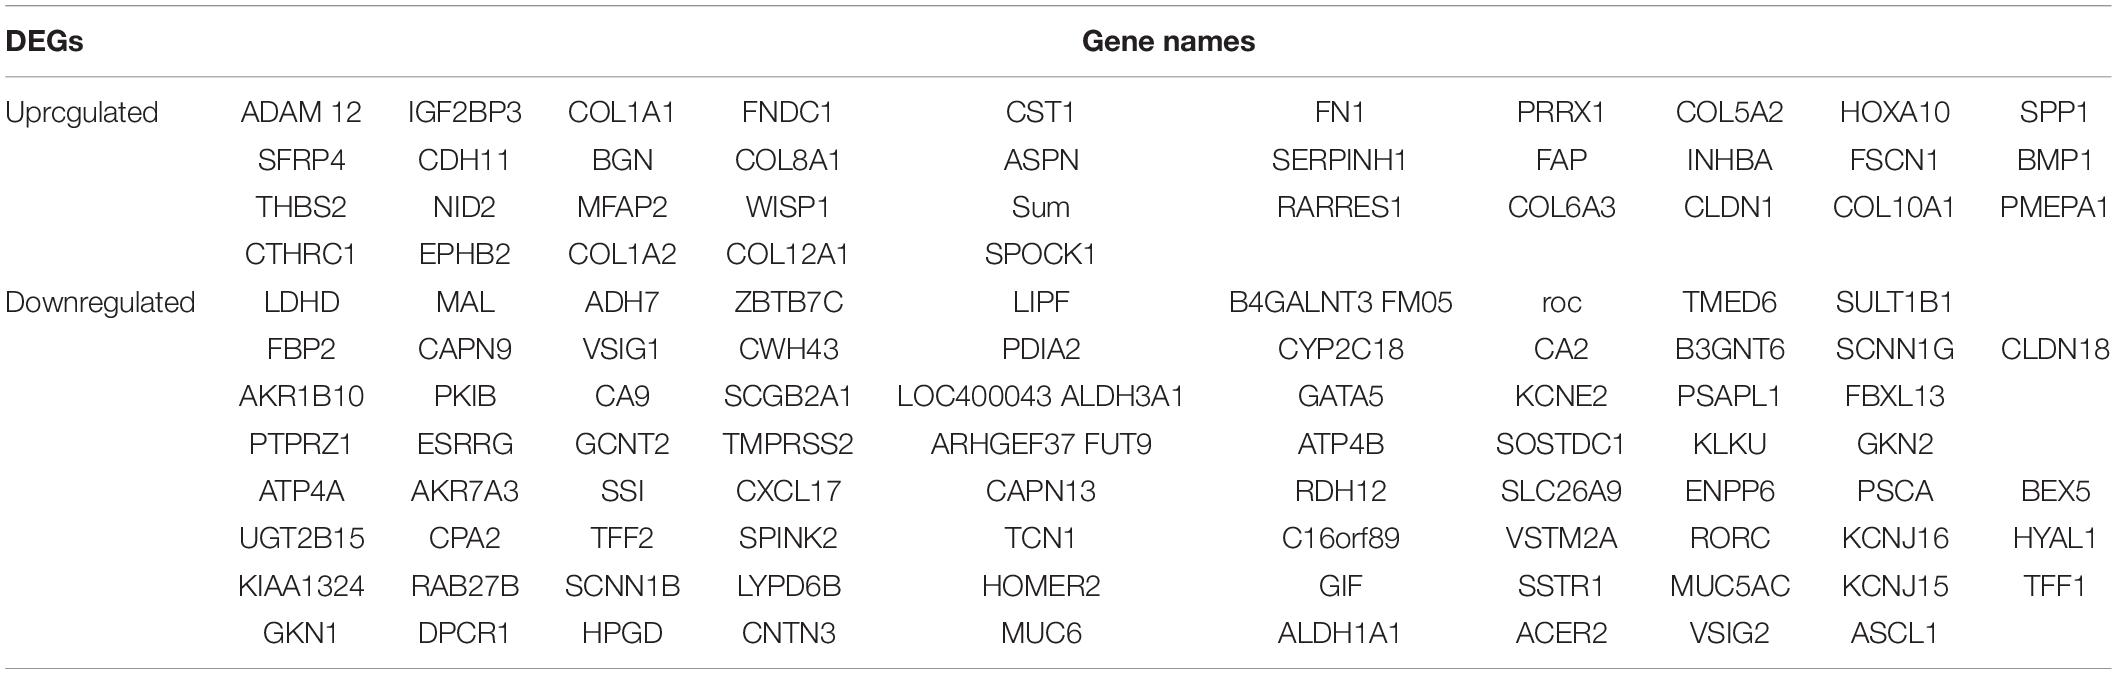
Table 2. All 114 commonly differentially expressed genes (DEGs) were detected from four profile datasets, including 79 downregulated genes and 35 upregulated genes in the STAD tissues compared to normal STAD tissues.
DEGs, GO, and KEGG Pathway Analysis in STAD
To comprehend the DEG functional levels, the online biological tool DAVID6.8 was performed using the GO analysis with a significance threshold of P < 0.05. The results of the 34 DEGs in the GO terms of the categories were divided into three groups as follows: biological process (BP), cellular component (CC), and molecular function (MF). As indicated in Table 3, the CC of overexpressing DEGs were mainly enriched in collagen trimer, proteinaceous extracellular matrix, extracellular space, extracellular exosome, and extracellular region; the downregulated DEGs were involved in the extracellular space, apical plasma membrane, extracellular exosome, and anchored component of membrane and lysosome. The BP of the overexpressing DEGs was mainly enriched in cell adhesion, endodermal cell differentiation, collagen fibril organization, cellular response to amino acid stimulus, and skeletal system development. The downregulated DEGs were involved in digestion, cellular aldehyde metabolic process, xenobiotic metabolic process, oxidation-reduction process, and potassium ion import. The MF of the overexpressing DEGs were mainly enriched in identical protein binding, extracellular matrix structural constituent, protein binding, calcium ion binding, and platelet-derived growth factor binding; the down-regulated DEGs were involved in inward rectifier potassium channel activity, benzaldehyde dehydrogenase (NAD+) activity, hydrogen:potassium-exchanging ATPase activity, retinal dehydrogenase activity, and ligand-gated sodium channel activity. In general, the GO terms of the top 10 were displayed in Figures 2A–C according to the P-value (Supplementary Table 2).
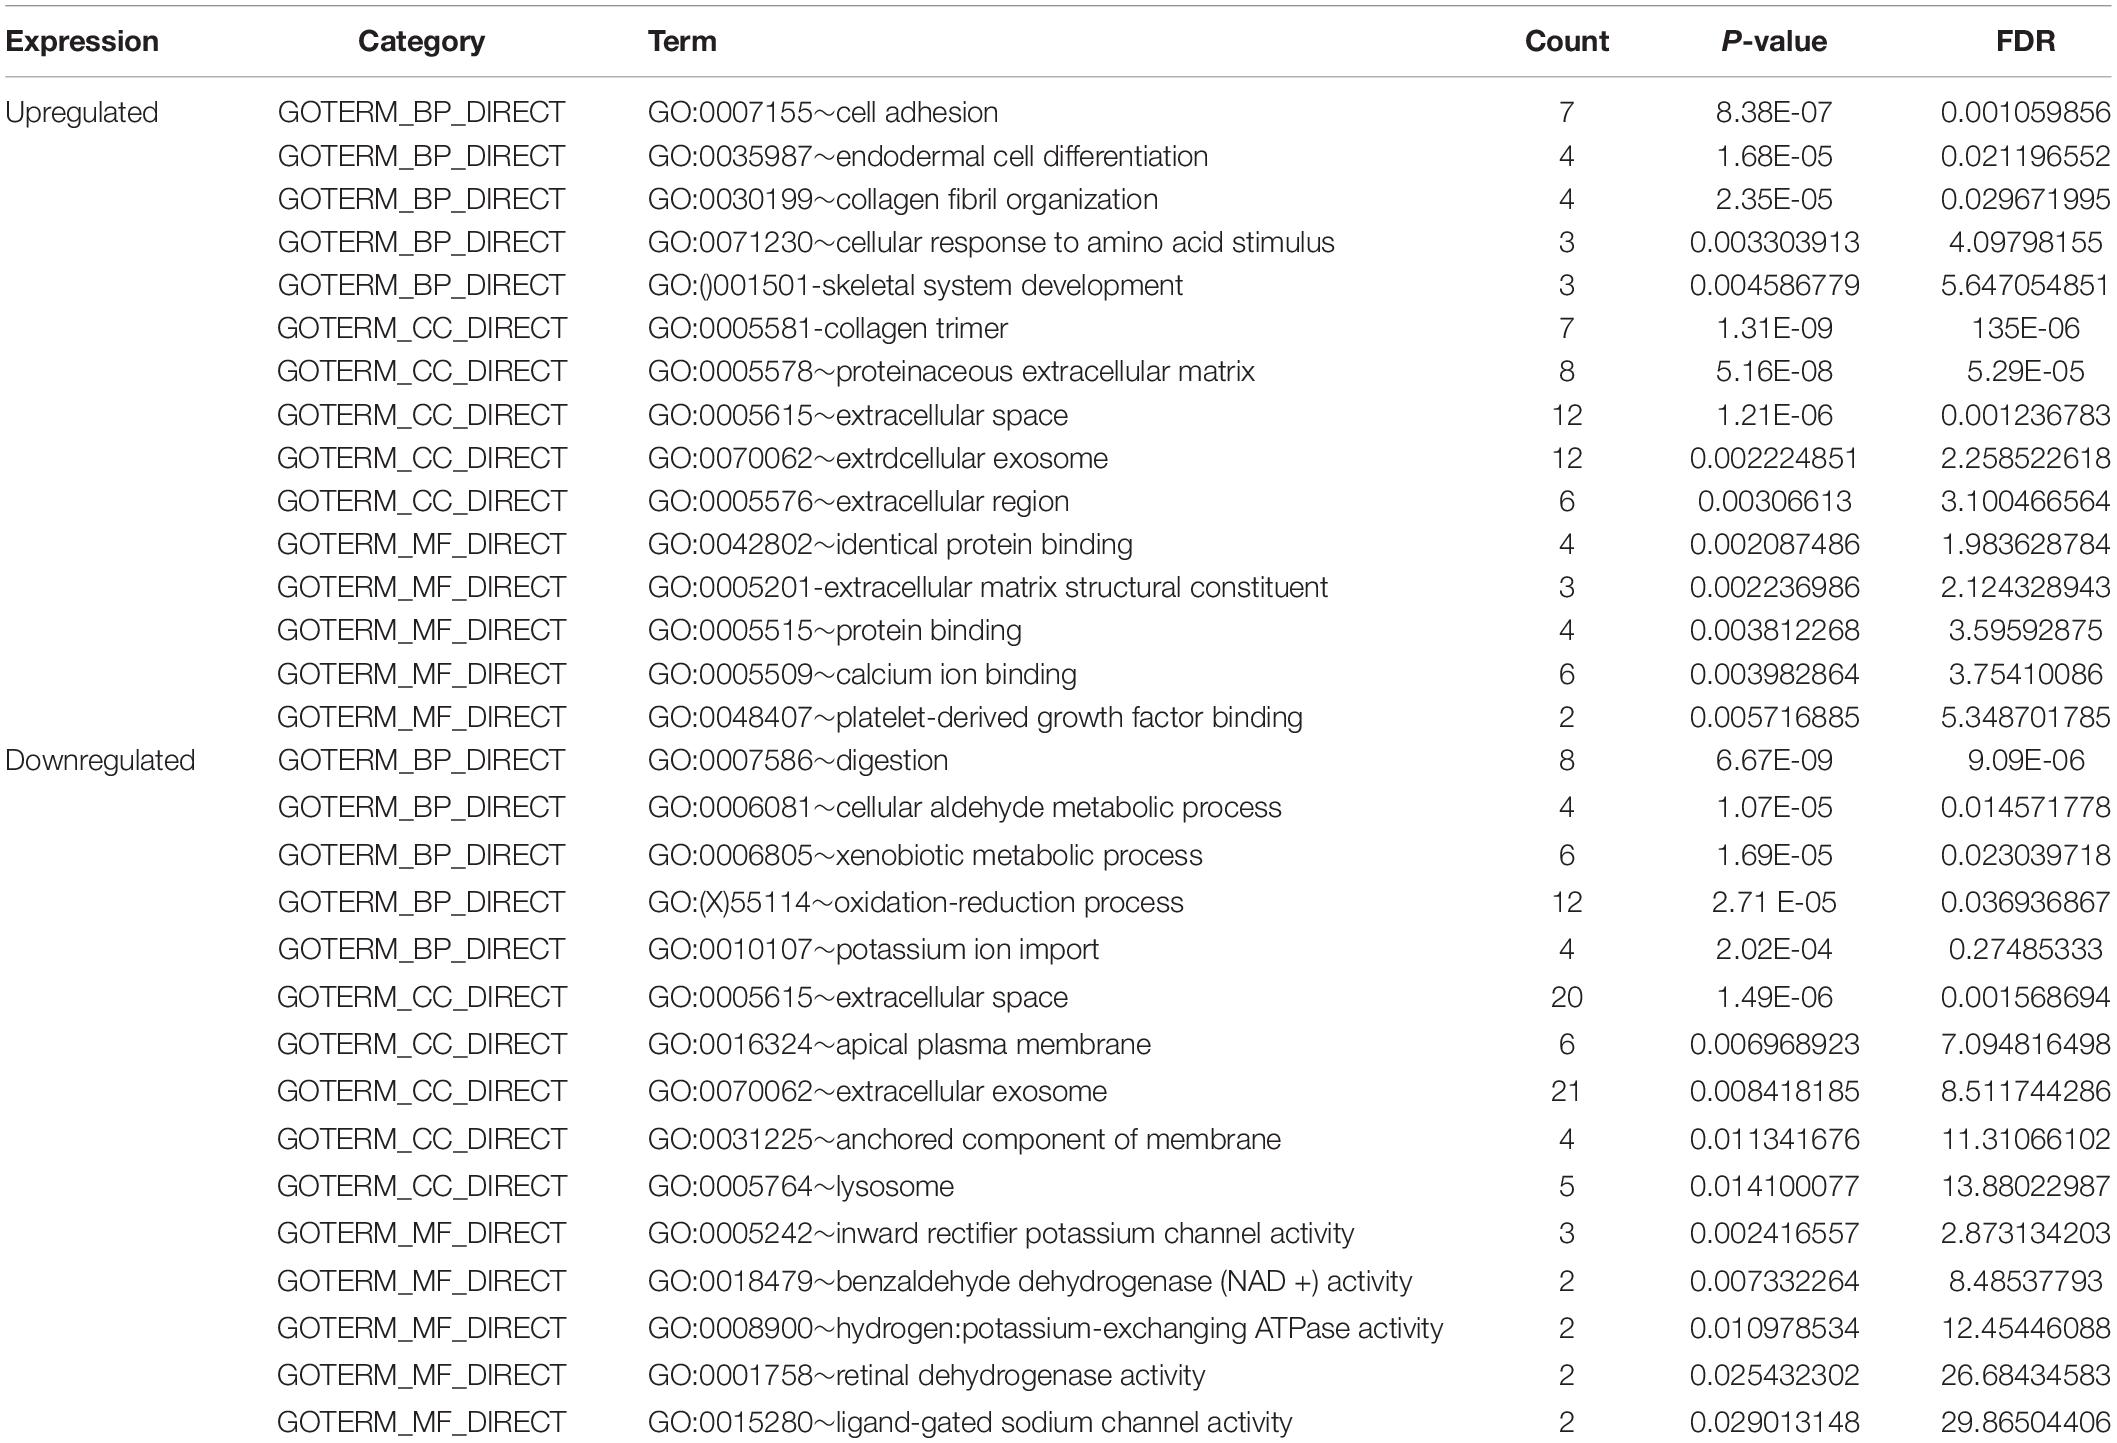
Table 3. Gene ontology analysis of differentially expressed genes in STAD.
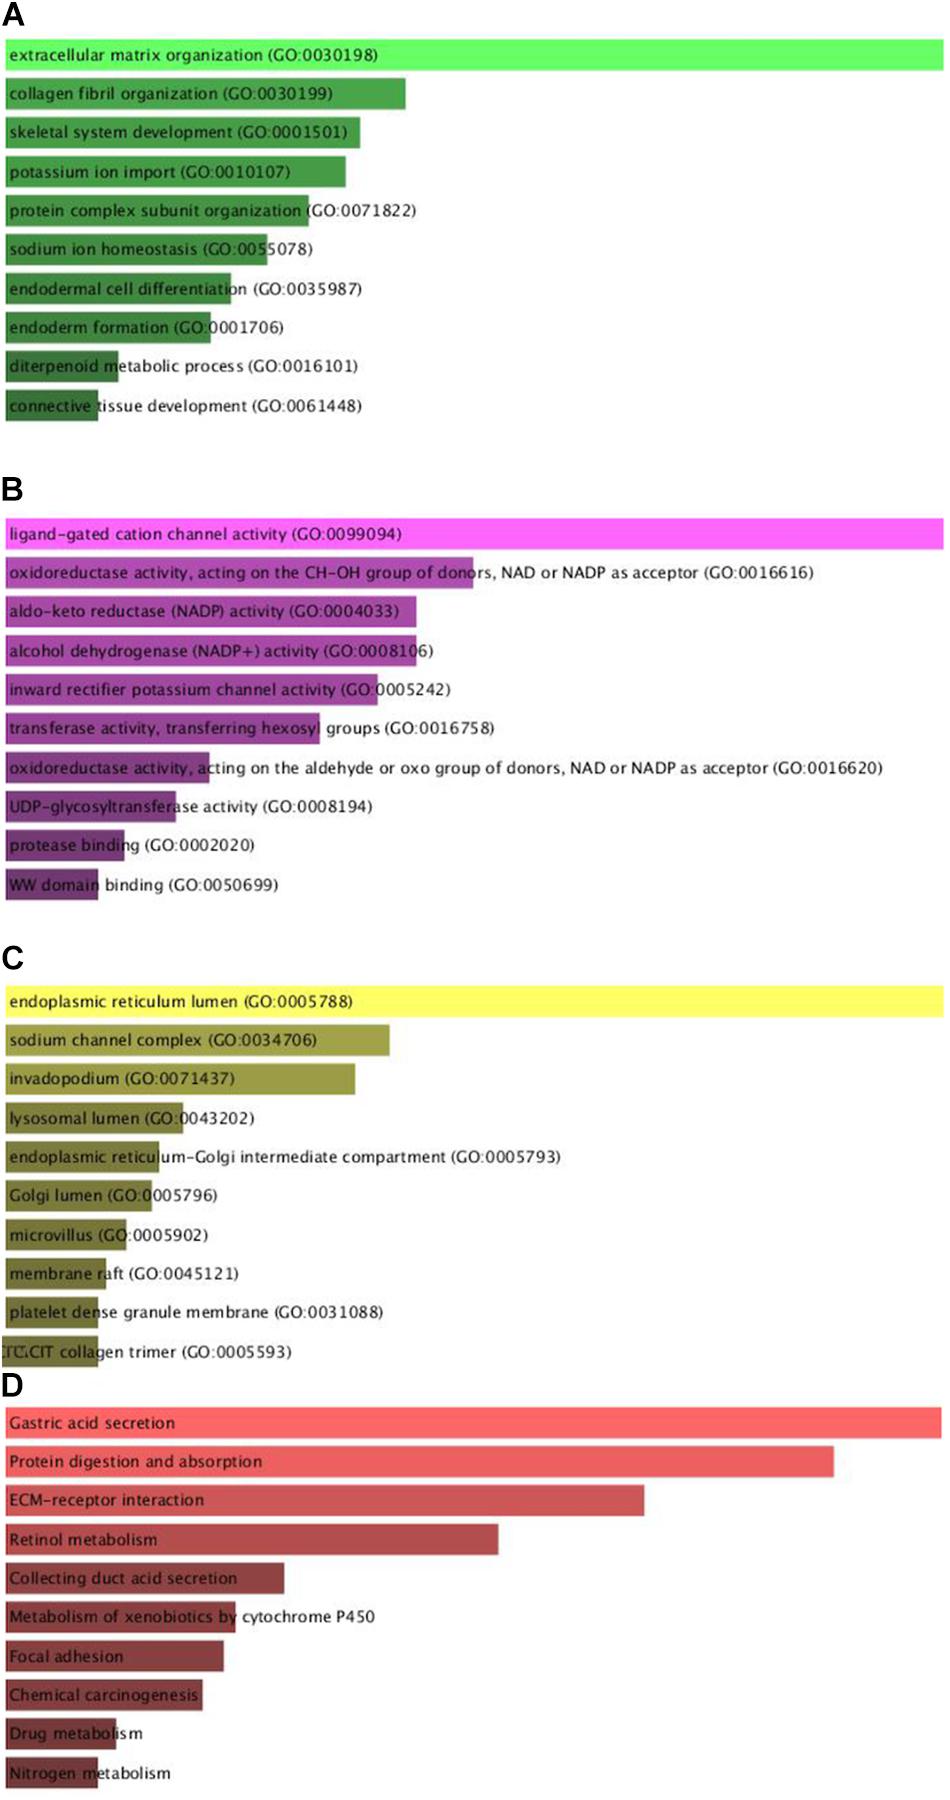
Figure 2. Gene Ontology enrichment and KEGG pathway analysis of the differentially expressed genes. (A–D) The numbers of enriched according to the (A) biological process, (B) molecular function, (C) cellular component categories, and (D) KEGG pathway analysis.
Furthermore, to distinguish the potential pathway of DEGs, we used KEGG pathway enrichment analyses. As indicated in Figure 2D and Table 4, the results demonstrated that upregulation of DEGs was mainly enriched in receptor interaction, protein digestion, and absorption and focal adhesion. The downregulated DEGs were involved in gastric acid secretion, retinol metabolism, and drug metabolism-cytochrome P450.
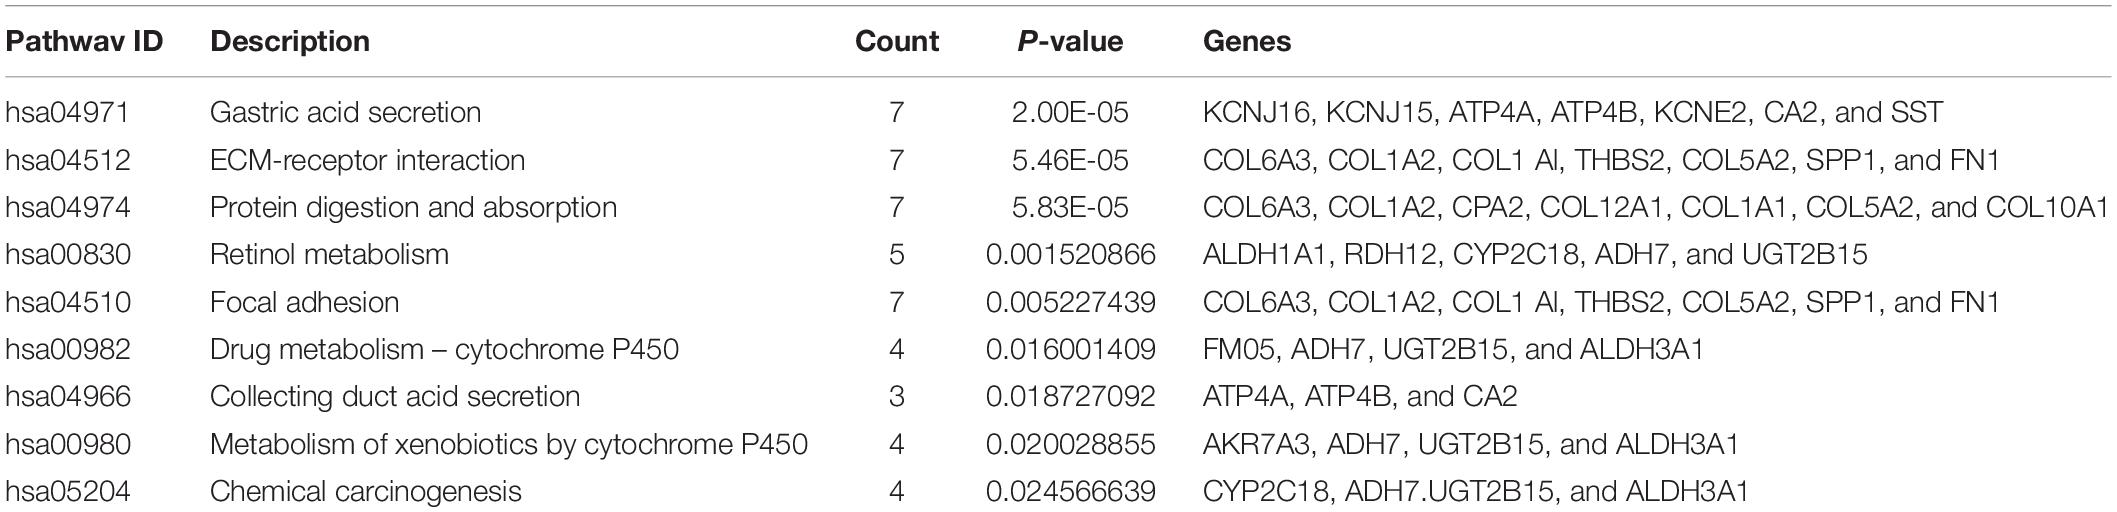
Table 4. KEGG pathway analysis of differentially expressed genes in STAD.
DEG PPI and Modular Analysis
In order to achieve core candidate gene and vital gene modules in STAD, PPI network analysis was performed. A total of 80 DEGs were screened into the PPI network complex, involving 80 nodes and 215 edges, and the remaining 34 DEGs were not screened (Figure 3A). According to Cytoscape, 14 central node genes were identified depending on the criteria of the edge degree ≥ 10 (Table 5 and Supplementary Table 1). According to the edge degree rank, the 10 core genes were COL1A1, COL1A2, FN1, COL5A2, BGN, COL6A3, COL12A1, THBS2, CDH11, and SERPINH1. Furthermore, we used the MCODE plug-in to screen the highest degree module in the PPI network. The results of the analysis revealed that the highest degree module contained 17 nodes and 92 edges (Figure 3B).
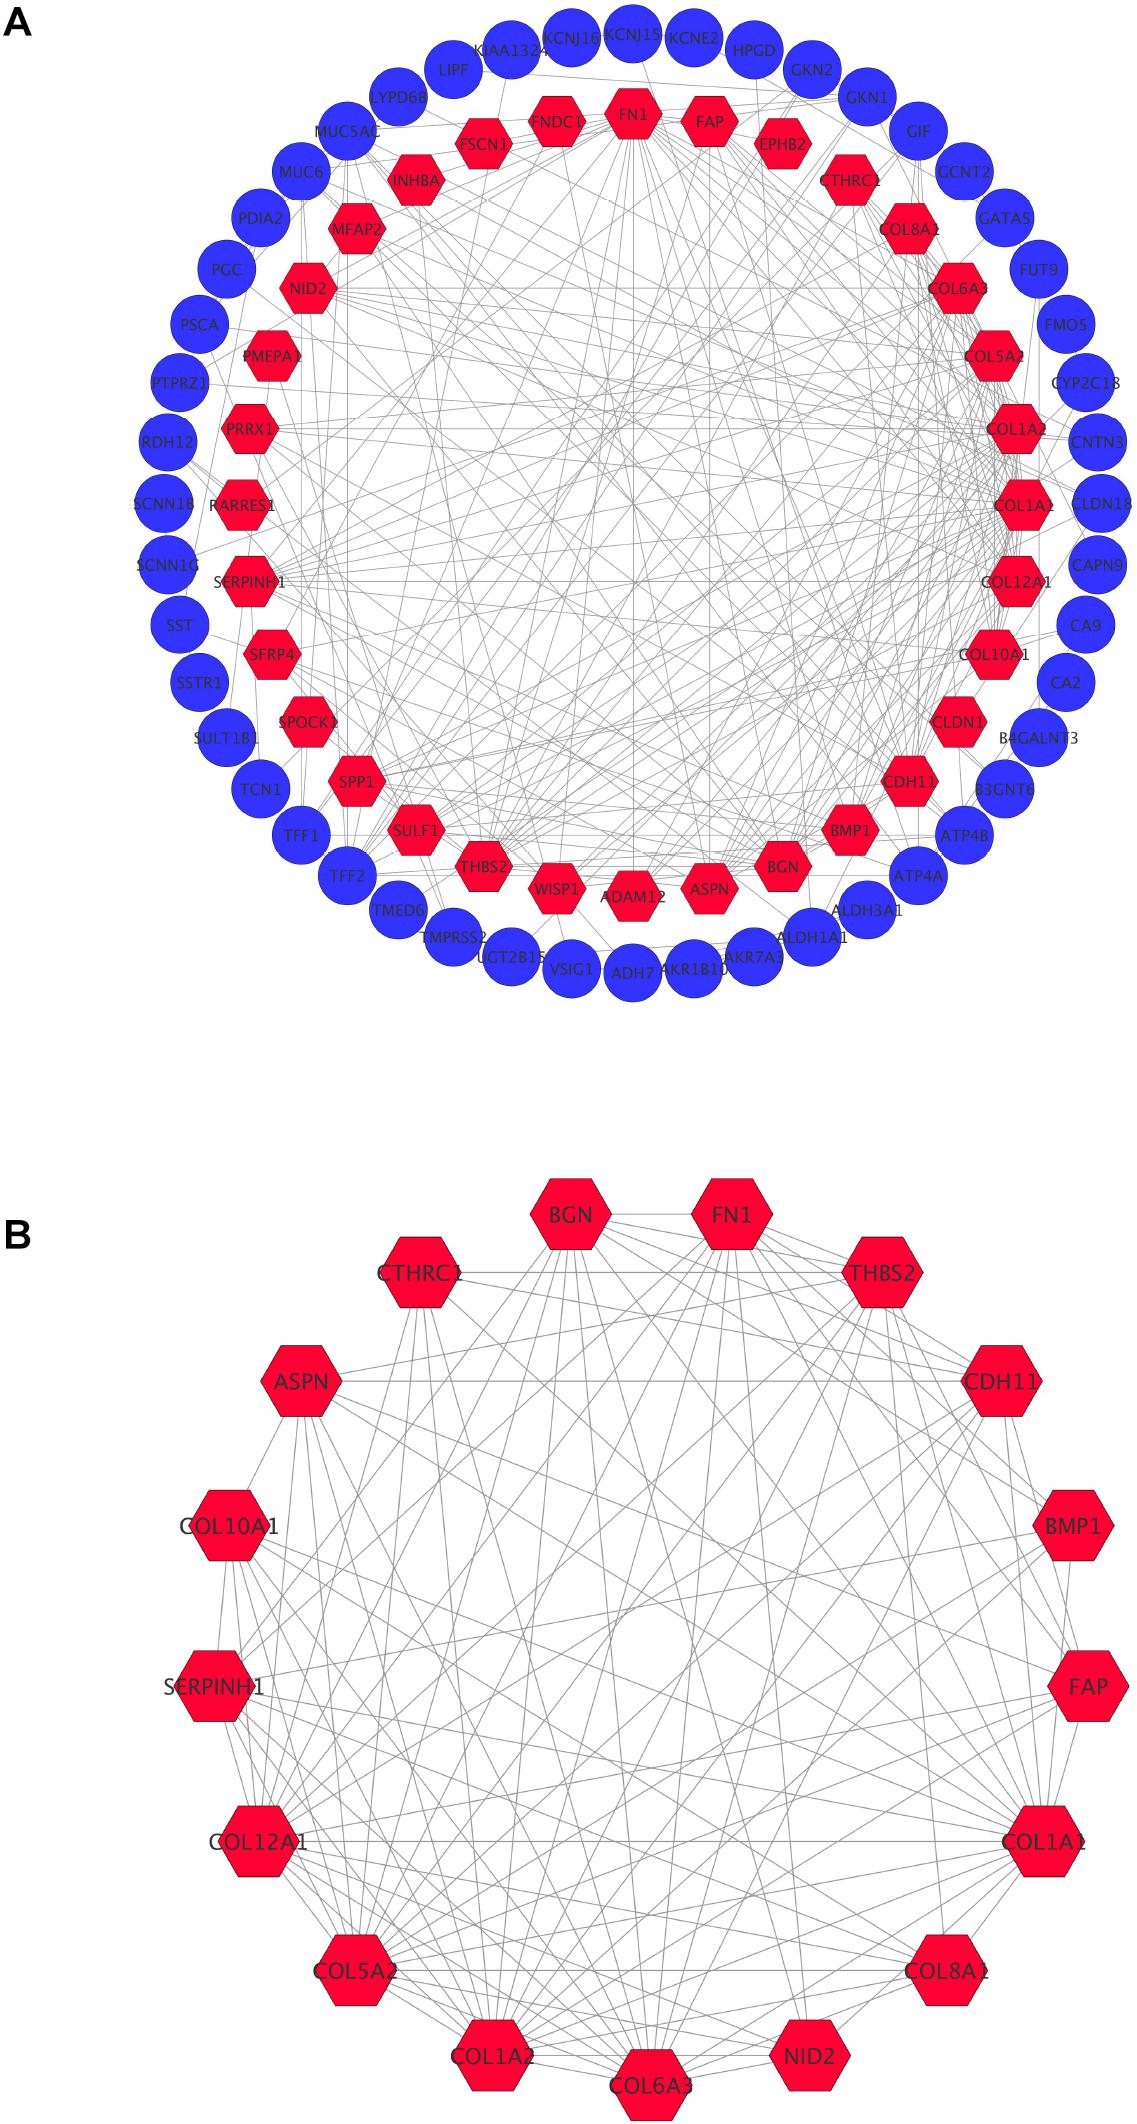
Figure 3. Common DEGs PPI network constructed by STRING online database and Module analysis. (A) There were a total of 80 DEGs in the DEGs PPI network complex. The nodes meant proteins, the edges meant the interaction the proteins, blue circule meant down-regulated DEGs, and red hexagons meant up-regulated DEGs. (B) Module analysis via Cytoscope software (degree cutoff = 2, node score cutoff = 0.2, k-core = 2, and max Depth = 100).
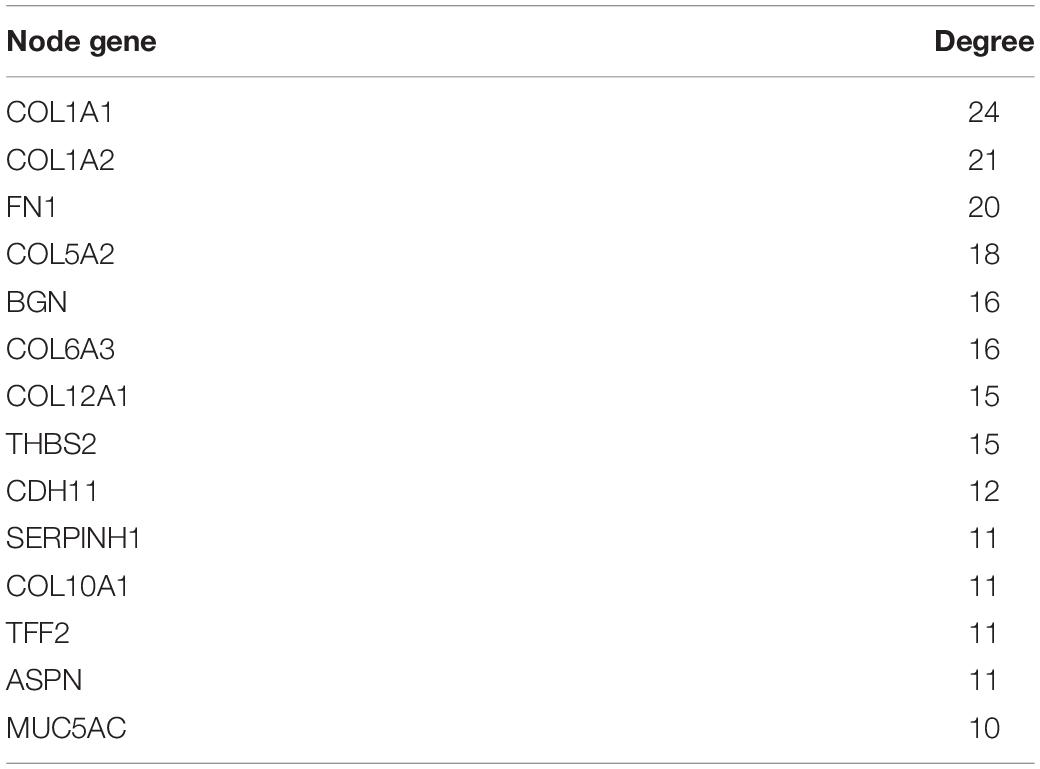
Table 5. The central node genes in the PPI network were identified based on the filtering degree ≥10.
Core Gene Analysis
To achieve the 10 core-gene survival data, we performed Kaplan-Meier curves to analyze the overall survival. The results indicated that all 10 core genes exhibited a prominent prognosis for STAD patients (P < 0.05, Figure 4). Subsequently, we analyzed the expression status of these genes using the GEPIA. The results indicated that all 10 core genes exhibited significantly higher expression in the STAD tissues compared with those of the normal tissues (P < 0.05, Figure 5). Subsequently, we re-analyzed all 10 core genes associated with poor survival in STAD by KEGG pathway enrichment. The results of the re-analysis indicated that six genes (COL6A3, COL1A2, COL1A1, THBS2, COL5A2, and FN1) were significantly enriched in the extracellular matrix-receptor (ECM-receptor) interaction (P < 0.05, Table 6 and Figure 6).
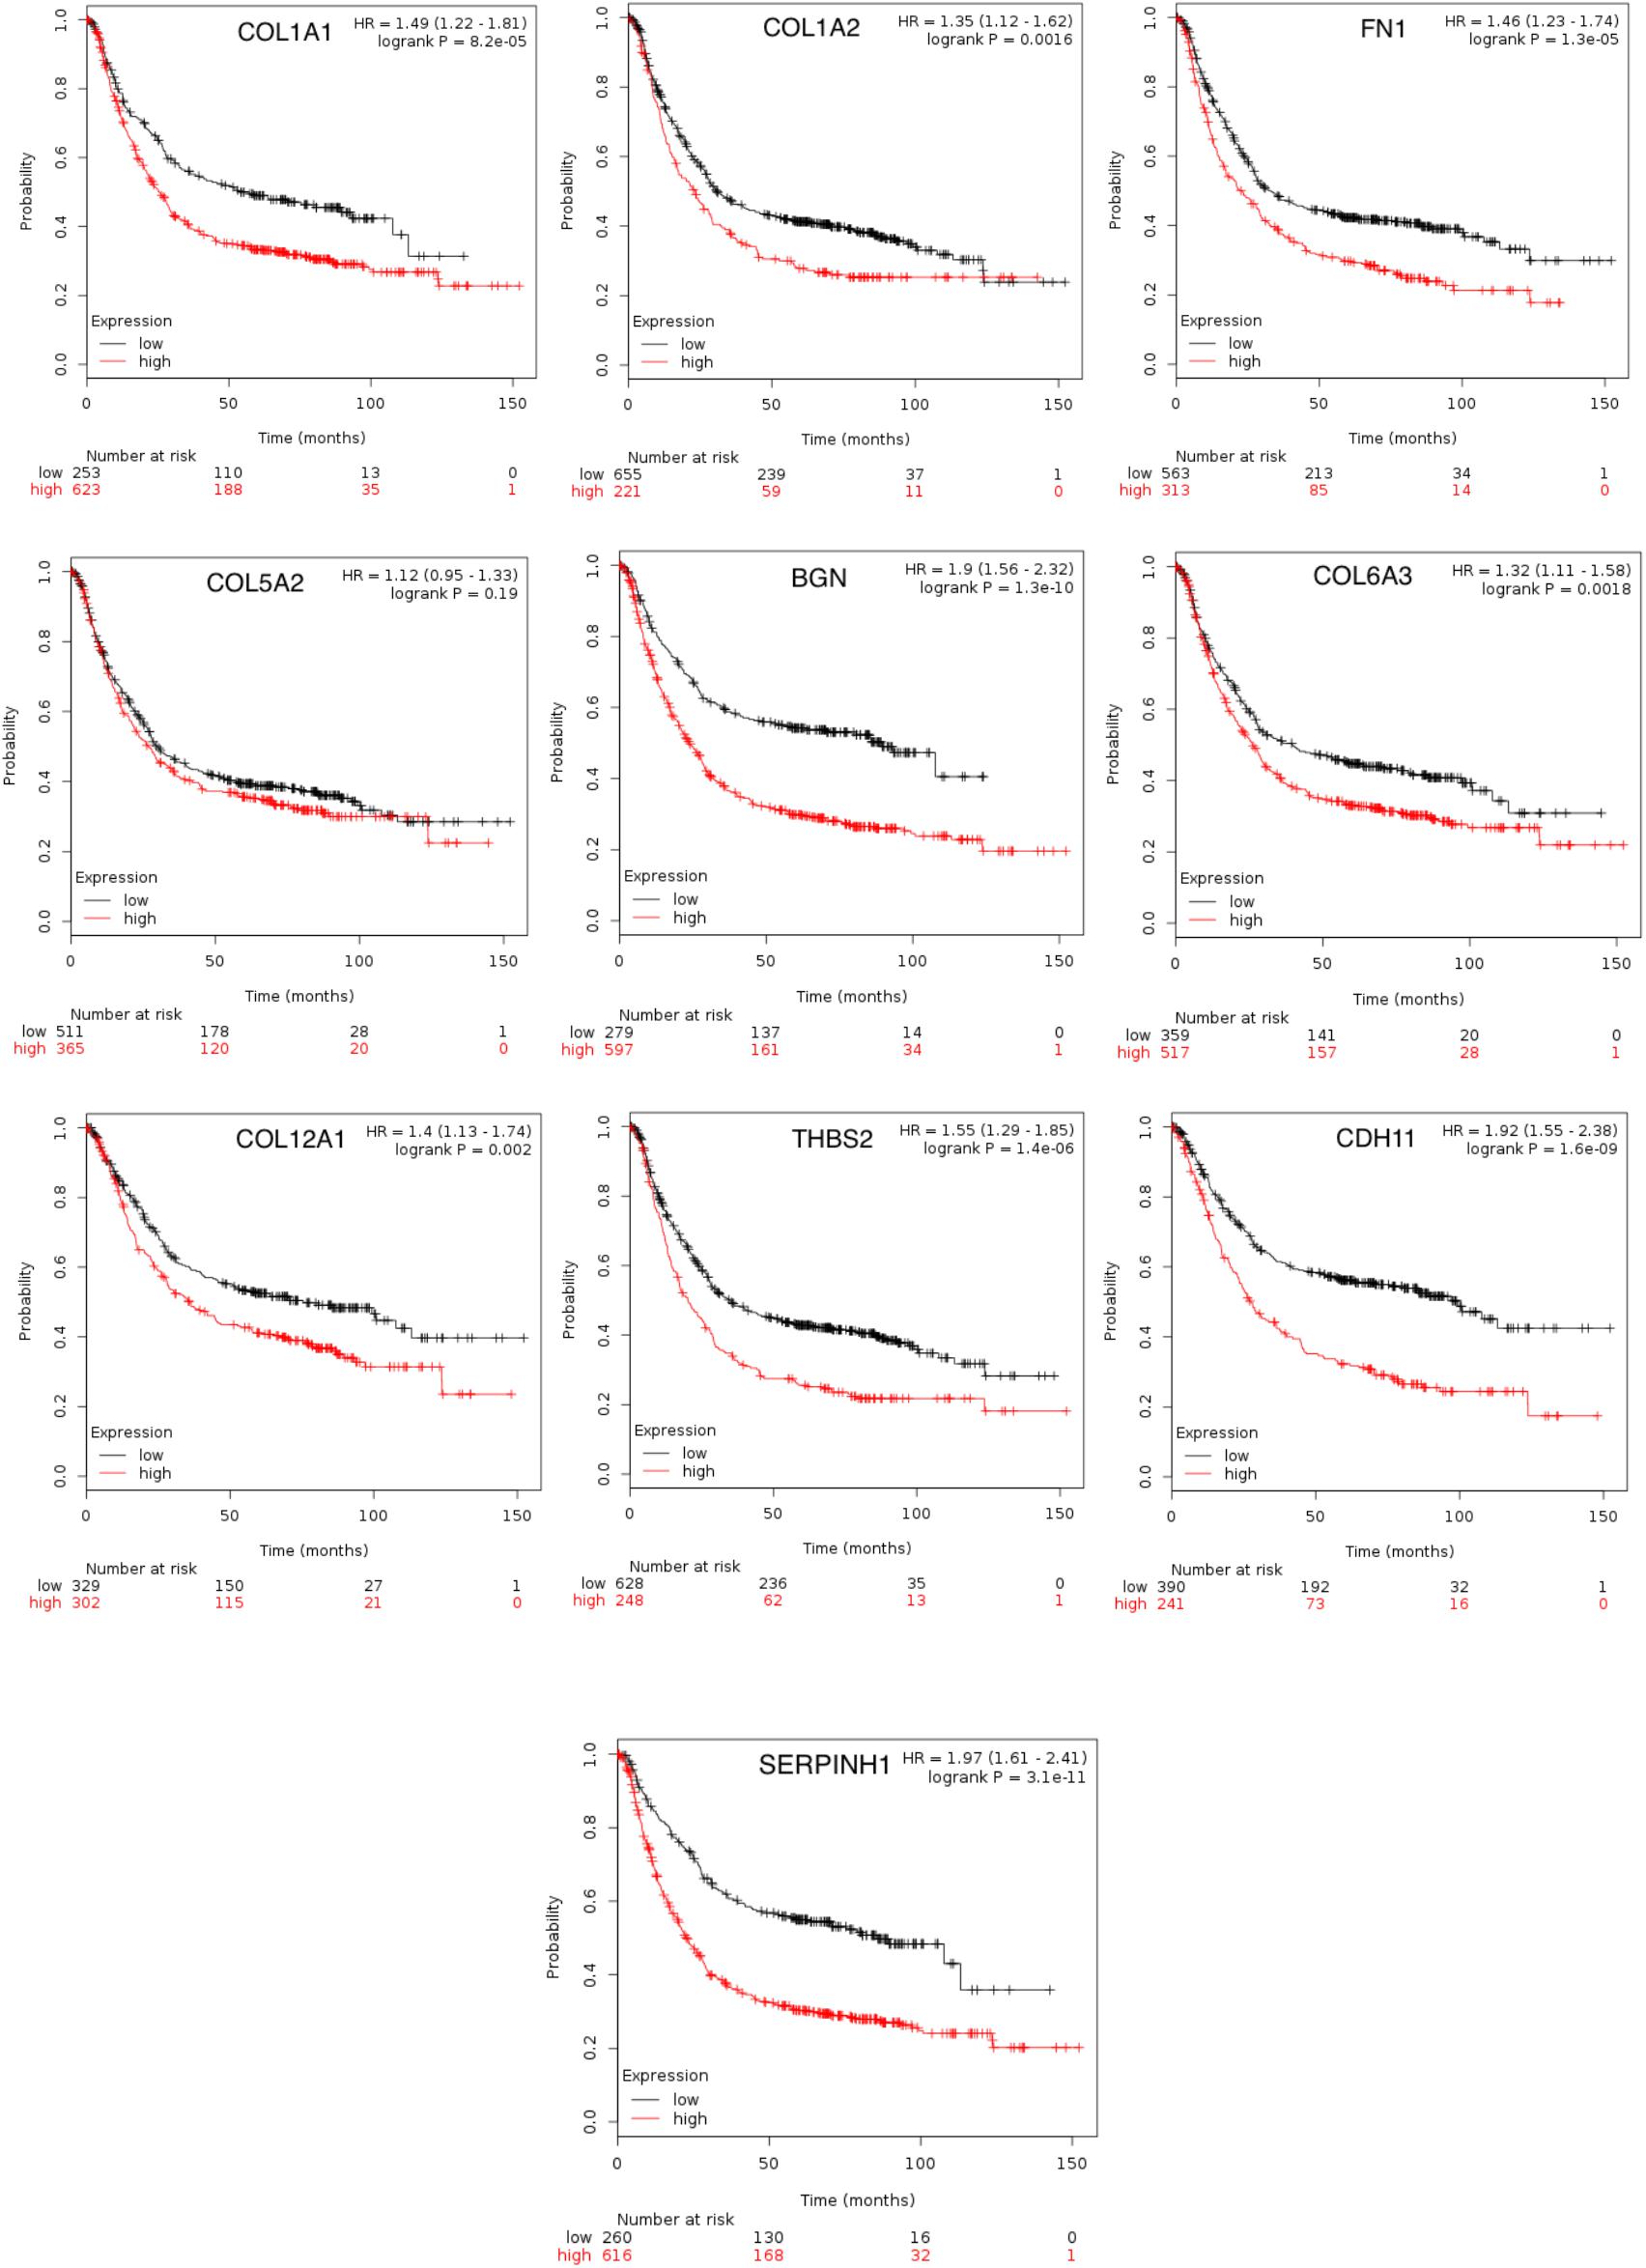
Figure 4. The prognostic information of the 10 core genes. Kaplan-Meier plotter online tools were used to identify the prognostic information of the 10 core genes and genes had a significantly worse survival rate (P < 0.05).
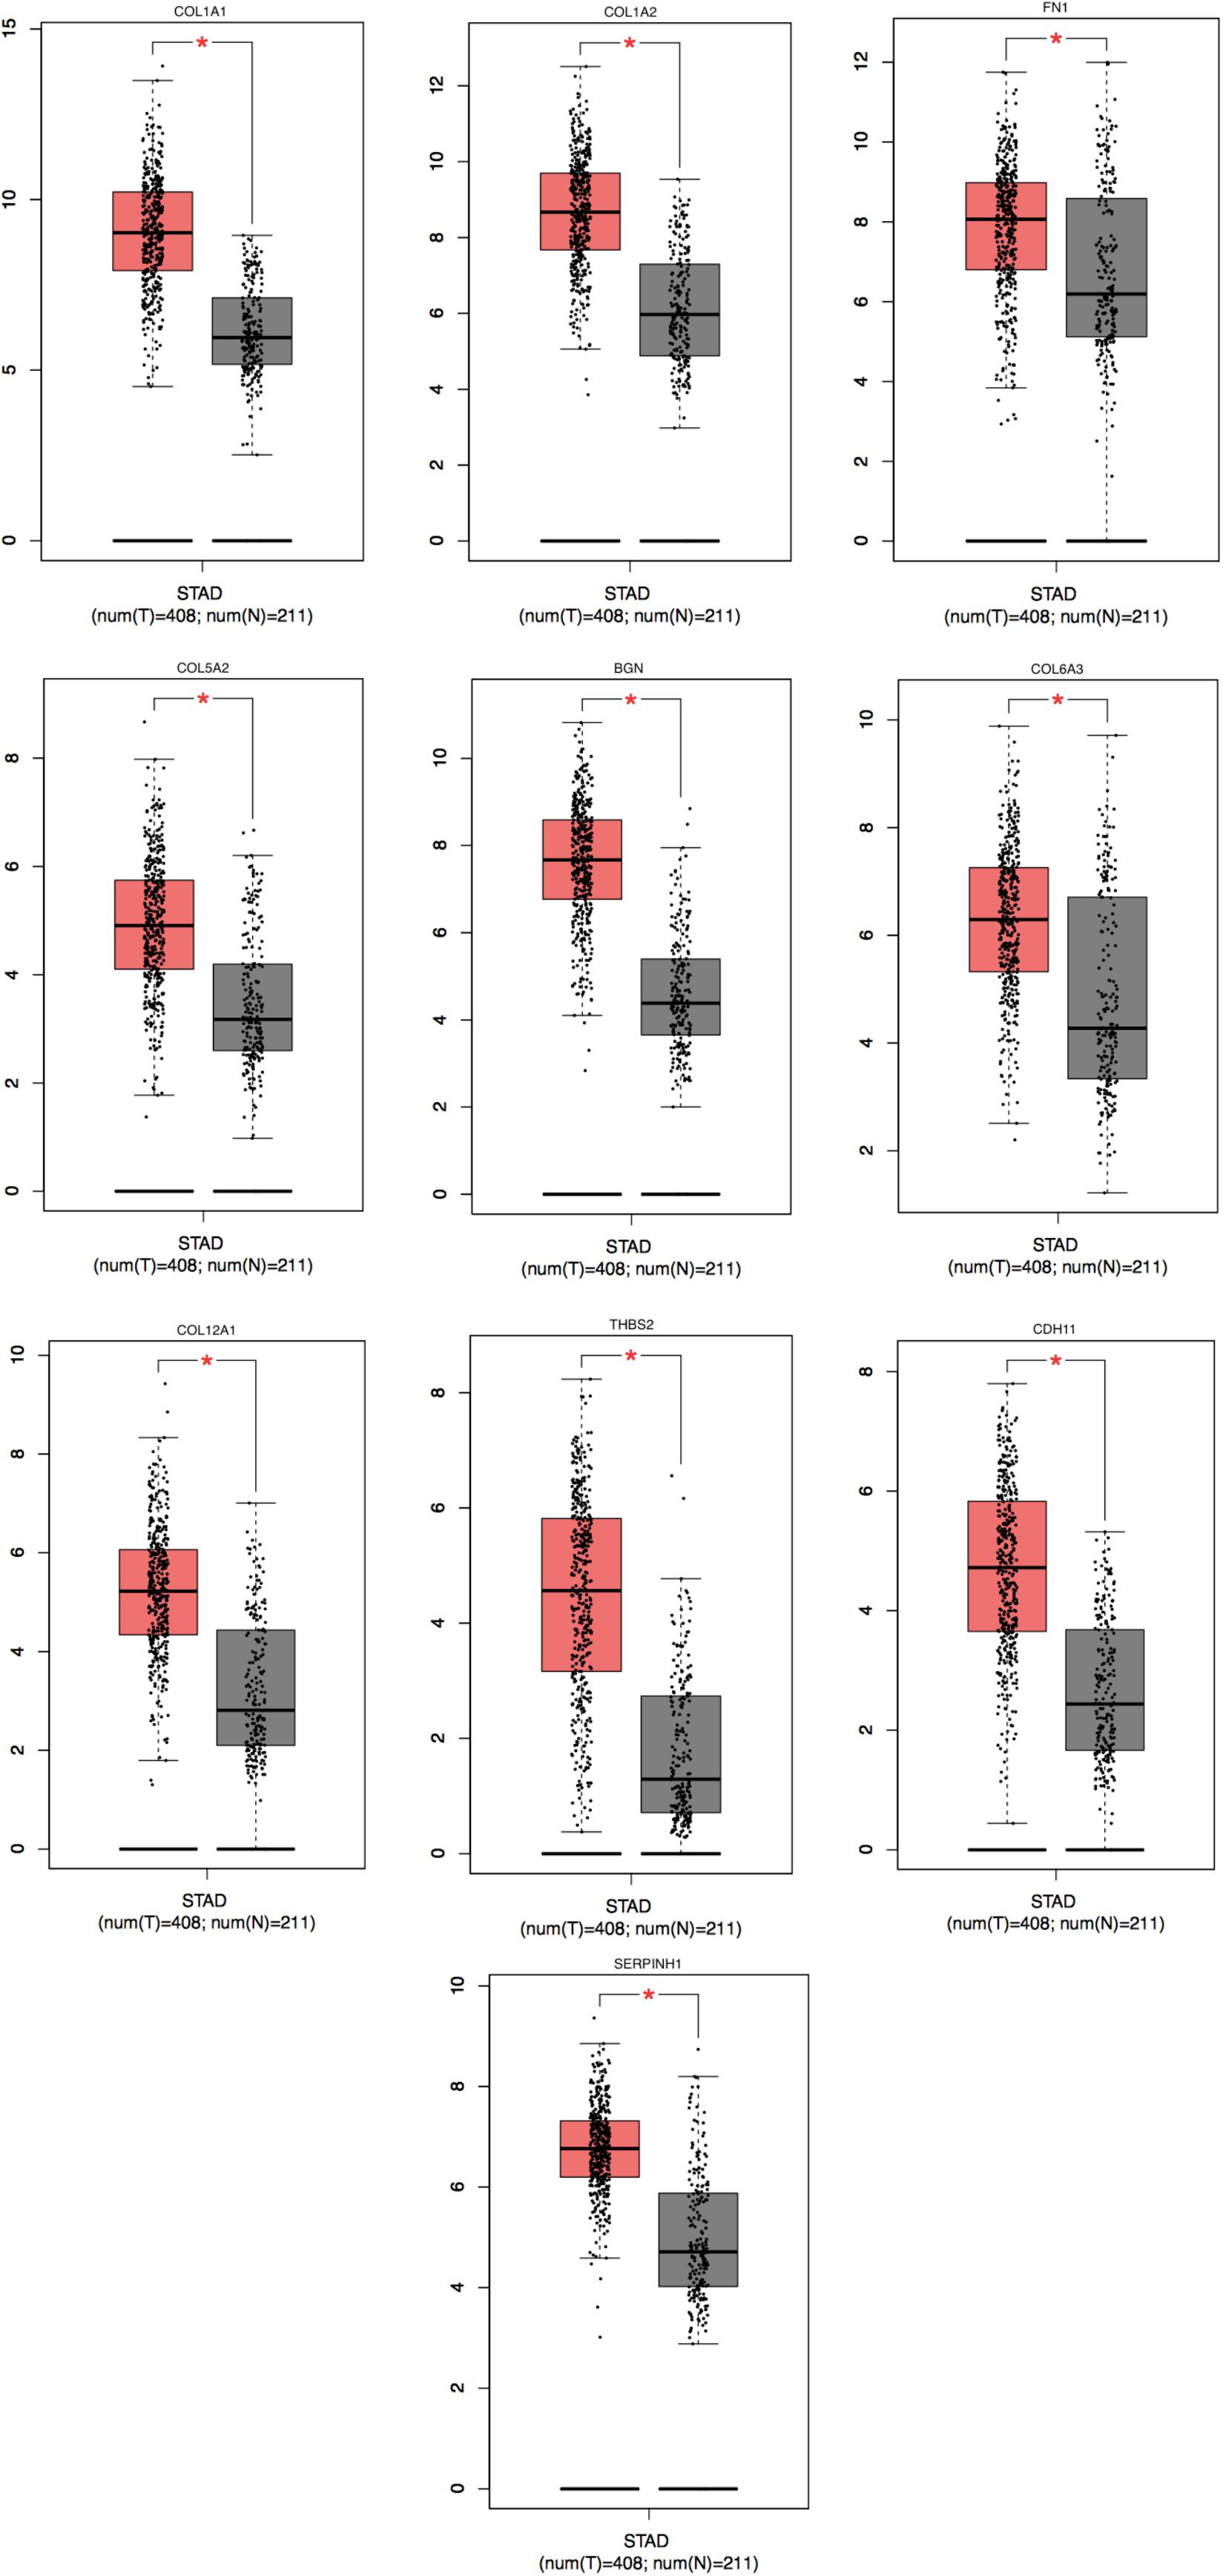
Figure 5. Significantly expressed 10 genes in STAD cancer patients compared to healthy people. To future identify the genes’ expression level between STAD cancer and normal people, 10 genes which were related with poor prognosis were analyzed by GEPIA website. A total of 10 genes significant expression level in STAD specimen compared to normal specimen (*P < 0.05). Red color means tumor tissues and gray color means normal tissues.

Table 6. Re-analysis of 10 selected genes via the KEGG pathway enrichment.
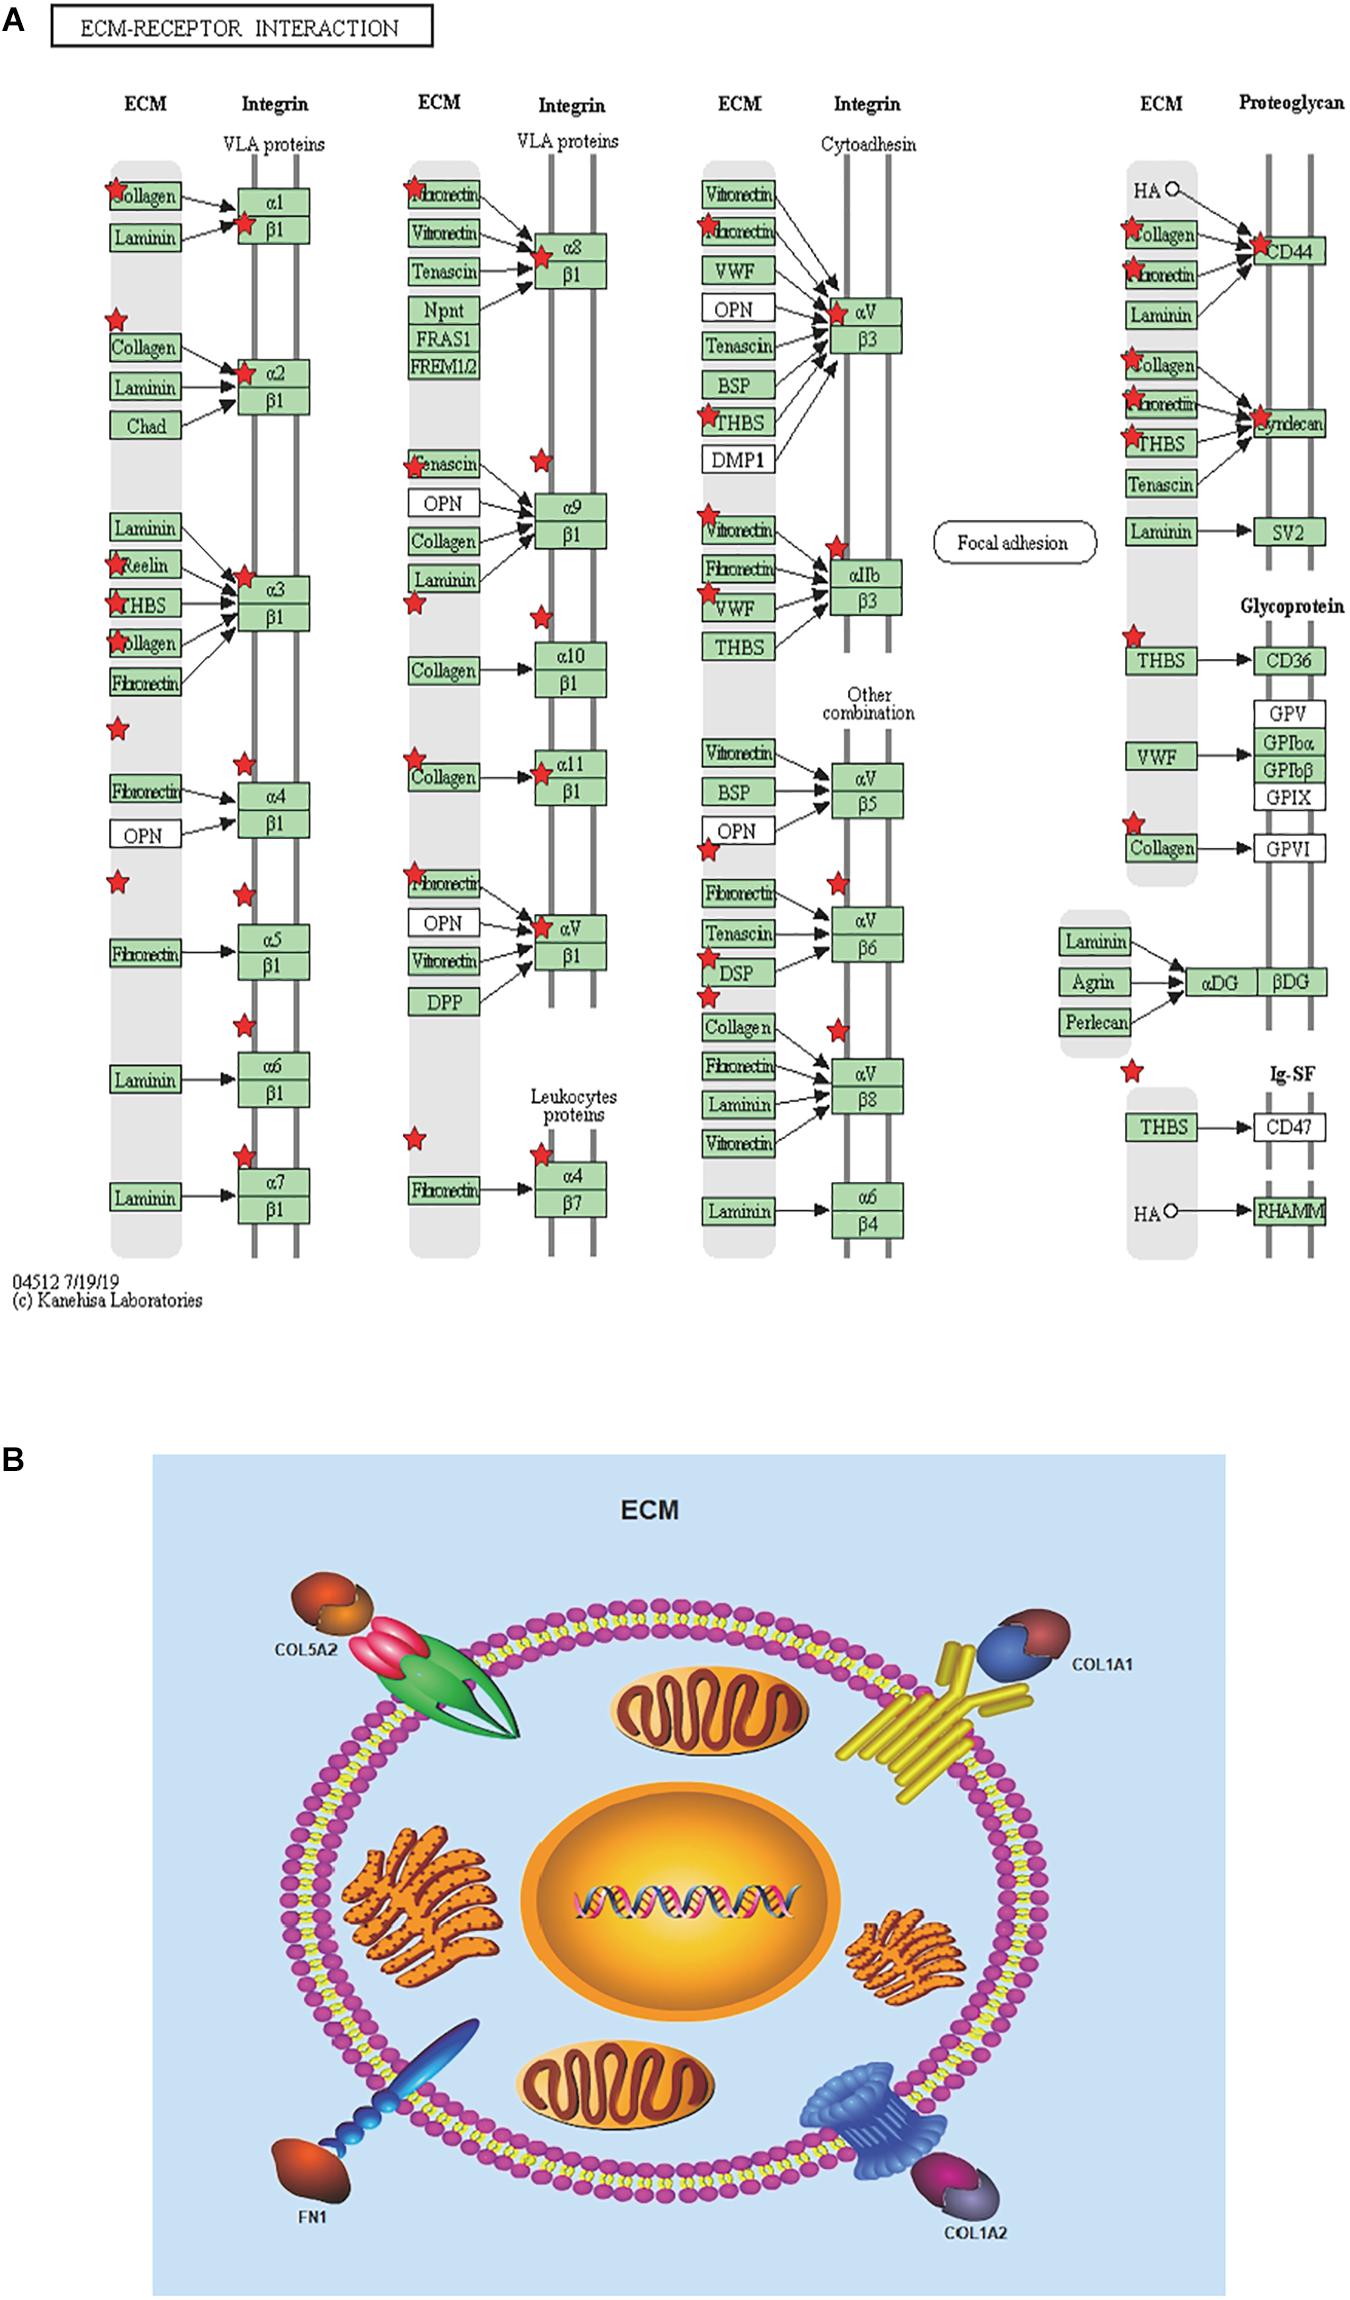
Figure 6. Re-analysis of 10 selected genes by KEGG pathway enrichment. (A) 10 high expressed genes in STAD tissues with poor prognosis were re-analyzed by KEGG pathway enrichment and they were significantly enriched in ECM-receptor interaction. List 10 genes are shown in red``*”. (B) Presumed patterns of changes in the ECM-receptor interaction pathway of the four most expressed genes.
Discussion
Stomach adenocarcinoma is one of the most frequently diagnosed cancers in the world with both high mortality and high metastatic capacity (Siegel et al., 2017). Certain genes have been shown to play an important role in STAD. It has been reported that CDH1 may be used in identifying families with high risk of cancer as well as aiding the design of chemopreventive programs that are focused at high-risk subgroups (van der Post et al., 2015). It is well known that the GSTM1-null phenotype can increase significantly the risk of STAD (Darazy et al., 2011; Qiu et al., 2011; García-González et al., 2012; Jing et al., 2012). In spite of a large number of studies examining STAD, its molecular mechanism has not been satisfactory explained due to the limited number of stable and effective markers. The main reason is that previous studies were too narrow. Therefore, multiple cohort types of research regarding effective molecular biomarkers are required for STAD prevention, diagnosis and treatment.
In the present study, the identification of more effective molecular biomarkers for STAD was performed by merging four profile datasets (GSE13911, GSE19826, GSE54129, and GSE65801). Bioinformatic analysis was performed and resulted in the identification of 193 STAD and 99ANT genes. Subsequently, the commonly identified 114 DEGs included 35 upregulated and 79 downregulated genes in STAD tissues compared to those noted in the non-tumor samples, which were identified by the Venn diagram software in the four datasets. For the purpose of an in-depth understanding of the DEG functional levels, we used the GO function and KEGG pathway to analyze these DEGs. Subsequently, PPI network analysis was used to identify these DEGs based on Cytoscape software and the online database STRING. A total of 80 DEGs were screened by the PPI network complex, involving 215 edges. The highest degree module was screened from the PPI by the MCODE plug-in. Eventually, 10 core DEGs were identified according to the edge degree rank in the PPI network complex and the results of the survival analysis demonstrated that the patients with aberrant expression of DEGs exhibited a significantly lower survival for STAD patients. In addition, we re-analyzed all 10 core genes with poor survival in STAD by KEGG pathway enrichment. The results of the re-analysis indicated that the six genes (COL6A3, COL1A2, COL1A1, THBS2, COL5A2, and FN1) were significantly enriched in the ECM-receptor interaction. Among these genes, COL1A1, COL1A2, FN1 and COL5A2 were considered as perspective effective targets that play prominent roles in the development and recurrence of the tumor, including STAD.
COL1A1 and COL1A2 are the genes, which encode the pro-alpha chains of type I collagen whose triple helix comprises two alpha 1 chains and one alpha 2 chain. It has been reported that the potential of the COL1A1 gene structure and intron variation for common bone-related diseases can be determined by comparative vertebrate evolutionary analyses of type I collagen (Stover and Verrelli, 2011). COL1A1 can be used as a new therapeutic marker and a target for hepatocellular carcinogenesis (Ma et al., 2019). Another study demonstrated that COL1A2 may affect proliferation, migration, and invasion of colorectal cancer cells (Yu et al., 2018). Omar Ret al., reported that COL1A2 affects cell migration of fibrosarcoma and chondrosarcoma by acting on TBX3 (Omar et al., 2019). Several studies have shown that COL1A1/2 plays a huge role in osteogenesis (Pollitt et al., 2006; Sato et al., 2016; Wang et al., 2019; Zhytnik et al., 2019). COL1A1 and COL1A2 have been shown to play an important prognostic role in STAD (Tamilzhalagan et al., 2017; Shi et al., 2019; Li J. et al., 2020). Recently Wang et al., reported that COL1A1 suppressed the invasion and migration of STAD cells by combining with miR-129-5p (Wang and Yu, 2018). Furthermore, COL1A2 was reported to suppress STAD cell invasion, and migration via regulation of the PI3k-Akt signaling pathway (Ao et al., 2018).
FN1, encodes fibronectin, a glycoprotein present in a soluble dimeric form in plasma and in a dimeric or multimeric form at the cell surface and in the extracellular matrix. Cai et al. demonstrated that the low expression of FN1 in colorectal cancer could significantly inhibit the growth and metastasis of tumor cells (Cai et al., 2018). Cadoff et al., demonstrated specific mechanistic insights into the cellular effects of a novel FN1 variant associated with a spondylometaphyseal dysplasia (Cadoff et al., 2018). Liu et al., indicated that the low expression of NEAT1 could affect the radioactive iodine resistance by the miR-101-3p/FN1/PI3K-AKT signaling pathway in papillary thyroid carcinoma cells (Liu et al., 2019). Gene expression database research demonstrated that FN1 could be used as a new marker of radiation resistance for head and neck cancer (Amundson and Smilenov, 2010; Zhan et al., 2018). In addition, FN1 is often detected in STAD tissues and cell lines and its abnormal expression is closely associated with the invasion and metastasis of STAD (Xu et al., 2014; Arita et al., 2016; Sun et al., 2020). Moreover, it has been reported that FN1 combined with microRNA-200c can inhibit the migration and invasion of STAD cells (Zhang et al., 2017).
COL5A2 encodes an alpha chain for one of the low abundance fibrillar collagens. Fibrillar collagen molecules are trimers that can be composed of one or more types of alpha chains. Yang et al., indicated that the decrease of COL5A2 expression could induce femoral head necrosis (Yang et al., 2018). Park et al., demonstrated that abnormal expression of COL5A2 may lead to new abnormalities in skin and adipose tissue, which can further lead to the occurrence of aortic aneurysms and dissections (Park et al., 2017). Park et al., demonstrated that homozygosity and heterozygosity for null COL5A2 alleles produced embryonic lethality and a novel classic Ehlers-Danlos syndrome-related phenotype (Park et al., 2015). A retrospective analysis of bladder cancer gene expression data presented that COL5A2 in patients with bladder cancer and ischemic heart disease may possess important clinical significance (Azuaje et al., 2013; Meng et al., 2018; Zeng et al., 2018). Moreover, COL5A2 was considered a potential molecular marker in STAD using bioinformatic analysis (Li J. et al., 2020; Li Z. et al., 2020). However, a limited number of reports have been conducted on the mechanism of COL5A2 in STAD.
In the present study, we identified candidate biomarkers that may play a distinct clinical significance of STAD. These newly discovered core genes could be regarded as potential biomarkers to further explore the molecular mechanism and the prognostic effects of STAD. However, the present study contains certain limitations, which can be listed as follows: (1) the present study requires additional experiments to complement the bioinformatic analysis; (2) the basic characteristics of the tumor, such as gender, age, sample size, tumor grade and stage and main misleading outcomes were not considered in the present study; (3) although 4 datasets were included, no definitive results could be obtained. Therefore, subsequent studies should be employed to confirm the association between these core genes and STAD.
Conclusion
In summary, the present study integrated four different microarray GEO datasets, and identified 114 DEGs, including 35 upregulated and 79 downregulated genes. Subsequently, we observed that four core genes (COL1A1, COL1A2, FN1, and COL5A2) exhibited the highest interaction degrees. The results of the analysis demonstrate that these four genes play prominent roles in the complicated and gradual process of STAD. However, the primary conclusions of the analysis require further confirmation by a series of clinical experiments. The multiple molecular mechanisms of these novel core genes in STAD may reveal novel therapeutic targets and biomarkers for STAD treatment.
Data Availability Statement
Publicly available datasets were analyzed in this study. This data can be found here: GEO database (https://www.ncbi.nlm.nih.gov/geo), accession numbers: GSE13911, GSE19826, GSE54129, and GSE65801.
Author Contributions
BY and TL designed the work and prepared the figures and tables. BY wrote the main manuscript text. MZ prepared the acquisition, analysis, and interpretation of data. Both authors contributed to the article and approved the submitted version.
Funding
This work was supported by the National Natural Science Foundation of China Grant No. 81671886.
Conflict of Interest
The authors declare that the research was conducted in the absence of any commercial or financial relationships that could be construed as a potential conflict of interest.
Supplementary Material
The Supplementary Material for this article can be found online at: https://www.frontiersin.org/articles/10.3389/fgene.2020.517362/full#supplementary-material
Footnotes
References
Alvarez-Escola, C., Venegas-Moreno, E. M., Garcia-Arnes, J. A., Blanco-Carrera, C., Marazuela-Azpiroz, M., Galvez-Moreno, M. A., et al. (2019). ACROSTART: a retrospective study of the time to achieve hormonal control with lanreotide Autogel treatment in Spanish patients with acromegaly. Endocrinol. Diabetes Nutr. 66, 320–329. doi: 10.1016/j.endinu.2018.12.004
Amundson, S. A., and Smilenov, L. B. (2010). Integration of biological knowledge and gene expression data for biomarker selection: FN1 as a potential predictor of radiation resistance in head and neck cancer. Cancer Biol. Ther. 10, 1252–1255. doi: 10.4161/cbt.10.12.13731
Ao, R., Guan, L., Wang, Y., and Wang, J. N. (2018). Silencing of COL1A2, COL6A3, and THBS2 inhibits gastric cancer cell proliferation, migration, and invasion while promoting apoptosis through the PI3k-Akt signaling pathway. J. Cell Biochem. 119, 4420–4434. doi: 10.1002/jcb.26524
Arita, T., Ichikawa, D., Konishi, H., Komatsu, S., Shiozaki, A., Ogino, S., et al. (2016). Tumor exosome-mediated promotion of adhesion to mesothelial cells in gastric cancer cells. Oncotarget 7, 56855–56863. doi: 10.18632/oncotarget.10869
Ashburner, M., Ball, C. A., Blake, J. A., Botstein, D., Butler, H., Cherry, J. M., et al. (2000). Gene ontology: tool for the unification of biology. The Gene Ontology Consortium. Nat. Genet. 25, 25–29. doi: 10.1038/75556
Azuaje, F., Zhang, L., Jeanty, C., Puhl, S. L., Rodius, S., and Wagner, D. R. (2013). Analysis of a gene co-expression network establishes robust association between Col5a2 and ischemic heart disease. BMC Med. Genomics 6:13. doi: 10.1186/1755-8794-6-13
Bray, F., Ferlay, J., Soerjomataram, I., Siegel, R. L., Torre, L. A., and Jemal, A. (2018). Global cancer statistics 2018: GLOBOCAN estimates of incidence and mortality worldwide for 36 cancers in 185 countries. CA Cancer J. Clin. 68, 394–424. doi: 10.3322/caac.21492
Cadoff, E. B., Sheffer, R., Wientroub, S., Ovadia, D., Meiner, V., and Schwarzbauer, J. E. (2018). Mechanistic insights into the cellular effects of a novel FN1 variant associated with a spondylometaphyseal dysplasia. Clin. Genet. 94, 429–437. doi: 10.1111/cge.13424
Cai, X., Liu, C., Zhang, T. N., Zhu, Y. W., Dong, X., and Xue, P. (2018). Down-regulation of FN1 inhibits colorectal carcinogenesis by suppressing proliferation, migration, and invasion. J. Cell Biochem. 119, 4717–4728. doi: 10.1002/jcb.26651
Chen, W., Sun, K., Zheng, R., Zeng, H., Zhang, S., Xia, C., et al. (2018). Cancer incidence and mortality in China, 2014. Chin. J. Cancer Res. 30, 1–12. doi: 10.21147/j.issn.1000-9604.2018.01.01
Chen, W., Zheng, R., Baade, P. D., Zhang, S., Zeng, H., Bray, F., et al. (2016). Cancer statistics in China, 2015. CA Cancer J. Clin. 66, 115–132. doi: 10.3322/caac.21338
Chu, A., Liu, J., Yuan, Y., and Gong, Y. (2019). Comprehensive analysis of aberrantly expressed ceRNA network in gastric cancer with and without H.pylori infection. J. Cancer 10, 853–863. doi: 10.7150/jca.27803
Darazy, M., Balbaa, M., Mugharbil, A., Saeed, H., Sidani, H., and Abdel-Razzak, Z. (2011). CYP1A1, CYP2E1, and GSTM1 gene polymorphisms and susceptibility to colorectal and gastric cancer among Lebanese. Genet. Test Mol. Biomarkers 15, 423–429. doi: 10.1089/gtmb.2010.0206
Davis, S., and Meltzer, P. S. (2007). GEOquery: a bridge between the gene expression omnibus (GEO) and bioconductor. Bioinformatics 23, 1846–1847. doi: 10.1093/bioinformatics/btm254
Gao, L., Han, H., Wang, H., Cao, L., and Feng, W. H. (2019). IL-10 knockdown with siRNA enhances the efficacy of doxorubicin chemotherapy in EBV-positive tumors by inducing lytic cycle via PI3K/p38 MAPK/NF-kB pathway. Cancer Lett. 462, 12–22. doi: 10.1016/j.canlet.2019.07.016
García-González, M. A., Quintero, E., Bujanda, L., Nicolás, D., Benito, R., Strunk, M., et al. (2012). Relevance of GSTM1, GSTT1, and GSTP1 gene polymorphisms to gastric cancer susceptibility and phenotype. Mutagenesis 27, 771–777. doi: 10.1093/mutage/ges049
Huang da, W., Sherman, B. T., and Lempicki, R. A. (2009). Systematic and integrative analysis of large gene lists using DAVID bioinformatics resources. Nat. Protoc. 4, 44–57. doi: 10.1038/nprot.2008.211
Jing, C., Huang, Z. J., Duan, Y. Q., Wang, P. H., Zhang, R., Luo, K. S., et al. (2012). Glulathione-S-transferases gene polymorphism in prediction of gastric cancer risk by smoking and Helicobacter pylori infection status. Asian Pac. J. Cancer Prev. 13, 3325–3328. doi: 10.7314/apjcp.2012.13.7.3325
Kanehisa, M., and Goto, S. (2000). KEGG: kyoto encyclopedia of genes and genomes. Nucleic Acids Res. 28, 27–30. doi: 10.1093/nar/28.1.27
Karimi, P., Islami, F., Anandasabapathy, S., Freedman, N. D., and Kamangar, F. (2014). Gastric cancer: descriptive epidemiology, risk factors, screening, and prevention. Cancer Epidemiol. Biomarkers Prev. 23, 700–713. doi: 10.1158/1055-9965.Epi-13-1057
Li, J., Wang, X., Wang, Y., and Yang, Q. (2020). H19 promotes the gastric carcinogenesis by sponging miR-29a-3p: evidence from lncRNA-miRNA-mRNA network analysis. Epigenomics 12, 989–1002. doi: 10.2217/epi-2020-0114
Li, Z., Liu, Z., Shao, Z., Li, C., Li, Y., Liu, Q., et al. (2020). Identifying multiple collagen gene family members as potential gastric cancer biomarkers using integrated bioinformatics analysis. PeerJ 8:e9123. doi: 10.7717/peerj.9123
Liu, C., Feng, Z., Chen, T., Lv, J., Liu, P., Jia, L., et al. (2019). Downregulation of NEAT1 reverses the radioactive iodine resistance of papillary thyroid carcinoma cell via miR-101-3p/FN1/PI3K-AKT signaling pathway. Cell Cycle 18, 167–203. doi: 10.1080/15384101.2018.1560203
Liu, Y., Sethi, N. S., Hinoue, T., Schneider, B. G., Cherniack, A. D., Sanchez-Vega, F., et al. (2018). Comparative molecular analysis of gastrointestinal adenocarcinomas. Cancer Cell 33, 721.e8–735.e8. doi: 10.1016/j.ccell.2018.03.010
Long, Z. W., Yu, H. M., Wang, Y. N., Liu, D., Chen, Y. Z., Zhao, Y. X., et al. (2015). Association of IL-17 polymorphisms with gastric cancer risk in Asian populations. World J. Gastroenterol. 21, 5707–5718. doi: 10.3748/wjg.v21.i18.5707
Ma, H. P., Chang, H. L., Bamodu, O. A., Yadav, V. K., Huang, T. Y., Wu, A. T. H., et al. (2019). Collagen 1A1 (COL1A1) is a reliable biomarker and putative therapeutic target for hepatocellular carcinogenesis and metastasis. Cancers 11:786. doi: 10.3390/cancers11060786
Meng, X., Liu, Y., and Liu, B. (2014). Glutathione S-transferase M1 null genotype meta-analysis on gastric cancer risk. Diagn. Pathol. 9:122. doi: 10.1186/1746-1596-9-122
Meng, X. Y., Shi, M. J., Zeng, Z. H., Chen, C., Liu, T. Z., Wu, Q. J., et al. (2018). The role of COL5A2 in patients with muscle-invasive bladder cancer: a bioinformatics analysis of public datasets involving 787 subjects and 29 cell lines. Front. Oncol. 8:659. doi: 10.3389/fonc.2018.00659
Omar, R., Cooper, A., Maranyane, H. M., Zerbini, L., and Prince, S. (2019). COL1A2 is a TBX3 target that mediates its impact on fibrosarcoma and chondrosarcoma cell migration. Cancer Lett. 459, 227–239. doi: 10.1016/j.canlet.2019.06.004
Park, A. C., Phan, N., Massoudi, D., Liu, Z., Kernien, J. F., Adams, S. M., et al. (2017). Deficits in Col5a2 expression result in novel skin and adipose abnormalities and predisposition to aortic aneurysms and dissections. Am. J. Pathol. 187, 2300–2311. doi: 10.1016/j.ajpath.2017.06.006
Park, A. C., Phillips, C. L., Pfeiffer, F. M., Roenneburg, D. A., Kernien, J. F., Adams, S. M., et al. (2015). Homozygosity and heterozygosity for null Col5a2 alleles produce embryonic lethality and a novel classic ehlers-danlos syndrome-related phenotype. Am. J. Pathol. 185, 2000–2011. doi: 10.1016/j.ajpath.2015.03.022
Pectasides, E., Stachler, M. D., Derks, S., Liu, Y., Maron, S., Islam, M., et al. (2018). Genomic heterogeneity as a barrier to precision medicine in gastroesophageal adenocarcinoma. Cancer Discov. 8, 37–48. doi: 10.1158/2159-8290.CD-17-0395
Petryszak, R., Burdett, T., Fiorelli, B., Fonseca, N. A., Gonzalez-Porta, M., Hastings, E., et al. (2014). Expression Atlas update–a database of gene and transcript expression from microarray- and sequencing-based functional genomics experiments. Nucleic Acids Res. 42, D926–D932. doi: 10.1093/nar/gkt1270
Pollitt, R., McMahon, R., Nunn, J., Bamford, R., Afifi, A., Bishop, N., et al. (2006). Mutation analysis of COL1A1 and COL1A2 in patients diagnosed with osteogenesis imperfecta type I-IV. Hum. Mutat. 27:716. doi: 10.1002/humu.9430
Qiu, L. X., Wang, K., Lv, F. F., Chen, Z. Y., Liu, X., Zheng, C. L., et al. (2011). GSTM1 null allele is a risk factor for gastric cancer development in Asians. Cytokine 55, 122–125. doi: 10.1016/j.cyto.2011.03.004
Sato, A., Ouellet, J., Muneta, T., Glorieux, F. H., and Rauch, F. (2016). Scoliosis in osteogenesis imperfecta caused by COL1A1/COL1A2 mutations – genotype-phenotype correlations and effect of bisphosphonate treatment. Bone 86, 53–57. doi: 10.1016/j.bone.2016.02.018
Shannon, P., Markiel, A., Ozier, O., Baliga, N. S., Wang, J. T., Ramage, D., et al. (2003). Cytoscape: a software environment for integrated models of biomolecular interaction networks. Genome Res. 13, 2498–2504. doi: 10.1101/gr.1239303
Shi, Y., Duan, Z., Zhang, X., Zhang, X., Wang, G., and Li, F. (2019). Down-regulation of the let-7i facilitates gastric cancer invasion and metastasis by targeting COL1A1. Protein Cell 10, 143–148. doi: 10.1007/s13238-018-0550-7
Siegel, R. L., Miller, K. D., and Jemal, A. (2017). Cancer statistics, 2017. CA Cancer J. Clin. 67, 7–30. doi: 10.3322/caac.21387
Stover, D. A., and Verrelli, B. C. (2011). Comparative vertebrate evolutionary analyses of type I collagen: potential of COL1a1 gene structure and intron variation for common bone-related diseases. Mol. Biol. Evol. 28, 533–542. doi: 10.1093/molbev/msq221
Sun, Y., Zhao, C., Ye, Y., Wang, Z., He, Y., Li, Y., et al. (2020). High expression of fibronectin 1 indicates poor prognosis in gastric cancer. Oncol. Lett. 19, 93–102. doi: 10.3892/ol.2019.11088
Szklarczyk, D., Franceschini, A., Wyder, S., Forslund, K., Heller, D., Huerta-Cepas, J., et al. (2015). STRING v10: protein-protein interaction networks, integrated over the tree of life. Nucleic Acids Res. 43, D447–D452. doi: 10.1093/nar/gku1003
Tamilzhalagan, S., Rathinam, D., and Ganesan, K. (2017). Amplified 7q21-22 gene MCM7 and its intronic miR-25 suppress COL1A2 associated genes to sustain intestinal gastric cancer features. Mol. Carcinog 56, 1590–1602. doi: 10.1002/mc.22614
Tang, Z., Li, C., Kang, B., Gao, G., Li, C., and Zhang, Z. (2017). GEPIA: a web server for cancer and normal gene expression profiling and interactive analyses. Nucleic Acids Res. 45, W98–W102. doi: 10.1093/nar/gkx247
van der Post, R. S., Vogelaar, I. P., Carneiro, F., Guilford, P., Huntsman, D., Hoogerbrugge, N., et al. (2015). Hereditary diffuse gastric cancer: updated clinical guidelines with an emphasis on germline CDH1 mutation carriers. J. Med. Genet. 52, 361–374. doi: 10.1136/jmedgenet-2015-103094
Vogelstein, B., Papadopoulos, N., Velculescu, V. E., Zhou, S., Diaz, L. A. Jr., and Kinzler, K. W. (2013). Cancer genome landscapes. Science 339, 1546–1558. doi: 10.1126/science.1235122
Wang, D., Zhang, M., Guan, H., and Wang, X. (2019). Osteogenesis imperfecta due to combined heterozygous mutations in both COL1A1 and COL1A2, coexisting with pituitary stalk interruption syndrome. Front. Endocrinol. 10:193. doi: 10.3389/fendo.2019.00193
Wang, Q., and Yu, J. (2018). MiR-129-5p suppresses gastric cancer cell invasion and proliferation by inhibiting COL1A1. Biochem. Cell Biol. 96, 19–25. doi: 10.1139/bcb-2016-0254
Xu, T. P., Huang, M. D., Xia, R., Liu, X. X., Sun, M., Yin, L., et al. (2014). Decreased expression of the long non-coding RNA FENDRR is associated with poor prognosis in gastric cancer and FENDRR regulates gastric cancer c cell metastasis by affecting fibronectin1 expression. J. Hematol. Oncol. 7:63. doi: 10.1186/s13045-014-0063-7
Yang, F., Luo, P., Ding, H., Zhang, C., and Zhu, Z. (2018). Collagen type V a2 (COL5A2) is decreased in steroid-induced necrosis of the femoral head. Am. J. Transl. Res. 10, 2469–2479.
Yu, Y., Liu, D., Liu, Z., Li, S., Ge, Y., Sun, W., et al. (2018). The inhibitory effects of COL1A2 on colorectal cancer cell proliferation, migration, and invasion. J. Cancer 9, 2953–2962. doi: 10.7150/jca.25542
Zeng, X. T., Liu, X. P., Liu, T. Z., and Wang, X. H. (2018). The clinical significance of COL5A2 in patients with bladder cancer: a retrospective analysis of bladder cancer gene expression data. Medicine 97:e0091. doi: 10.1097/MD.0000000000010091
Zhan, S., Li, J., Wang, T., and Ge, W. (2018). Quantitative proteomics analysis of sporadic medullary thyroid cancer reveals FN1 as a potential novel candidate prognostic biomarker. Oncologist 23, 1415–1425. doi: 10.1634/theoncologist.2017-0399
Zhang, H., Sun, Z., Li, Y., Fan, D., and Jiang, H. (2017). MicroRNA-200c binding to FN1 suppresses the proliferation, migration and invasion of gastric cancer cells. Biomed. Pharmacother. 88, 285–292. doi: 10.1016/j.biopha.2017.01.023
Keywords: stomach adenocarcinoma, gene profiling, biomarker, differentially expressed genes, bioinformatical analysis
Citation: Yang B, Zhang MJ and Luo TH (2020) Identification of Potential Core Genes Associated With the Progression of Stomach Adenocarcinoma Using Bioinformatic Analysis. Front. Genet. 11:517362. doi: 10.3389/fgene.2020.517362
Received: 04 December 2019; Accepted: 28 September 2020;
Published: 22 October 2020.
Edited by:
Mourad Assidi, King Abdulaziz University, Saudi ArabiaReviewed by:
Sajjad Karim, King Abdulaziz University, Saudi ArabiaAbdelfatteh E. L. Omri, King Abdulaziz University, Saudi Arabia
Copyright © 2020 Yang, Zhang and Luo. This is an open-access article distributed under the terms of the Creative Commons Attribution License (CC BY). The use, distribution or reproduction in other forums is permitted, provided the original author(s) and the copyright owner(s) are credited and that the original publication in this journal is cited, in accordance with accepted academic practice. No use, distribution or reproduction is permitted which does not comply with these terms.
*Correspondence: Tianhang Luo, bHVvdGlhbmgxQDE2My5jb20=
†These authors have contributed equally to this work