 Li Weng1†
 Aiwu Mao
- 1Department of Intervention, Tongren Hospital, Shanghai Jiao Tong University School of Medicine, Shanghai, China
- 2Department of Digestive Medicine, Nanjing Drum Tower Hospital, Nanjing University Medical School, Nanjing, China
This study was conducted to explore the potential genes and proteins associated with esophagus benign hyperplasia induced by esophageal stents. Five patients with esophageal cancer subjected to esophageal stent placement were enrolled in this study. Long non-coding RNA (lncRNA) sequencing and tandem mass tag quantitative proteomics analysis were performed by using the collected hyperplastic samples and adjacent non-hyperplastic tissues. Differentially expressed (DE) RNAs and proteins were analyzed, followed by functional enrichment analysis, protein-protein interaction (PPI) network analysis, and competitive endogenous RNA (ceRNA) network construction. Venn analysis was performed to extract the overlaps between DE mRNAs and DE proteins and the expression correlations between DE mRNA and proteins were analyzed. Results showed that total 642 DE RNAs (457 mRNA and 185 lncRNAs) and 256 DE proteins were detected. DE mRNAs (such as MAOB, SDR16C5, and FOSL1) were enriched in oxidation-reduction process-associated functions. PPI network was comprised of 175 nodes and 425 edges. VEGFA was a significant node with the highest degree. LncRNA-mRNA network with three subnetworks (C1, C2, C3) was constructed for lncRNAs with more than 15 gene targets. RP11-58O9.2 was a significant lncRNA with the most target genes and RP11-667F14.1 regulated more than 20 targets. FOSL1 was a common target of the two lncRNAs. Function analysis showed that DE lncRNAs were involved in the HTLV-I infection (RP11-58O9.2 and RP11-667F14.1) and IL-17 signaling pathways (RP11-5O24.1 and RP11-58O9.2). Total 11 DE mRNAs were overlapped with DE proteins, among which MAOB and SDR16C5 showed positive correlations between mRNA and protein expression. Function analysis showed that MAOB was enriched in oxidation-reduction process and its protein was closely related with response to lipopolysaccharide. VEGFA, FOSL1, MAOB, SDR16C5, RP11-58O9.2, RP11-667F14.1, and RP11-288A5.2 may be served as genetic targets for preventing stent restenosis in esophageal cancer.
Introduction
Esophageal cancer is one of the most common human cancers globally and a leading cause of cancer-related deaths, with an estimated 400,000 deaths in 2012 (Ferlay et al., 2013). Esophageal cancer is typically asymptomatic and the disease has already progressed by the time the first symptoms appear. Therefore, more than half of the patients with esophageal cancer have advanced disease at the time of diagnosis (Pennathur et al., 2013). Dysphagia is the most common symptom of obstructive esophageal cancer (Mariette et al., 2007), which may lead to malnutrition and eventually result in a poor treatment response and poor prognosis (Mariette et al., 2012).
For patients with dysphagia, esophageal stent placement is a commonly used palliative treatment, which can quickly relieve the obstruction symptoms of patients, maintain oral intake, and reconstruct the gastrointestinal nutrition channel (van Heel et al., 2010a; Van Heel et al., 2010b). However, esophageal stent placement may result in recurrent dysphagia due to stent migration and tissue hyperplasia. Particularly, benign tissue hyperplasia-induced stent restenosis is the most intractable complication with an incidence of up to 46.1% (Hindy et al., 2012). Previous studies have reported that esophagus restenosis after esophageal stent placement is caused by fibroblast proliferation, which stimulates restenosis by delivering growth factors to monocytes (Marzocchi et al., 1991; Albiero et al., 2000; John et al., 2001). It has been reported that stents loaded with 125I seeds inhibit fibroblast proliferation compared to conventional stents (Gan et al., 2015). However, experiments using animal models indicated that 125I seeds cannot prevent benign tissue hyperplasia-induced stent restenosis (Guo et al., 2007). Therefore, investigating the mechanism of benign hyperplasia-induced stent restenosis is urgently needed to develop effective treatments.
In this study, we enrolled five patients with esophageal cancer who had undergone esophagus 125I stent placement and explored the potential genes and proteins associated with esophagus benign hyperplasia induced by esophageal stents. Transcriptome sequencing and tandem mass tag (TMT) quantitative proteomics analyses were performed for hyperplastic tissues and normal tissues of the esophagus wall. Transcriptome and proteomics data were analyzed by bioinformatics methods and validated by reverse transcription (RT)-PCR and western blot analyses.
Results
Quality Control and Reference Genome Alignment
After removing low-quality reads, the clean reads were mapped to the human reference genome. The read mapping rate of samples ranged from 91.60 to 94.10%.
Differential Expression Analysis
Using thresholds of |log2FC| > 1 and p value <0.05, 642 DE genes were identified, including 244 downregulated mRNAs, 213 upregulated mRNAs, 92 downregulated lncRNAs, and 93 upregulated lncRNAs. A heatmap of the DE genes is shown in Figure 1. All DE mRNAs and lncRNAs are shown in Supplementary Table 3.
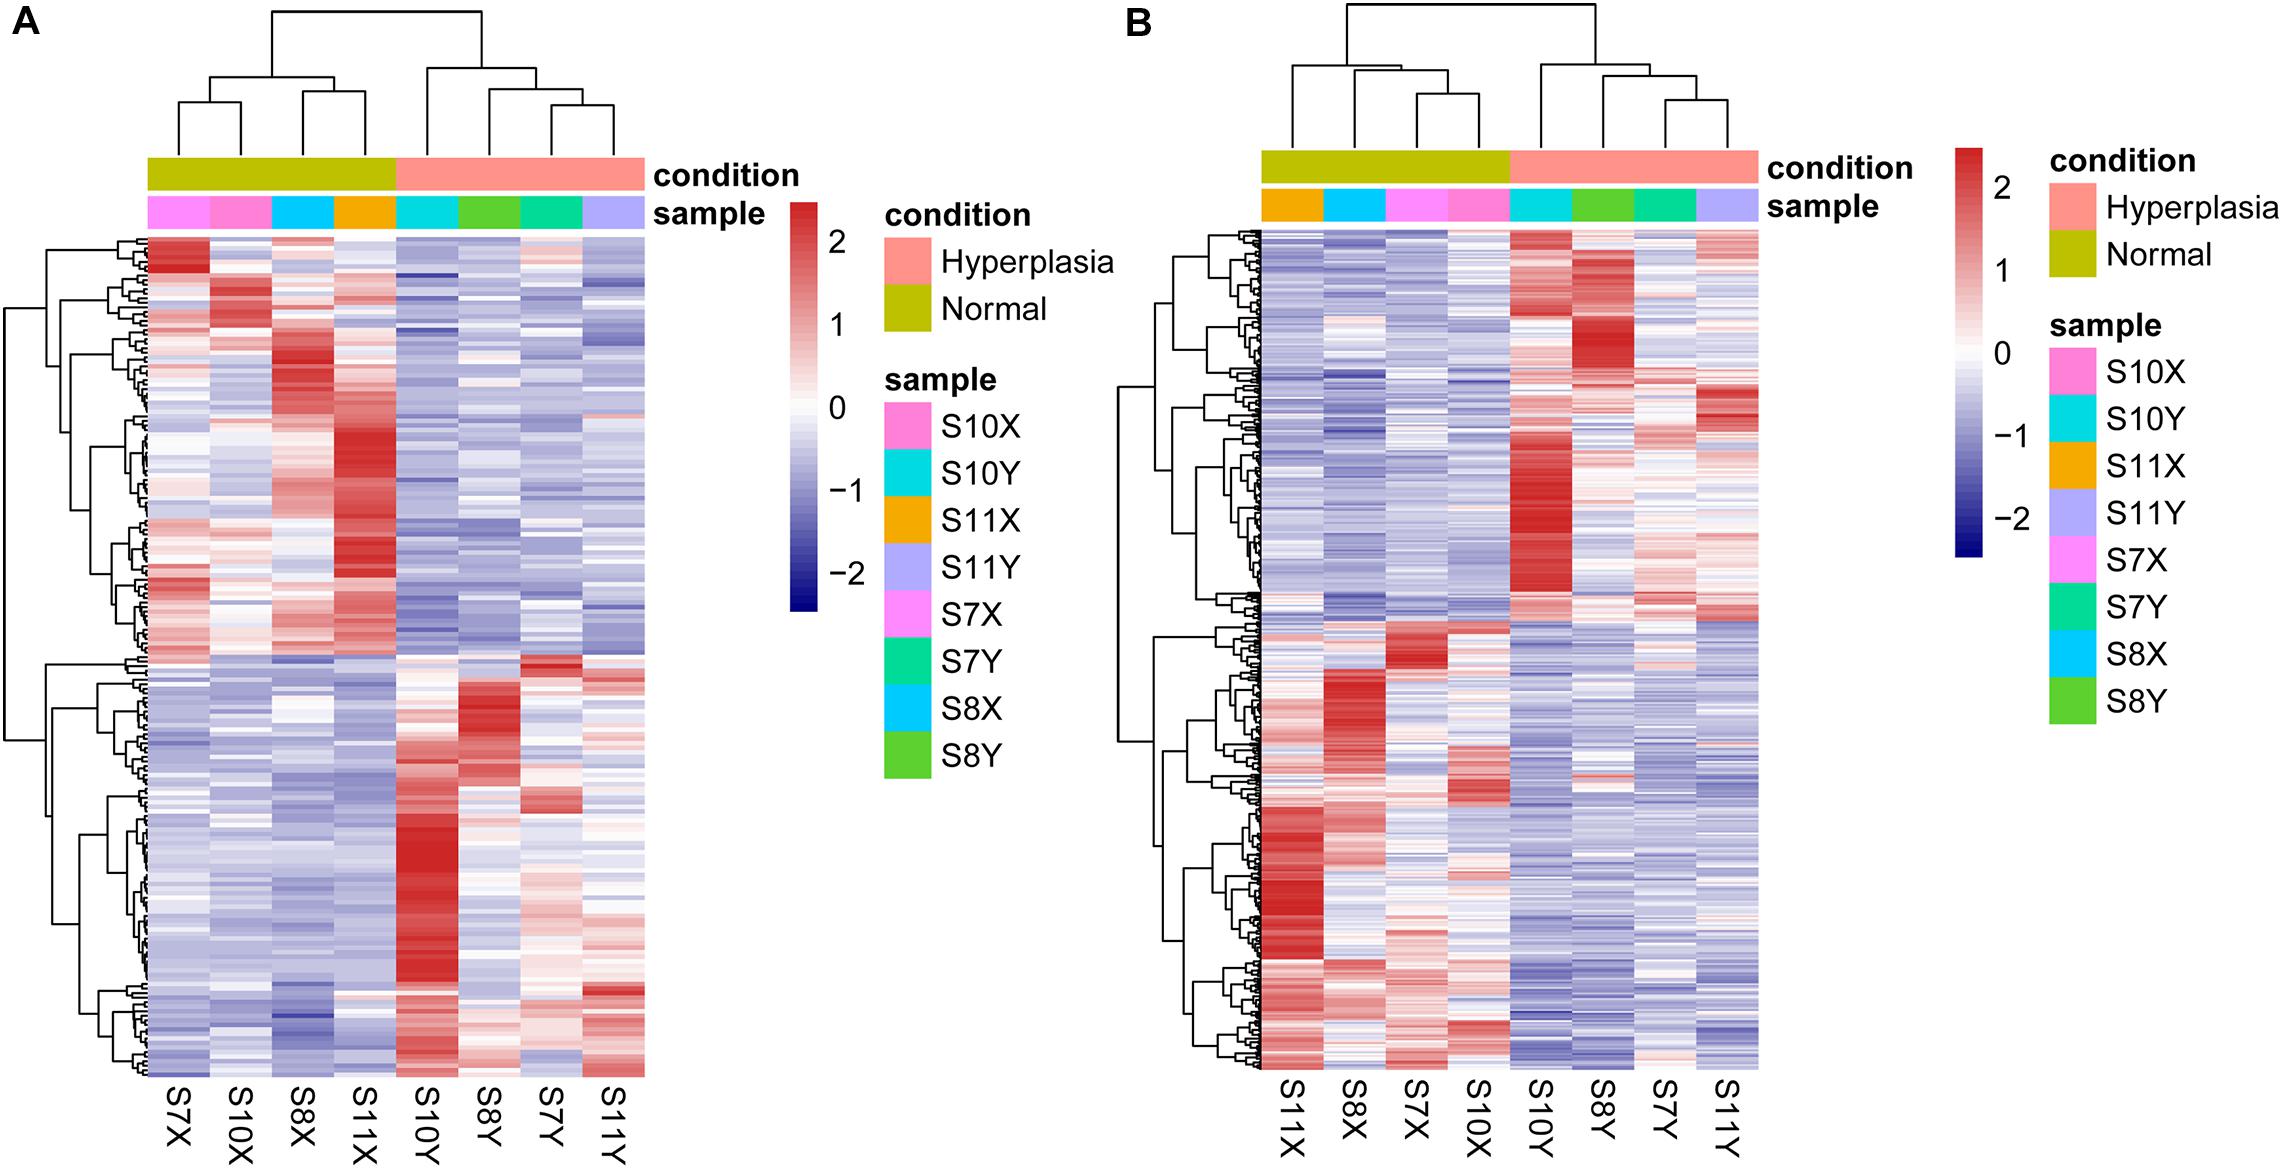
Figure 1. Heatmaps of differentially expressed (A) lncRNAs and (B) mRNAs.
Functional Enrichment Analysis of DE mRNAs
The DE mRNAs were enriched in 110 GO (BP, CC, and MF) terms or KEGG pathways, such as GO:0007155∼cell adhesion, GO:0005576∼extracellular region, GO:0055114∼oxidation-reduction process, GO:0042542∼response to hydrogen peroxide, and hsa05200:pathways in cancer. The top five terms ranked according to the increasing p values are shown in Figure 2.
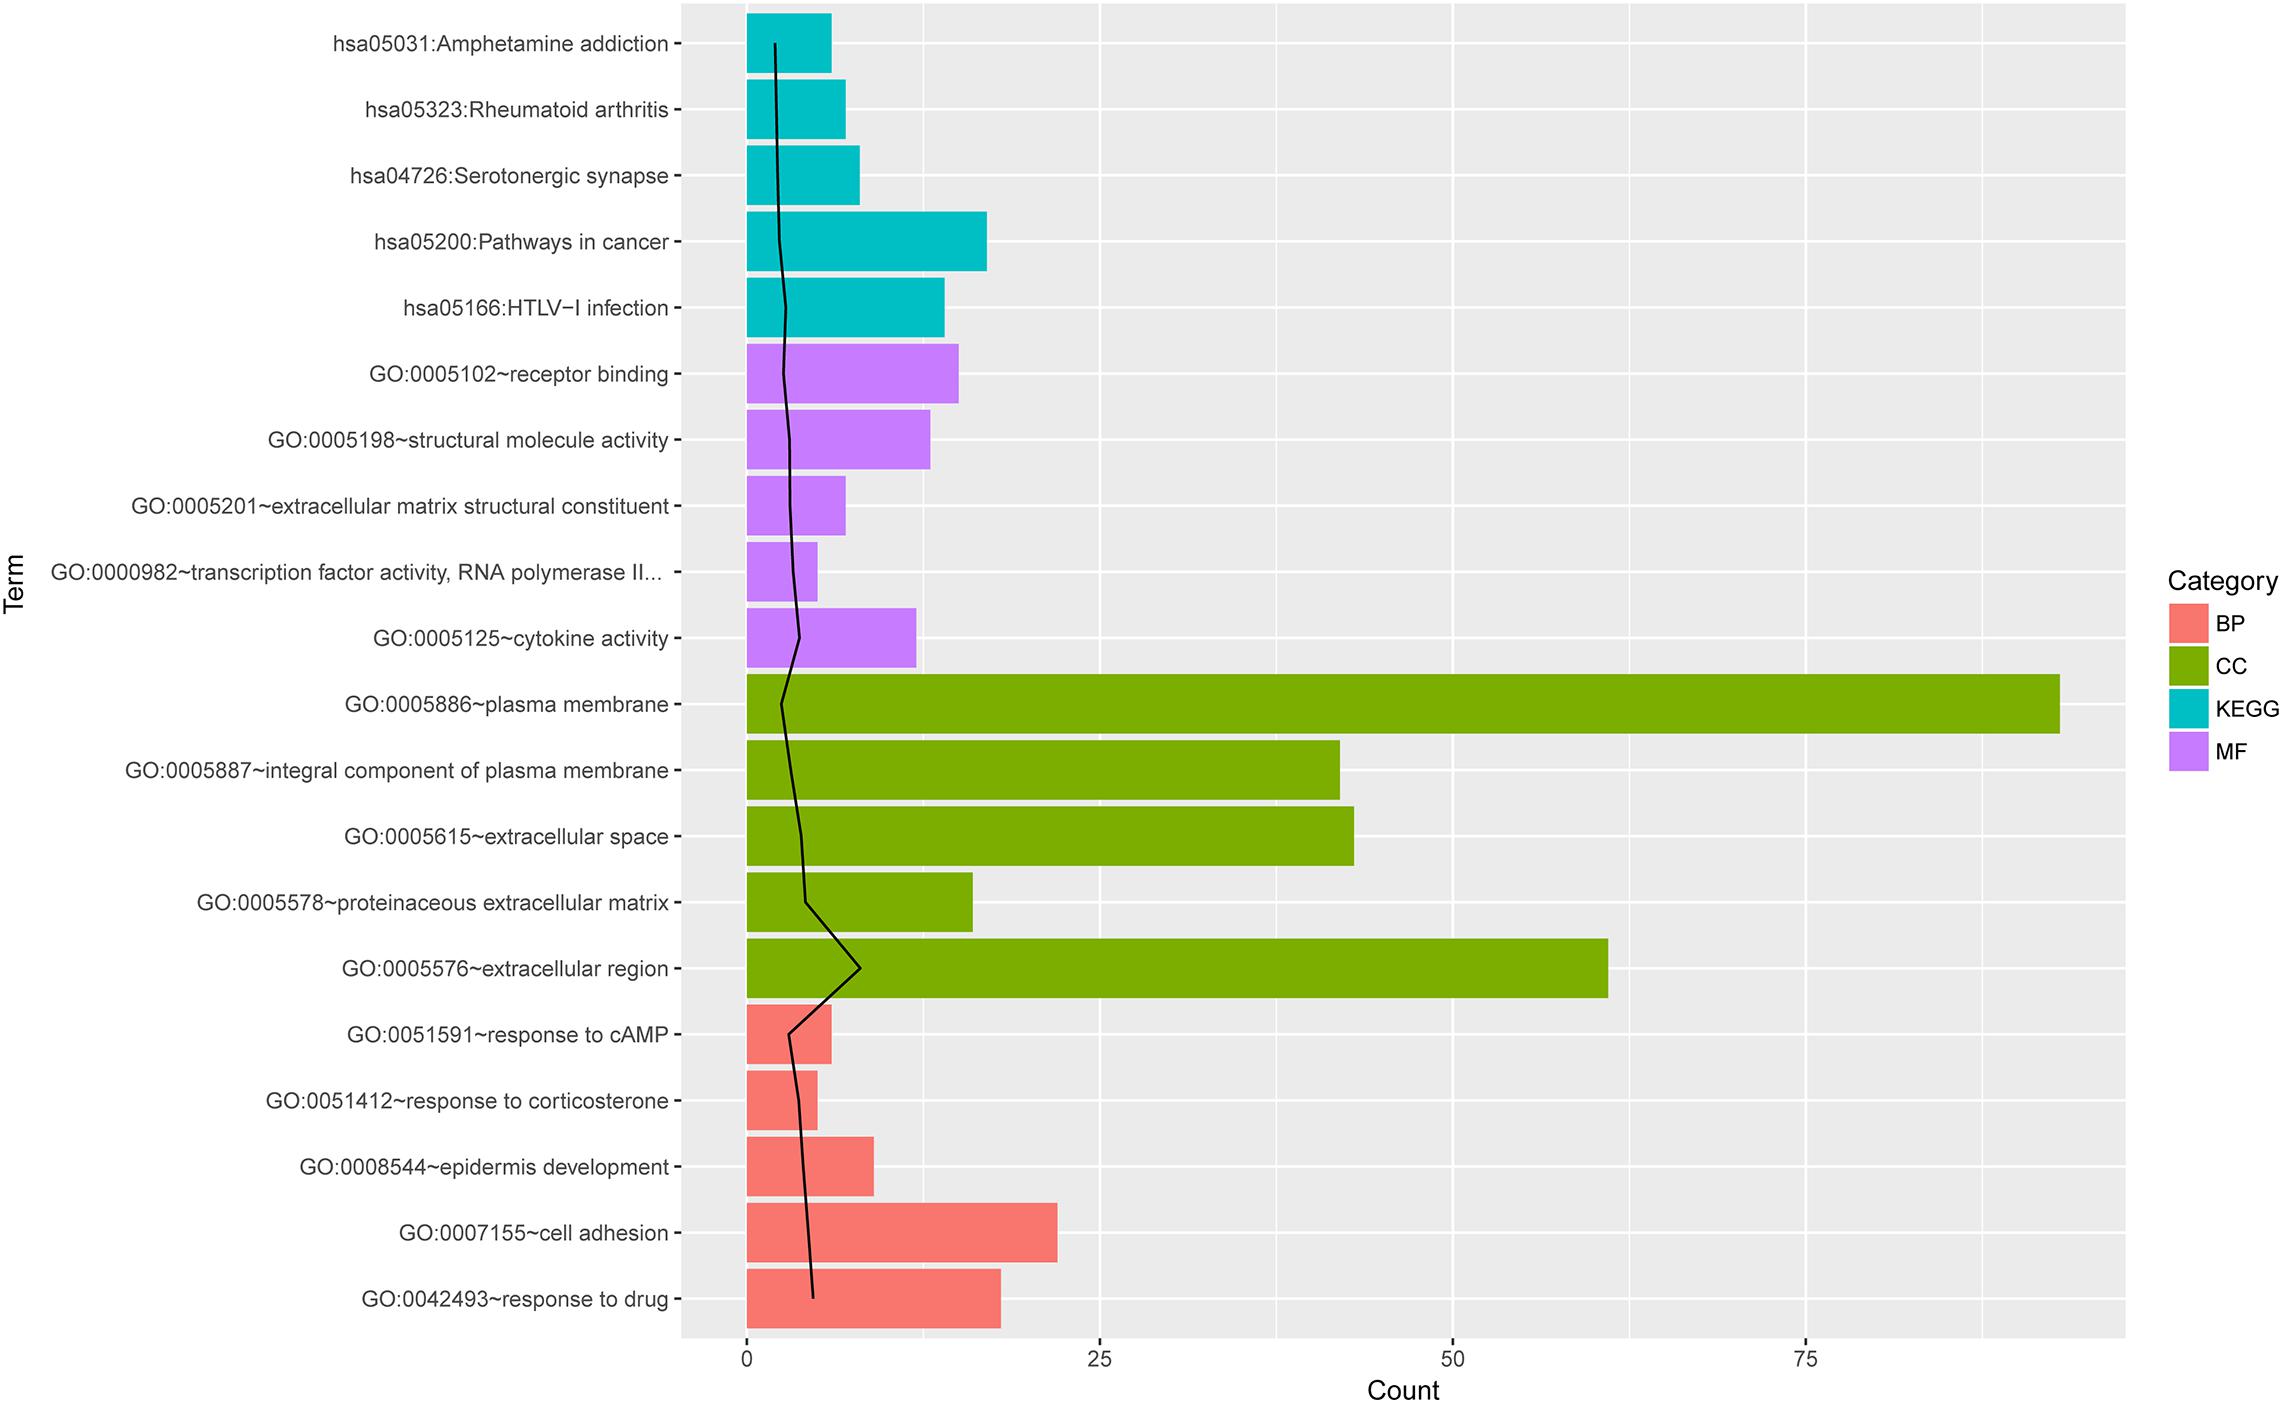
Figure 2. The top 5 GO and KEGG pathway terms for differentially expressed mRNAs. The top five terms ranked according to the increasing p values. The black line indicates -log10 (P value) for each term. BP, biological process; CC, cellar component; MF, molecular function; KEGG, Kyoto Encyclopedia of Genes and Genomes pathway; Count, number of genes enriched in one term.
PPI Network Construction
In the PPI network of mRNAs, there were 175 nodes and 435 edges. Network topological property analysis revealed that eight mRNAs [such as VEGFA, FOS, and MYC proto-oncogene, BHLH transcription factor (MYC)] had higher scores in three topological properties. The top 15 node genes with higher scores in the three topological properties are shown in Table 1.
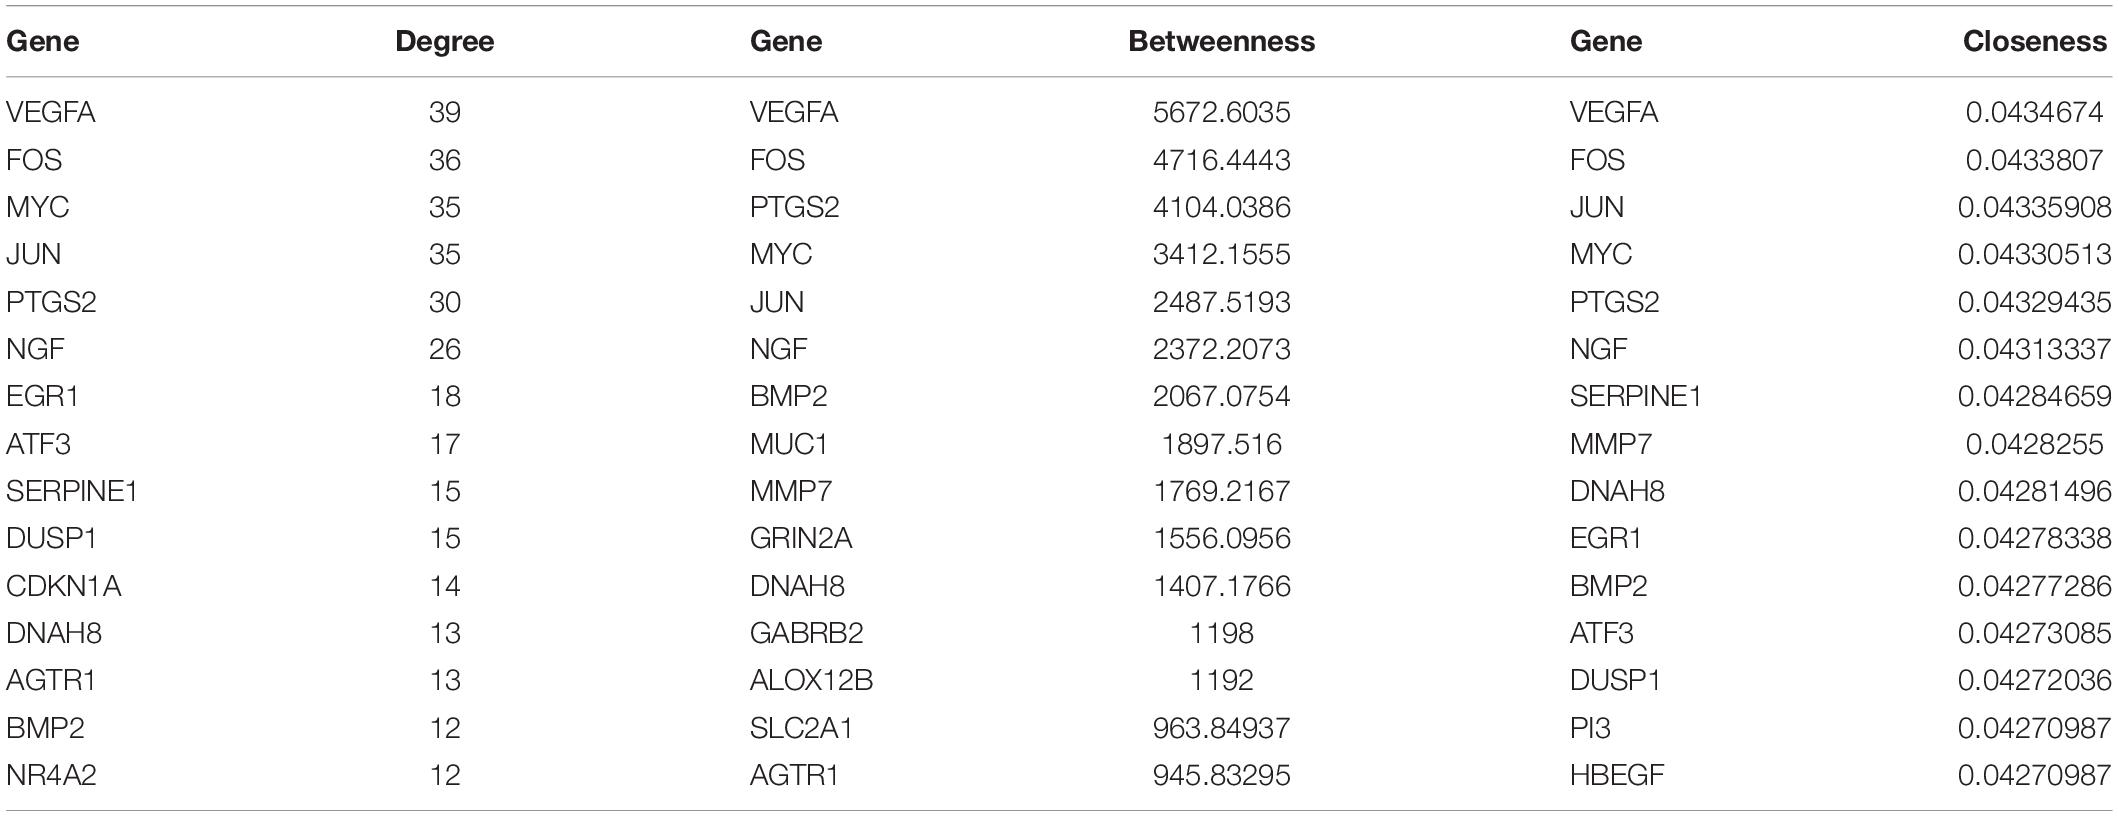
Table 1. Genes with higher degrees in the PPI network (top 15).
Prediction of Target Genes of DE lncRNAs
A total of 151 DE lncRNAs were found to have target genes and lncRNAs that interacted with more than 15 genes were visualized in the lncRNA-mRNA network. As shown in Figure 3A, the network consisted of three parts (C1, C2, and C3), in which there were 1, 4, and 23 lncRNAs, respectively. The top ten lncRNAs that regulated the largest number of targets are shown in Table 2.
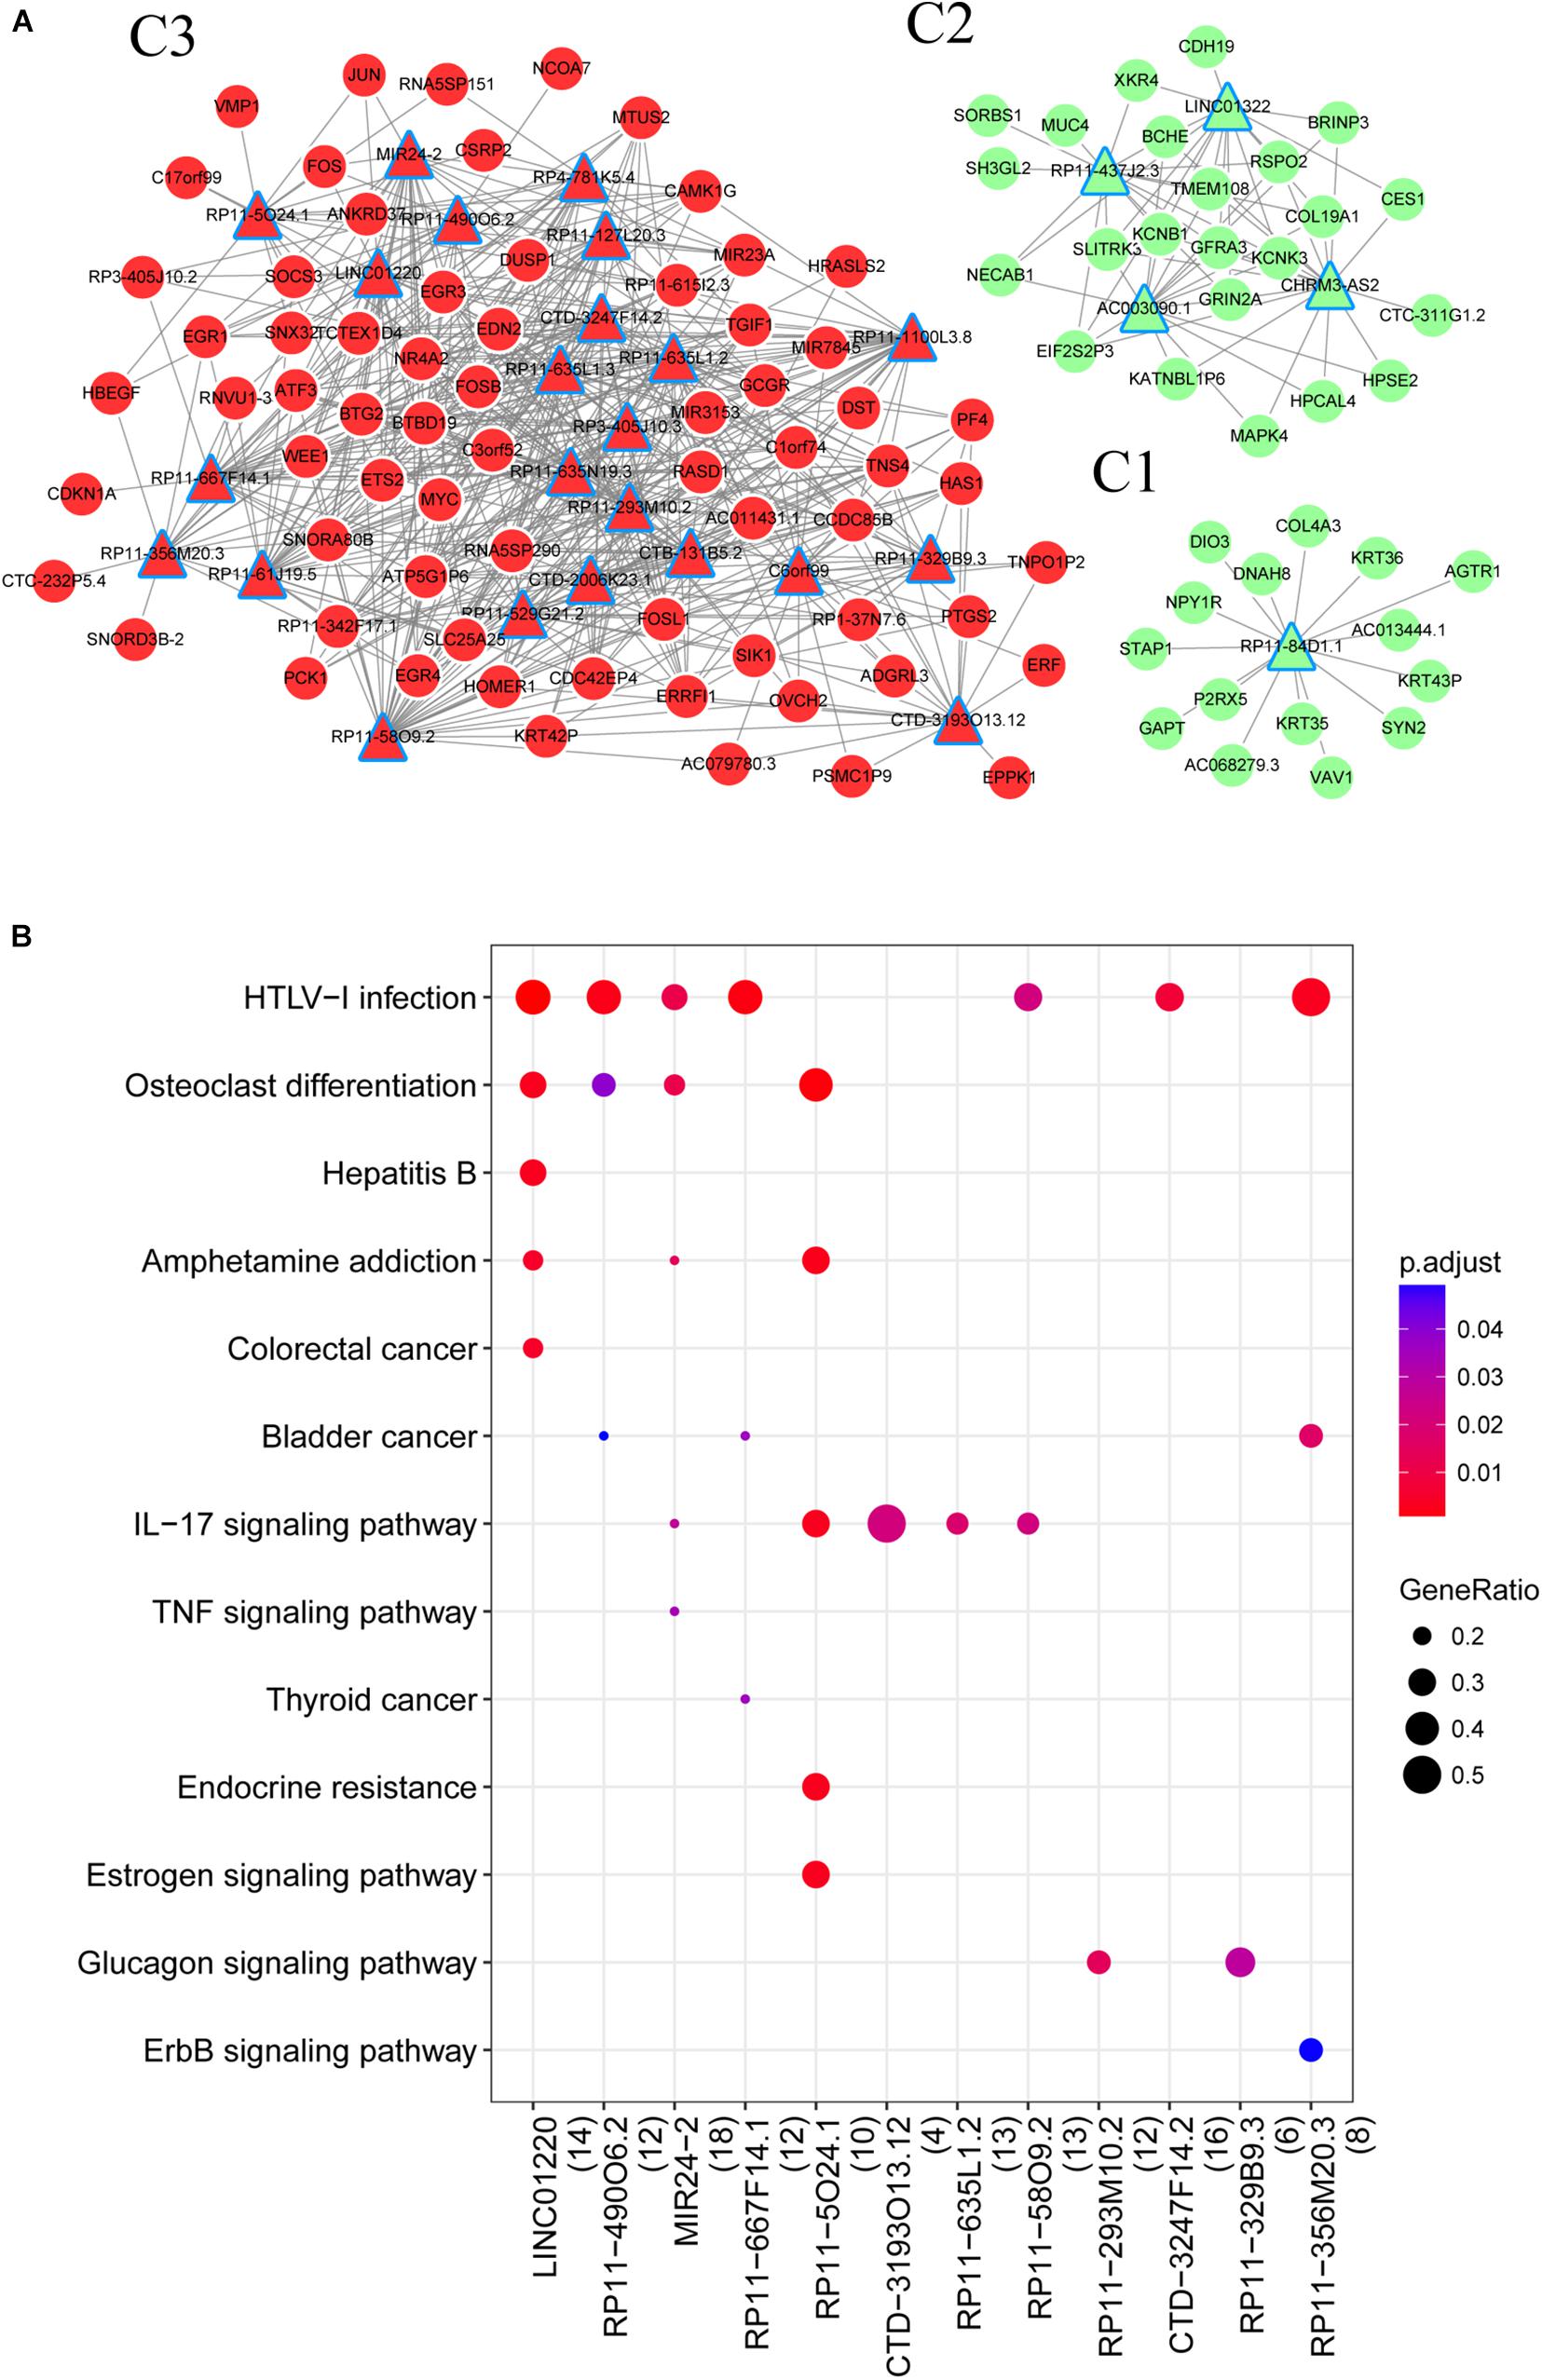
Figure 3. (A) LncRNA regulatory network; (B) Pathways enriched by lncRNAs. Red triangle, upregulated lncRNA; red circle, upregulated mRNAs; green triangle, downregulated lncRNAs; green circle, downregulated mRNAs.
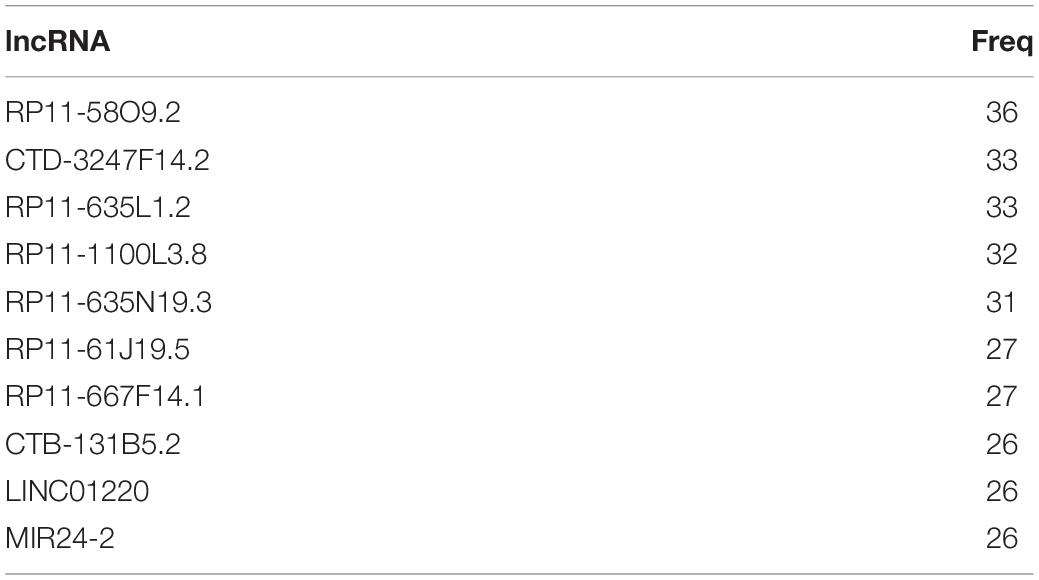
Table 2. The top ten lncRNAs that regulated more targets.
To understand the roles of DE lncRNAs, functional enrichment analyses were performed for their target genes. As shown in Figure 3B, the target genes were significantly enriched in the HTLV-I infection (RP11-58O9.2 and RP11-667F14.1) and IL-17 signaling pathways (RP11-5O24.1 and RP11-58O9.2). Additionally, both RP11-58O9.2 and RP11-667F14.1 were associated with functions of response to glucocorticoid, and extracellular stimulus.
Function Similarity Analysis of lncRNAs
For the results obtained from GOSemSim, a Wang score >0.8 and Resnik score >0.5 were considered to have functional similarity between lncRNAs. The constructed functional similarity network showed that the upregulated CTB-131B5.2, RP11-635L1.2, and RP11-329B9.3 were linked with other lncRNAs in function (Figure 4).
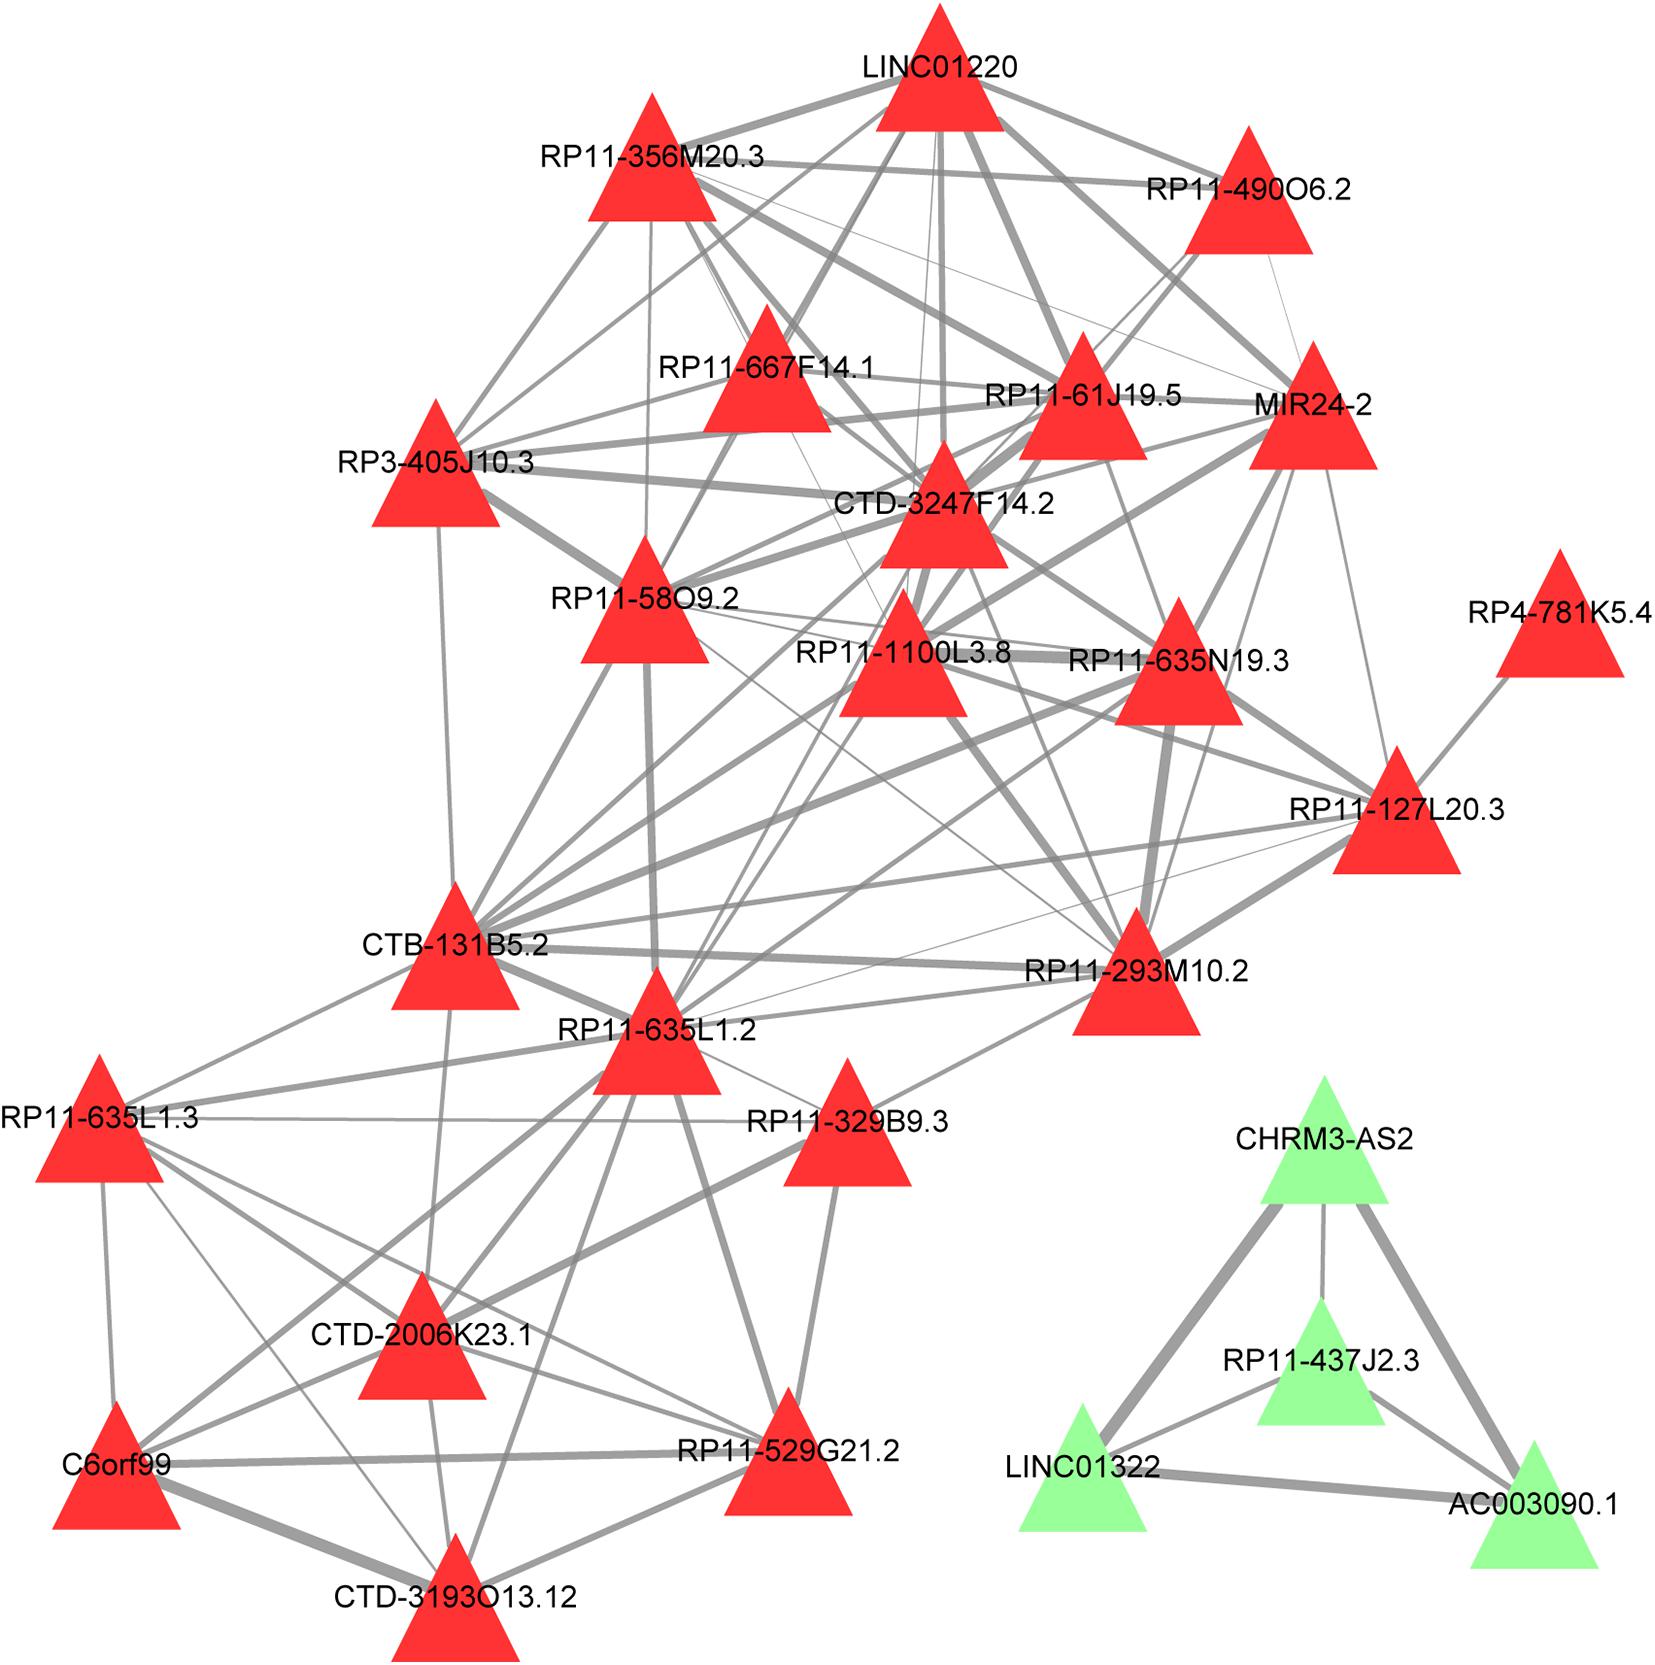
Figure 4. Function similarity network of lncRNAs. Red triangle, upregulated lncRNA; green triangle, downregulated lncRNAs; the thicker the connection line, the more similar the functions between the lncRNAs.
miRNA Prediction and ceRNA Construction
Based on Figure 3A, the miRNAs were predicted for mRNAs in lncRNA-mRNA network. Results showed that seven miRNAs were predicted for mRNAs of C2 and three miRNAs were predicted for those of C3. No miRNAs were predicted for mRNAs in C1 network. Based on the miRanda database, nine miRNA-lncRNA interactions were predicted in C2 and 36 were predicted in C3. Finally, combining the miRNA-lncRNA, miRNA-mRNA and lncRNA-mRNA interactions, two ceRNA networks were constructed (Figure 5). The network of C2 consisted of 4 lncRNAs, 7 miRNAs, 22 mRNAs, and 115 interaction pairs. The C3 network included 21 lncRNAs, 3 miRNAs, 17 mRNAs, and 210 interaction pairs.
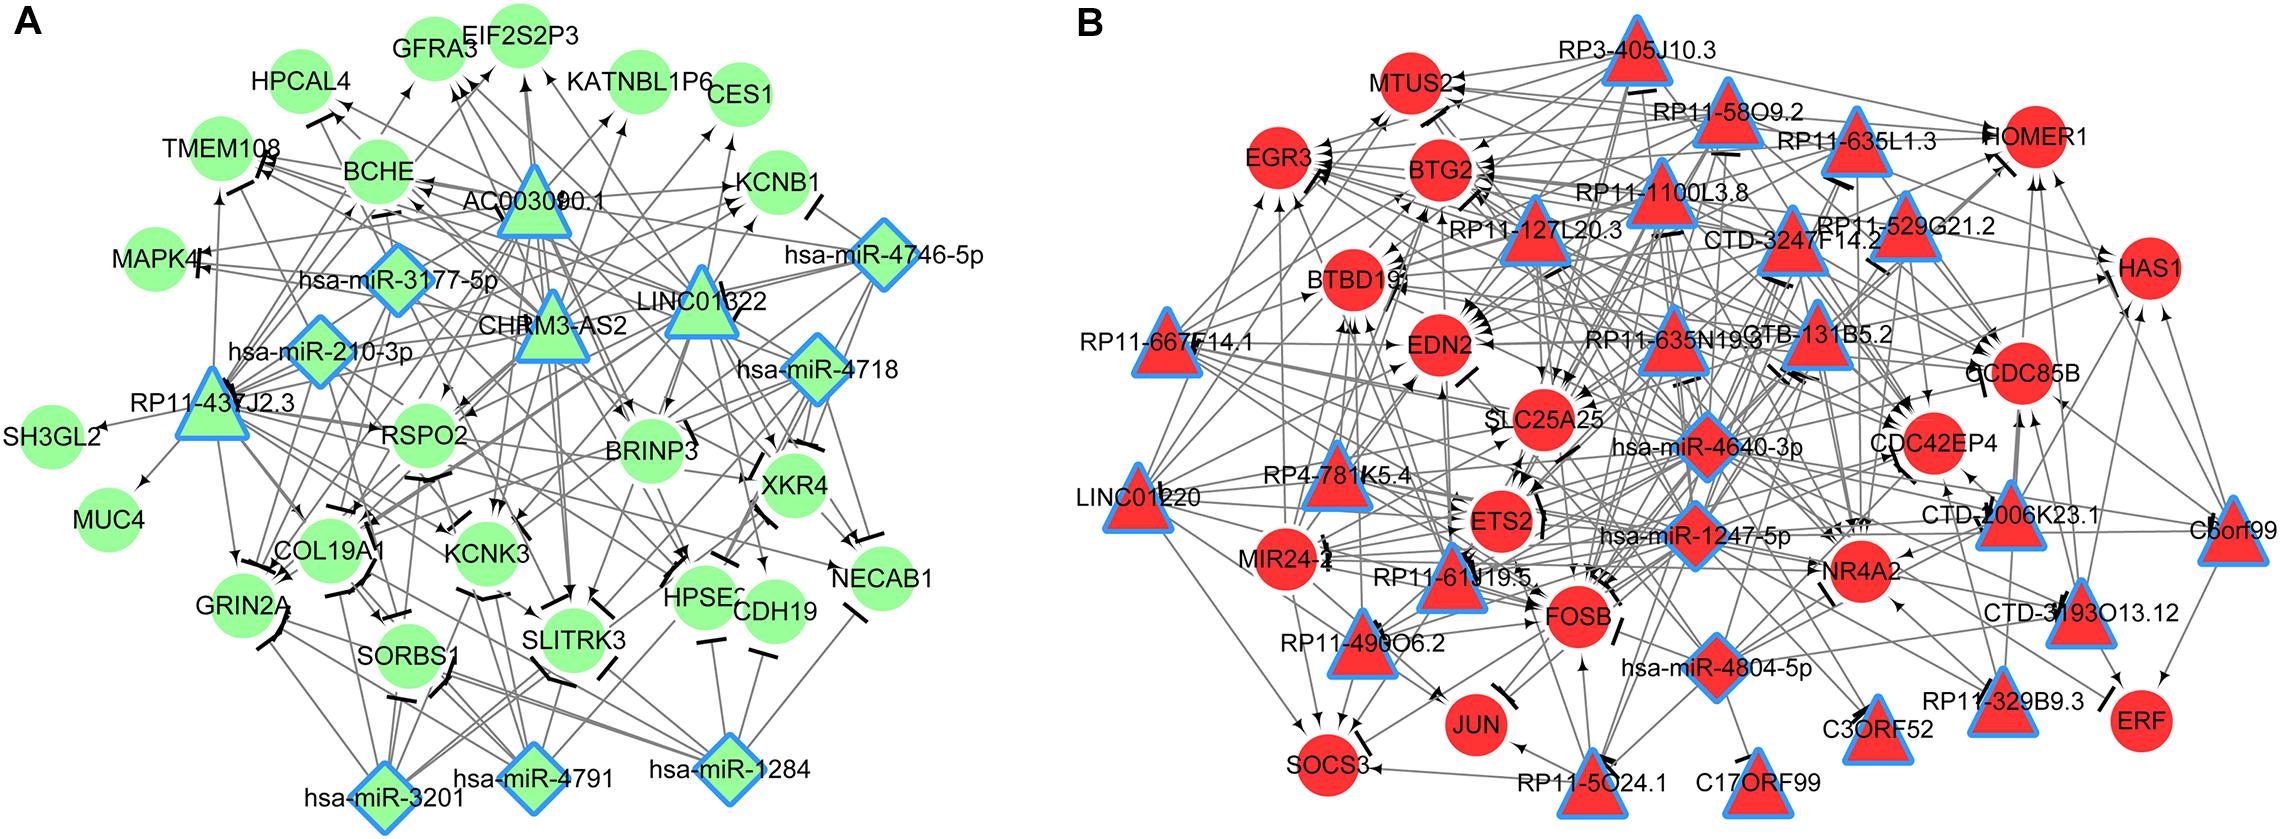
Figure 5. ceRNA networks (A, C2; B, C3) based on miRNA-lncRNA, lncRNA-mRNA, and miRNA-mRNA interactions. Triangle, lncRNA; rhomboid, miRNA; circle, mRNA; red, upregulated; green, downregulated.
DE Protein Selection and Bioinformatics Analysis
For proteomics analysis, a total of 4546 proteins were obtained by searching in the UniProt database. After differential expression analysis, 256 DE proteins were identified (Supplementary Table 3).
PPI network was constructed with protein pairs (Figure 6A). In this network, acetyl-CoA carboxylase alpha (ACACA), enolase 2 (ENO2), phosphoribosylformylglycinamidine synthase (PFAS), glutamyl-prolyl-tRNA synthetase (EPRS), spectrin alpha, non-erythrocytic 1 (SPTAN1), RNA polymerase II subunit C (POLR2C), RNA binding motif protein 8A (RBM8A), Erb-B2 receptor tyrosine kinase 2 (ERBB2), S100 calcium binding protein B (S100B), and dicer 1, ribonuclease III (DICER1) were in the top 15 genes for three topological properties.
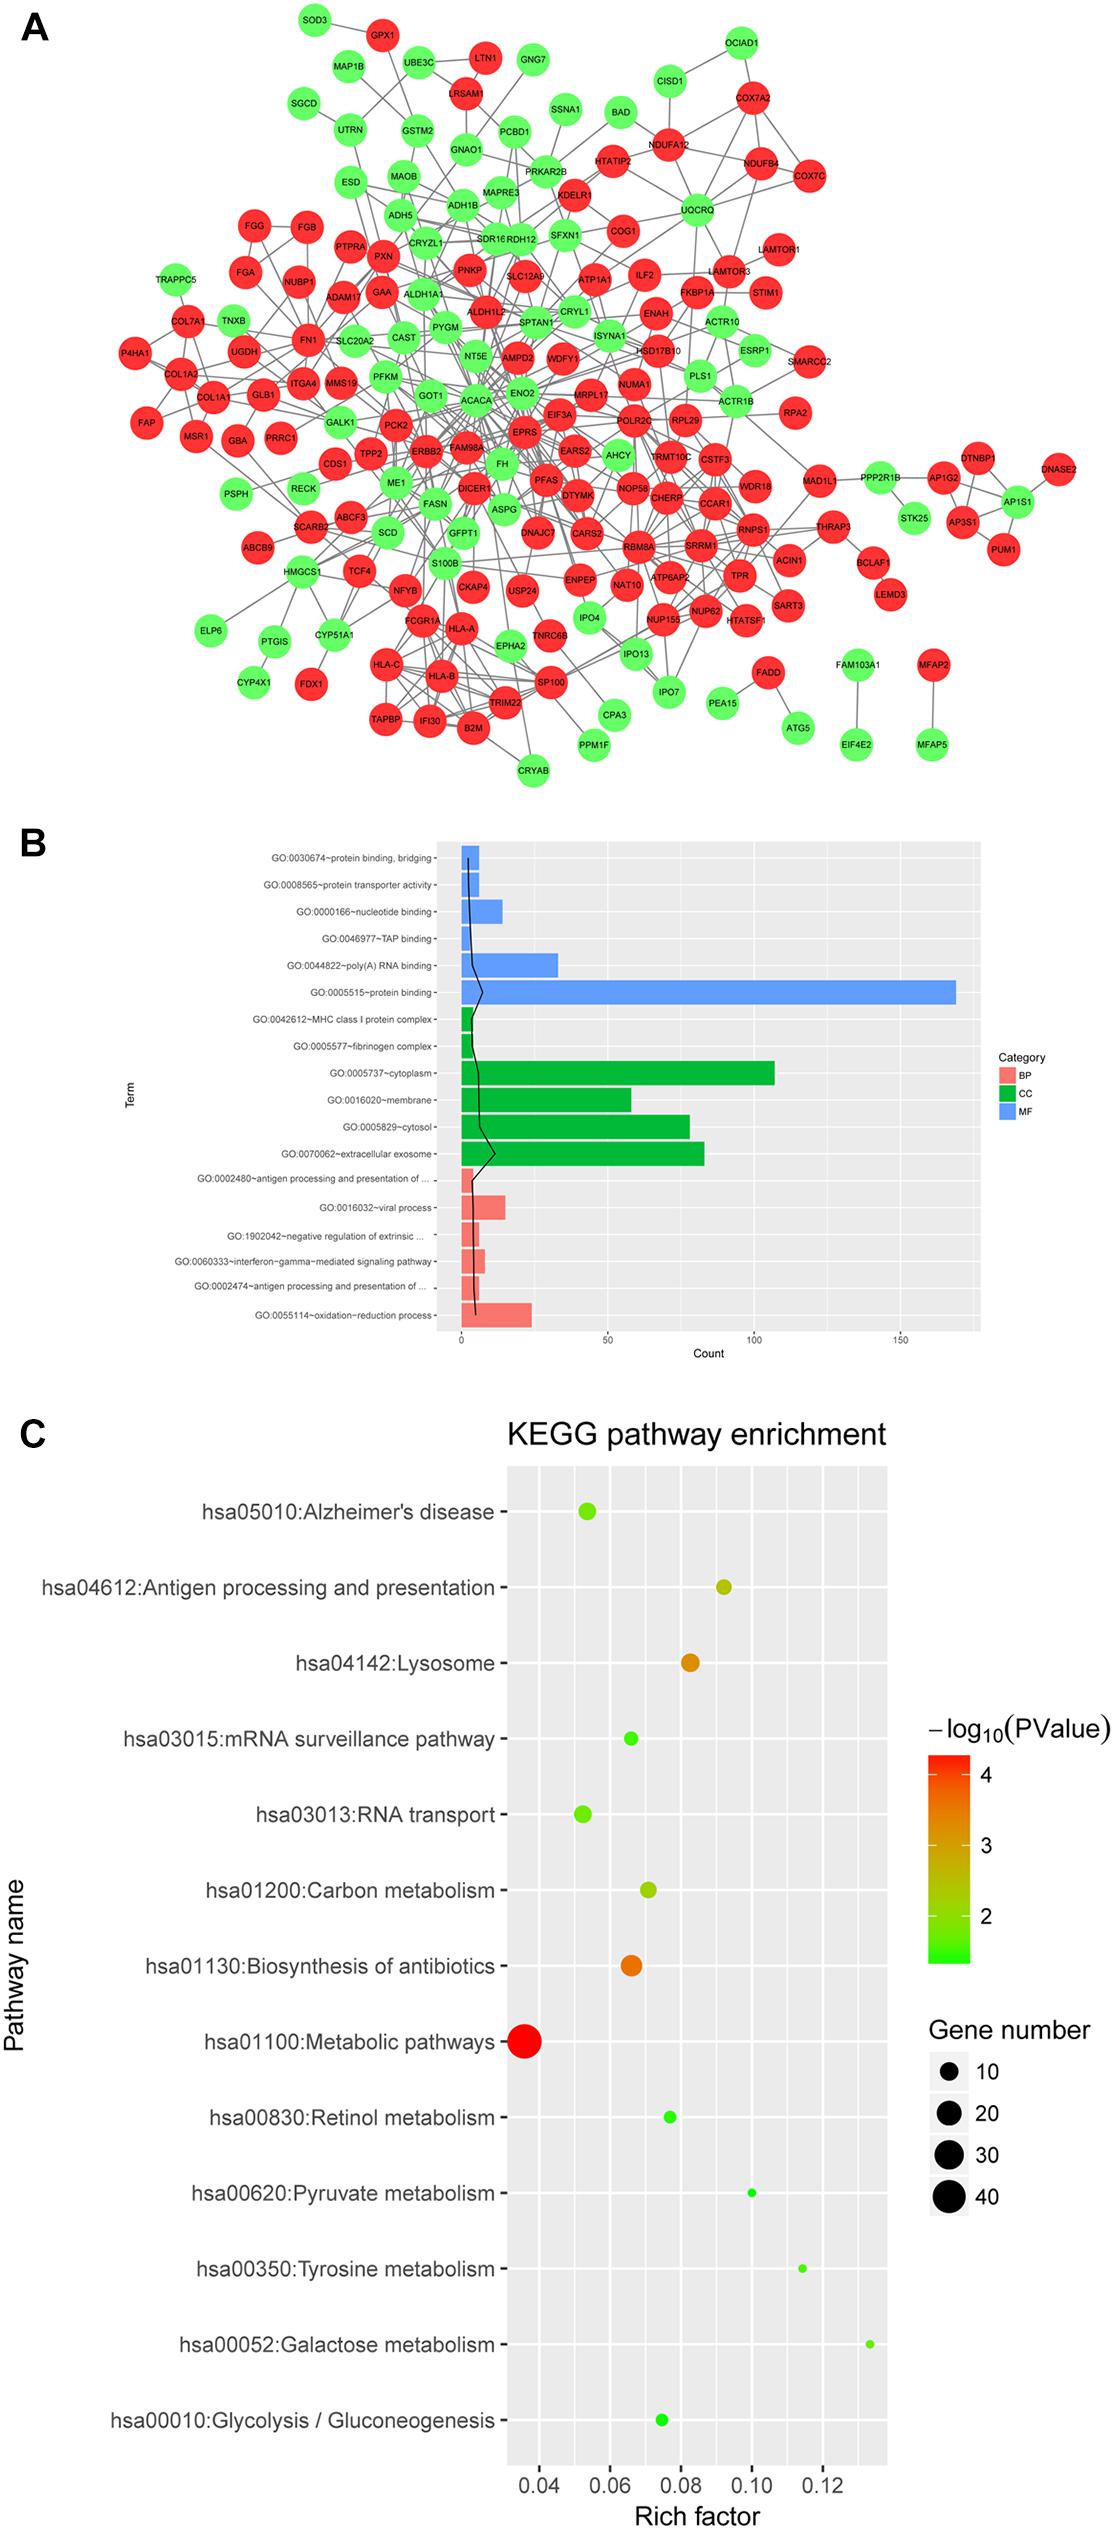
Figure 6. (A) PPI network of differentially expression proteins; (B,C) GO and KEGG pathway analyses for differentially expressed proteins. The top 6 GO terms ranked according to the increasing p values are listed. The black line stands for −log10 (P value) for each term. Red, upregulated protein; green, downregulated protein.
GO analysis revealed that the DE proteins were closely related to oxidation-reduction process, protein binding, and extracellular exosome (Figure 6B). Moreover, the DE proteins were significantly involved in hsa01100:metabolic pathways, and hsa01130:biosynthesis of antibiotics (Figure 6C).
Conjoint Analysis of Proteome and Transcriptome Data
The DE genes and DE proteins with p < 0.05 identified above were subjected to Pearson correlation analysis. The expression correlation analysis showed that the R values of most genes and proteins ranged from 0.7 to 1.0, suggesting that most genes and proteins had positive correlation in expression level. In addition, analysis of the correlation of the fold-change between DE mRNAs and DE proteins also showed positive correlation with R = 0.57 and p value <2.2e-16 (Figure 7), suggesting the consistency of gene and protein expression. Furthermore, Venn analysis identified 11 overlapped proteins/mRNAs [MAOB, Fc fragment of IgG binding protein (FCGBP), OCIA domain containing 2 (OCIAD2), collagen type I alpha 1 chain (COL1A1), COL7A1, glutamine-fructose-6-phosphate transaminase 1 (GFPT1), asparaginase (ASPG), proliferation and apoptosis adaptor protein 15 (PEA15), SDR16C5, secernin 1 (SCRN1), and microfibril associated protein 2 (MFAP2)]. Correlation analysis showed that there were positive correlations between protein and mRNA for FCGBP, MAOB and PEA15 (Table 3).
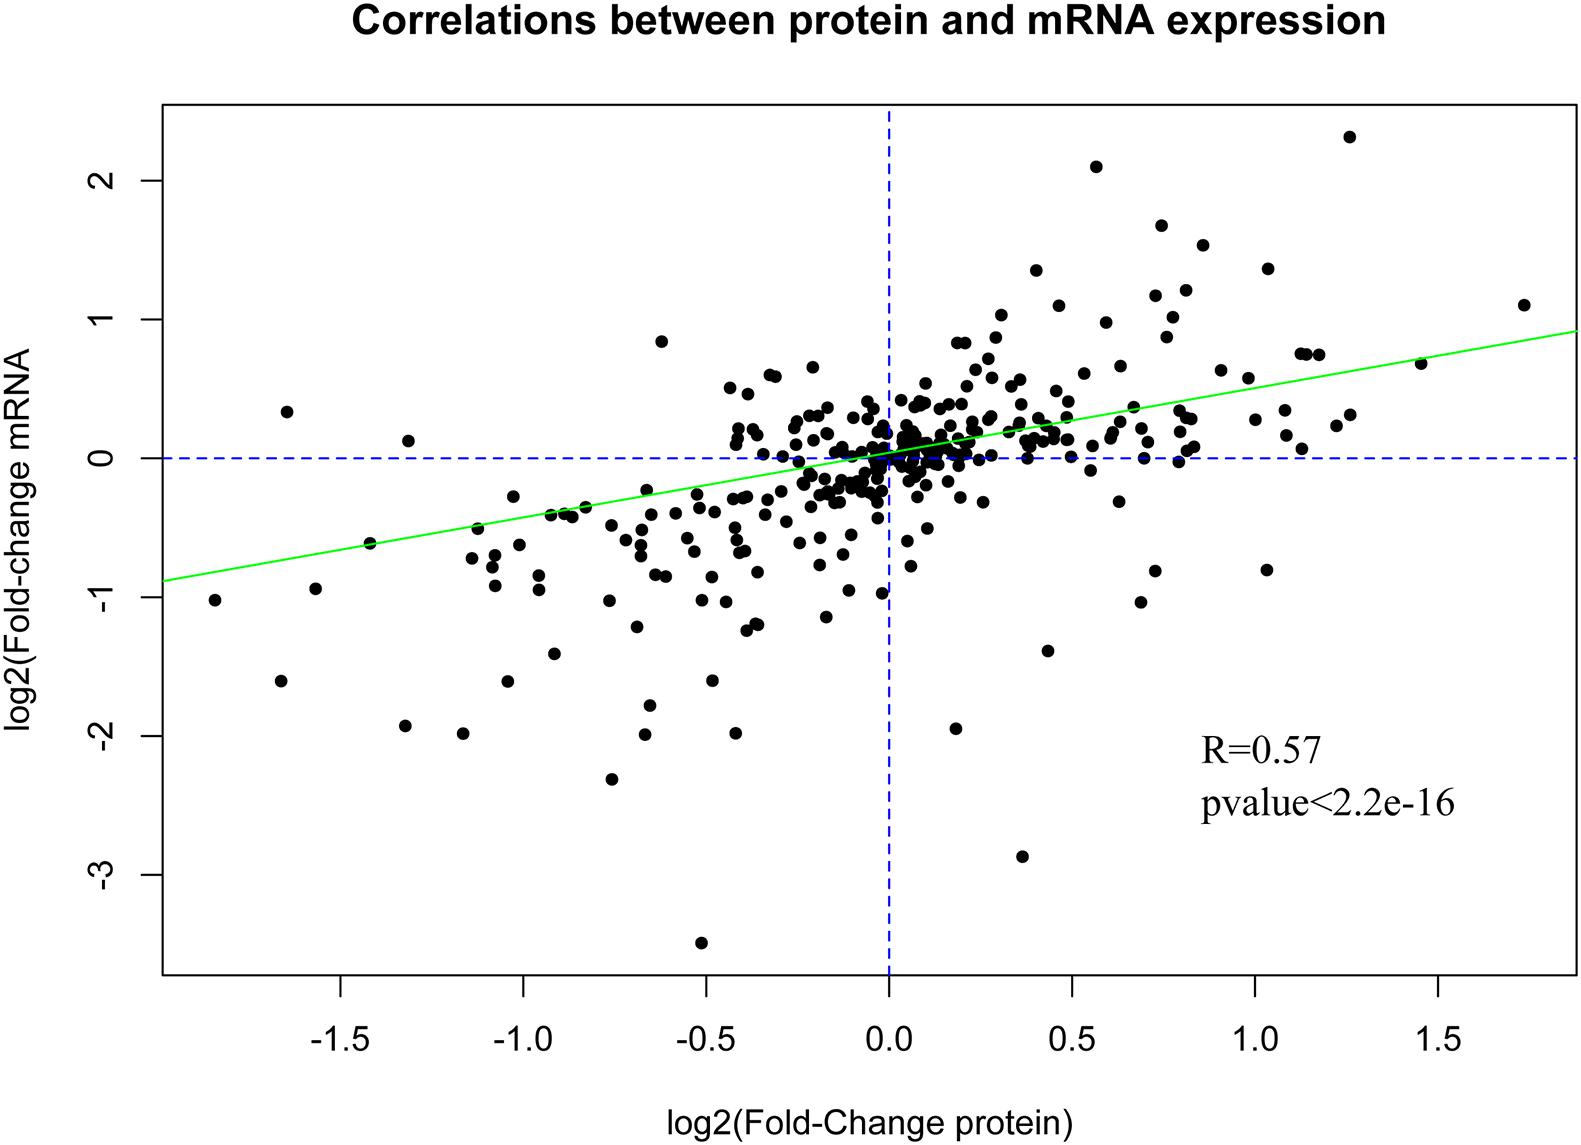
Figure 7. Correlation between the mRNA and protein expression levels.
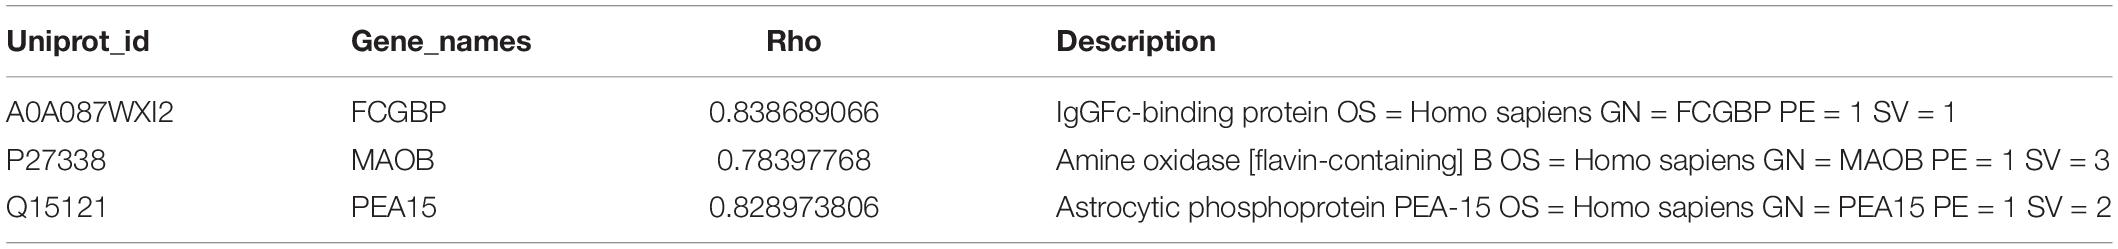
Table 3. Correlation analysis results of overlapped genes/proteins.
RT-PCR Validation
The expression levels of RP11-58O9.2, RP11-667F14.1, VEGFA, and FOSL1 in hyperplastic tissues were significantly higher than in normal tissues, which was consistent with the differential protein analysis above (P < 0.05). Additionally, compared to normal tissues, RP11-288A5.2, MAOB, and SDR16C5 were significantly downregulated in hyperplastic tissues, which were in accordance with the prediction analysis (P < 0.05) (Figure 8A). However, CTD-2350J17.1 was not detected in hyperplastic tissues.
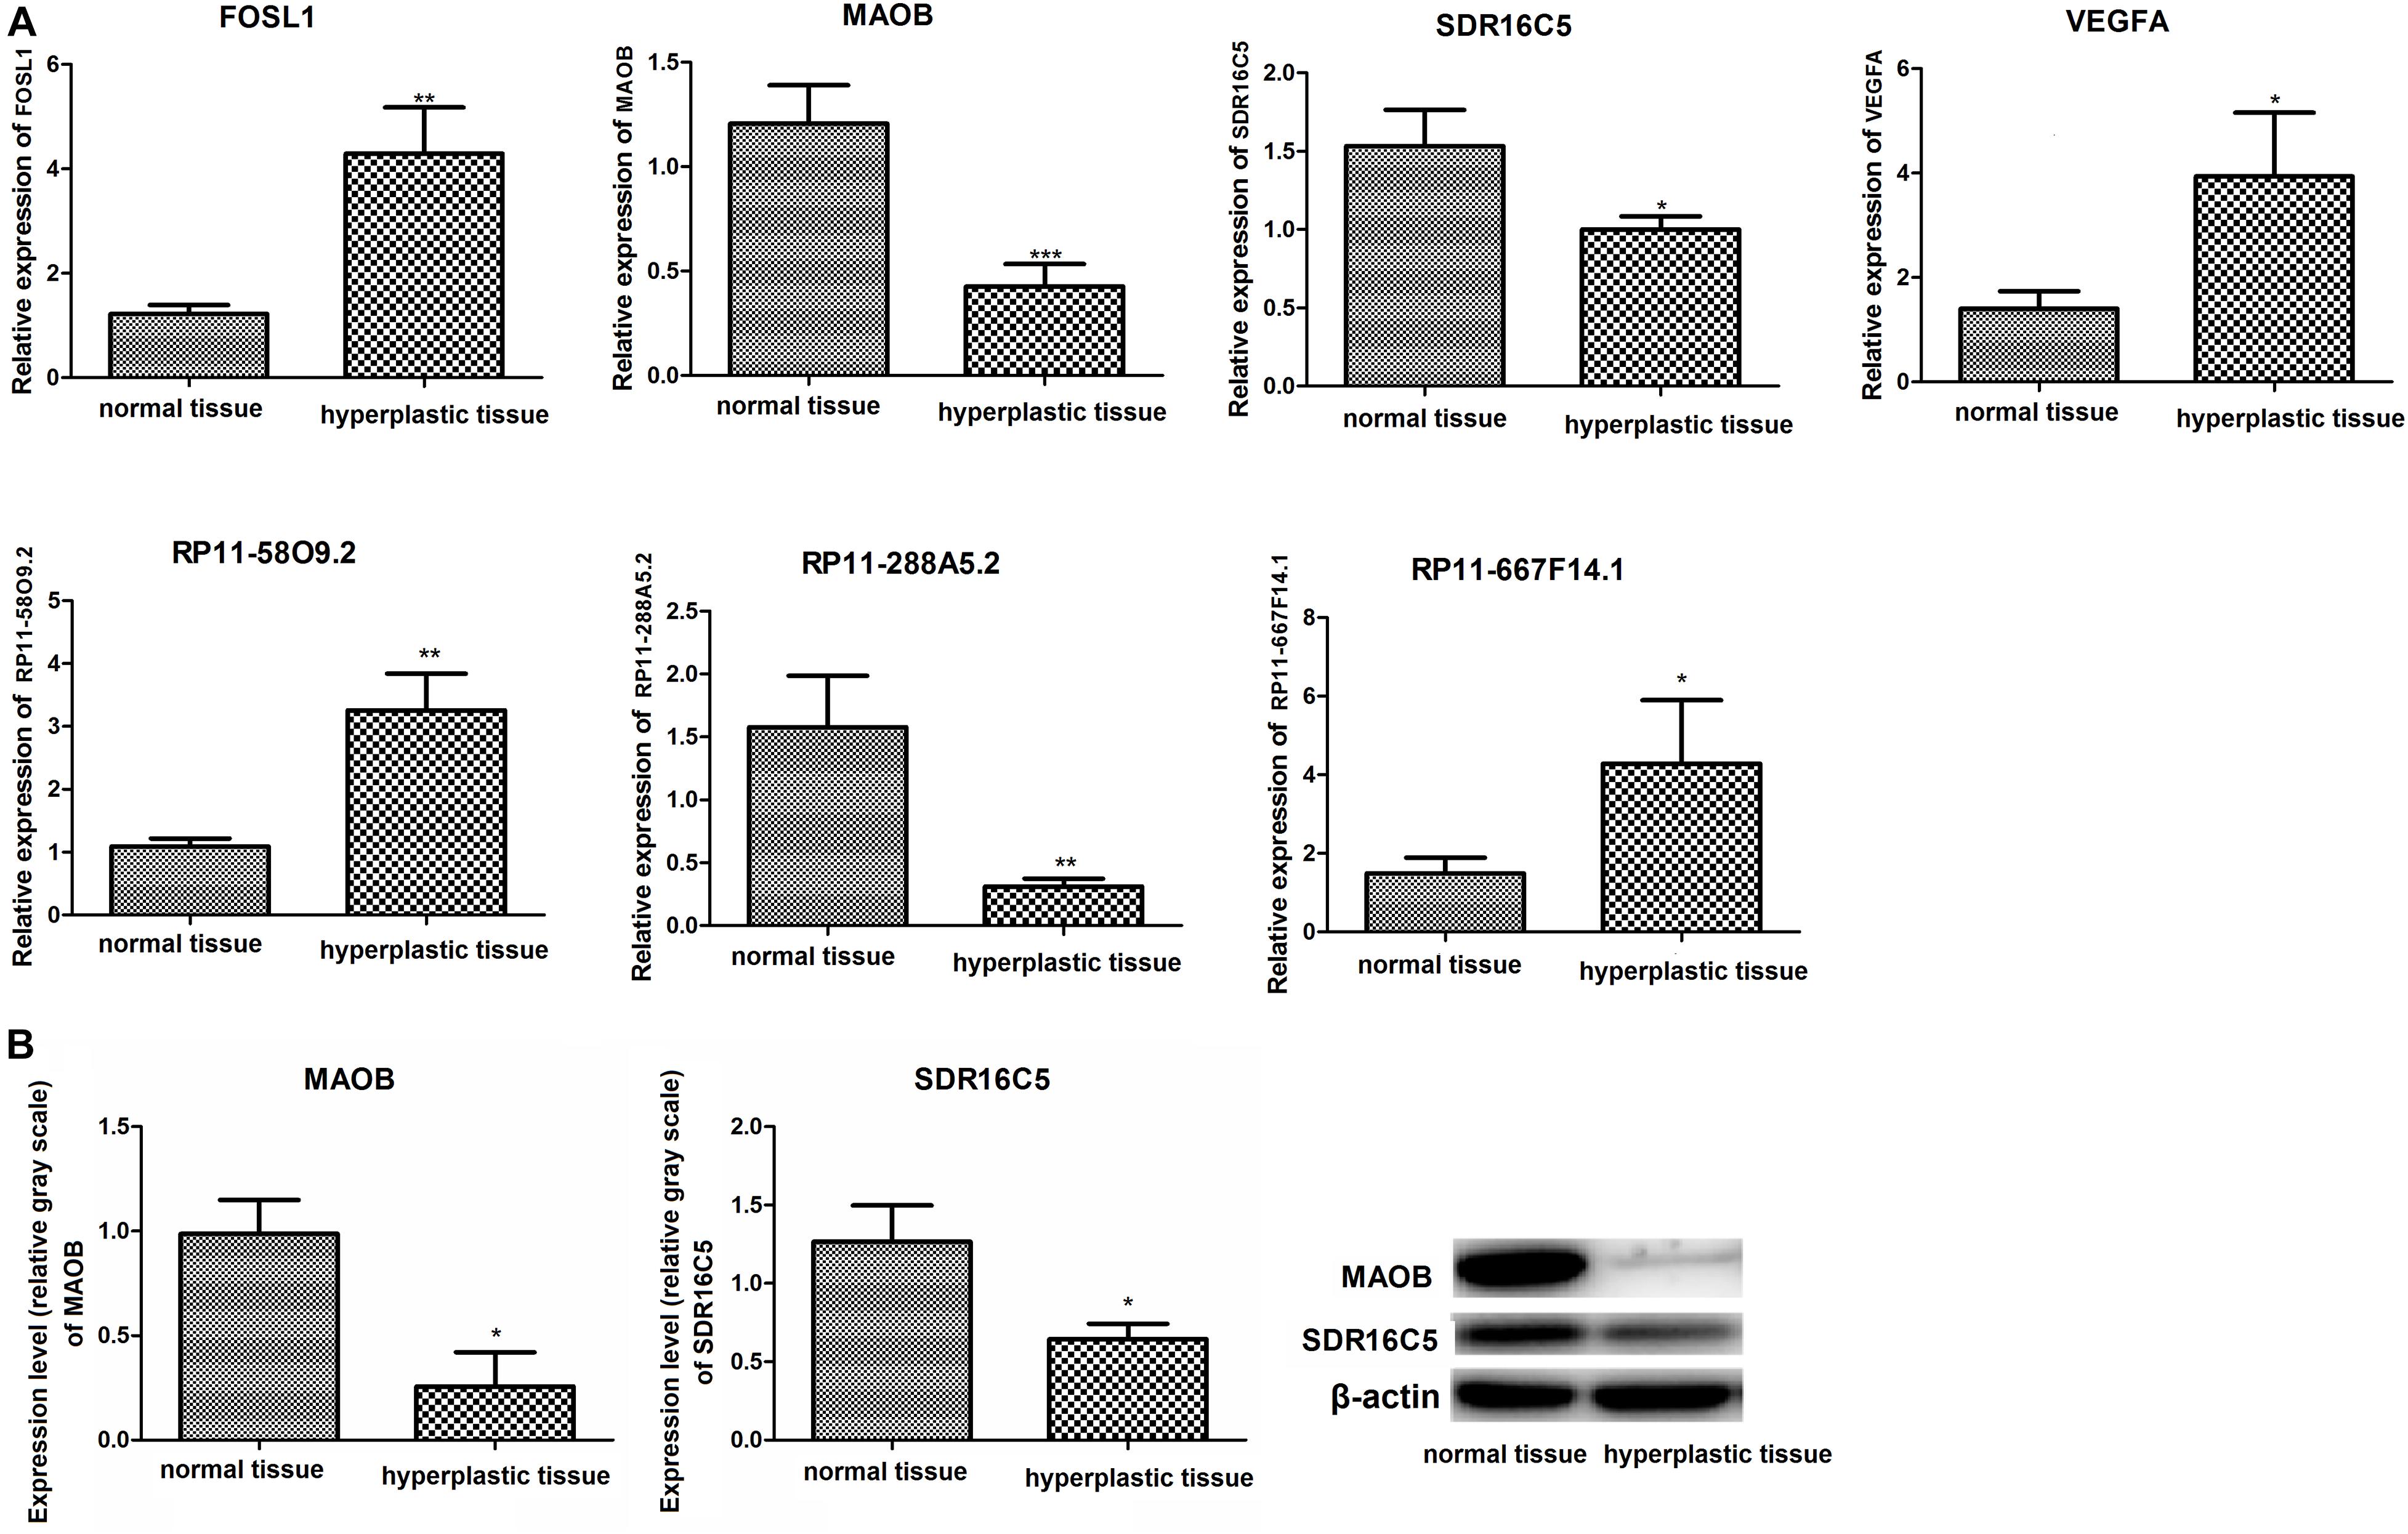
Figure 8. (A) Relative expression of VEGFA, FOSL1, MAOB, SDR16C, RP11-58O9.2, RP11-667F14.1, and RP11-288A5.2 detected by RT-PCR analysis; (B) Protein levels of MAOB and SDR16C detected by western blot. *p < 0.05, compared to normal tissues; **p < 0.01, compared to normal tissues.
Western Blotting Validation
The protein expression levels of MAOB and SDR16C5 are shown in Figure 8B. Compared with normal tissues, the two proteins above were downregulated in hyperplastic tissues.
Discussion
Currently, esophageal stents have been increasingly used for palliation of malignant dysphagia and are the most common means of palliation (Sharma et al., 2002; Sharma and Kozarek, 2010). Nevertheless, tissue benign hyperplasia-induced stent restenosis is a common complication influencing the long-term effect of stent placement, however, no methods have been developed to overcome this problem. In this study, we combined high-throughput sequencing and proteomics technologies to explore the genetic and protein markers associated with benign hyperplasia caused by restenosis after esophageal stent placement.
A previous study reported that restenosis after percutaneous intervention is characterized by growth factor release, platelet aggregation, inflammatory cell infiltration, extracellular matrix remodeling medial, and smooth muscle and endothelial cell proliferation and migration (Marx et al., 2011). VEGF is a growth factor that induces the proliferation and migration of vascular endothelial cells (Leung et al., 1990). Additionally, Luttun et al. (2002) reported that VEGF may promote the development of in-stent restenosis via proinflammatory effects. A recent study showed that VEGF was upregulated in a group of patients who developed in-stent restenosis (Katsaros et al., 2013). In our study, VEGFA, a member of the VEGF growth factor family, was upregulated in hyperplasia tissues compared to normal tissues. Shu et al. (2014) suggested that VEGFA stimulates endothelial cell proliferation. Furthermore, higher VEGFA levels after percutaneous coronary intervention was reported to be associated with restenosis (Katsaros et al., 2013). Therefore, VEGFA may be a key marker of benign hyperplasia-induced restenosis.
In this study, MAOB, SDR16C5 and FOSL1 were found to be involved in oxidation-reduction associated functions, such as GO:0055114∼oxidation-reduction process (MAOB, and SDR16C5), GO:0016491∼oxidoreductase activity (MAOB), and GO:0042542∼response to hydrogen peroxide (FOSL1). Specifically, MAOB and SDR16C5 were predicted in both the transcriptome and proteomics data and presented positive correlations in mRNA and protein expression. It has been suggested that restenosis is a variable combination of de novo proliferative and remodeling processes with neoplastic features, as well as homeostatic repair of the vessel wall (Libby and Tanaka, 1997). Therefore, vessel injury repair may be a key determinant of restenosis. Stone and Collins (2002) have reported that a low concentration of hydrogen peroxide stimulates the proliferation and migration of endothelial cells. Additionally, oxidation-reduction process plays a prominent role in tissue injury and vascular cell signaling, which is involved repairing vessel injury (Azevedo et al., 2000). Therefore, MAOB, SDR16C5, and FOSL1 may play key roles in esophageal restenosis involving oxidation-reduction processes.
In the constructed lncRNA-mRNA network, RP11-58O9.2 regulated the largest number of target genes. Additionally, RP11-667F14.1 regulated more than 20 targets. Interestingly, FOSL1 was a common target of the two lncRNAs, suggesting that RP11-58O9.2 and RP11-667F14.1 play significant roles in hyperplastic tissue development by regulating FOSL1. Functional analysis showed that RP11-58O9.2 is involved in the IL-17 signaling pathway. Interleukin (IL)-17 may stimulate several types of cells to secrete multiple proinflammatory mediators. Local production of IL-17 may cause site-specific influx and activation of inflammatory cells (Fossiez et al., 1998). Importantly, studies have supported a key role for inflammatory cells in the restenosis process (Welt and Rogers, 2002). Additionally, RP11-58O9.2 and RP11-667F14.1 were significantly enriched in the pathway of HTLV-I infection. A previous study has investigated the correlation between HTLV-1 and esophageal squamous cell carcinoma (Mirsadraee et al., 2007), but no correlation is found. In this study, we did not test HTLV-1 in patients. Thus, the role of HTLV-1 infection in esophageal cancer needed to be further investigated. Taken together, we speculated that stent restenosis induced by hyperplasia may be modulated via the regulatory role of RP11-58O9.2 and RP11-667F14.1 in FOSL1 expression as well as the IL-17 signaling pathway.
Furthermore, both RP11-288A5.2 and CTD-2350J17.1 regulated MAOB with the top two lower adjusted p values. Specifically, the expression of RP11-288A5.2 was verified. As described above, MAOB was enriched in functions associated with oxidation-reduction process. Additionally, this protein was involved in the GO:0032496∼response to lipopolysaccharide (LPS). LPS is a large molecule consisting of a lipid and polysaccharide, which acts as an endotoxin to elicit strong immune responses in animals. Moreover, LPS induces extracellular matrix degradation and stimulates the production of various cytokines (Aota et al., 2006). Forrester et al. (1991) suggested that there were three phases in the restenosis process, including an inflammatory phase, cellular proliferation phase, and remodeling of extracellular matrix protein synthesis phase, which indicates an important role for extracellular matrix remodeling in restenosis. Additionally, the extracellular matrix is the basis for lesion growth. The aortic hyperplasia is related to extracellular matrix deposition (Dao et al., 2001). Therefore, RP11-288A5.2 and CTD-2350J17.1 may be associated with restenosis by participating in extracellular matrix remodeling. The expression and role of CTD-2350J17.1 in benign hyperplasia-induced restenosis requires further analysis.
Besides, the pathway analysis showed that DE proteins in hyperplasia tissues compared with normal tissues in patients with esophageal cancer were significantly enriched in the biosynthesis of antibiotics pathway. A previous report suggested that the biosynthesis of antibiotics and other secondary metabolites was controlled by inorganic phosphate (Martín, 2004). The alterations in carbohydrate metabolism are present in endometrial hyperplasia and endometrial carcinoma patients (Benjamin and Casper, 1966). The level of inorganic phosphate in blood plasma is related with glucose metabolism underlying glucose use. The level of phosphate has been considered as an index of peripheral use of glucose. In addition, the global gene analysis indicated the antibiotic biosynthetic pathways in Streptomyces (Huang et al., 2001). In the present study, after sequencing, the data of each sample were subjected to comparative analysis and the results showed that all the data were reliable, which suggested that there was no bacterial contamination in the process of experiments. Thus, we suggested that the dysregulation of biosynthesis of antibiotics pathway may be related with the glucose metabolism in the hyperplasia tissues.
In conclusion, we combined transcriptome and proteomics data to investigate the critical genes/proteins associated with benign hyperplasia-induced restenosis in patients with esophageal cancer. DE VEGFA, FOSL1, MAOB, SDR16C5, RP11-58O9.2, RP11-667F14.1, and RP11-288A5.2 in hyperplastic tissues may serve as genetic targets for preventing stent restenosis in esophageal cancer. However, the sample size used in this study was a little small, so we will collect more samples to confirm our results in the future study.
Materials and Methods
Patients and Samples
From April to July in 2017, five patients (Supplementary Table 1) with esophageal cancer admitted to our hospital were enrolled in the study. These patients were subjected to 125I particle esophagus stent placement for palliation of dysphagia due to esophagus cancer and presented with tissue hyperplasia around the perforation of the stent several months after stent placement. Five pairs of hyperplastic tissues and adjacent non-hyperplastic tissues (normal tissues) were collected during surgery, among which four pairs were used for lncRNA sequencing and all five pairs were used for proteomics. Our study was approved by the ethics committee of our hospital. All patients provided informed consent before the experiments.
Total RNA Extraction and RNA Sequencing
Total RNA was extracted from four pairs of hyperplastic tissues and normal tissues using TRIzol reagent (Takara, Shiga, Japan) according to the manufacturer’s instructions. The quality and concentration of RNA samples were, respectively, determined with a NanoDrop spectrophotometer (Wilmington, DE, United States) and Qubit 2.0 Fluorometer (Life Technologies, Carlsbad, CA, United States). The quality of RNA samples is shown in Supplementary Table 2. RNA integrity was detected with an Agilent Bioanalyzer 2100 (Agilent Technologies, Santa Clara, CA, United States). Ribosomal RNA was removed from total RNA samples by using a Ribo-zero rRNA Removal Kit (EPICENTRE, Madison, WI, United States). Strand-specific libraries were constructed by the dUTP method using the NEB Next Ultra Directional RNA Library Prep Kit for Illumina (NEB, Ipswich, MA, United States). The libraries were sequenced on an Illumina HiSeq 2500 platform with 150-base pair single-end reads.
Quality Control and Reference Genome Alignment
Trimmomatic (version 3.6) (Bolger et al., 2014) tool was used for quality control of raw reads. Unreliable bases and low-quality reads were removed to obtain clean reads. The clean reads were mapped to the human genome (GRCh38.p7, GENCODE) (Harrow et al., 2012) using TopHat2 (version 2.1.0) (Trapnell et al., 2009) and the lncRNA and mRNA information was obtained.
The sequencing data are deposited in the NCBI Sequence Read Archive (SRA) database with the accession number PRJNA544132.
Analysis of Gene Expression Levels and Differentially Expressed (DE) Genes
The gene expression level was determined by estimating the reads located in genomic regions or gene exon regions. Based on the human genome annotation information in the GENCODE database, the count of reads mapped to the genes was obtained using HTSeq (version 0.6.1p2) (Anders et al., 2015), which was then normalized using the counts per million method. Additionally, genes with a CMP value of <0.1 in at least three samples were defined as low expression abundance genes. The obtained genes were divided into lncRNA and mRNA according to the gene type in the annotation information.
Differential expression analysis for lncRNAs and mRNAs was performed using likelihood ratio tests in edgeR of R (Lun et al., 2016). DE lncRNAs and mRNAs between paired hyperplastic tissues and normal tissues were analyzed. Moreover, RNAs with low expression abundance were deleted before DE analysis. A |logFC (fold change)| > 1 and p value <0.05 were used as thresholds of DE analysis.
Functional Enrichment Analysis of DE mRNAs
The DE mRNAs were subjected to Gene Ontology (GO) function and Kyoto Encyclopedia of Genes and Genomes (KEGG) pathway analyses by using the DAVID (version 6.8) online tool (Huang et al., 2008). The significantly enriched GO terms and pathways were selected with the thresholds of a count ≥2 and p value <0.05.
Protein-Protein Interaction (PPI) Network Analysis
The PPIs of DE mRNAs were analyzed using the online tool STRING (Szklarczyk et al., 2015). Required confidence (combined score) > 0.4 was selected as the threshold of PPI. Next, the network based on the PPI was constructed using Cytoscape (Shannon et al., 2003), and topological properties [degree centrality (Opsahl et al., 2010), betweenness centrality (Cukierski and Foran, 2008), and closeness centrality (Du et al., 2015)] of the network were analyzed using CytoNCA (Tang et al., 2015) in Cytoscape to identify hub nodes in the PPI network.
LncRNA-mRNA Interaction Network Analysis
The correlations between the obtained DE lncRNAs and mRNAs were analyzed by calculating the Pearson correlation coefficients (Pearson, 2006). The p values were adjusted using the Benjamini and Hochberg (1995) method. An adjusted p value <0.01 indicated a correlation between DE lncRNAs and mRNAs and the mRNAs were considered as potential target genes of lncRNAs. Finally, the lncRNA-target gene regulatory network was constructed using Cytoscape software (Shannon et al., 2003).
Function Analysis of lncRNAs
The functions of DE lncRNAs were predicted through GO and KEGG analyses of their target genes. In this study, lncRNAs with ≥15 targets were subjected to cellular component (CC), molecular function (MF), biological process (BP), and pathway prediction using clusterProfiler (Yu et al., 2012) with an adjusted p value <0.05.
The GO function (BP) similarity between lncRNA was determined using Resnik method [Resnik method (Poesio, 1999) and Wang method (Wang et al., 2007)] provided by GOSemSim (Yu et al., 2010). Resnik method is an information content-based method depending on the frequencies of the two GO terms involved and that of their closest common ancestor term in a specific corpus of GO annotations; the Wang method is a graph-based method that uses the topology of the GO graph structure to compute semantic similarity.
miRNAs Prediction and Competitive Endogenous RNA (ceRNA) Network Construction
Based on the lncRNA-mRNA interactions, we predicted the miRNAs that regulated the mRNAs using TargetScan_microRNA_2017 in Enrichr (Chen et al., 2013). The miRNA-mRNA regulatory pair with a p value <0.01 was selected. Next, the interactions between the predicted miRNAs and obtained lncRNAs were predicted using miRanda (Enright et al., 2003). If there was a binding site between an miRNA and obtained lncRNA, we considered that there was a regulatory interaction between these factors. Based on the miRNA-lncRNA, miRNA-mRNA, and lncRNA-mRNA interactions, a ceRNA network was constructed using Cytoscape software.
TMT Quantitative Proteomics
Proteins between five pairs of hyperplastic tissues and normal tissues were analyzed by tandem mass tag technology. Briefly, protein was extracted from five pairs of tissues using RIPA lysis buffer (Beyotime Biotechnology, Shanghai, China) and quantified using the BCATM Protein Assay Kit (Pierce, Madison, WI, United States). The quality of protein samples was evaluated by 12% sodium dodecyl sulfate-polyacrylamide gel electrophoresis. The qualified proteins were subjected to reductive alkylation. Then trypsin was added at an enzyme to protein ratio of 1:50 (w/w) and incubated at 37°C overnight. Following that the peptides were dissolved in 0.5 M tetraethyl-ammonium bromide and then labeled with TMT. The five samples in each group were pooled and primarily separated with the RP-C18 column, followed by liquid chromatography coupled with tandem mass spectrometry (LC-MS/MS) analysis. Liquid chromatography separation was carried out using a reversed-phase column (75 μm × 25 cm; Thermo, United States). The columns were connected to an EASY-n LC 1200 system (Thermo, United States). Total 5 μl of sample was loaded onto the column with starting mobile phase of 2% ACN and 0.1% formic acid, followed by 80% ACN with 0.1% formic acid for 120 min. The flow rate was held at 300 nL/min. Mass spectra were acquired on a Q-Exactive (Thermo, United States) mass spectrometer in a data-dependent manner. Peptide fragmentation was performed via higher-energy collision dissociation with a resolution of 70,000 followed by 35,000, and the exclusion duration was 18 s. The scan range ranged from 350 to 1300 m/z.
Protein Identification and Quantification
LC-MS/MS data were analyzed using Proteome DiscovererTM Software 2.1 interfaced with UniProt uniprot-proteome-UP000005640-Homosapiens database (The UniProt Consortium, 2017)1 at 20170912. In order to avoid precursor ion interference, the trypsin was added at an enzyme to protein ratio of 1:50 (w/w) and incubated at 37°C overnight. The polypeptide samples were re-dissolved in UPLC loading buffer and separated by high-performance liquid chromatography with C18 reverse phase column. Total 71591 human protein sequences in FASTA format were searched. The searched parameters included two maximal missed cleavages, fixed modifications [Carbamidomethyl (C), TMT 6plex(K), TMT 6plex (N-Terminus)], variable modifications [Oxidation(M), Acetyl (Protein N-Terminus)], Mass tolerance for precursor ions (20 ppm), Mass tolerance for fragment ions (0.02 Da). Percolator node within Proteome Discoverer were used to calculate the false discovery rates (FDRs) for Peptide-spectrum matches (PSMs). PSMs were filtered by 7 minimal peptide length, mass accuracy (∼2.5 ppm) and matching scores to achieve 1% protein FDR.
All the peptide sequences and proteins identification were listed in the Supplementary Files 1, 2. The mass spectrometry proteomics data have been deposited to the ProteomeXchange Consortium via the PRIDE (Perez-Riverol et al., 2018) partner repository with the dataset identifier PXD014242.
DE Protein Identification and Bioinformatics Analysis
The quantitative data of protein abundance in the two groups of matched samples were normalized with loess method (Cleveland et al., 1992; Linton, 2018) and then analyzed by paired sample t-test to screen for DE proteins. Proteins with p value <0.05 were considered differentially expressed.
DE proteins were then subjected to PPI analysis using STRING, as well as GO and KEGG pathway analyses with DAVID 6.8 as described above.
Conjoint Analysis of Proteome and Transcriptome Data
Based on the obtained proteome and transcriptome data, we selected the common proteins/genes and calculated the correlation between the proteins and genes based on expression levels using the Pearson correlation coefficient. Results with p < 0.05 were considered reliable. Additionally, we performed VENN analysis for the DE proteins and mRNAs to screen for overlapped DE proteins/mRNAs. The Pearson correlation between the overlapped DE proteins and mRNAs in expression abundance was also analyzed.
RT-PCR Validation
Total RNA was isolated from hyperplastic tissues and normal tissues (50–100 mg) using the TRIzol method. After quality and purity evaluation, the reverse transcription reaction was performed with 0.5 μg RNA by using PrimeScript RT Master Mix (RR036A, Takara). Real-time PCR analysis was performed in a reaction volume of 20 μL (10 μL SYBR Premix EX Taq (2×), 1 μL forward primer, 1 μL reverse primer, and 8 μL cDNA). PCR amplification was performed as follows: 50°C for 3 min, 95°C for 3 min, and 40 cycles of 95°C for 10 s and 60°C for 30 s. The expression levels of RP11-288A5.2, RP11-58O9.2, RP11-667F14.1, CTD-2350J17.1, monoamine oxidase B (MAOB), short chain dehydrogenase/reductase family 16C member 5 (SDR16C5), vascular endothelial growth factor A (VEGFA), and FOS like 1, AP-1 transcription factor subunit (FOSL1) were detected. Glyceraldehyde 3-phosphate dehydrogenase (GAPDH) was used as an internal control. The primer sequences are listed in Table 4.
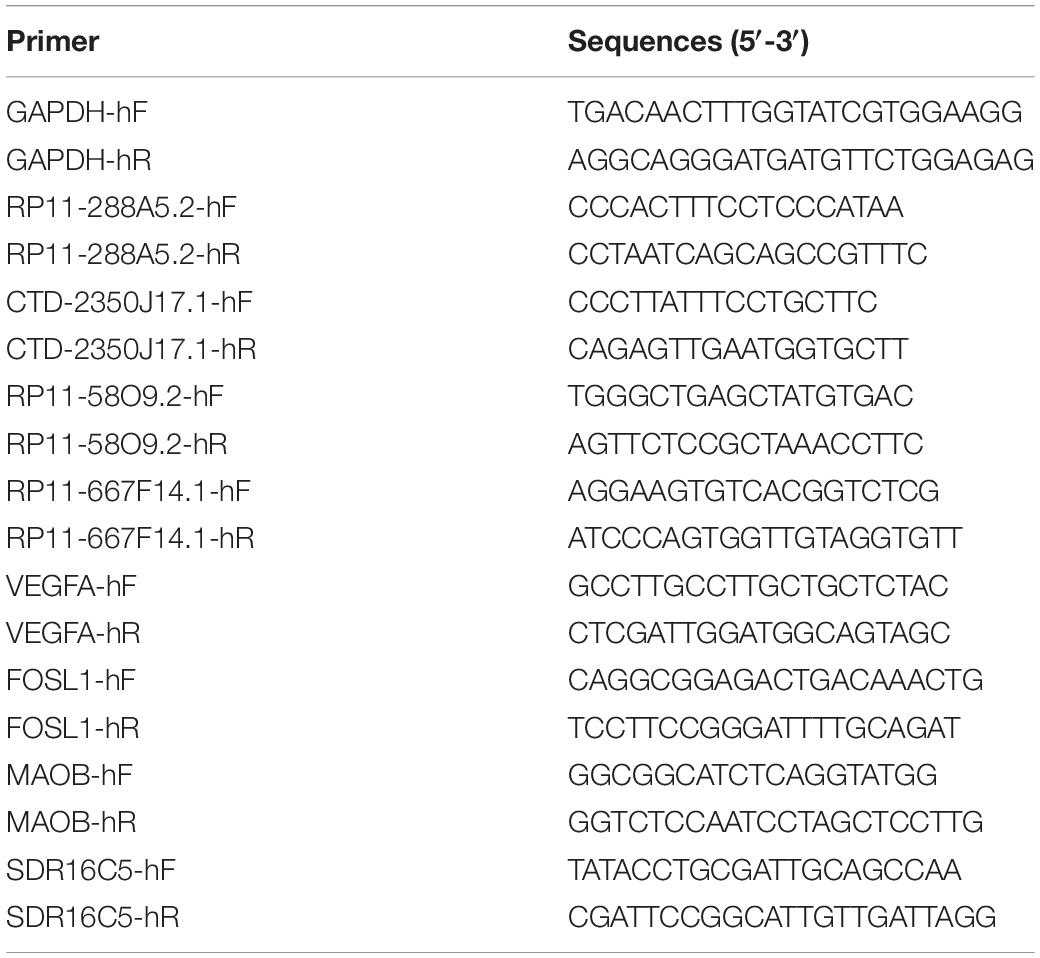
Table 4. Primer sequence for RT-PCR.
Western Blotting Validation
Proteins were extracted from hyperplastic tissues and normal tissues with RIPA buffer (P0013B; Beyotime, Shanghai, China). Protein concentrations were measured with BCA method using a BCA protein assay kit (PL212989; Thermo, United States). After denaturation, protein samples were subjected to SDS-PAGE and blotted onto polyvinylidene fluoride membranes (IPVH00010; Millipore, United States). Non-specific binding sites were blocked with 5% skim milk. Following washing with 1 × PBS-T (1000 mL 1 × PBS + 1 mL Tween-20) for three times, the membranes were incubated with primary antibodies [1:1000; MAOB (ab88510; Abcam, United States) and SDR16C5 (Cat #PA5-31421; Thermo)], or β-actin (Sc-47778; Santa Cruz Biotechnology, United States) overnight at 4°C, followed by washing six times in 1 × PBS-T. Then the membranes were incubated with horseradish peroxidase conjugated secondary antibodies [anti-mouse (1:5000) or anti-rabbit IgG (1:10000)] for 2 h at 37°C and washed for six times with 1 × PBS-T. Finally, the membranes were visualized by ECL detection (Millipore, United States).
Statistical Analysis
The experiments of RT-PCR and western blotting were repeated three times. Data were shown as mean ± standard deviation (SD). GraphPad Prism 5 (San Diego, CA) was used to analyze the data from this study. Student’s t-test was used for comparison. Statistical significance was considered for p-value >0.05.
Data Availability Statement
The sequencing data have been deposited in the NCBI Sequence Read Archive (SRA) database with the accession number PRJNA544132. The mass spectrometry proteomics data have been deposited to the ProteomeXchange Consortium via the PRIDE partner repository with the dataset identifier PXD014242.
Ethics Statement
The studies involving human participants were reviewed and approved by Ethics Committee of Tongren Hospital, Shanghai Jiao Tong University School of Medicine. The patients/participants provided their written informed consent to participate in this study. Written informed consent was obtained from the individual(s) for the publication of any potentially identifiable images or data included in this article.
Author Contributions
AM and XZ: conception and design of the research, obtaining funding, and revision of manuscript for important intellectual content. MS, SW, and XY: acquisition of data. MS, BL, and XY: analysis and interpretation of data. MS and XY: statistical analysis. LW and SS: drafting the manuscript. All authors read and approved the final manuscript.
Funding
This work was supported by National Natural Science Foundation of China: Research of mechanism of GPX mediated oxidative stress in benign esophagus hyperplasia caused by stents loaded with 125-iodine seeds (Program No. 81571775).
Conflict of Interest
The authors declare that the research was conducted in the absence of any commercial or financial relationships that could be construed as a potential conflict of interest.
Supplementary Material
The Supplementary Material for this article can be found online at: https://www.frontiersin.org/articles/10.3389/fgene.2020.563954/full#supplementary-material
Supplementary Table 1 | Patient information.
Supplementary Table 2 | The quality of RNA samples.
Supplementary Table 3 | DE mRNAs, lncRNAs and proteins.
Supplementary File 1 | Proteins identification.
Supplementary File 2 | The peptide sequences.
Footnotes
References
Albiero, R., Adamian, M., Kobayashi, N., Amato, A., Vaghetti, M., Di, M. C., et al. (2000). Short- and intermediate-term results of (32)P radioactive beta-emitting stent implantation in patients with coronary artery disease: the Milan Dose-response study. Circulation 101, 18–26. doi: 10.1161/01.cir.101.1.18
Anders, S., Pyl, P. T., and Huber, W. (2015). HTSeq–a Python framework to work with high-throughput sequencing data. Bioinformatics 31, 166–169. doi: 10.1093/bioinformatics/btu638
Aota, Y., An, H. S., Imai, Y., Thonar, E. J., Muehleman, C., and Masuda, K. (2006). Comparison of cellular response in bovine intervertebral disc cells and articular chondrocytes: effects of lipopolysaccharide on proteoglycan metabolism. Cell Tissue Res. 326, 787–793. doi: 10.1007/s00441-006-0225-1
Azevedo, L. C. P., Pedro, M. D. A., Souza, L. C., de Souza, H. P., Janiszewski, M., da Luz, P. L., et al. (2000). Oxidative stress as a signaling mechanism of the vascular response to injuryThe redox hypothesis of restenosis. Cardiovasc. Res. 47, 436–445. doi: 10.1016/s0008-6363(00)00091-2
Benjamin, F., and Casper, D. J. (1966). Alterations in carbohydrate metabolism induced by progesterone in cases of endometrial carcinoma and hyperplasia. Am. J. Obstetr. Gynecol. 94, 991–996. doi: 10.1016/0002-9378(66)90038-x
Benjamini, Y., and Hochberg, Y. (1995). Controlling the false discovery rate: a practical and powerful approach to multiple testing. J. R. Stat. Soc. 57, 289–300. doi: 10.1111/j.2517-6161.1995.tb02031.x
Bolger, A. M., Lohse, M., and Usadel, B. (2014). Trimmomatic: a flexible trimmer for Illumina sequence data. Bioinformatics 30, 2114–2120. doi: 10.1093/bioinformatics/btu170
Chen, E. Y., Tan, C. M., Yan, K., Duan, Q., Wang, Z., Meirelles, G. V., et al. (2013). Enrichr: interactive and collaborative HTML5 gene list enrichment analysis tool. BMC Bioinform. 14:128. doi: 10.1186/1471-2105-14-128
Cleveland, W., Grosse, E., and Shyu, W. (1992). “Local regression models,” in Chapter 8 in Statistical Models in S, eds J. M. Chambers and T. J. Hastie (Pacific Grove, CA: Wadsworth & Brooks/Cole), 608.
Cukierski, W. J., and Foran, D. J. (2008). “Using betweenness centrality to identify manifold shortcuts,” in Proceedings of the IEEE International Conference on Data Mining Workshops, (Pisa: IEEE), 949–958.
Dao, H. H., Lemay, J., De, C. J., Deblois, D., and Moreau, P. (2001). Norepinephrine-induced aortic hyperplasia and extracellular matrix deposition are endothelin-dependent. J. Hypertens. 19, 1965–1973. doi: 10.1097/00004872-200111000-00006
Du, Y., Gao, C., Chen, X., Hu, Y., Sadiq, R., and Deng, Y. (2015). A new closeness centrality measure via effective distance in complex networks. Chaos 25, 440–442.
Enright, A. J., John, B., Gaul, U., Tuschl, T., Sander, C., and Marks, D. S. (2003). MicroRNA targets in Drosophila. Genome Biol. 5, 2003–2005.
Ferlay, J., Steliarovafoucher, E., Lortettieulent, J., Rosso, S., Coebergh, J. W., Comber, H., et al. (2013). Cancer incidence and mortality patterns in Europe: estimates for 40 countries in 2012. Eur. J. Cancer 49, 1374–1403. doi: 10.1016/j.ejca.2012.12.027
Forrester, J. S., Fishbein, M., Helfant, R., and Fagin, J. (1991). A paradigm for restenosis based on cell biology: clues for the development of new preventive therapies. J. Am. College Cardiol. 17, 758–769. doi: 10.1016/s0735-1097(10)80196-2
Fossiez, F., Banchereau, J., Murray, R., Van, K. C., Garrone, P., and Lebecque, S. (1998). Interleukin-17. Int. Rev. Immunol. 16, 541–551.
Gan, Z., Jing, J., Zhu, G., Qin, Y., Teng, G., and Guo, J. (2015). Preventive effects of 125I seeds on benign restenosis following esophageal stent implantation in a dog model. Mol. Med. Rep. 11, 3382–3390. doi: 10.3892/mmr.2014.3130
Guo, J. H., Teng, G. J., Zhu, G. Y., He, S. C., Deng, G., and He, J. (2007). Self-expandable stent loaded with 125I seeds: feasibility and safety in a rabbit model. Eur. J. Radiol. 61, 356–361. doi: 10.1016/j.ejrad.2006.10.003
Harrow, J., Frankish, A., Gonzalez, J. M., Tapanari, E., Diekhans, M., Kokocinski, F., et al. (2012). GENCODE: the reference human genome annotation for The ENCODE Project. Genome Res. 22, 1760–1774. doi: 10.1101/gr.135350.111
Hindy, P., Hong, J., Lam-Tsai, Y., and Gress, F. (2012). A comprehensive review of esophageal stents. Gastroenterol. Hepatol. 8, 526.
Huang, D. W., Sherman, B. T., and Lempicki, R. A. (2008). Systematic and integrative analysis of large gene lists using DAVID bioinformatics resources. Nat. Protoc. 4:44. doi: 10.1038/nprot.2008.211
Huang, J., Lih, C.-J., Pan, K.-H., and Cohen, S. N. (2001). Global analysis of growth phase responsive gene expression and regulation of antibiotic biosynthetic pathways in Streptomyces coelicolor using DNA microarrays. Genes Dev. 15, 3183–3192. doi: 10.1101/gad.943401
John, M., Shroff, S., Farb, A., and Virmani, R. (2001). Local arterial responses to 32P beta-emitting stents. Cardiovasc. Radiat. Med. 2:143. doi: 10.1016/s1522-1865(01)00077-4
Katsaros, K. M., Kastl, S. P., Krychtiuk, K. A., Hutter, R., Zorn, G., Maurer, G., et al. (2013). An increase of VEGF plasma levels is associated with restenosis of drug-eluting stents. EuroIntervention 10, 224–230. doi: 10.4244/eijv10i2a36
Leung, D. W., Cachianes, G., Kuang, W. J., Goeddel, D. V., and Ferrara, N. (1990). Vascular endothelial growth factor is a secreted angiogenic mitogen. Science 246, 1306–1309. doi: 10.1126/science.2479986
Libby, P., and Tanaka, H. (1997). The molecular bases of restenosis. Prog. Cardiovasc. Dis. 40:97. doi: 10.1016/s0033-0620(97)80002-3
Linton, O. B. (2018). “Local regression models,” in The New Palgrave Dictionary of Economics, (London: Palgrave Macmillan), 7960–7964. doi: 10.1057/978-1-349-95189-5_1929
Lun, A. T., Chen, Y., and Smyth, G. K. (2016). It’s DE-licious: A Recipe for Differential Expression Analyses of RNA-seq Experiments Using Quasi-Likelihood Methods in edgeR. New York, NY: Springer.
Luttun, A., Tjwa, M., Moons, L., Wu, Y., Angelillo-Scherrer, A., Liao, F., et al. (2002). Revascularization of ischemic tissues by PlGF treatment, and inhibition of tumor angiogenesis, arthritis and atherosclerosis by anti-Flt1. Nat. Med. 8, 831–840. doi: 10.1038/nm731
Mariette, C., De Botton, M. L., and Piessen, G. (2012). Surgery in esophageal and gastric cancer patients: what is the role for nutrition support in your daily practice? Ann. Surg. Oncol. 19, 2128–2134. doi: 10.1245/s10434-012-2225-6
Mariette, C., Piessen, G., and Triboulet, J. P. (2007). Therapeutic strategies in oesophageal carcinoma: role of surgery and other modalities. Lancet Oncol. 8, 545–553. doi: 10.1016/s1470-2045(07)70172-9
Martín, J. F. (2004). Phosphate control of the biosynthesis of antibiotics and other secondary metabolites is mediated by the PhoR-PhoP system: an unfinished story. J. bacteriol. 186, 5197–5201. doi: 10.1128/jb.186.16.5197-5201.2004
Marx, S. O., Totary-Jain, H., and Marks, A. R. (2011). Vascular smooth muscle cell proliferation in restenosis. Circ. Cardiovasc. Interv. 4, 104–111.
Marzocchi, A., Marrozzini, C., Piovaccari, G., Fattori, R., Castriota, F., D’Anniballe, G., et al. (1991). [Restenosis after coronary angioplasty: its pathogenesis and prevention]. Cardiologia 36:309.
Mirsadraee, M., Kalantari, M., Saffari, A., and Mahmoudi, M. (2007). Association of HTLV1 infection and esophageal squamous cell carcinoma. J. Gastrointest. Cancer 38, 15–18. doi: 10.1007/s12029-008-9008-0
Opsahl, T., Agneessens, F., and Skvoretz, J. (2010). Node centrality in weighted networks: generalizing degree and shortest paths. Soc. Netw. 32, 245–251. doi: 10.1016/j.socnet.2010.03.006
Pearson, K. (2006). Note on regression and inheritance in the case of two parents. Proc. R. Soc. Lond. 58, 240–242. doi: 10.1098/rspl.1895.0041
Pennathur, A., Gibson, M. K., Jobe, B. A., and Luketich, J. D. (2013). Oesophageal carcinoma. Lancet 381, 400–412.
Perez-Riverol, Y., Csordas, A., Bai, J., Bernal-Llinares, M., Hewapathirana, S., Kundu, D. J., et al. (2018). The PRIDE database and related tools and resources in 2019: improving support for quantification data. Nucleic Acids Res. 47, D442–D450.
Poesio, M. (1999). Semantic similarity in a taxonomy: an information-based measure and its application to problems of ambiguity in natural language. J. Artif. Intell. Res. 11, 95—-130.
Shannon, P., Markiel, A., Ozier, O., Baliga, N. S., Wang, J. T., Ramage, D., et al. (2003). Cytoscape: a software environment for integrated models of biomolecular interaction networks. Genome Res. 13:2498. doi: 10.1101/gr.1239303
Sharma, P., and Kozarek, R. (2010). Role of esophageal stents in benign and malignant diseases. Am. J. Gastroenterol. 105, 258–273. doi: 10.1038/ajg.2009.684
Sharma, V., Mahantshetty, U., Dinshaw, K. A., Deshpande, R., and Sharma, S. (2002). Palliation of advanced/recurrent esophageal carcinoma with high-dose-rate brachytherapy. Int. J. Radiat. Oncol. Biol. Phys. 52, 310–315. doi: 10.1016/s0360-3016(01)01822-3
Shu, T., Kenshi, H., Chiaki, N., Hao, H., Kenji, S., Masa-Aki, K., et al. (2014). Vascular endothelial growth factor–bound stents: application of in situ capture technology of circulating endothelial progenitor cells in porcine coronary model. J. Interv. Cardiol. 27:63.
Stone, J. R., and Collins, T. (2002). The role of hydrogen peroxide in endothelial proliferative responses. Endothelium 9, 231–238. doi: 10.1080/10623320214733
Szklarczyk, D., Franceschini, A., Wyder, S., Forslund, K., Heller, D., Huertacepas, J., et al. (2015). STRING v10: protein–protein interaction networks, integrated over the tree of life. Nucleic Acids Res. 43, D447.
Tang, Y., Li, M., Wang, J., Pan, Y., and Wu, F. X. (2015). CytoNCA: a cytoscape plugin for centrality analysis and evaluation of protein interaction networks. Biosystems 127, 67–72. doi: 10.1016/j.biosystems.2014.11.005
The UniProt Consortium (2017). UniProt: the universal protein knowledgebase. Nucleic Acids Res. 45, D158–D169. doi: 10.1093/nar/gkw1099
Trapnell, C., Pachter, L., and Salzberg, S. L. (2009). TopHat: discovering splice junctions with RNA-Seq. Bioinformatics 25, 1105–1111. doi: 10.1093/bioinformatics/btp120
van Heel, N. C., Haringsma, J., Spaander, M. C., Bruno, M. J., and Kuipers, E. J. (2010a). Esophageal stents for the relief of malignant dysphagia due to extrinsic compression. Endoscopy 42:536. doi: 10.1055/s-0029-1244123
Van Heel, N. C., Haringsma, J., Spaander, M. C., Didden, P., Bruno, M. J., and Kuipers, E. J. (2010b). Esophageal stents for the palliation of malignant dysphagia and fistula recurrence after esophagectomy. Gastrointest. Endosc. 72, 249–254. doi: 10.1016/j.gie.2010.01.070
Wang, J. Z., Du, Z., Payattakool, R., Yu, P. S., and Chen, C. F. (2007). A new method to measure the semantic similarity of GO terms. Bioinformatics 23, 1274–1281. doi: 10.1093/bioinformatics/btm087
Welt, F. G. P., and Rogers, C. (2002). Inflammation and restenosis in the stent era. Arterioscler. Thromb. Vasc. Biol. 22, 1769–1776. doi: 10.1161/01.atv.0000037100.44766.5b
Yu, G., Li, F., Qin, Y., Bo, X., Wu, Y., and Wang, S. (2010). GOSemSim: an R package for measuring semantic similarity among GO terms and gene products. Bioinformatics 26, 976–978. doi: 10.1093/bioinformatics/btq064
Keywords: esophageal cancer, esophageal stents placement, esophagus restenosis, sequencing, proteomics
Citation: Weng L, Shen S, Wu S, Yin X, Liu B, Shang M, Zou X and Mao A (2020) Identification of Critical Genes and Proteins for Stent Restenosis Induced by Esophageal Benign Hyperplasia in Esophageal Cancer. Front. Genet. 11:563954. doi: 10.3389/fgene.2020.563954
Received: 06 July 2020; Accepted: 09 November 2020;
Published: 17 December 2020.
Edited by:
Mohammadreza Hajjari, Shahid Chamran University of Ahvaz, IranReviewed by:
Alireza Shahryari, Helmholtz Zentrum München, GermanyNirmal Rajasekaran, Seoul National University, South Korea
Copyright © 2020 Weng, Shen, Wu, Yin, Liu, Shang, Zou and Mao. This is an open-access article distributed under the terms of the Creative Commons Attribution License (CC BY). The use, distribution or reproduction in other forums is permitted, provided the original author(s) and the copyright owner(s) are credited and that the original publication in this journal is cited, in accordance with accepted academic practice. No use, distribution or reproduction is permitted which does not comply with these terms.
*Correspondence: Aiwu Mao, bWFvYWl3dUBzaHRyaG9zcGl0YWwuY29t; Xiaoping Zou, MTM3NzA3NzE2NjFAMTYzLmNvbQ==
†These authors have contributed equally to this work and share first authorship